
Survey design for coal-scale 3D-PS seismic re ection Survey design for coal...Survey design for...
27
Survey design for coal-scale 3D-PS seismic reflection Shaun Strong *† and Steve Hearn *† ABSTRACT Survey design for converted-wave (PS) reflection is more complicated than for standard P-wave surveys, due to ray-path asymmetry and increased possibility of phase distor- tion. Coal-scale PS surveys (depth < 300m) require particular consideration, partly due to the particular physical properties of the target (low density and low velocity). Finite-difference modeling provides a pragmatic evaluation of the likely distortion due to inclusion of post-critical reflections. If the offset range is carefully chosen then it may be possible to incorporate high-amplitude post-critical reflections without seri- ously degrading the resolution in the stack. Offsets of up to three times target depth may in some cases be usable, with appropriate quality control at the data-processing stage. This means that the PS survey design may need to handle ray paths which are highly asymmetrical, and which are very sensitive to assumed velocities. A 3D-PS design case study is included for a particular coal survey with target in the depth range 85-140m. The objectives were acceptable fold balance between bins, and relatively smooth distribution of offset and azimuth within bins. These parameters are relatively robust for the P-wave design, but much more sensitive for the case of PS. Reduction of the source density is more acceptable than reduction of receiver density, particularly in terms of offset-azimuth distribution. This is a fortuitous observation in that it improves the economics of a dynamite source, which is desirable for high- resolution coal-mine planning. The final survey design necessarily allowed for logistical and economic considerations, which implied some technical compromise. Nevertheless good fold, offset and azimuth distributions were achieved across the survey area, yielding a dataset suitable for mean- ingful analysis of P and S azimuthal anisotropy. INTRODUCTION Motivation for this study The integration of conventional P-wave and PS-wave (converted, or C-wave) reflection can improve the characterization of the subsurface. This has been demonstrated for particu- lar petroleum-scale targets, both offshore (e.g. Barkved et al., 1999; Hanson et al., 1999) and onshore (e.g. Dufour et al., 2002). More recently it has been demonstrated that the advantages of integrated P/PS reflection may also apply for shallower targets (e.g. coal, coal seam gas (CSG), hard-rock). In particular, integrated 2D P and PS imagery has been * Velseis Pty Ltd, Brisbane, Australia † School of Earth Sciences, University of Queensland, Brisbane, Australia.
Transcript of Survey design for coal-scale 3D-PS seismic re ection Survey design for coal...Survey design for...
Survey design for coal-scale 3D-PS seismic reflection
Shaun Strong∗ † and Steve Hearn∗ †
ABSTRACT
Survey design for converted-wave (PS) reflection is more complicated than for standardP-wave surveys, due to ray-path asymmetry and increased possibility of phase distor-tion. Coal-scale PS surveys (depth < 300m) require particular consideration, partlydue to the particular physical properties of the target (low density and low velocity).Finite-difference modeling provides a pragmatic evaluation of the likely distortion dueto inclusion of post-critical reflections. If the offset range is carefully chosen then itmay be possible to incorporate high-amplitude post-critical reflections without seri-ously degrading the resolution in the stack. Offsets of up to three times target depthmay in some cases be usable, with appropriate quality control at the data-processingstage. This means that the PS survey design may need to handle ray paths which arehighly asymmetrical, and which are very sensitive to assumed velocities.A 3D-PS design case study is included for a particular coal survey with target in thedepth range 85-140m. The objectives were acceptable fold balance between bins, andrelatively smooth distribution of offset and azimuth within bins. These parameters arerelatively robust for the P-wave design, but much more sensitive for the case of PS.Reduction of the source density is more acceptable than reduction of receiver density,particularly in terms of offset-azimuth distribution. This is a fortuitous observationin that it improves the economics of a dynamite source, which is desirable for high-resolution coal-mine planning.The final survey design necessarily allowed for logistical and economic considerations,which implied some technical compromise. Nevertheless good fold, offset and azimuthdistributions were achieved across the survey area, yielding a dataset suitable for mean-ingful analysis of P and S azimuthal anisotropy.
INTRODUCTION
Motivation for this study
The integration of conventional P-wave and PS-wave (converted, or C-wave) reflection canimprove the characterization of the subsurface. This has been demonstrated for particu-lar petroleum-scale targets, both offshore (e.g. Barkved et al., 1999; Hanson et al., 1999)and onshore (e.g. Dufour et al., 2002). More recently it has been demonstrated that theadvantages of integrated P/PS reflection may also apply for shallower targets (e.g. coal,coal seam gas (CSG), hard-rock). In particular, integrated 2D P and PS imagery has been
∗ Velseis Pty Ltd, Brisbane, Australia† School of Earth Sciences, University of Queensland, Brisbane, Australia.
Strong & Hearn 2 3D-PS Survey Design
shown to yield improved detection of fault structures and geometries, and provide superiorimaging of the top-of-coal for shallow open-cut targets (e.g. Hearn, 2004; Hendrick, 2006).
For P-wave coal exploration, 3D surveys are now relatively common, providing detailedspatial interpretation critical for mine planning. As a logical extension to these trends, arecent trial (Strong and Hearn, 2011) has examined the feasibility and value of a 3D-3Csurvey over a coal target previously explored using 2D P-wave seismic and limited drilling.The overall objectives were to optimize 3D acquisition and processing of integrated P andPS data at the coal scale. The project included an in-depth investigation of survey design.The main purpose of this paper is to examine particular aspects of PS survey design whichmay require special attention in the case of coal-scale surveys (0-300m).
3D Survey Design
The broad aim of seismic survey design is to ensure that source and receiver configurationsare optimized to give the best possible interpretation of the structures at the target horizonswhile satisfying logistical and economic constraints.
The subject of correct 3D survey design has been widely researched, particularly in thecontext of P-wave reflection (e.g. Liner and Underwood, 1999; Cooper, 2004). An evenfold distribution is desirable in all reflection surveys. In 3D surveys an even distributionof azimuths and offsets within any bin is desirable particularly where azimuthal analysis isenvisaged, including processing via common offset vector (COV) approaches (Vermeer, 1998;Cary, 1999). A poor distribution can result in reduced resolution, suboptimal processing,and noise artefacts including acquisition footprint. These may have a significant impacton the quality of the prestack migration (Gardner and Canning, 1994; Chemingui andBiondi, 1996). This can lead to misinterpretation of geological structures and can maskreal azimuthal anisotropy. Migration algorithms have been developed which aim to reducethe impact of design irregularities in P-wave surveys (Canning and Gardner, 1998; Joussetet al., 2000).
3D-PS Survey Design
3D PS-wave survey design has received literature attention over the past 15 years (e.g.Vermeer, 1999; Musser, 2005; Meier, 2009; Zuleta and Lawton, 2011). PS survey designis intrinsically more complex than P-wave design. Firstly the asymmetric nature of PSreflections leads to more irregular illumination.
In the context of PS data processing, the precise location of the asymmetric reflectionpoint is very important for trace binning. Originally, PS processing included simplisticasymptotic binning (e.g. Eaton and Lawton, 1992) or various depth-dependent approaches(e.g. Tessmer and Behle, 1988; Zhang and Robinson, 1992; Schneider Jr, 2002). Specializedalgorithms have been developed for converted-wave binning in situations where geology ismore complicated (e.g. anisotropy (Thompson, 1999), dipping reflectors (Guarın, 2005)).Unfortunately, the most precise binning approaches require velocity information which isoften unknown at the design stage.
As for P waves, specific PS-wave algorithms have been introduced which attempt to
Strong & Hearn 3 3D-PS Survey Design
minimize acquisition footprint arising during prestack migration (Lee et al., 2005; Vinjeet al., 2015; Wang and Wang, 2014). Despite the availability of such tools, it is neverthelessdesirable that PS surveys be designed with the aim of regular fold, offset and azimuth.
An additional difficulty in PS design is that the range of offsets that are usable forPS reflection may be restricted due to critical angle considerations (Garotta, 1999). Also,PS surveys are typically performed as an economical extension to a primary P-wave sur-vey. Therefore a further restriction in PS survey design is that there should be minimaldegradation in the associated P-wave data (Thomas and Neff, 2004).
Most previous analyses of PS survey design have focused mainly on conventional petroleum-scale exploration. In the following we examine aspects of PS design which are more specificto surveys at the coal scale.
OFFSET CONSIDERATIONS FOR COAL-SCALE PS DESIGN
In conventional P-wave seismic reflection a common rule of thumb is that maximum receiveroffset should be comparable to target depth (e.g. Stone, 1994). This avoids possible phasedistortions associated with post-critical reflections. For PS reflection, ray-path asymmetryimplies that ideally maximum offset needs to be even less than for P waves if such distortionsare to be avoided (Garotta, 1999).
One of the well-known problems of shallow seismic reflection is that noise events (e.g.surface waves, refractions) can often arrive in a similar time window to the target reflectionevents (e.g. Knapp and Steeples, 1986). It is typically necessary to increase minimum offsetto avoid such high-amplitude surface-related noise (Hunter et al., 1984). The temptation isto incorporate longer offsets than might be considered acceptable according to normal rulesof thumb. The viability of this approach can be examined via modeling exercises.
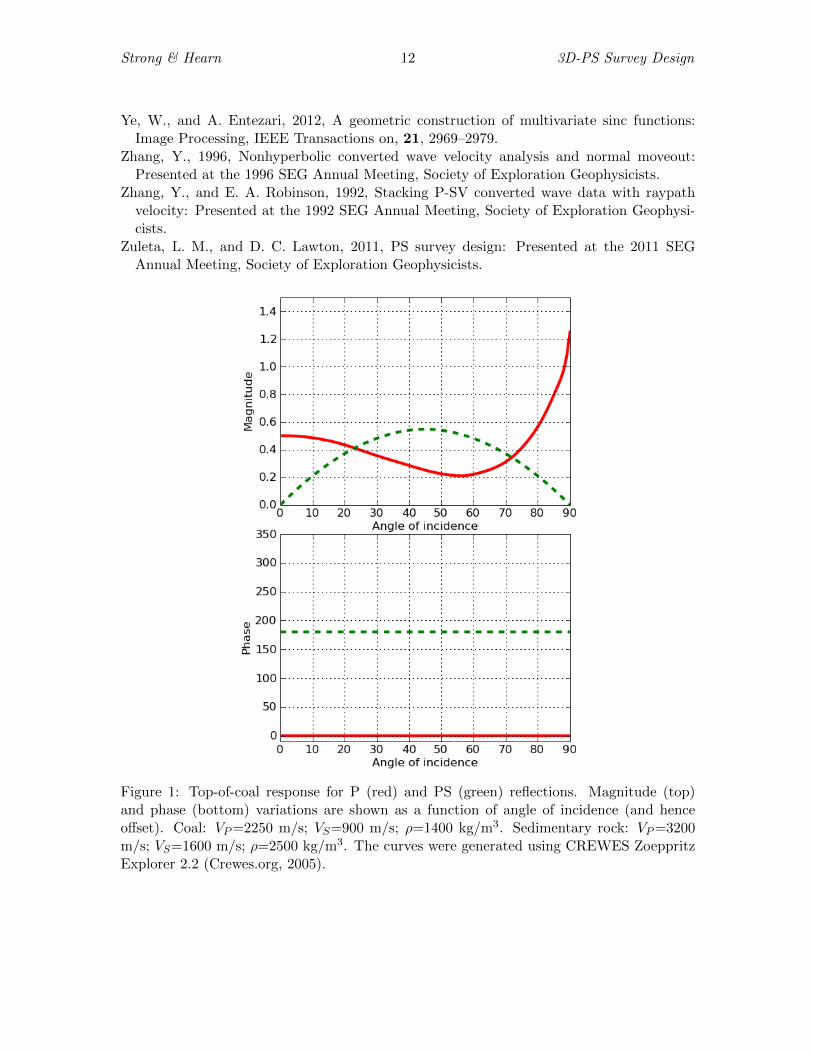
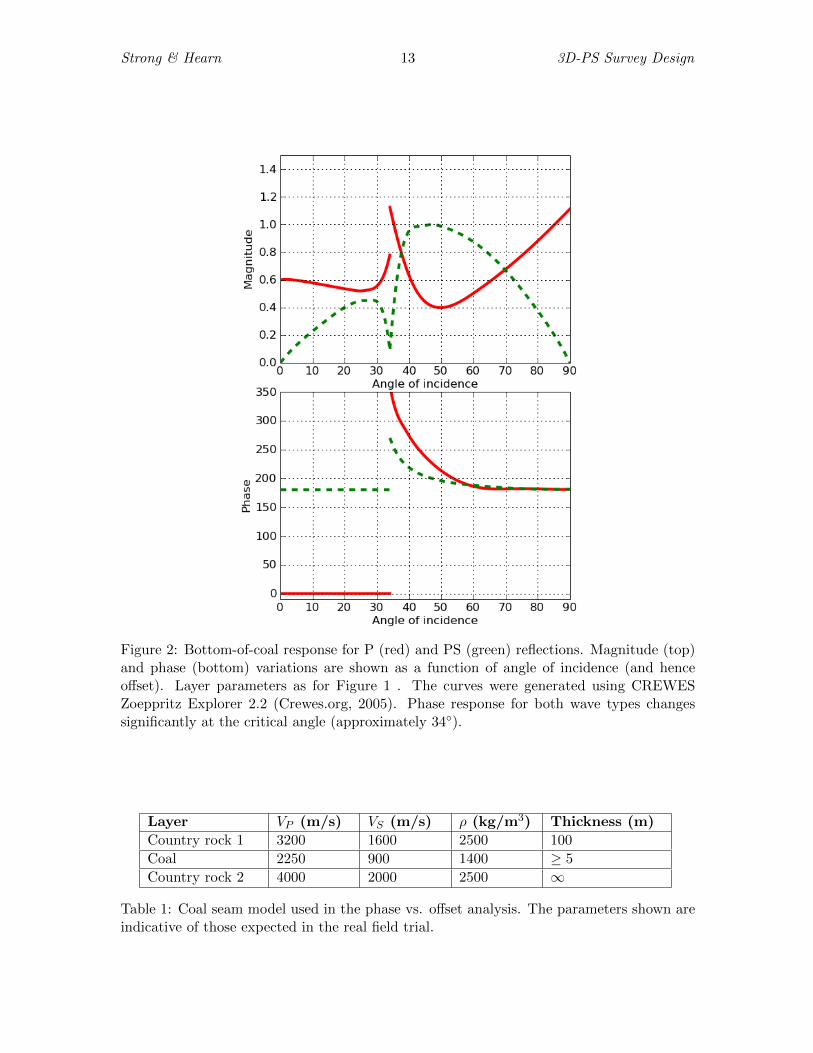
Figures 1 and 2 examine reflection behavior at the top and bottom of a typical coal seam.Consider first the P-wave reflection. Because the top of coal is an impedance decrease, theP-wave reflection has strong amplitude and constant phase over a wide range of incidenceangles (Figure 1, red curve). At the base of coal (Figure 2, red curve) the P-wave amplitudeis strong, and the phase is constant, for angles less than the critical angle. Of course, forincident angles greater than the critical angle, the phase behavior can change significantly.Based on this analysis, stacking of post-critical events would seem to be inadvisable.
Consider now the PS reflection (green curves in Figures 1 and 2). Amplitudes are lowat small angles, suggesting that larger incidence angles (longer offsets) may be required toachieve a reasonable signal-to-noise ratio. For example, the green curves on Figures 1 and 2show that the strongest PS reflections from the top and base of coal occur for angles > 20◦.However, as was observed with the P-wave reflection, the phase angle varies significantlyfor the base-coal reflection in this zone. Again, inclusion of longer offsets would appear tobe problematic.
The obvious approach to avoiding such phase problems is to follow the approach takenin petroleum-scale work, and limit the far offset such that the critical angle is not exceeded.This may, however, be difficult in practice. Consider a simple single-layer coal-seam modelwith parameters similar to those expected in our field trial (Table 1). Using ray-pathmodeling we have investigated the maximum allowable offset for seams of various thicknesses
Strong & Hearn 4 3D-PS Survey Design
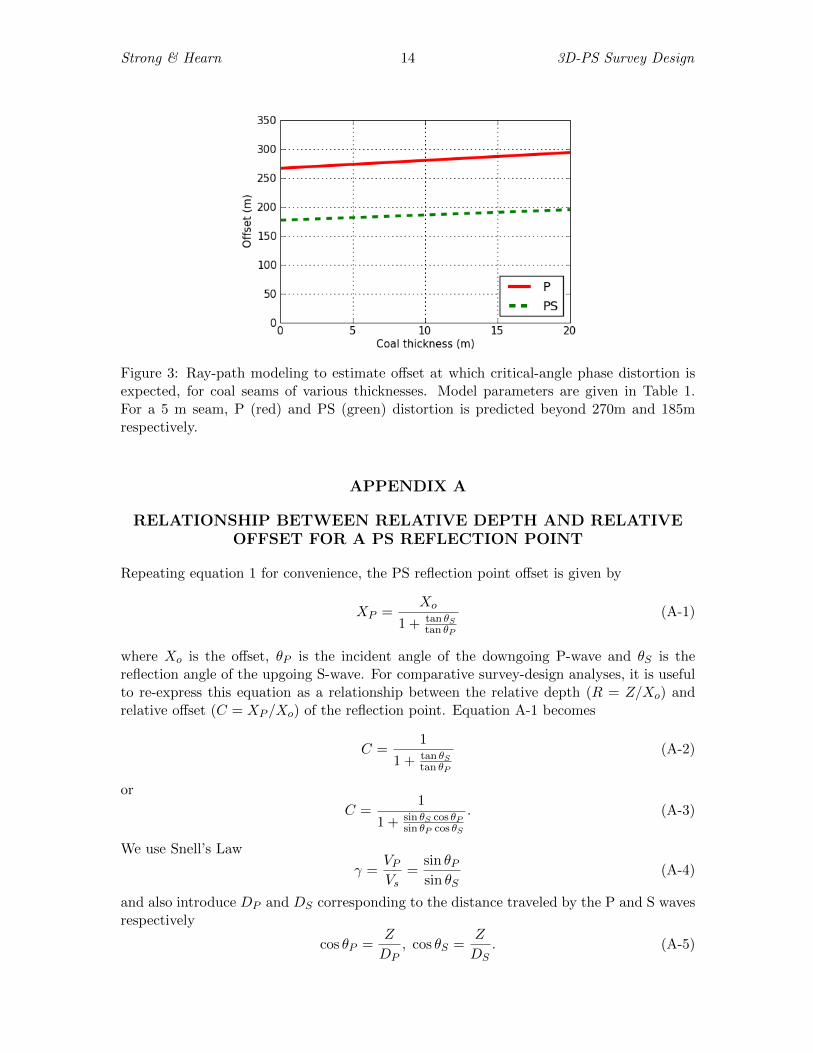
(Figure 3). For this model, the maximum usable offset for PS reflection is approximatelytwo-thirds that of P-wave reflection. This is consistent with the observations of Garotta(1999). For a 5m seam (corresponding to the expected thickness at the trial site) themaximum offsets would be 270m and 185m for P and PS reflections respectively. Basedon expected weathering in the survey area, offsets less than about 50m are likely to beunusable. Hence on this analysis, the usable offset range is quite limited, particularly forthe PS survey.
The ray-path modeling approach above provides a reasonable first indication of likelyphase/offset limits. However, in practice, meaningful analysis of coal-seam response re-quires more detailed consideration of the full package of events from the seam. This hasbeen demonstrated by Simmons Jr and Backus (1994), who used reflectivity modeling todetermine the character of the total reflection package for a thin coal seam. Their workfocused primarily on the zone within the critical angle.
In order to better understand the severity of phase distortion in our expected seampackage, we have used visco-elastic finite-difference modeling to build synthetic seismicrecords (e.g. Robertsson et al., 1994). This wave-equation method incorporates P andS wave properties in the model, providing for mode conversions, surface waves, and alsoanelastic attenuation.
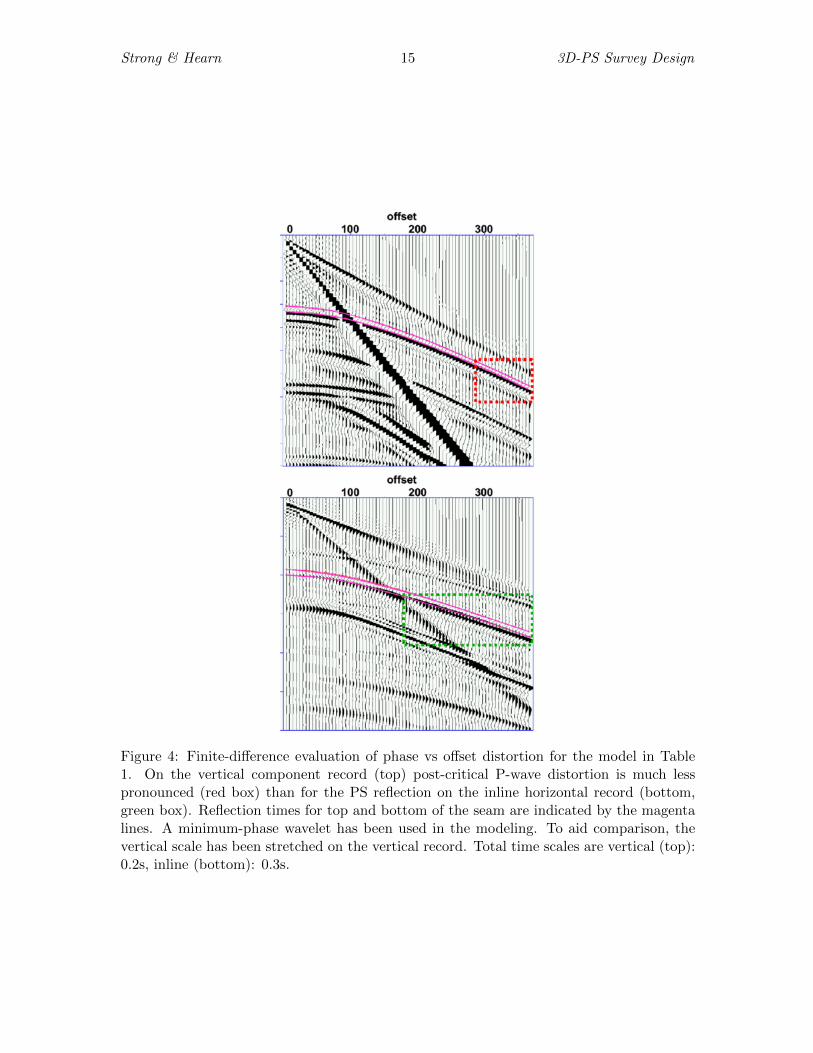
Figure 4 shows vertical and inline synthetic records corresponding to the geologicalmodel of Table 1, with a coal seam of thickness 5 m. The P-wave reflections are dominanton the vertical component. The energy of the reflection package is relatively consistent forall offsets. The red box indicates the P-wave offsets where the bottom-of-coal phase effectsare expected. Close examination indicates that the character of the wavelet within thebox is very similar to that of nearer offsets. This finite-difference analysis suggests that inpractice the base-coal distortion has less influence on the seam package than predicted bysimpler reflectivity modeling. This is consistent with field observations over a range of coalsurveys.
As expected, the PS reflections are dominant on the inline component. The amplitudeof the PS reflection increases with offset, having a significant portion of its energy beyondthe critical angle (inside the green box). It is apparent that the post-critical reflectionshave a lagged response compared to the pre-critical offsets. Stacking all offsets togetherwould result in a reduction in resolution of the final PS image. However, within the post-critical window the character is remarkably consistent. This suggests that post-criticalreflections may be able to be stacked with each other without losing too much resolution,and maintaining a good signal-to-noise ratio.
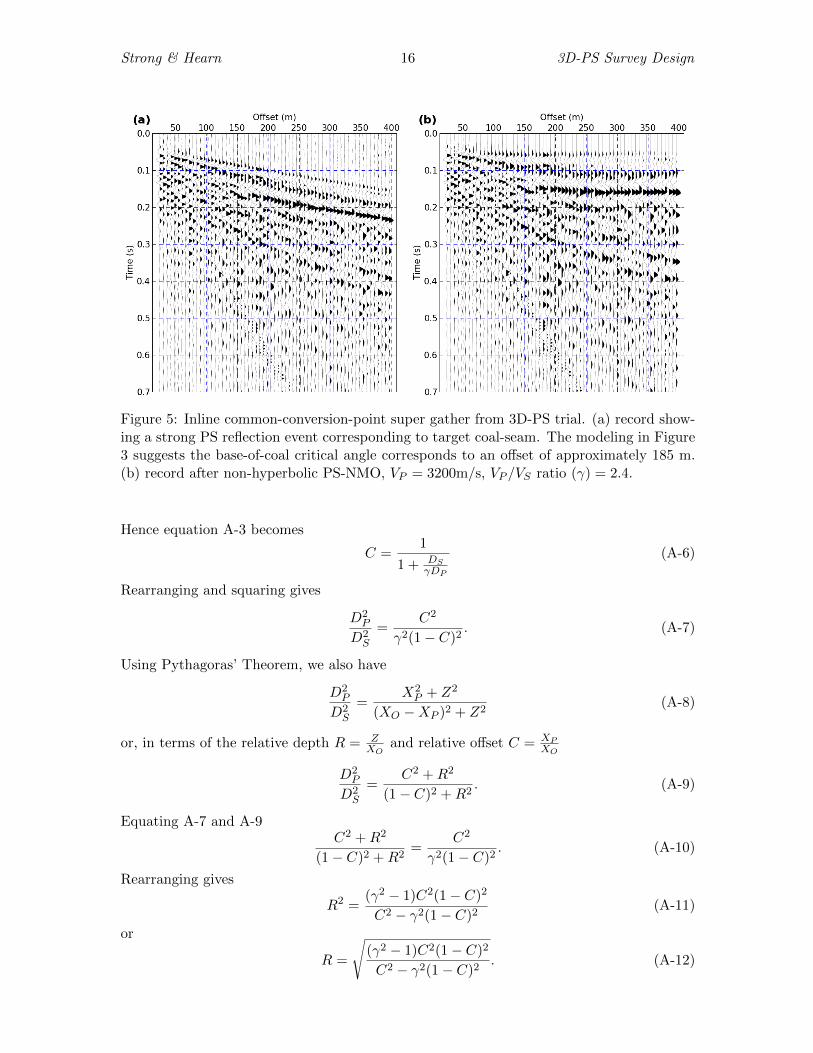
These modeling results tend to be supported by our real-data observations, both fromprevious 2D-PS surveys, and from the 3D-PS trial. Figure 5a shows a representativecommon-conversion-point supergather from the 3D-PS trial. It includes a strong PS eventcorresponding to our target coal seam at depth 100m. On the near offsets (< 150m) thisevent has been swamped by noise. Most of the usable PS energy occurs at offsets beyond thepredicted base-of-coal critical angle, consistent with modeling. While the data are generallynoisy, the PS event tends to have reasonably consistent character over a range of offsets.
Figure 5b shows that it is possible to achieve a reasonably flat PS event over a range ofoffsets (∼ 220 − 350m), using a standard non-hyperbolic PS-NMO correction (e.g. Zhang,1996). Note that further subtle resolution improvement can be obtained by using more
Strong & Hearn 5 3D-PS Survey Design
advanced PS-NMO algorithms (e.g. Strong and Hearn, 2012). These field observations addweight to the modeling results, and sugggest that PS events at offsets greater than thebottom-of-coal critical angle may be usable, provided the offset range is carefully chosen soas to maintain reasonably consistent character in the seam reflection package.
This fortuitous outcome is a result of the special physical properties of coal seams(low density and low velocity). We have reached similar conclusions when investigatingrelatively thin-seam scenarios in other locations. The general practical conclusion is thatfor typical coal exploration projects, the usable offset windows may be more generous thanfor petroleum-scale work. However, rigorous modeling is advised at the planning stage, aswell as careful quality control during data processing.
ASYMMETRY CONSIDERATIONS FOR COAL-SCALE PS DESIGN
The analysis in the preceding section suggests that due to the particular characteristics ofthe target, the maximum usable offset for coal surveys may be greater (in relative terms)than for conventional reflection surveys. In particular, for PS surveys, modeling of the typeillustrated above indicates that it may be possible to use offsets of order three times targetdepth. This in turn has implications for expected illumination patterns.
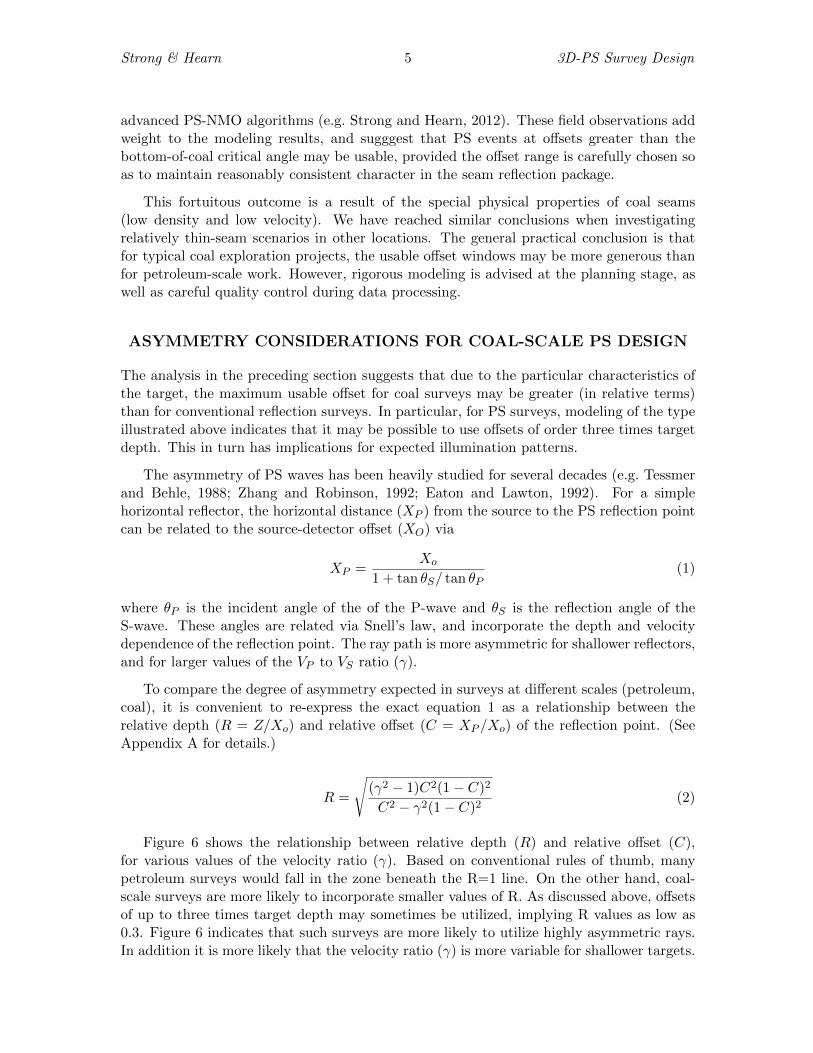
The asymmetry of PS waves has been heavily studied for several decades (e.g. Tessmerand Behle, 1988; Zhang and Robinson, 1992; Eaton and Lawton, 1992). For a simplehorizontal reflector, the horizontal distance (XP ) from the source to the PS reflection pointcan be related to the source-detector offset (XO) via
XP =Xo
1 + tan θS/ tan θP(1)
where θP is the incident angle of the of the P-wave and θS is the reflection angle of theS-wave. These angles are related via Snell’s law, and incorporate the depth and velocitydependence of the reflection point. The ray path is more asymmetric for shallower reflectors,and for larger values of the VP to VS ratio (γ).
To compare the degree of asymmetry expected in surveys at different scales (petroleum,coal), it is convenient to re-express the exact equation 1 as a relationship between therelative depth (R = Z/Xo) and relative offset (C = XP /Xo) of the reflection point. (SeeAppendix A for details.)
R =
√(γ2 − 1)C2(1− C)2
C2 − γ2(1− C)2(2)
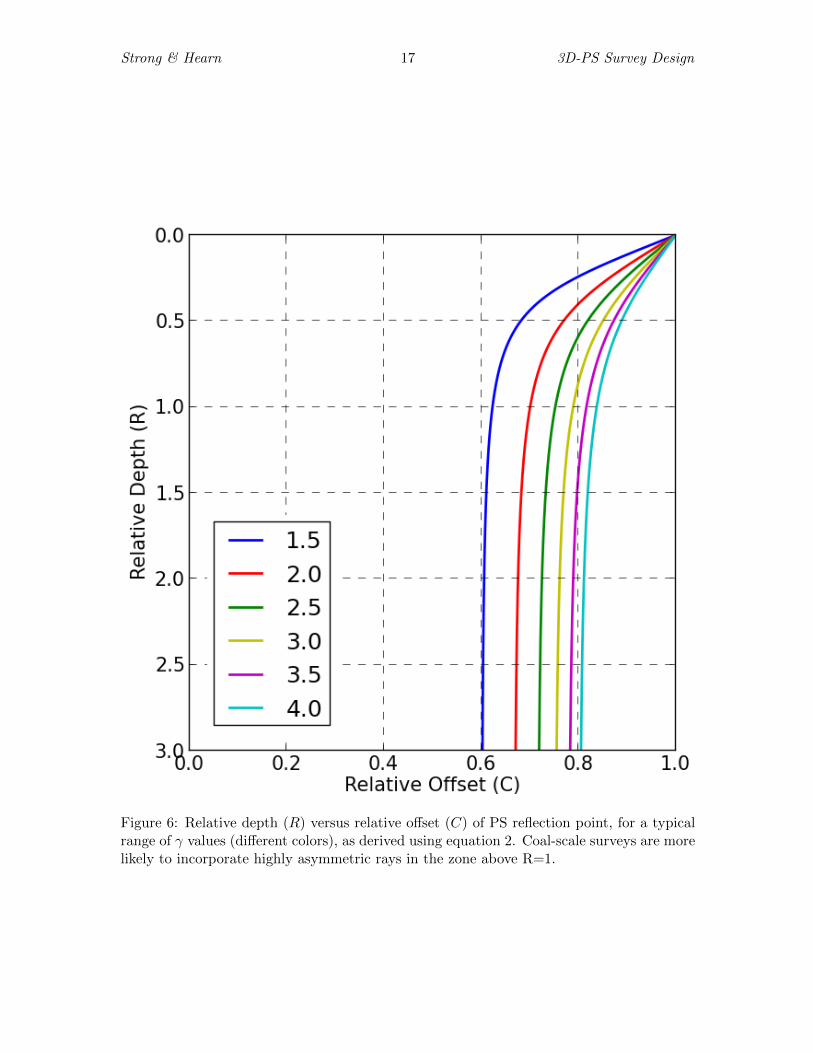
Figure 6 shows the relationship between relative depth (R) and relative offset (C),for various values of the velocity ratio (γ). Based on conventional rules of thumb, manypetroleum surveys would fall in the zone beneath the R=1 line. On the other hand, coal-scale surveys are more likely to incorporate smaller values of R. As discussed above, offsetsof up to three times target depth may sometimes be utilized, implying R values as low as0.3. Figure 6 indicates that such surveys are more likely to utilize highly asymmetric rays.In addition it is more likely that the velocity ratio (γ) is more variable for shallower targets.
Strong & Hearn 6 3D-PS Survey Design
Figure 6 illustrates that this is likely to introduce further variability and complexity intoPS ray-paths.
In Figure 6 the depth zone deeper than R=1 represents the area for which the horizontalreflection point is relatively constant. In this zone, the so-called asymptotic approximation(e.g. Eaton and Lawton, 1992; Hardage et al., 2011) might provide a usable estimate ofreflection point for the purposes of survey design. This might be acceptable for petroleum-scale surveys if very limited velocity information is available at the time of design. However,the preceding analysis suggests that for coal-scale surveys incorporating longer relativeoffsets, the design must be carried out using more precise depth-dependent reflection-pointestimators (e.g. Tessmer and Behle, 1988; Zhang and Robinson, 1992; Hoffmann, 2001). Iflimited velocity information is available, the implications of likely velocity ranges should beconsidered during the design process.
3D-PS SURVEY-DESIGN CASE STUDY
Overview of design methodology
One of the primary aims of our real data experiment was to explore possible azimuthalanisotropy in both P-wave and S-wave velocities, as an aid to better understanding thestress regime in the study area. Such information would be important at the mine-planningstage, for economic and safety reasons. It was therefore desirable to achieve a reasonablysmooth distributions of fold, offset and azimuth in both the P and PS designs.
The initial 3D-PS design process assumed a nominal target depth of 100m, based ona previous 2D P-wave survey. The effective velocity-ratio (γ) to the target is unknown,although 2D-3C experience in the region suggested a likely range of values. In practice,the design needed to be acceptable over the full extent of possible γ values. A PS surveysuch as this would generally be considered as an extension to a production P-wave 3Dsurvey. Hence, the design parameters needed to be broadly consistent with typical 3DP-wave surveys over similar targets.
In the results to follow the exact conversion point has been calculated (using equation2) based on an assumed target depth and velocity ratio. If perfect specular reflectionis assumed, the predicted patterns of fold, offset and azimuth exhibit a larger degree ofvariability, and sensitivity, than might be expected with real data (e.g. Eaton and Lawton,1992). The finite bandwidth of a real seismic wave can be incorporated into the designprocess by recognizing that each individual trace may contribute (in terms of fold, offset,azimuth) to multiple bins. This more accurately resembles the situation after migration-based processing. We follow the approach of Cary and Lawton (2003) who smear thetrace using a sinc smoothing function. The examples to follow use a related Lanczos filter,which in some cases may provide a more stable output (Ye and Entezari, 2012). Againfollowing Cary and Lawton (2003), we set the radius of the smoothing filter to the bin size.This implicitly assumes that the chosen bin size is appropriate to the expected horizontalresolution following migration.
In the present case, this approach appears reasonable based on the resolution following3D prestack migration, as suggested by Chen and Schuster (1999). We have related theradius of our smoothing filter to Chen and Schuster’s sinc-function radius (xi = ∆x/2). If
Strong & Hearn 7 3D-PS Survey Design
we assume a usable migration aperture of twice target depth, and dominant frequency oforder 100 Hz, a smoothing radius of 10-15m appears reasonable. This then provides a guidefor choosing bin sizes.
General design conclusions
The series of design examples to follow step through a range of possible geometries, startingwith theoretically ideal high-density designs and moving towards more practically feasibledesigns, including the final real-survey design. The starting scenario is a simple orthogonalgeometry, with sources on a 15m x 15m grid, and receivers also on a 15m x 15m grid. Westart with an assumed bin size of 7.5m x 7.5m, which might be considered natural for aP-wave survey.
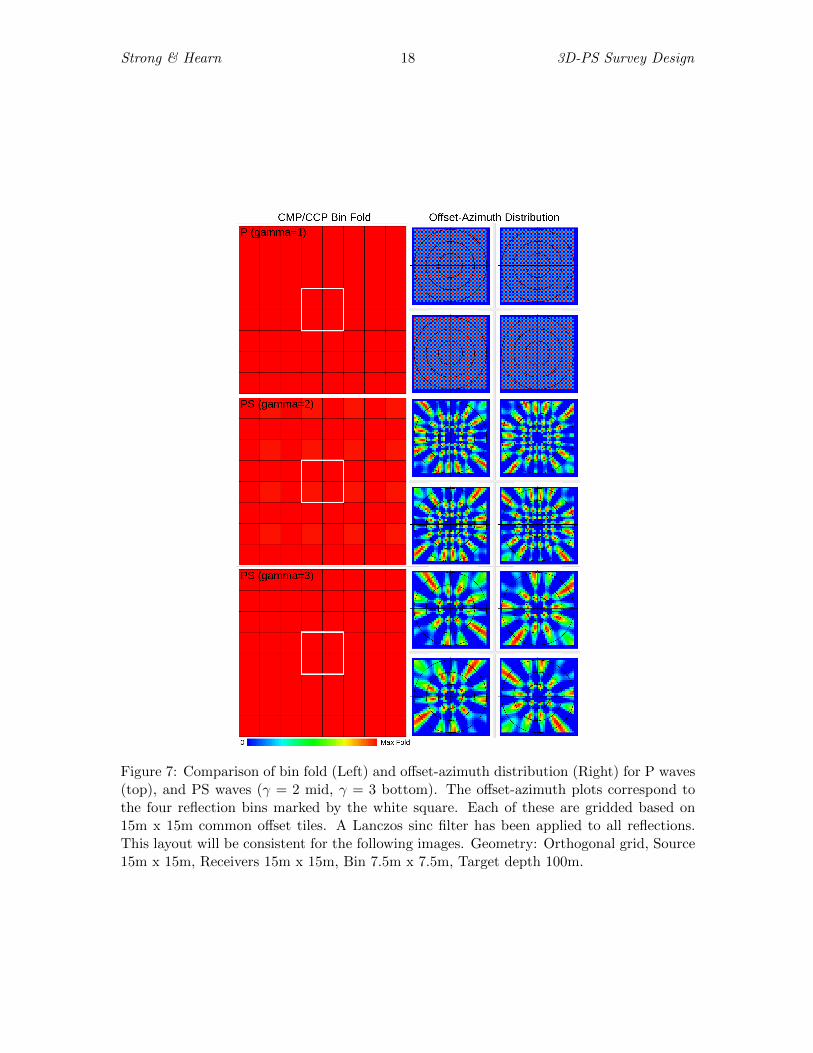
Figure 7 summarizes relative fold, offset and azimuth distributions for P and PS surveysfor this initial geometry. The figure layout (which is the same for subsequent plots) requiresexplanation. The left hand column shows fold distributions for a representative zone of 8 x8 bins. From top to bottom, the plots are for P-wave, PS-wave (γ = 2), PS-wave (γ = 3).The two PS plots are provided to illustrate how the distribution behaves over the most likelyrange of γ values. (As part of our full work-flow we have also monitored other γ values.)Alongside each fold plot are the offset-azimuth distributions for the central 4 bins (markedin white on the fold plot). Four bins are included to illustrate bin-to-bin variability in theseparameters. In the offset-azimuth plots, the maximum inline and crossline offsets are 300min all cases.
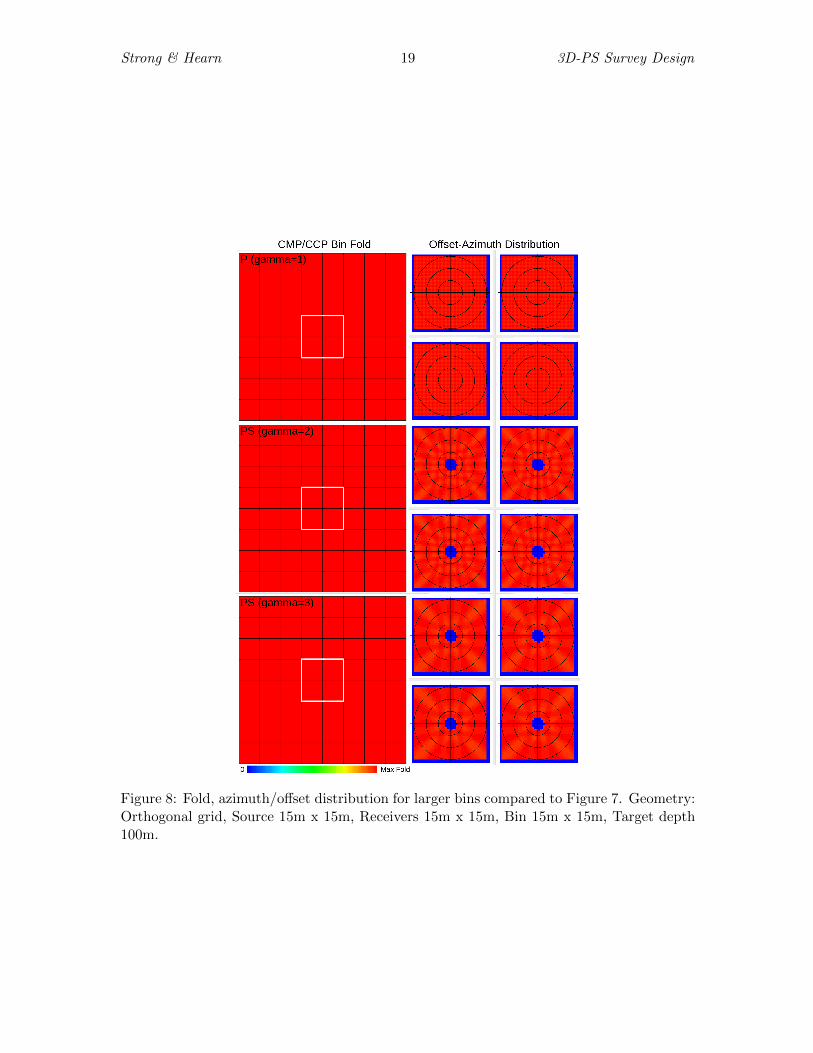
Figure 7 shows that, with this high-density design, the fold is very consistent for both Pand PS surveys. The offset-azimuth distribution is regular for P, but is much more variablefor PS. Figure 8 illustrates that the offset-azimuth distribution improves dramatically ifthe bin size is doubled, so that it matches the source and receiver grid size (15m). Thiscould then be considered as a theoretically ideal orthogonal grid for PS, with very regulardistributions of fold and offset-azimuth. In most practical cases, we will need to examinemore cost effective geometries. We will first examine reductions in either receiver densityor source density. To emphasize the effect we will make significant reductions in density.
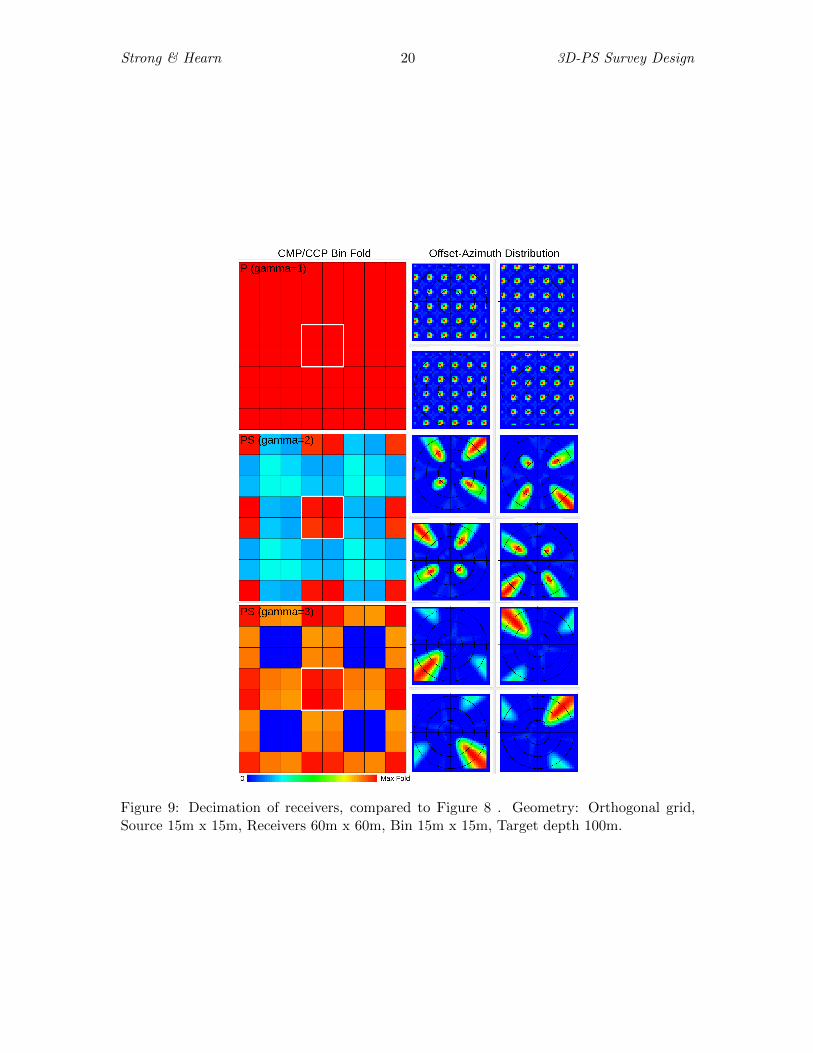
In cases where Vibroseis is planned, a natural approach might be to reduce the receiverdensity, while maintaining higher source density. Figure 9 considers the case where thereceiver grid is changed from 15m x 15m to 60m x 60m. Source density is left high at 15mx 15m. The P-wave design (top row) shows a very regular fold, and an even distributionof offset-azimuth. However, the PS results are much less acceptable, with relative fold andoffset-azimuth being very irregular. In addition, the PS distributions appear very sensitiveto the assumed value of γ.
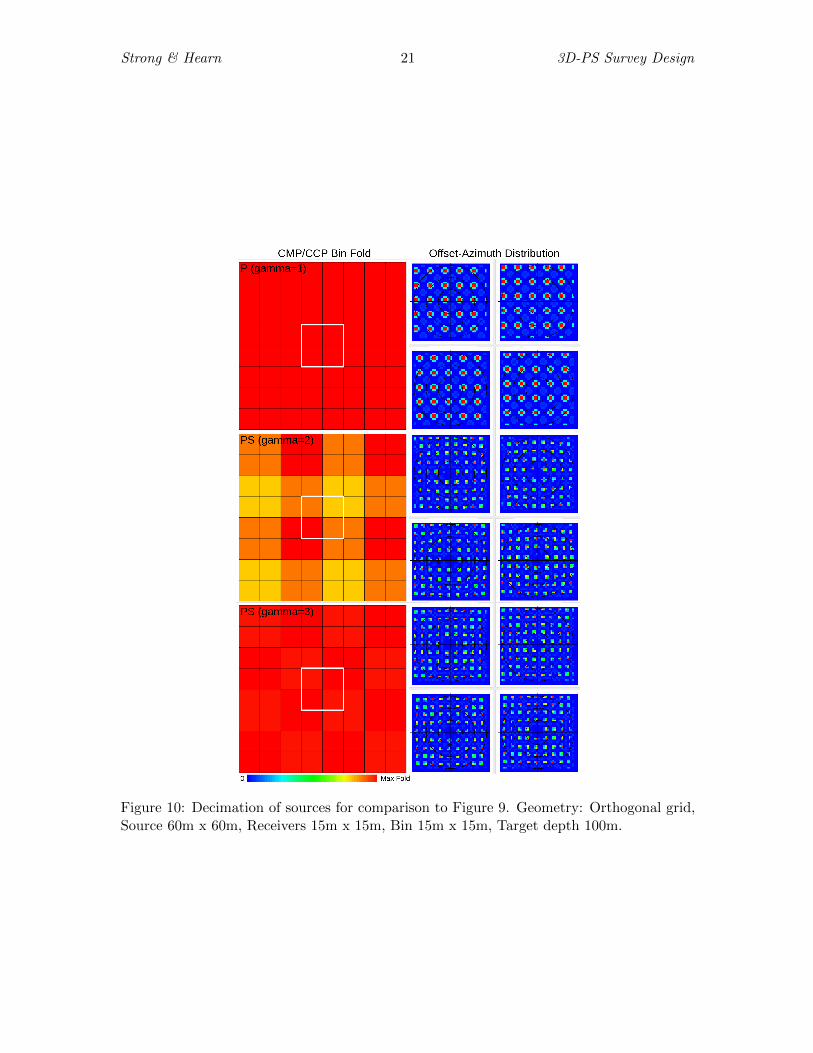
Figure 10 illustrates the opposite approach where the receiver density is kept high at15m x 15m, and the source grid is changed to 60m x 60m. Again, for P waves, relativefold is constant, and offset-azimuth shows a regular distribution. With this approach thePS results are much more acceptable. Fold is acceptably smooth, and the offset-azimuthdistribution is much improved compared to Figure 9. PS designs with reduced source effortwould be particularly attractive in cases where a dynamite source is considered. This isan important observation for 3D coal surveys, where high resolution is very valuable formine-planning purposes.

Strong & Hearn 8 3D-PS Survey Design
Final 3D-PS survey design
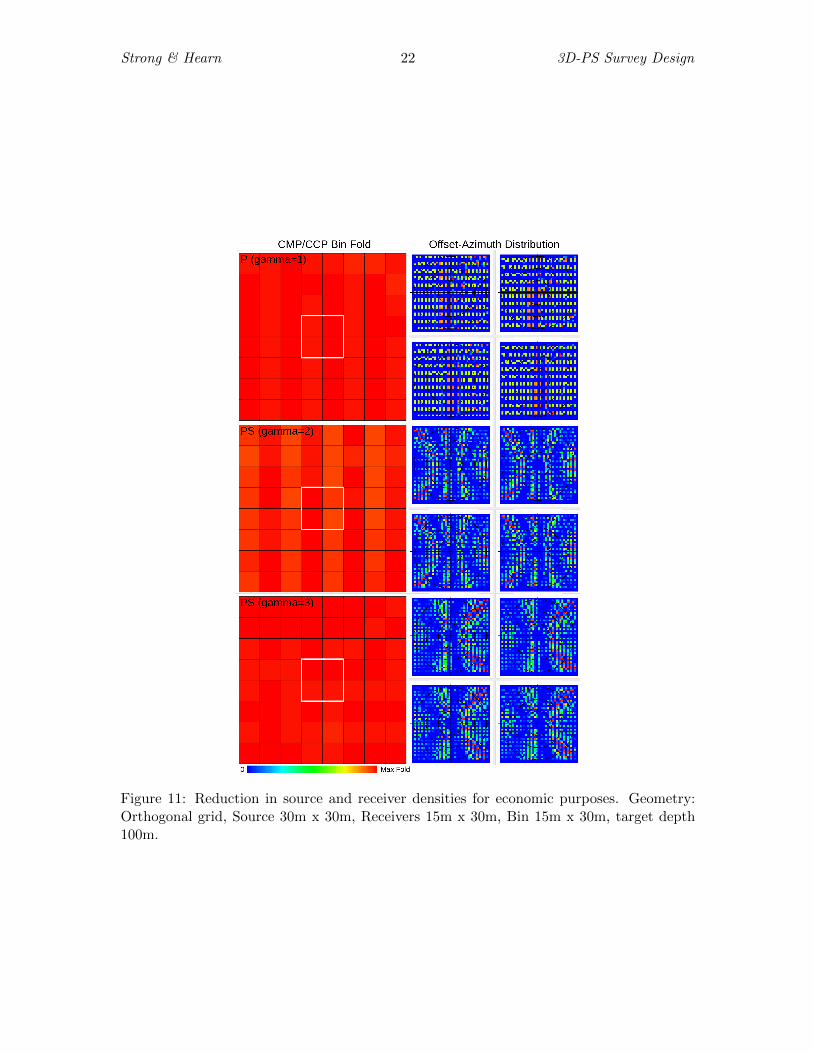
Unfortunately, a 15m x 15m receiver grid would not be economic for most coal-scale surveys.To achieve a final practical design, a variety of combinations were examined, with consid-eration of logistical and economic constraints. Figure 11 shows results for an orthogonaldesign with densities similar to the final design (source grid: 30m x 30m, receiver grid: 15mx 30m, bins: 15m x 30m). Fold is regular for P and PS. While offset-azimuth distributionis not as smooth as for the higher-density designs, it is acceptable.
It has been suggested that orthogonal designs may introduce a cyclic acquisition foot-print in fold images, and various methods have been proposed to reduce this problem. Theseinclude infield techniques such as staggered grids (e.g. Bland et al., 1998), brick patterns(e.g. Lawton, 1994), non-orthogonal geometries (e.g. Cordsen et al., 2000), and randomjitter (Hardage et al., 2011); and post-acquisition processing techniques that interpolateeven bin distributions (e.g. flexi bin, Lawton et al., 1995). For this investigation, we havefocused on the non-orthogonal method since this is easier to implement in the field and hasproven successful for P-wave coal-scale exploration.
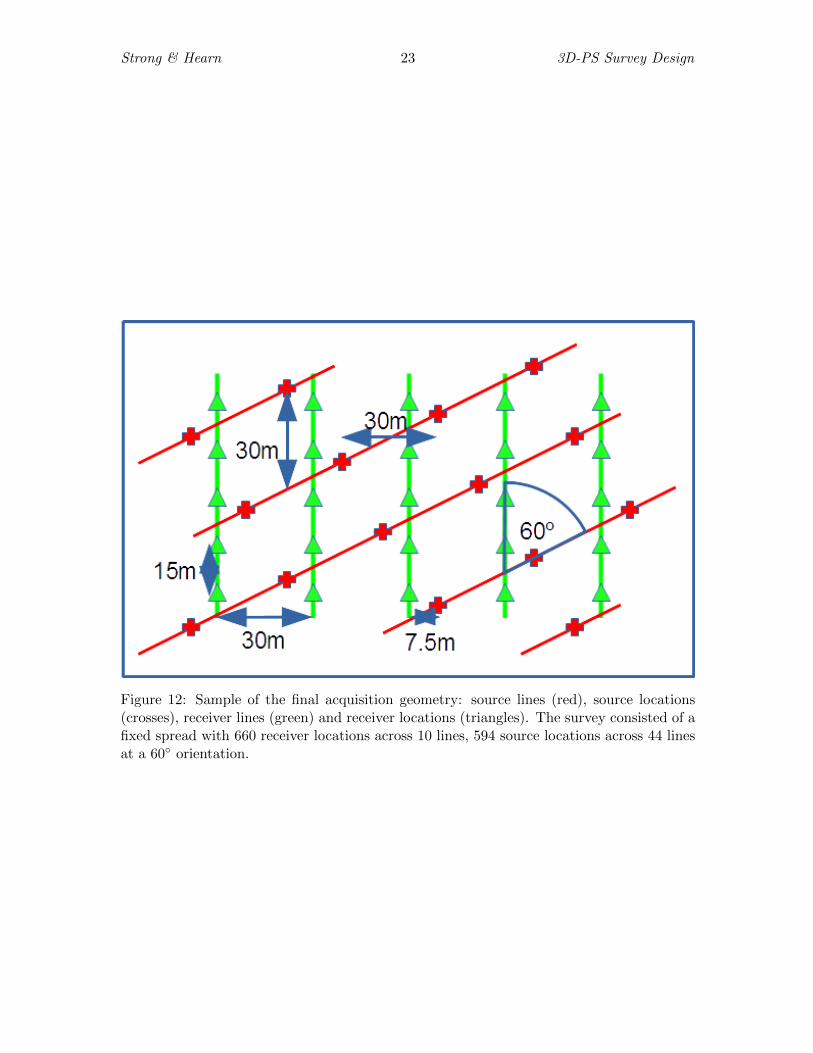
The final design incorporated source and receiver densities similar to those in Figure11, but with source lines at 60◦ to the receiver lines. Figure 12 provides a graphical rep-resentation of the basic survey geometry and its caption includes details of relevant surveystatistics.
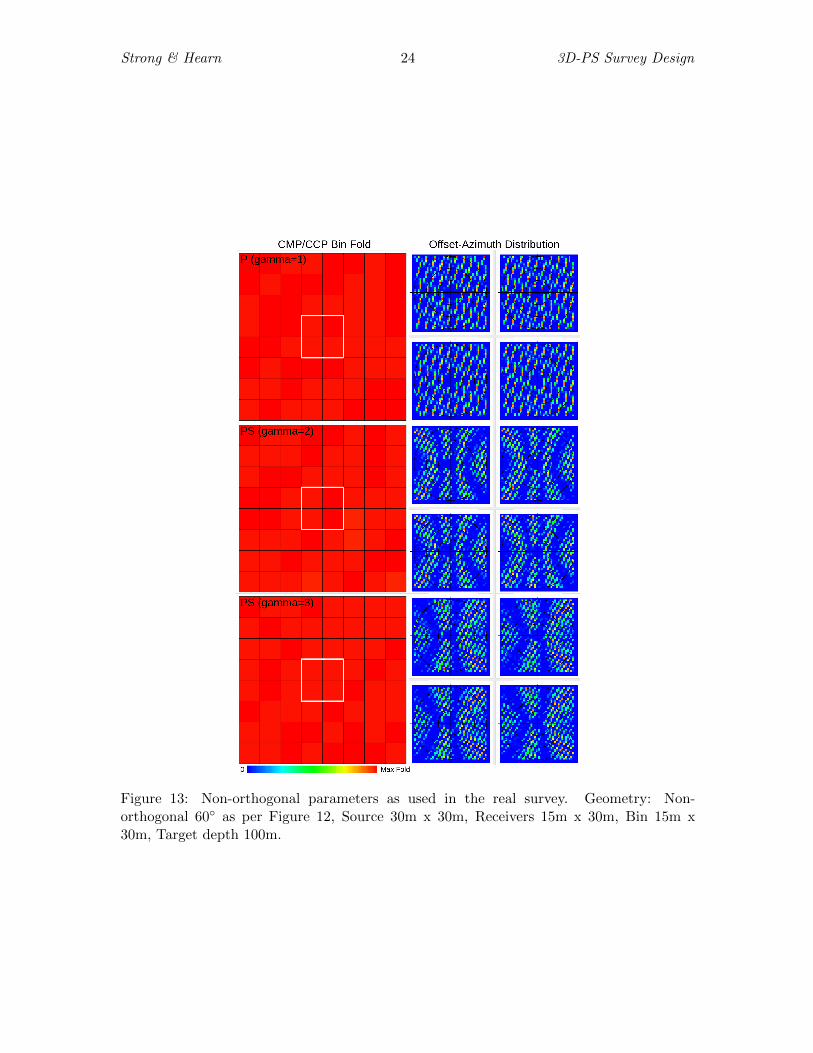
The corresponding fold and offset-azimuth predictions are given in Figure 13. Comparedto the orthogonal grid (Figure 11), the P-wave offset-azimuths are arguably slightly morerandomized. The PS offset-azimuth distribution appears slightly less variable (i.e. morestable color distribution).
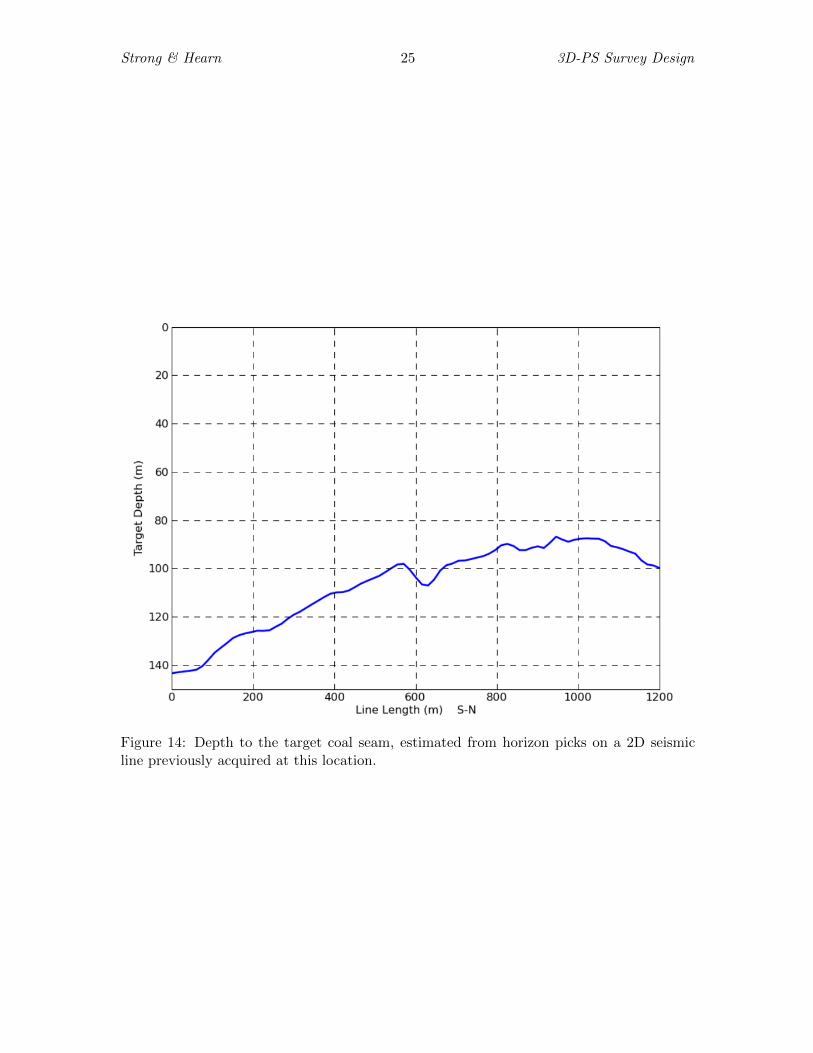
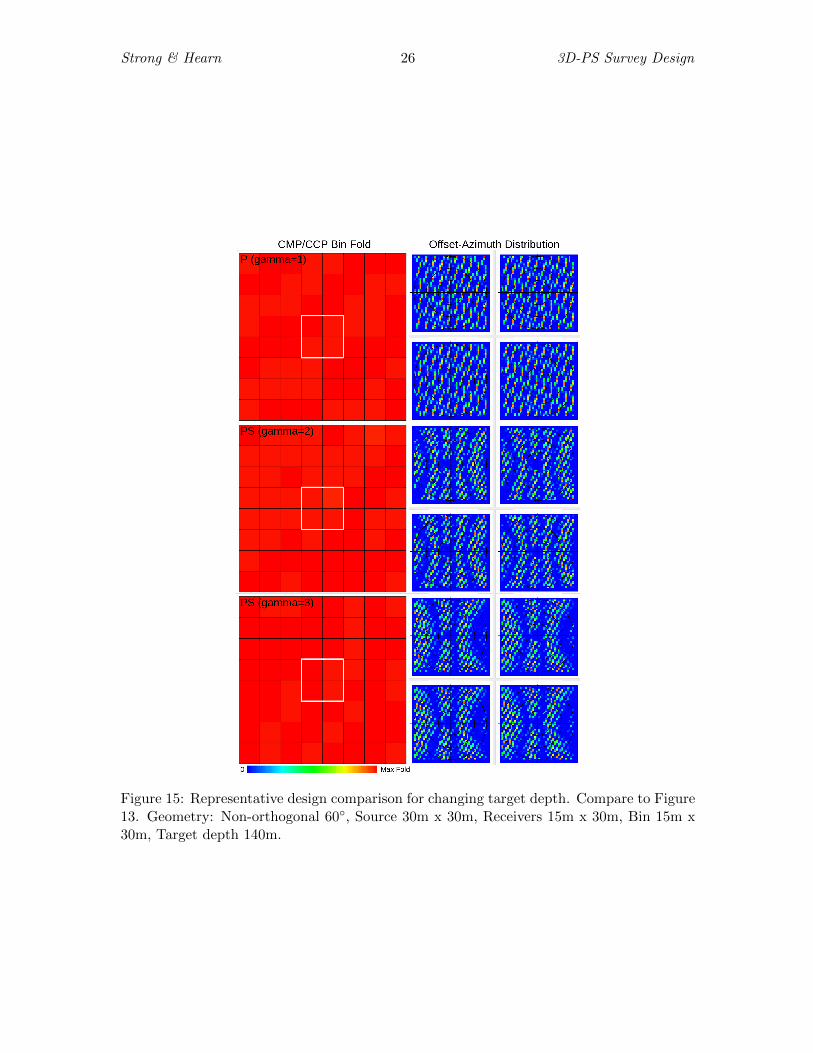
The design analyses given to this point have been for a nominal target depth of 100m.A previous 2D P-wave line suggested that the actual target depth in the area of the planned3D varied from about 85m to 140m (Figure 14). The preferred design was confirmed for arange of target depths across the survey area. For example, Figure 15 shows the predicteddistributions in the area where the target is deepest (140m). As expected (based on equa-tion 2), the offset-azimuth points are shifted compared to the 100m analysis in Figure 13.However, the overall distribution is of similar quality. This is also the case for other targetdepths examined.
CONCLUSION
Survey design for 3D-PS reflection is more complicated than for P-wave reflection, withray-path asymmetry dependent on target depth and velocities. These problems may bemore apparent at the coal-scale (target depth 0-300m) than at the conventional petroleumscale.
Coal-scale PS records typically suffer strong noise interference at short offsets. Simpleray-path analysis for typical seams suggests that post-critical reflections from the base-of-coal might seriously restrict usable far offsets. The conventional approach of excludingall post-critical arrivals would result in poor fold in the case of PS data. A useful tool forassessing the severity of such phase distortion is finite-difference modeling. For typical seamparameters, this modeling suggests that the post-critical zone may in some cases be usable.
Strong & Hearn 9 3D-PS Survey Design
The P-wave reflection package often exhibits relatively consistent phase across the offsetrange. The character of PS reflections can also be quite consistent within the post-criticalzone, where amplitudes are also high.
The incorporation of such longer-offset data requires careful selection of offset ranges,and rigorous quality control in processing. However, it is often possible to significantlyincrease the signal-to-noise ratio, with only minimal degradation in resolution. Dependingon survey objectives, this may be a worthwhile compromise. The tendency to include longeroffsets has a serious implication for coal-scale PS survey design, in that it is more likely toincorporate rays which are highly asymmetrical, and very sensitive to choice of the VP /VSvelocity ratio.
A case study of a coal-scale 3D-PS survey design has been presented. A general ob-servation, consistent with previous petroleum-scale studies, is that for the P-wave design,reducing source or receiver density has a similar impact on fold and offset-azimuth distri-butions. However in the case of the PS design, reduction in source density is the preferredoption. This is an important observation in the coal seismology context, where dynamitesurveys are relatively common, with the aim of maximizing resolution for mine planning.
The final preferred design incorporated a slanted source line geometry. These adjust-ments appear to have marginally reduced the variations in PS offset-azimuths, comparedwith the related orthogonal design. The offset-azimuth distribution of the P-wave datahas changed but in this case the overall impact on the P-wave processing is likely to benegligible.
Any seismic survey design must include logistic, economic, and environmental factors.These sometimes compete against the resolution requirements. For the specific 3D-3C trialconsidered here, a reasonable balance of these was achieved. The overall results of the trialare presented elsewhere (Strong and Hearn, 2011). The offset-azimuth distribution achievedacross the survey has permitted the detection of clear azimuthal anisotropy in both P andPS data, with convincing relationships to fault structures and associated stress directions(Hearn and Strong, 2012). The success of that analysis was dependent on careful P and PSsurvey design.
While this investigation has focused on the coal-scale, the concepts are also relevantto more conventional surveys where knowledge of the near surface may be important forvelocity and anisotropy analysis.
ACKNOWLEDGMENTS
We would like to acknowledge the Australian Coal Association Research Program (ACARP)for their support of this research, and the host mine site for access to the test site. We thankAssociate Editor Guy Drijkoningen, and reviewers Denis Mougenot, Peter Cary, and twoanonymous, whose suggestions greatly improved the paper.
REFERENCES
Barkved, O. I., M. C. Mueller, and L. Thomsen, 1999, Vector interpretation of the Valhall3D/4C OBS dataset: 61st Mtg., Eur. Assn. Geosci. Eng., Session:6042.
Strong & Hearn 10 3D-PS Survey Design
Bland, H. C., R. R. Stewart, H.-x. Lu, A. Cordsen, and M. Werner, 1998, The shaganappigeotechnical experiments: 2-D and 3-D multicomponent seismic surveys and geologic logs:Technical Report 34, CREWES Research Report.
Canning, A., and G. H. Gardner, 1998, Reducing 3-D acquisition footprint for 3-D DMOand 3-D prestack migration: Geophysics, 63, 1177–1183.
Cary, P. W., 1999, Common-offset-vector gathers: an alternative to cross-spreads for wide-azimuth 3-D surveys: Presented at the 1999 SEG Annual Meeting, Society of ExplorationGeophysicists.
Cary, P. W., and D. C. Lawton, 2003, Bandlimited design and stacking of PP and PS sur-veys: Presented at the 2003 SEG Annual Meeting, Society of Exploration Geophysicists.
Chemingui, N., and B. Biondi, 1996, Handling the irregular geometry in wide-azimuthsurvays: 1996 SEG Annual Meeting, Society of Exploration Geophysicist, 32–35.
Chen, J., and G. T. Schuster, 1999, Resolution limits of migrated images: Geophysics, 64,1046–1053.
Cooper, N., 2004, Tutorial A world of reality Designing land 3D programs for signal, noise,and prestack migration; Part 1: The Leading Edge, 23, 1007–1014.
Cordsen, A., M. Galbraith, and J. Peirce, 2000, in Planning Land 3-D Seismic Surveys:Society of Exploration Geophysicists, Geophysical Development, No. 9, 204.
Crewes.org, 2005, CREWES Zoeppritz Explorer 2.2.Dufour, J., J. Squires, W. N. Goodway, A. Edmunds, and I. Shook, 2002, Integrated ge-
ological and geophysical interpretation case study, and lame rock parameter extractionsusing AVO analysis on the blackfoot 3C-3D seismic data, southern Alberta, Canada:Geophysics, 67, 27–37.
Eaton, D. W., and D. C. Lawton, 1992, P-SV stacking charts and binning periodicity:Geophysics, 57, 745–748.
Gardner, G. H., and A. Canning, 1994, Effects of irregular sampling on 3D prestack migra-tion: 1994 SEG Annual Meeting, Society of Exploration Geophysicist, 1553–1556.
Garotta, R., 1999, Shear waves from acquisition to interpretation: 2000 distinguished in-structor short course: Society of Exploration Geophysicists.
Guarın, A. T., 2005, On the calculation of P-SV conversion point for a dipping bed: Geo-physics, 71, T13–T16.
Hanson, R. A., M. K. MacLeod, C. R. Bell, C. J. Thompson, and J. Somod, 1999, Multi-component seismic interpretation - data integration issues, Alba field, North Sea: 61stMtg., Eur. Assn. Geosci. Eng., Session:6027.
Hardage, B. A., M. V. DeAngelo, P. E. Murray, and D. Sava, 2011, in Multicomponentseismic technology: Society of Exploration Geophysicists, Geophysical Reference Series,No. 18, 318.
Hearn, S., and S. Strong, 2012, Investigation of azimuthal anisotropy in high-fold 3D mul-ticomponent seismic reflection: ASEG Extended Abstracts, 2012, 1–4.
Hearn, S. J., 2004, Shallow, high-resolution converted-wave seismology for coal exploration:Presented at the 17th meeting, Sydney, Aust. Soc. Expl. Geoph.
Hendrick, N., 2006, Converted-wave seismology for coal exploration: Recorder: CanadianSociety of Exploration Geophysicists May, 27, 31.
Hoffmann, J., 2001, Illumination, resolution, and image quality of PP- and PS-waves forsurvey planning: The leading edge, 20, 1008–1014.
Hunter, J., S. Pullan, R. Burns, R. Gagne, and R. Good, 1984, Shallow seismic reflectionmapping of the overburden-bedrock interface with the engineering seismograph-some sim-ple techniques: Geophysics, 49, 1381–1385.
Strong & Hearn 11 3D-PS Survey Design
Jousset, P., P. Thierry, and G. Lambare, 2000, Improvement of 3D migration/inversion byreducing acquisition footprints: Application to real data: Presented at the 2000 SEGAnnual Meeting, Society of Exploration Geophysicists.
Knapp, R. W., and D. W. Steeples, 1986, High-resolution common-depth-point reflectionprofiling: Field acquisition parameter design: Geophysics, 51, 283–294.
Lawton, D. C., 1994, Acquisition design for 3-D converted waves: Technical Report 23,CREWES Research Report.
Lawton, D. C., R. R. Stewart, A. Cordsen, and S. Hrycak, 1995, Advances in 3C-3D designfor converted waves: Technical Report 7(43), CREWES Research Report.
Lee, S.-S., J. Willis, and S. Lin, 2005, Migration weights for pre-stack converted wave datato reduce the acquisition footprint: Presented at the 2005 SEG Annual Meeting, Societyof Exploration Geophysicists.
Liner, C. L., and W. D. Underwood, 1999, 3-D seismic survey design for linear v( z) media:Geophysics, 64, 486–493.
Meier, M. A., 2009, Converted-wave survey design: Presented at the 2009 SEG AnnualMeeting, Society of Exploration Geophysicists.
Musser, J. A., 2005, Full-Wave 3D Seismic Survey Designs and Operations for the Ma-rine Environment: Presented at the 2005 SEG Annual Meeting, Society of ExplorationGeophysicists.
Robertsson, J. O., J. O. Blanch, and W. W. Symes, 1994, Viscoelastic finite-differencemodeling: Geophysics, 59, 1444–1456.
Schneider Jr, W. A., 2002, A simple, exact solution for the P-SV wave conversion point viaprestack migration: Geophysics, 67, 1634–1636.
Simmons Jr, J. L., and M. M. Backus, 1994, AVO modeling and the locally converted shearwave: Geophysics, 59, 1237–1248.
Stone, D., 1994, Designing seismic surveys in two and three dimensions: Society of Explo-ration Geophysicists. Geophysical References Series, No. 5.
Strong, S., and S. Hearn, 2011, Towards 3D, integrated P+PS seismic imaging of coal tar-gets: Technical report, Australian Coal Associaiton Research Program (ACARP) Report,C17029.
——–, 2012, The importance of non-hyperbolic and stretch effects in far-offset P and PSnmo processing: ASEG Extended Abstracts, 2012, 1–4.
Tessmer, G., and A. Behle, 1988, Common reflection point data-stacking technique forconverted waves: Geophysical Prospecting, 36, 671–688.
Thomas, J. W., and W. Neff, 2004, Teepee technology applied to C-wave acquisition design:The Leading Edge, 23, 1049–1052.
Thompson, L., 1999, Converted-wave reflection seismology over inhomogeneous, anisotropicmedia: Geophysics, 23, 678–690.
Vermeer, G. J., 1998, Creating image gathers in the absence of proper common-offset gath-ers: Exploration Geophysics, 29, 636–642.
——–, 1999, Converted waves: properties and 3D survey design: Presented at the 1999SEG Annual Meeting, Society of Exploration Geophysicists.
Vinje, V., P. Zhao, and J. Gaiser, 2015, Offset vector tile gather extension and weightingto reduce footprint in dual-datum and converted-wave migration: Presented at the 2015SEG Annual Meeting, Society of Exploration Geophysicists.
Wang, S., and J. Wang, 2014, 5D interpolation/regularization and COV/OVT PSTM forconverted-wave (PS) data: SEG Technical Program Expanded Abstracts 2014, 3584–3588.
Strong & Hearn 12 3D-PS Survey Design
Ye, W., and A. Entezari, 2012, A geometric construction of multivariate sinc functions:Image Processing, IEEE Transactions on, 21, 2969–2979.
Zhang, Y., 1996, Nonhyperbolic converted wave velocity analysis and normal moveout:Presented at the 1996 SEG Annual Meeting, Society of Exploration Geophysicists.
Zhang, Y., and E. A. Robinson, 1992, Stacking P-SV converted wave data with raypathvelocity: Presented at the 1992 SEG Annual Meeting, Society of Exploration Geophysi-cists.
Zuleta, L. M., and D. C. Lawton, 2011, PS survey design: Presented at the 2011 SEGAnnual Meeting, Society of Exploration Geophysicists.
Figure 1: Top-of-coal response for P (red) and PS (green) reflections. Magnitude (top)and phase (bottom) variations are shown as a function of angle of incidence (and henceoffset). Coal: VP=2250 m/s; VS=900 m/s; ρ=1400 kg/m3. Sedimentary rock: VP=3200m/s; VS=1600 m/s; ρ=2500 kg/m3. The curves were generated using CREWES ZoeppritzExplorer 2.2 (Crewes.org, 2005).
Strong & Hearn 13 3D-PS Survey Design
Figure 2: Bottom-of-coal response for P (red) and PS (green) reflections. Magnitude (top)and phase (bottom) variations are shown as a function of angle of incidence (and henceoffset). Layer parameters as for Figure 1 . The curves were generated using CREWESZoeppritz Explorer 2.2 (Crewes.org, 2005). Phase response for both wave types changessignificantly at the critical angle (approximately 34◦).
Layer VP (m/s) VS (m/s) ρ (kg/m3) Thickness (m)
Country rock 1 3200 1600 2500 100
Coal 2250 900 1400 ≥ 5
Country rock 2 4000 2000 2500 ∞
Table 1: Coal seam model used in the phase vs. offset analysis. The parameters shown areindicative of those expected in the real field trial.
Strong & Hearn 14 3D-PS Survey Design
Figure 3: Ray-path modeling to estimate offset at which critical-angle phase distortion isexpected, for coal seams of various thicknesses. Model parameters are given in Table 1.For a 5 m seam, P (red) and PS (green) distortion is predicted beyond 270m and 185mrespectively.
APPENDIX A
RELATIONSHIP BETWEEN RELATIVE DEPTH AND RELATIVEOFFSET FOR A PS REFLECTION POINT
Repeating equation 1 for convenience, the PS reflection point offset is given by
XP =Xo
1 + tan θStan θP
(A-1)
where Xo is the offset, θP is the incident angle of the downgoing P-wave and θS is thereflection angle of the upgoing S-wave. For comparative survey-design analyses, it is usefulto re-express this equation as a relationship between the relative depth (R = Z/Xo) andrelative offset (C = XP /Xo) of the reflection point. Equation A-1 becomes
C =1
1 + tan θStan θP
(A-2)
or
C =1
1 + sin θS cos θPsin θP cos θS
. (A-3)
We use Snell’s Law
γ =VPVs
=sin θPsin θS
(A-4)
and also introduce DP and DS corresponding to the distance traveled by the P and S wavesrespectively
cos θP =Z
DP, cos θS =
Z
DS. (A-5)
Strong & Hearn 15 3D-PS Survey Design
Figure 4: Finite-difference evaluation of phase vs offset distortion for the model in Table1. On the vertical component record (top) post-critical P-wave distortion is much lesspronounced (red box) than for the PS reflection on the inline horizontal record (bottom,green box). Reflection times for top and bottom of the seam are indicated by the magentalines. A minimum-phase wavelet has been used in the modeling. To aid comparison, thevertical scale has been stretched on the vertical record. Total time scales are vertical (top):0.2s, inline (bottom): 0.3s.
Strong & Hearn 16 3D-PS Survey Design
Figure 5: Inline common-conversion-point super gather from 3D-PS trial. (a) record show-ing a strong PS reflection event corresponding to target coal-seam. The modeling in Figure3 suggests the base-of-coal critical angle corresponds to an offset of approximately 185 m.(b) record after non-hyperbolic PS-NMO, VP = 3200m/s, VP /VS ratio (γ) = 2.4.
Hence equation A-3 becomes
C =1
1 + DSγDP
(A-6)
Rearranging and squaring gives
D2P
D2S
=C2
γ2(1− C)2. (A-7)
Using Pythagoras’ Theorem, we also have
D2P
D2S
=X2P + Z2
(XO −XP )2 + Z2(A-8)
or, in terms of the relative depth R = ZXO
and relative offset C = XPXO
D2P
D2S
=C2 +R2
(1− C)2 +R2. (A-9)
Equating A-7 and A-9C2 +R2
(1− C)2 +R2=
C2
γ2(1− C)2. (A-10)
Rearranging gives
R2 =(γ2 − 1)C2(1− C)2
C2 − γ2(1− C)2(A-11)
or
R =
√(γ2 − 1)C2(1− C)2
C2 − γ2(1− C)2. (A-12)
Strong & Hearn 17 3D-PS Survey Design
Figure 6: Relative depth (R) versus relative offset (C) of PS reflection point, for a typicalrange of γ values (different colors), as derived using equation 2. Coal-scale surveys are morelikely to incorporate highly asymmetric rays in the zone above R=1.
Strong & Hearn 18 3D-PS Survey Design
Figure 7: Comparison of bin fold (Left) and offset-azimuth distribution (Right) for P waves(top), and PS waves (γ = 2 mid, γ = 3 bottom). The offset-azimuth plots correspond tothe four reflection bins marked by the white square. Each of these are gridded based on15m x 15m common offset tiles. A Lanczos sinc filter has been applied to all reflections.This layout will be consistent for the following images. Geometry: Orthogonal grid, Source15m x 15m, Receivers 15m x 15m, Bin 7.5m x 7.5m, Target depth 100m.
Strong & Hearn 19 3D-PS Survey Design
Figure 8: Fold, azimuth/offset distribution for larger bins compared to Figure 7. Geometry:Orthogonal grid, Source 15m x 15m, Receivers 15m x 15m, Bin 15m x 15m, Target depth100m.
Strong & Hearn 20 3D-PS Survey Design
Figure 9: Decimation of receivers, compared to Figure 8 . Geometry: Orthogonal grid,Source 15m x 15m, Receivers 60m x 60m, Bin 15m x 15m, Target depth 100m.
Strong & Hearn 21 3D-PS Survey Design
Figure 10: Decimation of sources for comparison to Figure 9. Geometry: Orthogonal grid,Source 60m x 60m, Receivers 15m x 15m, Bin 15m x 15m, Target depth 100m.
Strong & Hearn 22 3D-PS Survey Design
Figure 11: Reduction in source and receiver densities for economic purposes. Geometry:Orthogonal grid, Source 30m x 30m, Receivers 15m x 30m, Bin 15m x 30m, target depth100m.
Strong & Hearn 23 3D-PS Survey Design
Figure 12: Sample of the final acquisition geometry: source lines (red), source locations(crosses), receiver lines (green) and receiver locations (triangles). The survey consisted of afixed spread with 660 receiver locations across 10 lines, 594 source locations across 44 linesat a 60◦ orientation.
Strong & Hearn 24 3D-PS Survey Design
Figure 13: Non-orthogonal parameters as used in the real survey. Geometry: Non-orthogonal 60◦ as per Figure 12, Source 30m x 30m, Receivers 15m x 30m, Bin 15m x30m, Target depth 100m.
Strong & Hearn 25 3D-PS Survey Design
Figure 14: Depth to the target coal seam, estimated from horizon picks on a 2D seismicline previously acquired at this location.
Strong & Hearn 26 3D-PS Survey Design
Figure 15: Representative design comparison for changing target depth. Compare to Figure13. Geometry: Non-orthogonal 60◦, Source 30m x 30m, Receivers 15m x 30m, Bin 15m x30m, Target depth 140m.

Strong & Hearn 27 3D-PS Survey Design
For a PS reflection, this equation relates the relative depth R to the relative offset C.It is useful in comparative geometrical analysis of PS reflection surveys at different scales(e.g. petroleum, coal).


