
Surprise! Out-of-Network Billing for Emergency Care in … medical billing occurs when a patient...
92
Surprise! Out-of-Network Billing for Emergency Care in the United States ISPS Working Paper July 2017 ISPS17-22 Zack Cooper Fiona Scott Morton Nathan Shekita Yale University
-
Upload
truongnhan -
Category
Documents
-
view
216 -
download
0
Transcript of Surprise! Out-of-Network Billing for Emergency Care in … medical billing occurs when a patient...

Surprise! Out-of-Network Billing for Emergency Care in the United States
ISPS Working Paper
July 2017
ISPS17-22
Zack Cooper
Fiona Scott Morton
Nathan Shekita
Yale University

1
Surprise! Out-of-Network Billing for Emergency Care in the United States
July 2017
Zack Cooper Yale University 77 Prospect Street New Haven, CT 06511
Fiona Scott Morton Yale University and NBER 165 Whitney Ave, New Haven, CT 06511
Nathan Shekita Yale University 77 Prospect Street New Haven, CT 06511
Abstract: Using insurance claims data, we show that in 22% of emergency episodes, patients attended in-network hospitals, but were treated by out-of-network physicians. Out-of-network billing allows physicians to significantly increase their payment rates relative to what they would be paid for treating in-network patients. Because patients cannot avoid out-of-network physicians during an emergency, physicians have an incentive to remain out-of-network and receive higher payment rates. Hospitals incur costs when out-of-network billing occurs within their facilities. We illustrate in a model and confirm empirically via analysis of two leading physician-outsourcing firms that physicians offer transfers to hospitals to offset the costs of out-of-network billing and allow the practice to continue. We find that a New York State law that introduced binding arbitration between physicians and insurers to settle surprise bills reduced out-of-network billing rates.
JEL codes: I11, I13, I18, L14
Acknowledgements: This project received financial support from the National Institute for Health Care Management. We also received helpful feedback from Amanda Starc, Stuart Craig, Chima Ndumele, and Leemore Dafny. We are appreciative for the excellent research assistance from Eugene Larsen-Hallock and Charles Gray. All mistakes are our own.

2
1. Introduction
Surprise medical billing occurs when a patient receives a bill from an out-of-network
health care provider whom the patient reasonably thought would be participating in her insurer’s
network. The most troubling surprise bills are those that occur for emergency services, where
patients are in medical distress and do not chose and cannot avoid out-of-network doctors. Each
year, there are 41.9 emergency department (ED) visits per 100 people in the United States (US)
(Centers for Disease Control and Prevention, 2013). When a person requires urgent medical care,
she effectively chooses an “emergency bundle” that includes a hospital ED and the physicians
working in that hospital. However, what most privately insured patients do not realize is that
hospitals and physicians independently negotiate contracts with insurers. As a result, it is
possible for a patient to choose a hospital ED that is in-network with her insurer, but receive care
and a subsequent ‘surprise’ bill from a physician working in that ED who does not have a
contract with her insurer. These out-of-network bills reflect physicians’ charges, which, unlike
payments for most medical services, are not set through a competitive process. In previous work,
Cooper and Scott Morton (2016) found that 22% of privately insured patients who attended to in-
network hospital ED were treated by an out-of-network physician.1 They estimated that the
average potential surprise bill was $622.55. Given that nearly half of individuals in the US do not
have the liquidity to pay an unexpected $400 expense without taking on debt and ED visits are so
common, these out-of-network charges can be financially devastating to a large share of the
population and should be a major policy concern (Board of the Governors of the Federal Reserve
System, 2016).
In this paper, we analyze data from a large insurer that covers tens of millions of lives
annually to study the drivers of out-of-network billing for emergency care. Our data cover nearly
$28 billion in emergency spending on nearly 9 million ED episodes from 2011 through 2015. We
model the incentives for insurers and physicians to respectively, form and join provider
networks. We also model hospitals’ incentives to permit out-of-network billing to occur within
their facilities. We then explore where and why out-of-network billing occurs and examine the
impact of a 2014 New York State law designed to protect consumers from surprise bills. Finally,
based on our analysis of the drivers of out-of-network billing and evidence from our assessment
1 Garmon and Chartock (2016) also examined out-of-network billing rates using separate data. They found that 20% of in-network emergency visits involved an out-of-network physician.
3
of the New York State out-of-network law, we make policy recommendations aimed at
protecting consumers and restoring a competitively set payment rate for physicians who staff
emergency departments (ED physicians hereafter).2
There have been significant changes over the last several decades in the structure of
emergency medicine and the role that EDs play as a source of patients for hospitals. Over time,
EDs have become one of the main pathways through which patients are admitted to the hospital
(Morganti et al., 2013). From 1993 to 2006, the share of all inpatient stays that were admitted to
the hospital via an ED increased from 33.5% to 48.3% (Schuur and Venkatesh, 2012). Because
EDs have become a major source of patients, hospitals now want to keep their EDs open at all
hours and run them efficiently (Institue of Medicine, 2006, Morganti et al., 2013). As a result,
there has been a marked increase in the outsourcing of management of hospital EDs. ED
outsourcing companies hire and manage physicians, manage ED operations, and take care of
billing. At present, approximately two-thirds of hospitals outsource their EDs (Deutsche Bank,
2013). Among the hospitals that outsource their services, approximately a third contract with a
large, national outsourcing chain (Dalavagas, 2014). There are two leading national outsourcing
firms – EmCare and TeamHealth - that collectively capture approximately 30% of the physician
outsourcing market (Deutsche Bank, 2013).
In this paper, consistent with our previous analysis, we find that from 2011 through 2015,
22% of patients who attended an in-network ED were treated by an out-of-network physician.
Out-of-network physicians charge, on average, 637% of what the Medicare program would pay
for identical services. This compares to in-network payment rates that average 266% of the
corresponding Medicare rates. Of note, out-of-network billing is concentrated in a minority of
hospitals. We find that 50% of hospitals have out-of-network billing rates below 5% while 15%
of hospitals have out-of-network billing rates above 80%. We also find that out-of-network rates
are significantly higher at for-profit hospitals. We show that the two large, national ED staffing
companies have distinct out-of-network strategies. We find that hospitals that contract with
EmCare to run their EDs have an average out-of-network billing rate of 62%. In contrast,
hospitals that contract with TeamHealth have an average out-of-network billing rate of 13%.
2 Physicians who staff hospital EDs are not necessarily board certified in emergency medicine. For example, in Iowa, EDs are predominantly staffed by physicians trained in family medicine (Groth et al. 2013).

4
In our model of physician behavior, we show that out-of-network billing allows
physicians to significantly increase their payment rates. Ultimately, because patients cannot
avoid out-of-network physicians during emergency visits, this increase in price does not lead to a
decrease in demand. Hospitals, by contrast, do not directly gain when physicians bill out-of-
network from inside their facilities. Instead, hospitals may incur costs from the practice in the
form of reputational harm. As a result, hospitals would prefer physicians not to bill out-of-
network from within their facilities. To motivate hospitals to allow out-of-network billing to
occur inside their facilities, we show that physicians and physician outsourcing companies may
need to compensate hospitals with a sufficiently large transfer to outweigh the costs they incur
from the practice.
In our analysis, we find empirical results consistent with our model. In our data, we find
that when EmCare – which has an average out-of-network billing rate of 62% - takes over the
management of emergency services at hospitals with low out-of-network rates, they raise out-of-
network rates by over 81 percentage points and increases average physician payments by 117%.
Consistent with our model, there are clear benefits for the hospital when EmCare takes over
management of its ED. Following the entry of EmCare, facility payments increase by 11%.
These increased payments are driven, in part, by increases in imaging rates of 5%, and a 23%
increase in the rate that physicians admitted patients to the hospital. We also find that following
the entry of EmCare, physicians were 43% more likely to bill for emergency visits using the
highest paying and highest acuity billing code. Interestingly, TeamHealth – which has an average
out-of-network billing rate of 13% - appears to have a somewhat different strategy. On average,
in our data, when TeamHealth enters a hospital, out-of-network rates increase by 33 percentage
points and physician payment rates increase by 68%. However, the entry of TeamHealth is not
associated with an increase in the rate imaging studies are performed, the rate patients are
admitted to the hospital, or the rate that physicians bill using the highest paying billing code for
emergency care. Instead, we find that the entry of TeamHealth led to a 30% increase in the
number of cases treated per year in entry hospitals’ EDs. Our finding that the two large
management companies pursue such distinct strategies indicates that any policy response in this
area should be nuanced.
In addition, we use our data to study the impact of a 2014 New York law that was
designed to protect patients from surprise out-of-network billing. The law prohibited patients

5
who saw an out-of-network physician during an emergency episode from paying more than what
they would have paid out-of-pocket had they been treated by an in-network physician (Hoadley
et al., 2015). In order to determine the rate that insurers pay physicians for out-of-network ED
services, the law created a binding, “baseball rules” arbitration process to settle payment disputes
(Hoadley et al., 2015). We found that the New York law lowered the incidence of out-of-network
billing by 34% and reduced the likelihood that patients saw an out-of-network physician. Going
forward, we also explore additional policy alternatives that could increase competition in health
care markets while reducing out-of-network billing.
This paper is structured as follows. Section 2 gives background on ED care in the US and
describes the impact of surprise out-of-network billing on patients. In Section 3, we describe our
data and give an overview of rates of out-of-network ED billing we observe across the US. In
Section 4, we model the incentives of physicians and hospitals to engage in out-of-network
billing. In Section 5, we identify the factors associated with out-of-network billing. In Section 6,
we analyze the impact of the entry of EmCare and TeamHealth on out-of-network billing.
Section 7 analyzes the impact of a New York State law designed to end out-of-network billing
and propose our own policy to address the issue. We conclude in Section 8.
2. Background
2.1 The Evolution of Emergency Medicine in the United State
The field of emergency medicine developed in the wake of World War 2. From the 1970s
through the 1990s, care in hospital-based EDs shifted from being provided on an ad hoc basis by
community physicians to being delivered, round-the-clock, by doctors who often have completed
ED residencies and are board-certified in emergency medicine (Institute of Medicine, 2006).3 At
present, there are over 4500 EDs in the US and approximately 40,000 physicians who staff them
nationwide (Hsia et al., 2011; Morganti et al., 2013). EDs deliver more than 130 million episodes
annually and approximately one in five individuals attends an ED each year. (Hsia et al., 2011).
The use of EDs has risen dramatically over time. From 1993 to 2003, the US population
grew by 12%, hospitalizations increased by 12%, and ED visits increased by 26% (Institute of
Medicine, 2006). From 2001 through 2008, the use of EDs increased 1.9% each year - 60%
3 Many EDs are not staffed by board-certified ED physicians. Approximately a third of emergency care is provided by family physicians. In rural states, the share of family physicians delivering emergency care is over 50% (Wadman et al., 2005; Groth et al., 2013; McGirr et al., 1998).

6
faster than concurrent population growth (Hsia et al., 2011). The growth in ED visits drove,
almost entirely, the growth in hospital admissions in the 2000s (Morganti et al., 2013). At
present, nearly 50% of hospitals’ inpatient beds are filled with patients who were admitted via
the ED (Morganti et al., 2013). Overtime, as the use of EDs has gone up, waiting times to be
treated inside EDs have also increased (Hing and Farida, 2012). In response to rising waiting
times, EDs are increasingly competing on the length of time patients have to wait before they are
treated (Esposito, 2016; Rice, 2016). As a result, efficiently run hospital-EDs are crucial to
hospital revenue.
Ultimately, ED care is profitable for hospitals. Wilson and Cutler (2014) estimate that
average ED profit margins are approximately 7.8%. However, the profit margins that hospitals
face for ED care vary significantly depending on how patients’ care is funded and based on
whether or not a patient is admitted to the hospital. Wilson and Cutler (2014) found that hospitals
had profit margins of 39.6% for privately insured patients treated in EDs, whereas the profit
margin for patients covered by Medicare and Medicaid, and those uninsured were -15.6%, -
35.9% and -54.4% respectively. They also found that patients who were admitted to the hospital
were significantly more profitable than those who were not. Indeed, for Medicare patients, the
profit margin on ED care for patients who were discharged from the ED was -53.6% whereas the
profit margin for patients who were admitted to the hospital was 18.4% (Wilson and Cutler,
2014).
Payment rates to ED physicians from private insurers, measured as a share of Medicare
payments, are higher than in other specialties in our dataset. Whereas orthopedists get paid 178%
of Medicare rates for performing knee replacements and internists received 158.5% of Medicare
rates for routine office visits, ED physicians were paid, on average, at 297% of Medicare
payments (Cooper and Scott Morton, 2016). Likewise, Bai and Anderson (2017) found ED
physicians’ charge to Medicare ratio was in the top quartile of all specialties and was 4.0,
compared to the median ratio among all physicians of 2.5. ED physicians are also well
compensated relative to doctors working in other specialties. In 2016, according to two analyses,
ED physicians earn approximately $320,000 per year, which puts them in the top half of the
income distribution of all physicians by specialty (Peckham, 2016; Hamblin, 2015).
Over time, as ED care has accounted for a growing share of hospital admissions, the
structure of emergency medicine has changed. Since the 1990s, there has been a steady increase

7
in the rate that hospitals outsource the management, staffing, and billing of their EDs. As a
William Blair & Company (2013) report noted, “this outsourcing trend is primarily driven by the
difficulty of efficiently staffing and managing an ED; for many hospitals, this department is its
most unprofitable unit. Yet efficient EDs (i.e. those with high throughput and strong customer
satisfaction) are a critical function of the hospital” (Pg. 4). At present, roughly 65% of the
physician market is outsourced (Deutsche Bank, 2013). Deutsche Bank estimated that across the
US, 35% of ED physicians are self-employed, 12% work for regional groups, 31% work for local
groups, and 22% work for national firms.
The national market for physician outsourcing is dominated by two firms that collectively
account for approximately 30% of the outsourced physician market. EmCare is publicly traded,
operates in 45 states, has 23,100 affiliated or employed physicians and health care professionals,
and, according to their 2016 10K statement, delivers over 18 million emergency episodes per
year. More recently, EmCare has partnered with a large, for-profit hospital chain and formed
joint ventures where they and their hospital partners share in profits from physician bills
(Deutsche Bank, 2013).
The second firm, TeamHealth, is approximately the same size. According to its most
recent 10K statement, it has more than 18,000 affiliated health professionals and delivers
approximately 10,000,000 ED cases per year. TeamHealth recently acquired another physician
outsourcing company and now is likely to have the largest market share in the physician
outsourcing space. The firm was previously publicly traded, but was taken private in 2016.
2.2 Out-of-Network Surprise Billing
There has been significant coverage of out-of-network billing in EDs in the popular press
(Rosenthal, 2014a; Rosenthal, 2014b; Sanger-Katz and Abelson, 2016). However, until recently,
there has been no systematic evidence on the frequency with which out-of-network billing
occurs. Recent survey work suggests that it is fairly common for privately insured patients to be
treated by out-of-network physicians. A Consumer Union (2015) survey found that 30% of
privately insured individuals reported receiving a surprise medical bill in the last year. Likewise,
among those with trouble paying a medical bill, 32% reported that their financial troubles
stemmed from a bill from an out-of-network provider for services that were not covered or were
only partially covered by their insurer (Hamel et al., 2016). In this Hamel et al. (2016) survey,

8
the authors found that bills from ED physicians made up the largest share of debt that patients
reported having problems paying.
The results of these surveys have been confirmed by recent empirical evidence. A 2014
report found that among the three largest insurers in Texas, 45%, 56%, and 21% of their in-
network hospitals had zero in-network ED physicians (Pogue, 2014). Likewise, in the first
national study of out-of-network billing, Cooper and Scott Morton (2016) analyzed data from a
large commercial insurer and found that 22% of in-network ED hospital visits included a primary
physician claim from an out-of-network doctor. Using completely different data, Garmon and
Chartock (2016) found that 20% of ED cases delivered to privately insured patients involved an
out-of-network physician.
There appear to be two forms of out-of-network billing. The first arises from frictions in
contracting, such as transaction costs that make it difficult for a physician to enter into a contract
with every possible insurer who covers patients they happen to treat that year. Indeed, given the
stochastic nature of ED visits, it is not surprising that some out-of-network billing occurs.
Physicians could contract with most insurers in their area, but might see a patient from out-of-
state with coverage from an insurer who does not have a large market presence in their area. By
contrast, the second form of out-of-network billing, as we discuss, is likely a deliberate strategy
to increase physician compensation, since out-of-network payment rates are significantly higher
than in-network rates.
In general, most patients face higher co-insurance rates when they see out-of-network
physicians and some insurance policies do not cover out-of-network care at all. When an insured
patient sees an out-of-network physician, there are three potential outcomes. First, the insurer
may pay the physician’s out-of-network bill in its entirety. This will protect the patient, but
ultimately, insurers will pass the cost of these higher payment rates onto all beneficiaries in the
form of higher premiums. It should also be noted that patients generally face higher co-insurance
rates when they see an out-of-network provider. As a result, even if their insurer pays their
physician his charge, the patient may still face substantial cost sharing. Second, the insurer may
pay the out-of-network physician his usual and customary rate, which the insurer calculates
based on average charges for the services provided. This payment is generally lower than the
total billed amount. When this occurs, the physician may accept the usual and customary rate the
insurer is offering and move on. Alternatively, the physician may pursue the patient to pay the

9
difference between their charge and whatever the insurer paid. This is referred to as ‘balance
billing’. Third, the insurer may not cover the costs of out-of-network care at all, leaving the
patient to pay the entire physician bill herself. As we show later from our data, these physician
bills can be extremely large.
3. Data and Descriptive Statistics on Out-of-Network Billing
3.1 Data
In this study, we use claims data from a large commercial insurer that covers tens of millions of
lives annually. Our data run from January 1, 2011 through December 31, 2015. The data are
structured at a service-line level and include detailed patient characteristics, a provider identifier,
and the ability to link to a range of third-party datasets. We define ED episodes as those with a
physician service line that includes a Current Procedural Terminology (CPT) code for emergency
services and a hospital revenue code associated with an emergency visit.4 We limit our analysis
to episodes that occurred at hospitals registered with American Hospital Association, so we do
not include, for example, treatment that was delivered at urgent care clinics.
At baseline, our data include 13,444,445 episodes. We introduce several sample
restrictions to our data to produce an analytic dataset. First, we exclude episodes that were
missing an AHA hospital ID or did not come from an AHA-identified hospital. The analysis is
thus focused only on hospital-based ED care. This restriction eliminates 1,908,710 episodes.
Second, we exclude episodes where the same physician billed as in-network and out-of-network
on separate service lines within the same claim form. This restriction eliminates 264,636
episodes. Third, we exclude episodes with duplicative insurer payments, insurer payments that
were negative, or episodes where the insurer paid $0 because the claims were denied. This
restriction removes 217,267 episodes. Fourth, we exclude episodes where the start date of the
episode occurs after the end date of the episode. This restriction excludes 79 episodes. Fifth, we
limit our analysis to hospitals that delivered ten or more episodes per year and appear in all five
years of the data. This restriction excludes 330,312 episodes. Sixth, we limit our analysis to
4 We identify ED claims for physicians as those that include a CPT code of 99281, 99282, 99283, 99284, 99285, or 99291 and a hospital service line as those with a revenue code of 0450, 0451, 0452, 0453, 0454, 0455, 0456, 0457, 0458, or 0459. We require episodes in our analysis to have both a physician service line with an ED code and a facility service line with an ED code.

10
individuals who had six months of continuous enrollment before their emergency episode.5 This
restriction excludes 1,810,245 episodes from our analysis. Finally, we winsorize the top and
bottom 1% of prices in our data.6 We do this to limit the influence of idiosyncratically high-
priced and low-priced episodes.
In our data, we observe the amount the ED physician submitted as a charge, the allowed
amount that the insurer paid the physician, and patients’ co-insurance payments, co-payments,
and spending under their deductibles. We define the total amount an ED physician was paid as
the sum of the insurer payment, patient coinsurance payment, patient copayment, and the patient
deductible on physician service lines that have a CPT code for emergency services. 7 We
calculate facility payments as the sum across the whole episode of the insurer payment, patient
coinsurance, patient co-payment, and patient spending under their deductible.8 Unfortunately, we
do not observe whether or not patients were balanced billed by physicians, so it is possible that
the physician collects more in total than we can measure.
In addition, we construct an indicator for whether or not imaging occurred during an
episode based on whether or not there are facility claims with revenue codes associated with
imaging studies.9 Likewise, we identify episodes as involving an admission to the hospital if the
facility claim for the episode includes a revenue code for room and board fees.10
For each episode, we also observe the patient’s sex, age (measured in 10-year age bins),
and race (white, black, Hispanic, and other). We also use our claims data to measure historical
patient spending for six and twelve month periods preceding an episode. Because we do not want
the emergency episodes we are analyzing to feed into the historical spending measures, we
measure spending from two-weeks before the admission date on an episode back six and twelve
months. In addition, we used six and twelve months of claims data to calculate Charlson
measures of comorbidity (Charlson et al., 1987).11
5 We did so because we wanted to have the ability to control for patients’ historical spending and comorbidity. 6 Our results are robust to not winsorizing prices, but there are extremely large hospital and physician charges and payments. 7 These are service lines with a CPT code of 99281, 99282, 99283, 99284, 99285, or 99291. 8 All prices are put in 2015 dollars using the BLS All Items Consumer Price Index. 9 We identified episodes that included imaging studies based on whether or not the facility claims had a service line with revenue codes of 350-352, 610-619, 400-404, or 409. 10 We identified room and board fees based on the following revenue codes on facility claims: 100,101,103, 110-160, 164, 167, 169-176, 179, 190-194, 199-204, 206-214, 219, 658, or 1000-1005. 11 We pooled individuals with a Charlson score of six and higher.

11
3.2 Identifying Where EmCare and TeamHealth Have Contracts
EmCare and TeamHealth bill using their contracted physicians’ NPI numbers. As a
result, our claims data do not indicate that a particular claim is being billed by a physician
employed by one of these firms. To identify the hospitals where EmCare and TeamHealth have
outsourcing contracts, we use data from the firms’ own webpages and documents from a report
produced by a leading financial firm. We require two independent sources of information to
classify a hospital as a facility that outsourced its ED services to EmCare and TeamHealth.
We rely on maps with approximate firm locations to provide the first source of
information on which hospitals are affiliated with EmCare and TeamHealth. Envision, the parent
company of EmCare, posted a map on their webpage that included the approximate location of
each of the hospitals where EmCare has a contract (see Appendix Figure 1A). The map on its
webpage included embedded latitude and longitudes within the webpage’s underlying code,
which we use to identify hospitals. Likewise, we use a map from TeamHealth’s initial public
offering in 2009 that shows the locations where TeamHealth had contracts in 2009 (see
Appendix Figure 1B) (TeamHealth, 2009). To identify hospital locations on the map, we scrape
the map using mapping software from ArcGIS12.
The second source of information we use to identify hospitals that contract with EmCare
and TeamHealth comes from job advertisements. Each firm posts job advertisements for
physicians on their respective webpages (see an example in Appendix Figure 2). The job
advertisements include the name of the hospital where physicians are being recruited and the
specialty of the physicians they are looking to hire. We scraped the name of hospitals and the
specialty of the physicians being recruited from all job postings posted by each firm that were
available from the firms’ webpages and webpage histories.
Ultimately, we identify a hospital as having a contract with EmCare or TeamHealth if we
are able to both identify the hospital on a map of the outsourcing firms’ locations and we found a
job hiring post for the hospital. This strategy exploits the fact that these firms generally wholly
take over an ED and participate in exclusive contracts with hospitals (Deutsche Bank, 2013).
12 To obtain the latitude and longitudes of hospital locations displayed on the Morgan Stanley Report map, we utilized georeferencing within ArcMap. This technique aligns a map with a known coordinate system to the map of interest (which has no identified coordinate system). After transforming and overlaying the two aligned maps, we then obtain coordinate estimates of each marked hospital with a reasonable range of accuracy.

12
Using this strategy, we are able to find 194 hospitals associated with EmCare and 95
hospitals affiliated with TeamHealth. As a result, of the 3,345 hospitals in our analysis that meet
our sample criteria, 5.8% outsource their ED to EmCare and 2.8% outsource their ED to
TeamHealth. Based on investor reports on EmCare and TeamHealth, our sample of hospitals
with contracts with EmCare and TeamHealth represent an undercount of the total population of
hospitals that have contracts with EmCare and TeamHealth. Appendix Table 1 provides
characteristics hospitals that outsource their ED services to EmCare and TeamHealth. Fifty-six
percent of hospitals we identify as affiliated with EmCare were private and for-profit, versus
19% in our general sample. The hospitals with EmCare affiliations are also smaller and less
likely to be teaching hospitals.
We will exploit the change in status of a hospital’s ED when its contract with EmCare or
TeamHealth begins. To do so, we identify hospitals where these firms entered into an
outsourcing contract in the years between 2011 and 2015. To identify the hospitals where
EmCare and TeamHealth entered into outsourcing contracts, we searched both companies’
webpages for press releases announcing new contracts. Likewise, we used LexusNexus and
Google to search the popular press for news stories that announced when either EmCare or
TeamHealth entered into a hospital. Using this strategy, we find evidence that during our time
period (2011 through 2015), EmCare entered into contracts with 16 hospitals that were part of 7
health systems while TeamHealth entered into contracts with 10 hospitals that were part of 5
systems (See Appendix Table 2). As we demonstrate in Appendix Table 3, the characteristics of
the hospitals where EmCare and TeamHealth entered are similar to the characteristics of the
sample of EmCare and TeamHealth hospitals that we observe in the cross-section.13 The lone
statistically significant difference at p < 0.05 is that the hospitals where entry occurred are larger
than the wider sample of EmCare facilities. Likewise, hospitals were EmCare entered have more
technology than hospitals in our general sample of EmCare hospitals (p < 0.10). There are no
statistically significant differences between the TeamHealth entry hospitals and the wider sample
of TeamHealth hospitals that we analyze in the cross-section.
3.3 Summary Statistics for Our Data
13 Insurer share captures the market share of our data supplier in the county in which the hospital is located.

13
Our final dataset is composed of 8,913,196 ED episodes funded by one large national insurer and
delivered between January 1st 2011 and December 31st 2015 (see Table 1). Our data capture
nearly $28 billion in emergency spending. Almost every episode in our data occurred at an in-
network hospital. In our data, 76.7% of individuals with an ED episode had insurance from an
administrative services only (ASO) insurance product, while the balance had coverage from fully
insured plans. Appendix Table 4 includes descriptive statistics for our analytic sample of ED
episodes. The average physician charge was $614.92. Physicians received, on average, 67% of
their charge and were paid $412.09 for each case. The average facility claim had a charge of
$6,642.39 and was paid $2,850.62 We find that 9% of patients who attended an ED were
admitted to the hospital, and 28% of episodes involved some form of imaging. Finally, we find
that among the five common ED physician CPT codes, 35% of cases were coded using the code
for the most intensive services (CPT 99285), whereas 5% were coded using the code for the least
intensive services (CPT 99281).
3.4 Descriptive Statistics on Out-of-Network Billing
Consistent with our results in Cooper and Scott Morton (2016), as we illustrate in Table 2, the
average out-of-network rate nationally from 2011 through 2015 was 22%. We find that the
median out-of-network billing rate, by hospital, was 26% and the rate of out-of-network billing
for hospitals in the 75th percentile of the distribution of out-of-network billing rates was 48%.
Together with Figure 1, which shows the distribution of out-of-network rates across hospitals in
2011, these show that there is a small group of hospitals with high rates of out-of-network
billing. Indeed, we find that 15% of hospitals have out-of-network rates of over 80%
There is also significant variation in out-of-network rates across regions in the US.
Appendix Figure 3 shows the distribution of out-of-network rates across hospital referral regions
(HRRs) in the US. 14 Out-of-network rates are particularly high in Texas (46.3%), Florida
(24.8%), and southern states such as Alabama (33.3%), Louisiana (34.9%), Mississippi (32.0%),
Georgia (30.0%), and North Carolina (27.6%). Out-of-network rates, on average, have been
falling over time. The rate dropped from 27.3% in the first quarter of 2011 to 17.6% in the fourth
quarter of 2015 (see Appendix Figure 4). The drop in out-of-network rates over time came from
14 A hospital referral region (HRR) is a geographic area defined by researchers at the Dartmouth Institute for Health Care Policy that captures the area where a patient may be referred for major cardiovascular surgery or neurosurgery. For more information, see dartmouthatlas.org.

14
hospitals located in both the upper end of the distribution (hospitals with out-of-network rates
above 80%) and the bottom end of the distribution (hospitals with out-of-network rates below
20%) reducing their out-of-network rates (see Appendix Figure 5).
As Appendix Table 5 illustrates, the potential costs that patients face if they see an out-
of-network ED physician is substantial. The average physician payment for an in-network ED
visit in our sample was $326.70, which is 266% of the Medicare payment for these services.15
The average charge for out-of-network physicians was $785.91 (637% of Medicare). We
calculate patients’ potential balanced bill as the difference between insurers’ in-network
payments and physicians’ out-of-network charges on the same bills. We estimate that if the
insurer paid out-of-network physician claims at in-network rates and the patient was responsible
for the balance, the average patient would face a potential balanced bill of $448.78.
3.5 Generalizability of Our Data
Our data come from a single insurer that operates across all fifty states. Our data capture nearly
$28 billion in economic activity, so it constitutes an interesting sample to study regardless of
generalizability. However, to gauge the generalizability of our results, we compare the out-of-
network rates we observe to out-of-network rates presented in Garmon and Chartock (2016) (the
only other study that examines out-of-network rates nationally)16 Garmon and Chartock use 2007
to 2014 data from the Truven Health MarketScan database. They focus on whether patients at in-
network hospitals saw any out-of-network physicians. This is slightly different from our
measure; we focus on the network participation of the primary physician on ED cases at in-
network hospitals. Garmon and Chartock (2016) find that emergency cases that had an admission
had out-of-network bills in one in five cases; outpatient emergency cases had out-of-network
bills in 14% of cases. These results are fairly similar to our findings. They find out-of-network
rates for admitted patients in in Florida, Texas, and New York of 37%, 34%, and 35%
respectively. For those same states, when we focus on patients with an admission, we observe
out-of-network rates during the 2011 to 2015 period of 25.6%, 42.4%, and 14.1%, respectively.
They also find, like we do, that out-of-network rates are decreasing over time.
15 These results differ somewhat from results presented in Cooper and Scott Morton (2016) because, in this version, we winsorize the top and bottom 1% of all payments. 16 Cooper and Scott Morton (2016) is a national study, but it uses the same data used in this analysis.

15
4. Modeling Surprise Out-of-Network Billing
4.1 Incentives for Physicians to Engage in Out-of-Network Billing
Below, we present a simple model of the decision by a physician or physician group to contract
with an insurance company.
A physician or physician group, indexed by i, considers the incremental profit it will
obtain by failing to sign a contract with an insurer, m, and instead providing services out-of-
network within hospital h. The physician can charge an out-of-network price (the charge) po that
is weakly higher than their in-network rate pn. In a standard market with downward-sloping
demand, the physician would experience a decline in the number of patients she treats due to the
higher out-of-network price. However, because we are modeling ED physicians, we make the
more realistic assumption (for this setting) that demand is inelastic.17 Therefore, if the physician
does not enter into an insurance network and charges po, she obtains a quantity of patients that is
equal to what she would receive if she were in-network, such that qo = qn. The physicians face
some cost c(qo) to billing out-of-network. We do not model this cost, but it could include fixed
costs, such as the physicians’ own intrinsic dislike of the practice, potential peer pressure or
disutility from colleagues, an unpleasant meeting at the hospital to explain the practice, and the
cost of better software and staff necessary to collect po. There are also potential variable costs of
out-of-network billing, such as more costly communications with patients, hospitals and insurers,
and the costs of collecting on each individual bill.
Ultimately, in deciding whether to bill out-of-network, each physician i considers the
incremental revenue from engaging in the practice for each hospital and insurer with which she
interacts:
(1) ∆Revi,h,mOON= pi,h,m
o qi,h,mo - pi,h,m
n qi,h,mn .
This can be re-arranged, yielding:
(2) ∆Revi,h,mOON= pi,h,m
o - pi,h,mn qi,h,m
n + pi,h,mo (qi,h,m
o -qi,h,mn ).
17 We posit that demand is inelastic because ED physicians are not chosen by patients and cannot be avoided. Previous studies have exploited the fact that patients do not choose ED physicians as a source of plausibly exogenous variation in work assessing the impact of seeing physicians with greater or lower likelihood of prescribing opioids and seeing physicians at the end of their shift (Barnett et al., 2017; Chan, 2015).

16
The crucial observation we noted above is that within the emergency context, patients choose a
bundle that includes physician and facility services and have no choice over their individual
emergency physician. As a result, , , = , , . When this holds, Equation (2) simplifies to:
(3) ∆Revi,h,mOON= pi,h,m
o - pi,h,mn qi,h,m
o ,
for any given provider, where the key parameter determining revenue gains is the increase in
price that the physician can obtain from going out-of-network. Summing over hospitals and
subtracting the cost of out-of-network billing leads to the net profit for physician i to be out-of-
network for any insurer m:
(4) ∆πi,mOON= ∑ [ pi,h,m
o - pi,h,mn qi,h,m
oHh=1 - ci,h,m(qi,h,m
o )],
It is worth discussing where the out-of-network rate, , , , comes from. It is the
physician charge and it is not competitively set (Reinhardt, 2006). Previous research shows that
health care providers’ charges have little correlation to their negotiated rates and are not
influenced by bargaining leverage (Cooper et al., 2015). Bai and Anderson (2017) found that
physicians who are not generally chosen by patients (ED physicians, anesthesiologists, and
radiologists) have the highest charges relative to their actual payment rates. If demand is truly
inelastic, then the out-of-network charges must be constrained away from infinity by factors such
as the possibility of negative media coverage, negative public opinion, and the threat of
litigation.
In our setting, we think ED management firms may have greater awareness of the
intricacies of physician payment and better understand the benefits of setting higher charges than
individual physicians operating in small group practices. Previous work from Clemens et al.
(2016) show that individual physicians and physicians in small groups tend to set commercial
prices that follow Medicare rates. In contrast, physicians in large group practices tend to have
payment rates that are less strongly correlated with Medicare payment rates. Other market
characteristics that reflect supply and demand, such as the number of physicians per capita, and

17
market structure measures such as hospital, physician, and insurer Herfindahl Hirschman Indexes
(HHIs) are likely to impact competitive prices (pn). If po is not responsive to market
characteristics, then the difference between the two prices will change with physicians’ in-
network payments and therefore the profit gain from moving out-of-network.
4.2 Incentives Facing the Insurer in Forming a Network
The insurer faces a tradeoff between including more physicians in its network and the higher
price it would need to pay in order to contract with these physicians. The decision about how
broad a network to create is a function of the preferences’ of buyers (these are employers who
purchase insurance plans on behalf of their employees and individuals who purchase insurance
products in the individual market). A more complete physician network might be attractive to
employers despite the cost. Alternatively, employers might be very responsive to the higher
premiums needed to increase the ED physician network, and inattentive to the benefits of its
breadth. A third view of the employers’ preferences is that out-of-network ED physician billing
may function as a very high co-payment for ED visits, which employers may actually like
because it holds down utilization. Because we cannot observe the preferences of individuals and
employers buying insurance, in this paper our model will omit the impact of the size of the ED
physician network on employer demand for the plan. The incentives for the insurer become very
simple when we omit the consumers’ response to network size, but the model nonetheless yields
useful insights.
The remaining cost to the insurer if it does not include a physician in its network is the
high payment rates it will have to make to the out-of-network physician who treats the insurer’s
customers. Without a contract between an insurer and a doctor, there is no competitively set
price. In these instances, the physician typically attempts to set the missing price by sending a
bill with a charge on it; the insurer attempts to set the missing price by offering to pay either its
standard contractual payment or their “usual and customary” payment.18 It is likely that the
physician charge is significantly higher than usual and customary rates and in-network payment
rates, so they two sides may not reach an agreement. These disputes can be handled via litigation
or by forcing patients to pay for the difference between what insurers are willing to pay and
providers are willing to accept. States can also regulate the missing price. At present,
18 Usual and customary payments are typically set at the average physician charge in a market.

18
approximately a quarter of states have introduced some form of legislation designed to address
out-of-network billing.19 In these states, the out-of-network payment rate that the insurer will pay
is largely determined by states’ policies, which, for the most part, seek to regulate the missing
price.
In New Jersey, for example, insurers are required to pay physicians’ charges if one of
their beneficiaries sees an out-of-network doctor (Avalere Health LLC, 2015). Therefore, we can
deduce that insurers in New Jersey would prefer to enroll physicians in their networks at a
market price, but physicians have no financial incentive to join such a network. Without
significant costs from going out-of-network, a physician would prefer to be paid at , , rather
than accepting the lower network price. This type of policy raises the cost of emergency services,
which will be passed along to consumers in the form of higher premiums.
In states such as California and Maryland, the insurer is required to pay the maximum of
a fixed percentage of the Medicare payment rate (usually 125% of the Medicare rate) or the usual
and customary charge (the average provider charge). Because physician charges are completely
under the control of physicians and are not the result of any market interaction, when the law
makes market prices out of physician charges, it creates an incentive for providers to inflate their
charges. As a result, we overwhelmingly observe that usual and customary rates (which reflect
physician charges) are greater than 125% of Medicare. If, counterfactually, the state’s required
payment were below the market price, the insurer would have no incentive to include physicians
in a network at market prices.
In New York State, a 2014 law was passed that stipulates that if physicians and insurers
cannot agree to a rate to cover out-of-network care, they will enter binding, “baseball rules”
arbitration based on the existing paper trail (Department of Financial Services, 2015). Under this
system, the physician sends a bill with their requested charge and the insurer either pays that
amount or offers its usual and customary rate. If no agreement is reached, the bill moves to
arbitration. The patient may not be billed and an arbitrator choses one of the two offers (either
the physician charge or the insurer’s usual and customary rate). Under these circumstances,
, , should move closer , , but may not equal market rates in any given case because of
imperfect information, measurement error, or other frictions.
19 The nature of state policies vary dramatically both in terms of which insurance products they regulate (e.g. HMOs versus PPOs) and in how and if they seek to determine appropriate out-of-network payment rates.

19
These policy interventions represent solutions that states have come up with to fill in the
missing price in the market. The price states choose to set is inevitably not the market price an
insurer-physician pair would arrive at via standard negotiation. When providers (or insurers)
anticipate that they will do better from the regulated price than the market price, they have an
incentive to stay out (be kept out) of the insurer’s network. As a result, state laws designed to
address surprise billing can lead more physicians to opt out of joining networks.
4.3 Incentives Facing the Hospital
A hospital does not benefit directly from physicians engaging in out-of-network billing. Instead,
hospitals experience costs from having out-of-network physicians work inside their facilities.
These costs include reputational harm from patients who receive a surprise bill and attribute it to
the hospital, the costs of dealing with aggrieved patients, and a decline in their reputation with
insurers, who may be more likely to omit them from networks. These costs of out-of-network
billing should be juxtaposed with the costs of having in-network physicians, which might include
recruitment and training.
The change in profit to a hospital of having out-of-network billing occur inside its facility
is therefore only a function of the differential costs that the hospital incurs from this practice,
where:
(4) ∆πi,h,mH = C qi,h,m
o , qi,h,mn .
For a hospital to avoid taking action to stop out-of-network billing by physicians, the physicians
would need to compensate the hospital with a transfer, T, which must be weakly higher than the
hospital’s increased costs, such that:
(5) Ti,h,m≥C qi,h,mo , qi,h,m
n .
These transfers could take the form of physicians allowing the hospitals to share in physicians’
profits (e.g. by allowing them to enter into joint ventures) or via increases in facility fees that
result from increased testing rates, imaging rates, or admissions to the hospital. Recall that,

20
ultimately, physicians control patient utilization and what gets billed by the hospitals. As a result,
ED physicians have significant influence over hospitals’ revenue.
5. Cross-Sectional Variation in Out-of-Network Billing
5.1 Lasso and Within HRR Variation in Hospitals’ Out-of-Network Billing Rates
To assess the factors driving the variation in hospitals’ out-of-network billing rates, we follow
the approach of Finkelstein et al. (2016) and run a Lasso regression on a range of hospital
characteristics, local area characteristics, physician market characteristics, and hospital market
characteristics (a complete list and description of variables that we include in our first-stage
Lasso are available in Appendix 1). We also include indicator variables for whether or not
EmCare and TeamHealth had contracts with hospitals. The Lasso method applies a penalizing
parameter to the coefficient of the explanatory variables included the regression. We use 10-fold
cross-validation to choose the penalizing parameter that minimizes the mean squared error. We
use this Lasso procedure to select a set of variables that we include in a second stage least
squares regression that we run with year fixed effects.
Figure 2 presents our least squares estimates of variables selected using Lasso. We have
also included several variables not included by the Lasso but which our model indicates should
be in the regression because they affect the profitability of moving out-of-network. These include
a measure of physicians per capita, and hospital, physician, and insurer Herfindahl Hirschman
Indexes (HHIs).20 We have standardized all continuous variables so that they have a mean of
zero and a standard deviation of one. For continuous variables, the point estimates show the
effect of a one standard deviation change in the measure. For binary variables, the point estimate
illustrates the impact of having the variable take a value of one. These results are descriptive
(e.g. not causal) and illustrate the partial correlates of hospital out-of-network billing rates.
20 We created hospital HHIs for each hospital registered with the AHA. For each hospital, we drew a circle with a radius of 15-miles around each hospital We calculated an HHI within that circular area where the total market was the total number of hospital beds within that area and a firm’s market share was its share of total beds in that area. We constructed insurer HHIs for each county using data from the HealthLeaders Insurance data. We defined the total market as the covered lives in the small and large group market. A firm’s market share was its share of the total lives in that county in the small and large group market. We used physician HHIs measured at the county level, which we were graciously given by Loren Baker. The methods used to build these measures are described in Baker et al. (2014). We construct measures of physician per capital using physician information from the SK&A database and population data from the US Census Bureau.

21
As Figure 2 shows, the outsourcing firms are by far the most important predictors of out-
of-network billing rates across hospitals. When EmCare manages a hospital’s ED, the out-of-
network rate is higher by 24 percentage points. In contrast, outsourcing a hospital’s ED to
TeamHealth is associated with a nine percentage point lower level of out-of-network billing.
In addition, we find that non-profit hospitals, government hospitals, and teaching
hospitals have lower rates of out-of-network billing. Larger hospitals also have lower rates of
out-of-network billing. Hospital concentration is associated with a 2.9 percentage point higher
level of out-of-network billing. There is, however, not a precisely estimated relationship between
insurer HHI and out-of-network billing. We also do not find a precisely estimated relationship
between ED physicians per capita, physicians per capita, physician HHI, and out of-network
billing. The higher the share of Medicare patients at a hospital, the higher the out-of-network
billing rates. We also find that hospitals with lower amounts of technology have higher rates of
out-of-network billing. Finally, we find that out-of-network billing is more common in high
population areas. Likewise, we observe lower rates of out-of-network billing in areas with low
inequality and high rates of married adults.
5.2 Within HRR Variation in Payment Rates and Out-of-Network Billing
Results from Figure 2 suggest that out-of-network billing is significantly higher at hospitals that
outsource their ED to EmCare. To complement these results, we produce additional descriptive
statistics on the within-HRR variation in payment and out-of-network rates for hospitals; we also
examine the extent to which there is a positive correlation between hospital outsourcing of ED
services and rates of out-of-network billing. To do so, we estimate:
(6) Yi,h,t= β0+ β1EmCarei + β2TeamHealthi+ σh+ μt+ εi,h,t,
where we regress in turn physician payments, hospital payments and out-of-network rates for
hospital i, located in HRR h, in quarter t against a vector of HRR fixed effects , quarter
dummies , and indicators EmCarei and TeamHealthi that take a value of 1 if a hospital has
outsourced its ED to EmCare or TeamHealth. Our EmCare and TeamHealth indicators are time
invariant. Standard errors are clustered around hospitals.

22
As we illustrate in Table 3, hospitals that outsource their ED care to EmCare have higher
physician charges, higher physician payments, higher facility charges, and higher out-of-network
rates. The scale of these effects is large. When EmCare has an outsourcing contract with a
hospital, physician payments are 36% higher than physician payment rates at hospitals that do
not outsource their ED care to the firm. Likewise, hospitals that outsource their ED services to
EmCare have out-of-network rates that are 75% higher than at hospitals that do not outsource
their ED care to the firm. Indeed, within our data, while EmCare manages EDs at hospitals
where 6.2% of the episodes in our data are performed, 13.3% of episodes with out-of-network
physician claims occurred in EmCare facilities. We note that these results are not causal, as our
outsourcing firms could be choosing to contract with a non-random set of hospitals.
Hospitals that outsource their ED care to TeamHealth also have higher physician charges
and physician payments. However, hospitals that outsource ED care to TeamHealth have out-of-
network billing rates that are 13.2 percentage points lower than hospitals that do not outsource to
the firm.
6. The Effect of the Entry of EmCare and TeamHealth on Physician Payments, Hospital Activity and Out-of-Network Billing
6.1 Estimating the Impact of Firm Entry
One explanation for our cross-sectional results is that outsourcing ED care to EmCare raises
hospitals’ out-of-network billing rates. In what follows, we provide evidence on the causal
impact that the entry of EmCare and TeamHealth into hospitals had on physician payments,
hospital payments, hospital activity, and out-of-network billing rates. To do so, we compare
hospital outcomes immediately before and immediately after EmCare and TeamHealth enter
hospitals. We exploit evidence we collected from press releases, news stories on the firms’
webpages, and articles in the popular press announcing the timing of the entry of EmCare and
TeamHealth into hospitals. In total, we analyze the entry of EmCare into 16 hospitals between
2011 and 2015 and the entry of TeamHealth into 10 hospitals during the same period. We begin
by showing trends in the raw data of hospitals where EmCare and TeamHealth entered. We
follow that up with regression-based analysis.
Because EmCare and TeamHealth appear to have different strategies, we separately test
the impact of their entries on hospital and physician behavior while constraining the specification

23
to have one constant term and set of year dummies. Our estimation equation is therefore as
follows:
(7) Yi,j,t= β0+ β1EmCare_Entryj,t+ β2TeamHealth_Entryj,t+ δj+ θt+ εi,j,t
where we estimate outcomes for episode i that occurs at hospital j in at time t. We regress this
against indicators – EmCare_Entryj,t and TeamHealth_Entryj,t - that switch on take a value of
one on and after the date the firm has taken over the management of a hospital’s ED. The
indicators return to zero on the dates that the firms exit hospitals if they lose a contract. We also
include a vector of hospital fixed effects and unique month dummy, , for each month in the
data. Our standard errors are clustered around hospitals. We interpret a discontinuous change in
hospital behavior immediately following the entry of an outsourcing firm into a hospital as the
causal impact of entry.
We compare outcomes at hospitals where the two outsourcing firms entered to outcomes
at three sets of control hospitals: 1) all hospitals nationally which did not have EDs managed by
EmCare or TeamHealth; 2) hospitals drawn from the same states where the hospitals that
experienced entry were located, but did not outsource their ED services to EmCare or
TeamHealth; 3) hospitals that were not managed by EmCare or TeamHealth that we matched to
entry hospitals using propensity scores.21
It is conceivable that EmCare and TeamHealth entered hospitals with trends in out-of-
network billing (or other outcomes) that differed from the trends in hospitals where entry did not
occur. To test for this, we also introduce a second, more flexible estimation that allows us to
follow the changes in out-of-network billing rates year by year at hospitals where entry occurred
(relative to hospitals that did not outsource their ED services) from two years before entry
occurred until two years after entry. We only have enough data to run this test on EmCare. 22
21 To calculate propensity scores, we ran a logistic regression separately for EmCare and TeamHealth where the dependent variable was an indicator variable that took a value of ‘1’ if one of the national ED staffing companies took over management of the hospital’s ED. We regressed that against hospital beds, technology, the square and cubic forms of beds and technology, and non-profit/for-profit status. The predicted values from this regression produce a propensity score for a hospital. We then use a propensity score match to determine hospitals most similar to those with entry, with the condition that matching hospitals must be in the same state. 22 Sixty percent of the entries we observe for TeamHealth occur in the final year of our data. As a result, we cannot use this flexible estimation approach to enter the effect of entry from two years before to two years after for hospitals that outsourced their ED services to TeamHealth.

24
This more flexible estimator takes the form:
(8) Yi,j,t=β0+ ∑ β1gEi,j, T+g
2g= -2 +δj+θt+εi,j,t
Where Ei,j,T+gis defined such that: Ei,j,T+g=1 from the year of entry (T)+g of EmCare onwards.
In this estimator, we analyze the outcomes for patient i who is being treated in hospital j
at time t. For EmCare, we identify the date the firm entered each hospital from 2011 through
2015. We define five distinct treatment indicators: the first switches on from two years before the
time of entry through the remainder of our data; the second switches on from one year before
entry through the remainder of our data; the third switches on from the time of entry through the
remainder of our data; the fourth switches on from a year after the data of entry through the
remainder of our data; and the fifth switches on from two years after the data of entry through the
remainder of our data. The coefficients on the entry variables tell us the incremental change in
the outcome variable from one year to another. We measure the incremental impact annually
from two years prior to the entry of EmCare until two years after the firm entered a hospital. We
also include a vector of hospital fixed effects and unique month dummies, , for each month
in the data.
6.2 Identifying the Impact of EmCare Entering a Hospital
As we illustrate in Appendix Figure 6A, the mean out-of-network billing rate for
hospitals managed by EmCare is 62%. However, the hospitals that EmCare entered between
2011 and 2015 can be divided into two groups based on their pre-entry out-of-network billing
rates. The first group includes eight hospitals that have out-of-network rates below 10.1%. The
second group includes eight hospitals that have out-of-network rates above 97.7%. Obviously
there is no scope to increase out-of-network rates in this latter group. As a result, when we
estimate equations (7) and (8), we focus on the impact of entry on out-of-network billing
separately for hospitals EmCare entered that had out-of-network rates below 10.1% versus those
with out-of-network rates above 97%.
In Figure 3, we plot the raw, quarterly average out-of-network rates by hospital at the
hospitals where EmCare entered between 2011 and 2015. We present data from the four quarters
before and four quarters after EmCare took over the management of the hospitals’ EDs. The
vertical hashed red line indicates, based on public reporting, the date EmCare took over

25
emergency care at the hospital. It is clear from the figures that almost immediately after EmCare
took over the management of hospital EDs, physician out-of-network billing rates increased to
nearly 100%. In almost all cases, after EmCare entered, the hospitals continued to have out-of-
network billing rates of approximately 100% through the remainder of our data.
Table 4 shows least-squares estimates of (7) where we identify the impact that the entry
of EmCare had on out-of-network rates in these two groups of hospitals. Columns 1 through 3
present the impact of the entry of EmCare into the low OON group of hospitals. These results
mirror what we observe in the raw data. Results in Table 4 show that the entry of EmCare into
these hospitals raised out-of-network rates by between 81.5 and 89.6 percentage points
depending on the control group we use.23 That is, immediately after EmCare entered these low
out-of-network rate hospitals, the out-of-network rates increased to approximately 100%. In
Columns 4 through 6, we show the rate of out-of-network billing at hospitals where EmCare
entered that already had out-of-network billing rates above 97.7% did not change. This is not
surprising because there is no room to increase out-of-network billing at these hospitals.
In Figure 4, we present the monthly hospital-level raw averages out-of-network billing
rates, physician charges, physician payments, facility charges, facility payments, the rates that
episodes involved an imaging study, the rates patients were admitted from the ED to the hospital,
and the rates that EmCare physicians billed using the highest intensity CPT code for 12 months
before EmCare entry occurred to 12 months after entry occurred for all 16 hospitals in our entry
sample (with the exception of our graph for out-of-network billing, where we only include
hospitals with out-of-network rates that were below 97% when EmCare entered). We also
include a smoothed average of the monthly values that we fitted using a local polynomial
regression. When we look at the raw monthly hospital averages for out-of-network billing,
physician charges and payments, admission rates, and rates of using the highest intensity CPT
code, there is an immediate and discontinuous change after EmCare entered the hospitals. There
is also no evidence in the raw data of changes in these outcomes prior to the entry of EmCare.
In Table 5, we present least squares estimates of Equation (7) to identify and quantify the
impact that the entry of EmCare had on physician payments and physician charges, hospital
payments and hospital charges, and hospital behavior relative to hospitals that did not contract
with EmCare or TeamHealth (in Appendix Tables 6 and 7, we recreate Table 5 using other
23 This result is robust to estimating equation (7) using logistic regression.

26
control groups).24 In Column 2, we show that when EmCare entered a hospital, it led to increases
in physician payments of $447.90. This is a 117% increase. In many instances, the insurer
supplying our data pays the entirety of physicians’ out-of-network bills, so the amount paid in
those instances matches the physician charges. However, to the extent that the payer does not
pay the entire increase in physician charges (e.g. they only pay usual and customary charges),
this estimate represents a lower bound of the increase in payments physicians can receive from
going out-of-network. In addition, when EmCare entered a hospital, it also increased physician
charges by $556.84 (96%). By raising physician charges, this practice could also raise usual and
customary rates in states that use usual and customary rates as the basis for physician payments
when the physician is out-of-network. Likewise, if out-of-network physicians were able to fully
collect on their charges they billed patients and insurers in every out-of-network case, this
estimate would provide the upper bound estimate of the effect of entry on physician payments.
Finally, as we illustrate in Column 8, after EmCare enters a hospital, there is also a 14.8
percentage point increase in the rate that there is a physician claim on each episode that is coded
with the CPT codes for the most intensive physician services. This represents an increase in the
likelihood having an episode coded using the most intensive physician emergency CPT code of
42.7%.
Recall that in Section 4.3, we noted that for hospitals to allow out-of-network billing to
occur, they would likely require compensation for the costs they bear from allowing the practice
to occur at their facilities. Our results presented in Table 5 are consistent with the physician
group providing a transfer to hospitals it entered. We find that following the entry of EmCare,
facility payments increased by $294.58 (10.7%). To analyze the factors driving the increase in
hospital payments, we analyze whether the entry of EmCare increased the likelihood of an
imaging study. In Column 5, we show that after EmCare entered an ED, a patient was 5% more
likely to have an imaging study performed. Also recall that hospitals make significantly more
profits when a patient from the ED is admitted. With that in mind, we test whether, following the
entry of EmCare, patients treated in the ED were more likely to be admitted to the hospital. In
Column 6, we present results showing that patients were 2.1 percentage points more likely to be
24 In one of the hospitals where EmCare entered during our sample period, the ED management contract was eventually shifted to TeamHealth. Our results are robust to whether or not we include that hospital in our analysis.

27
admitted to the hospital after EmCare entered the ED. This is a 23% increase in hospital
admissions rates.25
In Table 6, we examine the year-by-year incremental treatment effects of the entry of
EmCare into hospitals. In Column (1), we identify the impact of EmCare entry on low out-of-
network hospitals. We find that there was no difference in out-of-network rates from two years
before EmCare entry up until entry occurred. However, out-of-network rates increased by 70.7
percentage points the year EmCare entered a hospital relative to out-of-network rates the year
before entry. Likewise, from the first year after EmCare entry to the second year after entry, out-
of-network rates increased another 24.9 percentage points.26 In Table 6 Columns (2) through (9),
we show that there were also large, discrete changes in hospital and physician behavior
immediately upon EmCare’s entry into the hospital. We show that physician payments increased
by $392.06 immediately after entry (Column (3)), facility payments increased by $231.48
(Column (5)), imaging rates increased by 0.7 percentage points (Column (6)), and the rate
patients were admitted from the ED to the hospital increased by 2 percentage points (Column
(7)). We also find a discontinuous increase in the severity coding of physician claims of 13.3
percentage points immediately after EmCare entered a hospital relative to the previous year
(Column (9)). It is possible that the start dates of when EmCare took over a hospital that we
gleaned from media sources were inaccurate by several days or weeks in one direction or
another. Indeed, at one hospital, one media report noted that the previous ED outsourcing firm’s
contract ended in April, while a separate media report noted that the new EmCare contract began
in July.27 This could explain why we observe small (e.g. $67) increase in payment before entry
occurred, while the increase in payment in the entry quarter is large (e.g. $400) relative to the
prior year.
6.3 Identifying the Effect of TeamHealth Entering Hospitals
25 We observe that the entry of EmCare increases facility payments, imaging rates, hospital admission rates, and the rate that physicians bill using the most service-intensive codes for hospitals, which, prior to entry, have high and low out-of-network rates (Appendix Tables 8 and 9) 26 We can also observe a discontinuous change in outcomes following the entry of EmCare when we run the above entry regression by quarter. 27 In this case, when we examine the raw data, we observe a change in behavior after the previous outsourcing firm’s contracted ended in April. However, we have kept the EmCare start date as the date reported in media coverage.

28
Our descriptive results suggest that, unlike EmCare, TeamHealth has below average rates of out-
of-network billing. In this section, we build on our cross-sectional analysis by estimating the
causal impact that the entry of TeamHealth had on hospital and physician behavior.28
In Figure 5, we present the raw, quarterly averages of out-of-network billing rates at
hospitals where TeamHealth took over management of emergency services. Each panel presents
the trends for a single hospital. It is clear from the graphs that near our recorded entry date, there
is an increase in out-of-network billing. However, in most instances, after increasing, the out-of-
network rates fall back down again within approximately a year after entry. Indeed, in several
instances, such as with Hospital G, TeamHealth took over management of a hospital that
previously had high out-of-network rates and then immediately lowered the out-of-network
billing rates to zero. In Figure 4, we present the monthly hospital-level averages of our main
outcomes variables from one year before TeamHealth entered a hospital until one year after
TeamHealth entered. As we did in Figure 4, we also include a smoothed average of the monthly
values that we fitted using a local polynomial regression. The raw data show a clear increase in
out-of-network billing rates after TeamHealth enters the hospitals, however the rate drops down
four months late. We also observe a discontinuous increase in physician payments. Notably,
there we observe a discontinuous drop in admission rates and a discontinuous increase in total
episodes at the hospitals where EmCare entered.
Table 7 presents least squares estimates of Equation (7) where we identify the impact of
the entry of TeamHealth into hospitals. We find that after TeamHealth entered a hospital, there
was an increase in out-of-network billing of 32.6 percentage points. This is a qualitatively large
increase, although it is still approximately half the size of the out-of-network entry effect that we
observed for EmCare. Consistent with what we observed for EmCare, we also observe that when
TeamHealth entered a hospital, there was a large increase in physician charges and physician
payment rates. The payment rate for physicians following the entry of TeamHealth increases by
$269.01 (68%). 29 However, unlike the results we see for EmCare, following the entry of
TeamHealth, we do not observe an increase in facility payments. Indeed, we also see a small
decrease in imaging and the rates that patients are admitted to the hospital. However, while
28 Appendix Figure 6B shows the distribution of out-of-network rates at hospitals where TeamHealth enters during our period of analysis. 29 We present similar estimates of Equation (7) for the entry of TeamHealth using alternative control groups in Appendix Tables 10 and 11.

29
facility payments do not increase, we observe a 30.5% increase in the number of patients the
TeamHealth EDs treated following entry. This output expansion could be welfare improving, if,
for example, it reflects a quality improvement that attracts patients from rival EDs. Likewise,
increased out-of-network billing. Recall also that the out-of-network billing increase is much
lower for TeamHealth than EmCare, so under our model, the TeamHealth transfer could be
lower.
6.4 Robustness Checks
It is possible that the entry of EmCare and TeamHealth led to subsequent changes in the case
mix of patients that hospitals treat. Indeed, both EmCare and TeamHealth advertise that a benefit
of their service is to shorten ED waiting times (Cantlupe, 2013). With shorter waiting times,
hospitals could potentially attract healthier patients who would have otherwise received
treatment at urgent care centers. Likewise, on its webpage, EmCare has highlighted its
excellence in improving the treatment of complex cases, like stroke care (EmCare, 2017). To the
extent that this improves a hospital’s reputation, it could allow that hospital to attract more
complex patients. Any changes in the case mix of hospitals EmCare entered could explain why,
after the firm entered hospitals, rates of hospital admissions, imaging tests, the rate physicians
code for the most intensive services increased.
In Appendix Table 12, we analyze the impact that the entry of EmCare and TeamHealth
had on the case mix of patients that hospitals treat. We find evidence that after EmCare entered a
hospital, the hospital attracted a sicker mix of patients. In Column (1) and (2), we show that after
EmCare entered a hospital, the six-month historical spending of its patients increased by $916.02
(15%) and the 12-month historical spending increased by $1306.16 (11%). We also find that
after the entry of EmCare into a hospital, the patients who attend the ED were 3.3 percentage
points more likely to have a non-zero Charlson co-morbidity score measured using six-months of
patient history and a 3.8% more likely to have a non-zero Charlson co-morbidity score measured
using 12-months of patient history. In contrast, following the entry of TeamHealth, hospitals
attracted seemingly healthier patients who spent $336.35 (5.4%) less in the six-months preceding
an episode and $783.08 (6.8%) less in the 12-months preceding an episode.
However, despite seeing sicker patients, we find no evidence that this change in case mix
was the driver of the increases we observe in the rate patients are admitted from the ED to the

30
hospital, imaging rates, facility spending or coding severity following the entry of EmCare into a
hospital. In Appendix Table 13, we estimate equation (7) using several different sample
restrictions and sets of controls for the health of the patients. We focus on the impact that the
entry of EmCare had on the frequency that physicians code using the most intensive emergency
CPT code. We find that even among patients with low historical spending and no comorbidities,
there was a substantial increase in the rate they had episodes that included physician claims
coded using the most high intensity CPT code. In Column (1), we estimate equation (7) with no
patient controls; in Column (2), we re-estimate equation (7) with control for patients’ age, sex,
and race; and in Column (3) we control for patients’ age, sex, race, and their Charlson co-
morbidity score. Across all three estimates, the point estimate on the impact of entry on the rate
of using the highest severity CPT code for emergency physician visits is consistent and ranges
from 0.148 to 0.151. In Column (4), we estimate equation (7) and limit our analysis to patients
throughout our sample who have a Charlson score of 0 (e.g. patients who have no comorbidities).
In Column (5), we estimate equation (8) and limit our analysis to patients throughout our data
who have a non-zero Charlson score. The point estimates in Columns (4) and (5) illustrate that,
whether or not they had comorbidities, patients were almost equally more likely to have
physician visits coded using the most intensive emergency CPT code after EmCare entered a
hospital. Likewise, in Columns (6), (7), and (8), we estimate Equation (7) on the samples of
patients in the lower third ($0 - $279.67), the middle-third ($279.68 - $2,033.59), and the top-
third ($2033.6 - $115,499.3) of the distribution of historical six-month patient health spending.
Across all three sub-samples, the entry of EmCare led to an increase in the rate patients had
physician claims coded using the most severe emergency CPT code.
In Appendix Table 14, we repeat this analysis and examine the impact of the entry of
EmCare on facility spending across different samples of the data. We see that there was
increased facility spending across patients with and without comorbidities and with high and low
historical spending. Likewise, controlling for patients’ comorbidities does little to alter the
impact of the entry of EmCare on facility spending. In Appendix Table 15, we see similarly
robust findings for imaging studies. After the entry of EmCare into a hospital, patients with no
comorbidities are 4.9% more likely to receive an imaging study.
Finally, in Appendix Table 16, we analyze whether we observe higher hospital admission
rates for patients with low historical spending and no comorbidities following the entry of

31
EmCare. In Column (4), we find that after EmCare entered a hospital, patients with no
comorbidities were 20% more likely to be admitted to the hospital. In Column (6), we find
patients with low historical spending (e.g. less than $279.67 in the previous six months) were
17% more likely to be admitted to the hospital after EmCare took over the management of
hospital EDs.
7. Policy Solutions to Address Out-of-Network Surprise Billing
7.1 New York State’s Laws to Address Surprise Out-of-Network Billing
On April 1, 2014, New York State passed a law designed to protect patients who receive
emergency care from out-of-network physicians. At its core, the law has two parts. The first part
of the law introduced a hold harmless provision that requires patients receiving emergency
medical care pay no more to out-of-network providers in out of pocket costs than they would pay
to providers that are in-network. The second part of the law introduced a process to determine
what providers are paid when they treat a patient and do not participate in the patient’s insurer’s
network.
The law stipulates that insurers must develop reasonable payment rates for out-of-
network care, illustrate how their out-of-network payments were calculated, and show how they
compare to usual and customary rates (Hoadley et al., 2015).30 When a patient is seen out-of-
network, the insurer makes their payment to the provider. If the out-of-network provider does not
accept the payer’s offer, she can initiate an independent dispute resolution process. The
independent dispute resolution process is judged by practicing physicians who use baseball rules
arbitration and have only two choices: they can stipulate that the provider will be paid the
insurer’s original payment or that the insurer will pay the provider’s original charge. Ultimately,
this policy disadvantages providers who bill for unreasonably high charges and punishes insurers
who offer unreasonably low initial payments. The law also encourages physicians and payers to
negotiate independently and avoid arbitration.
Ultimately, the law protects consumers from out-of-network billing. However, the law
has several shortcomings. First, the law only applies to fully-insured insurance products.
Administrative services only (ASO) plans, which account for the majority of privately insured
30 Usual and customary rates are defined in the New York State law as the 80th percentile of charges based on the Fair Health database, which captures physician charges in the states for most medical procedures.
32
products in the US, are not regulated by states and therefore are not directly impacted by this
policy (Kaiser Family Foundation, 2015). Second, if patients receive a surprise out-of-network
bill and are charged out-of-network rates, they must be aware that the protections exist and fill
out the form included in Appendix 2. This process may be too administratively complex for
some patients. Third, by benchmarking payments to physicians’ charges, the law promotes
payments on rates that are not set via competition and it creates an incentive for physicians to
inflate their charged amounts to raise average usual and customary payment calculations.
7.2 Analyzing the Impact of New York State’s Law
As Appendix Table 17 shows, our data includes 323,936 ED episodes between 2011 and 2015,
which captures approximately $1bn in emergency health care spending. 90.2% of patients in our
data in New York are in ASO products.31 To test the impact of New York State laws, we run a
difference-in-difference regression and compare New York hospitals’ out-of-network rates,
physician payment rates, and facility payment rates before and after the passage of the out-of-
network legislation to outcomes in hospitals in New Jersey, Pennsylvania, Connecticut,
Vermont, and Massachusetts. To do so, we estimate:
(9) Yi,h,t= β0+ β1NYt+ β2Postt+ β3NYt*Postt+ γh+ μt+ εi,h,t
where the dependent variable is our outcome of interest for patient i, treated at hospital h, in
quarter t. We include an indicator for whether a hospital is located in New York. This is our
treatment variable and, if the hospital is located in New York, takes a value of one for all time
periods. Postttakes a value of 1 for all periods April 1, 2014 onwards, after New York State
passed its out-of-network billing laws. Our coefficient is the coefficient of interest and
captures the interaction between our treatment variable (that a hospital is located in New York)
and our post variable, which is turned on after the out-of-network billing law was passed. All
standard errors are clustered around hospitals.32 In addition, we introduce a non-parametric
specification of equation (8) where our treatment variable is interacted with dummy variables for
31 Unfortunately, we do not have hospitals with EDs managed by EmCare or TeamHealth in our data for New York. 32 Our results are also robust to clustering around HRRs.

33
each quarter. This allows us to illustrate graphically the parallel trends between New York and
other New England States prior to the passage of the New York law.
7.3 The Impact of New York State’s Out-of-Network Billing Laws
Table 8 presents least-squares estimates of equation (9) and shows the impact of the New York
State law on out-of-network rates, hospital charges and payments, and physician charges and
payments. As Column (1) illustrates, the New York state law reduced out-of-network rates by
6.8 percentage points relative to changes observed in other New England states. Figure 7
presents non-parametric estimates of Equation (8) graphically.33 The out-of-network rates in
New York and the other New England states followed similar trends before the introduction of
the New York State out-of-network protection law in 2014. However, almost immediately after
the law was passed (and before the required implementation date), there was a marked reduction
in out-of-network billing in the state. Figure 8 shows the distribution of out-of-network rates
across hospitals in 2013 and 2015. The out-of-network rate in New York in 2013 was 20.1%.
Two years later, the rate was 6.4% and the reduction in out-of-network rates was driven by
reductions in out-of-network rates across nearly all hospitals, including those that previously had
high rates of out-of-network billing.
Columns (6) and (7) from Table 8 suggest that while the law only applied to fully-insured
insurance products, the reduction in out-of-network rates occurred for patients with fully-insured
insurance plans and those covered by ASO policies. It is likely that we see this result because
physicians cannot infer, before sending the bill to the patient or insurer, whether that patient has
an ASO or fully-insured insurance product.
Columns (2) through (5) from Table 8 illustrate the impact of the law on facility charges
and payments and physician charges and payments. As we illustrate in Column (3), the law
lowered average physician payments by $43.74 (13%). We do not find that the law had a
precisely estimated impact of facility payments.
7.4 Regulating Hospital/Insurer Contracts to Address Out-of-Network Billing
There are two core objectives that policy-makers must address when they seek to rein in out-of-
network ED billing. The first is to protect consumers from large, unexpected bills. The second is
33 This result is robust to estimating equation (7) using logistic regression.

34
to establish a price that insurers should pay out-of-network physicians for their services that is
either competitively set or is as close to the competitively set price as possible. At present, about
a quarter of states have laws aimed at addressing out-of-network billing. Most states have
included a hold harmless provision to protect patients from out-of-network bills and tried to set
out-of-network provider payment rates via regulation. However, it is extremely unlikely that a
regulated price will match the market price for any given insurer-physician pair in a particular
year. Moreover, as soon as the regulated price differs from the market price, either the insurer or
the physician will take advantage of a regulated price that favors them (e.g. insurers will cease to
build networks or physicians will cease to join networks). New York State’s laws are the most
ambitious to date and seem to be effective thus far. However, the New York law, like the laws
passed in other states, is focused exclusively on fully-insured insurance products.34 While the
New York law seems to have reduced out-of-network billing, it offers no financial protection to
individuals who have ASO insurance products.
Rather than try to regulate the price, an alternative to the current policies would be to
regulate the nature of the underlying contract. When patients choose an ED, they are choosing a
“bundle” of emergency services that includes a hospital and a physician. Patients do not
separately select a physician so it is inefficient to have a separate network and consumption
decision for the physician. In lieu of the status quo, under this alternative approach, states would
require hospitals to sell and insurers to contract for an ED service bundle. That bundle would
include hospital and physician services. Under this policy, the hospital would purchase the inputs
into ED services the way it purchases other inputs like nurses. This would require the hospital to
buy ED physician services in a local labor market, which would expose both sides to competitive
forces and produce a market price for ED physicians.
With this type of policy in place, patients consuming emergency services would be
protected from surprise bills as long as they chose in-network facilities. Given that only 14.5% of
ED patients arrive at EDs via ambulance, most patients are in a position to select where they
receive emergency care (Centers for Disease Control and Prevention, 2013). Indeed in our
dataset only 1% of the ED claims we analyze are from out-of-network facilities. Moreover,
negotiation between the insurer and hospital would maintain payments for ED services that are
competitively determined. This type of policy would preserve competition at every level of the
34 States cannot regulate ASO products.

35
health system. Negotiations between hospitals and ED physicians would result in ED physician
rates that were competitive in the local labor market. Insurers would compete over premiums and
the breadth of their networks to attract customers. Hospitals would compete on price and quality
to attract patients and be included in insurers’ networks. Likewise, hospitals would compete on
physician payments in order to attract physicians to staff their EDs. Physicians would need to
compete on quality and prices in order to obtain permission to practice at hospitals.
This policy also solves the inability of states to regulate ASO products. Rather than
regulating insurance, this would be a form of hospital regulation, so it could apply to all patients
in a state regardless of the type of insurance they have. Further, the law could be implemented by
the federal government, who could make these types of ED bundles a requirement in exchange
for receiving Medicare payments.
9. Conclusions
Each year, one in five individuals in the U.S. attends an ED for medical care (Morganti et al.,
2013). What most patients with private health insurance do not realize is that the physicians
working inside a hospital may not participate in the same insurance networks as the hospital
itself. As a result, it is possible for a privately insured patient to attend an in-network hospital but
receive care from an out-of-network physician. These out-of-network bills can expose patients to
significant financial risk. These bills are particularly troubling in the case of ED care, where
patients do not choose and cannot avoid out-of-network physicians. Further, surprise out-of-
network billing undercuts the functioning of health care markets by allowing physicians who
face inelastic demand to be paid their charges, which are not set via competition.
In this paper, we find that approximately 15% of US hospitals have extremely high out-
of-network billing rates. Results from our Lasso analysis suggest that for-profit hospitals and
hospitals that outsource their ED services to EmCare, a large physician outsourcing company,
have significantly higher rates of out-of-network billing than other providers.
Our cross-sectional results motivated us to test what happens when ED physician staffing
companies enter hospitals. We assume that hospitals face reputational costs when out-of-network
billing occurs within their facility. The physicians engaging in out of network billing can offset
hospitals’ costs by giving a transfer to the hospital. In our empirical analysis, we focus on the
36
impact of entry from two national firms that are increasingly taking over the management of
hospital EDs.
We find that when both firms enter hospitals, there is a large increase in out-of-network
billing. Following the entry of EmCare, we observe that hospitals’ out-of-network billing rates
increased by between 81 and 90 percentage points. Likewise, after TeamHealth entered
hospitals, out-of-network billing rates in our data increased by 33 percentage points. Consistent
with our model, we find evidence of a transfer to hospitals following the entry of these firms. In
addition to increasing out-of-network billing, we find that when EmCare enters a hospital, it
increases the amount facilities get paid via increases in imaging rates and the rates that patients
are admitted from the ED to the hospital. We also find that after EmCare enters a hospital,
patients are 43% more likely to have physician services coded using the most high intensity, high
paying codes. We find that TeamHealth pursues a different strategy. When TeamHealth enters a
hospital, it raises out-of-network rates significantly (although out-of-network billing rates at
these hospitals drop over time after entry) and also raises hospital activity rates.
What is the appropriate policy response to surprise out of network billing? A variety of
states have implemented different policies to protect consumers. One of the most innovative was
introduced in New York. In 2014, New York State passed a law that bans balanced billing and
requires insurers and physicians to enter into binding arbitration to settle disputed bills. We
assessed the impact of this law and found that it did indeed reduce out-of-network billing.
However, the law still bases out-of-network ED payments on physicians’ charges, which are not
competitively set. In addition, the law offers no protection to individuals enrolled in ASO
insurance products, who account for approximately half of individuals with private insurance in
the US.
The fundamental problem in this setting is that there is a missing contract between the
physician and the insurer. Most states have tried to address the missing contract by setting a
regulated payment rate. However, a regulated price will, in general, not be equal to a market
price. Basic economic logic suggests that mandating the contract will achieve the efficient price
more often than choosing a regulated price. Both may protect consumers, but only the former
will restore price competition in emergency care. Rather than allowing physicians and facilities
to separately negotiate contracts with insurers, an alternative policy approach would be for states
to require hospitals to sell an ED service bundle that includes both physician and facility

37
services. In a state with this type of bundled payment, hospitals would negotiate ED payment
rates with insurers and reach competitively set prices that reflect the cost of both the physician
and the facility. Under this alternative policy, a patient using an in-network ED would be treated
by in-network physicians. Further, this alternative policy would promote competition at all levels
of the health system. Crucially, under this type of alternative policy, privately insured patients
accessing EDs in emergencies would also be fully protected from surprise bills.

38
References
Avalere Health. 2015. "An Analysis of Policy Options for Involuntary out-of-Network Charges in New Jersey," New Jersey: Avalere Health LLC. Bai, Ge and Gerard Anderson. 2017. "Variation in the Ratio of Physician Charges to Medicare Payments by Specialty and Region." Journal of the American Medical Association, 313(3), 315-18. Baker, Laurence; Bundorf, Kate; Royalty, Anne. 2014. “Physician Practice Competition and Prices Paid by Private Insurers for Office Visits.” Journal of the American Medical Association, 312(16): 1653-1662. Barnett, Michael; Olenski Andrew; Jena, Anupam. 2017. "Opioid-Prescribing Patterns of Emergency Physicians and Risk of Long-Term Use." New England Journal of Medicine, 376(7), 663-73. Board of the Governors of the Federal Reserve System. 2016. "Report on the Economic Well-Being of U.S. Households in 2015." Washington, DC: Federal Reserve. Cantlupe, Joe. 2013. "Keys to Better Flow, Better Care in Eds." HealthLeaders, 44-49. Centers for Disease Control and Prevention. 2013. "National Hospital Ambulatory Medical Care Survey: 2013 Emergency Department Summary Tables." Washington, D.C.: Centers for Disease Control and Prevention. Chan, David. 2015. "The Efficiency of Slacking Off: Evidence from the Emergency Department." NBER Working Paper No. 21002. Charlson, Mary; Peter Pompei and Kathy Ales. 1987. "A New Method of Classifying Prognostic Comorbidity in Longitudinal Studies: Development and Validation." Journal of Chronic Disease, 40(5), 373-83. Clemens, Jeffrey; Gottlieb, Joshua; Molnar, Timea. 2016. “The Anatomy of Physician Payments: Contracting Subject to Complexity.” NBER Working Paper No. 21642. Consumer Union. 2015. "Surprise Medical Bills Survey." Washington, D.C.: Consumers Union. Cooper, Zack and Fiona Scott Morton. 2016. "Out-of-Network Emergency-Physician Bills — an Unwelcome Surprise." New England Journal of Medicine, 375(20), 1915-918. Cooper, Zack; Craig, Stuart; Gaynor, Martin; Van Reenen, John. 2015. “The Price Ain’t Right? Hospital Prices and Health Spending on the Privately Insured.” NBER Working Paper No. 21815. Dalavagas, Jason. 2014. "Coverage Initiation: Envision Healthcare Holdings." Value Line.
39
Department of Financial Services. 2017. "Protection from Surprise Bills and Emergency Services." Albany, New York: New York State Department of Financial Services. Deutsche Bank. 2013. "Markets Research - Envision Healthcare." Deutsche Bank Securities Incorporated. EmCare. 2014. "Cross-Departmental Initiative Leads to Nationally Recognized Stroke Treatment Program." https://www.emcare.com/resources/case-studies/pdf/emcare6_casestudyholyoke.pdf (accessed 5/19/17). Esposito, Lisa. 2015. "Enduring Really Long Waits at the Emergency Room," U.S. News & World Report, Garmon, Christopher and Benjamin Chartock. 2017. "One in Five Inpatient Emergency Department Cases May Lead to Surprise Bills." Health Affairs, 36, 177-81. Groth, Heather; Hans House; Rachel Overton and Eric DeRoo. "Board-Certified Emergency Physicians Comprise a Minority of the Emergency Department Workforce in Iowa." Western Journal of Emergency Medicine, XIV(2), 186-90. Hamblin, James. 2015. "What Doctors Make." The Atlantic. Hamel, Liz; Mira Norton; Karen Pollitz; Larry Levitt; Gary Claxton and Mollyann Brodie. 2016. "The Burden of Medical Debt: Results from the Kaiser Family Foundation/New York Times Medical Bills Survey." Kaiser Family Foundation. Hing, Esther and Farida Bhuiya. 2012. "Wait Time for Treatment in Hospital Emergency Departments: 2009." Centers for Disease Control and Prevention, Hoadley, Jack; Sandy Ahn and Kevin Lucia. 2015. "Balance Billing: How Are States Protecting Consumers from Unexpected Charges?" Washington, D.C.: The Center on Health Insurance Reforms, Hsia, Renee; Arthur Kellermann and Yu-Chane Shen. 2011. "Factors Associated with Closures of Emergency Departments in the United States." Journal of the American Medical Association, 305(19), 1978-985. Institute of Medicine. 2006. "Hospital-Based Emergency Care: At the Breaking Point." Washington, DC: Institute of Medicine, Kaiser Family Foundation. 2015. “Employer Health Benefits Survey”. Washington, DC: Kaiser Family Foundation. McGirr, Joseph; Janet Williams and John Prescott. "Physicians in Rural West Virginia Emergency Departments: Residency Training and Board Certification Status." Academic

40
Emergency Medicine, 5(4), 333-36. Morganti, Kristy Gonzalez; Sebastian Bauhoff; Janice Blanchard; Mahshid Abir; Neema Iyer; Alexandria Smith; Joseph Vesley; Edward Okeke and Arthur Kellermann. 2013. "The Evolving Role of Emergency Departments in the United States." Rand Health Quarterly, 3(2). Peckham, Carol. 2016. "Physician Debt and Net Worth Report 2016." Medscape. Pogue, Stacey and Megan Randall. 2014. "Surprise Medical Bills Take Advantage of Texans: Little-Known Practice Creates a "Second Emergency" for ER Patients." Center for Public Policy Priorities, Rice, Sabriya. 2016. "Cutting Emergency Department Wait Times as Patient Volumes Rise." Modern Healthcare. Rosenthal, Elisabeth. 2014. "After Surgery, Surprise $117,000 Medical Bill from Doctor He Didn’t Know." The New York Times. Rosenthal, Elisabeth. 2014a. "Costs Can Go up Fast When E.R. Is in Network but the Doctors Are Not." The New York Times. Sanger-Katz, Margot and Reed Abelson. 2016. "Surprise! Insurance Paid the E.R. But Not the Doctor." The New York Times. Schuur, Jeremiah and Arjun Venkatesh. 2012. "The Growing Role of Emergency Departments in Hospital Admissions." New England Journal of Medicine, 367(5), 391-93. TeamHealth. 2009. "TeamHealth Holdings, Inc. – Initial Public Offering." Wadman, Michael; Robert Muelleman; David Hall; T.Paul Tran and Richard Walker. 2005. "Qualification Discrepancies between Urban and Rural Emergency Department Physicians." The Journal of Emergency Medicine, 28(3), 273-76. William Blair and Company. 2013. "Report: Envision Healthcare Holdings, Inc." William Blair Equity Research. Wilson, Michael and David Cutler. 2014. "Emergency Department Profits Are Likely to Continue as the Affordable Care Act Expands Coverage." Health Affairs, 33(5), 792-99.
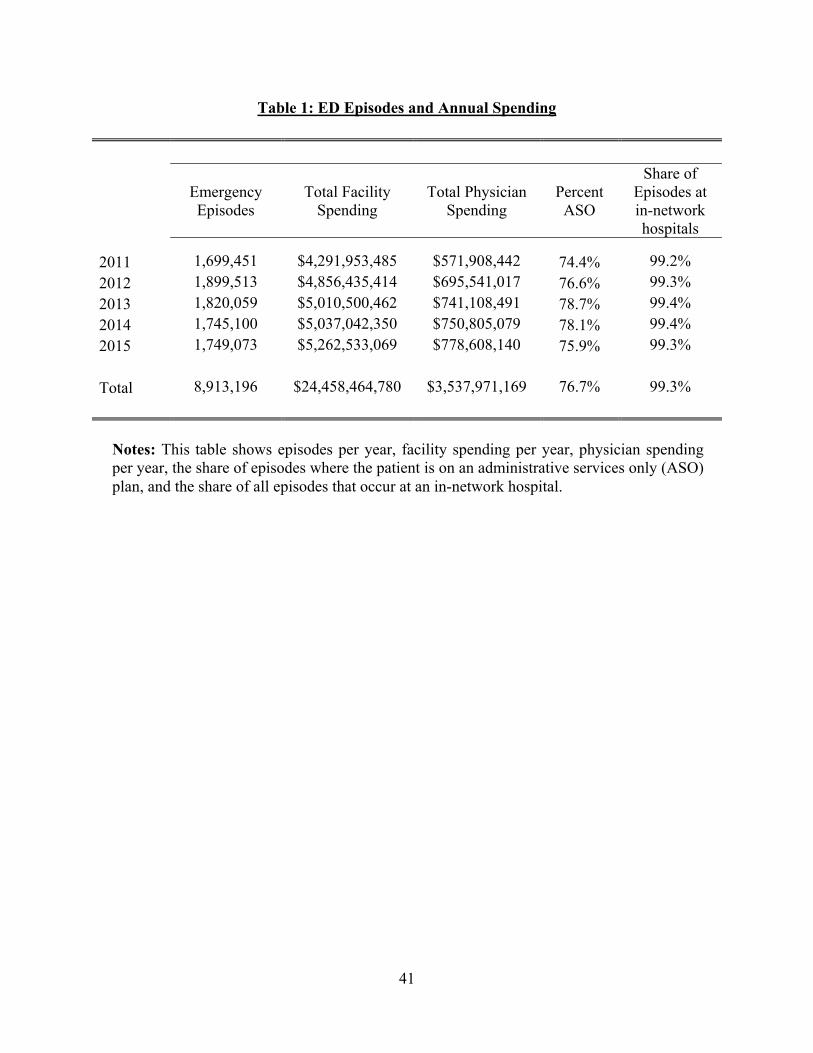
41
Table 1: ED Episodes and Annual Spending
Emergency Episodes
Total Facility Spending
Total Physician Spending
Percent ASO
Share of Episodes at in-network hospitals
2011 1,699,451 $4,291,953,485 $571,908,442 74.4% 99.2%
2012 1,899,513 $4,856,435,414 $695,541,017 76.6% 99.3%
2013 1,820,059 $5,010,500,462 $741,108,491 78.7% 99.4%
2014 1,745,100 $5,037,042,350 $750,805,079 78.1% 99.4%
2015 1,749,073 $5,262,533,069 $778,608,140 75.9% 99.3%
Total 8,913,196 $24,458,464,780 $3,537,971,169 76.7% 99.3%
Notes: This table shows episodes per year, facility spending per year, physician spending per year, the share of episodes where the patient is on an administrative services only (ASO) plan, and the share of all episodes that occur at an in-network hospital.

42
Table 2: HRR and Hospital-Level Out-of-Network Rates, 2011-2015
Mean S.D. P25 P50 P75 Max
By HRR: 290 observations
Out-of-Network ED Physician Rate
0.22 0.18 0.07 0.19 0.33 0.99
By hospital: 3,345 observations
Out-of-Network ED Physician Rate
0.26 0.35 0.00 0.05 0.48 1.00
Notes: For HRRs, we limit to those with more than 500 episodes per year from 2011-2015. HRR out-of-network rates have been weighted by the number of episodes in each HRR. We only include hospitals that are registered with the American Hospital Association, are in-network, appear in all 5 years of the data and have more than 10 episodes per year.

43
Table 3: Physician and Facility Payments and Out-of-Network Rates for Hospitals that Outsourced ED Services to EmCare and TeamHealth
(1) (2) (3) (4) (5)
Physician Charge
Physician Payment
Facility Charge
Facility Payment
OON Rate
EmCare Hospital 145.13*** 142.66*** 1116.18*** -60.72 0.166*** (25.59) (26.98) (308.65) (100.62) (0.048)
TeamHealth Hospital 97.39*** 52.46** -483.69* -170.31 -0.132*** (27.09) (25.44) (270.40) (110.39) (0.036)
HRR FE Yes Yes Yes Yes Yes Year FE Yes Yes Yes Yes Yes Mean 592.71 396.94 6394.63 2744.07 0.222 SD 375.15 309.76 12531.03 5025.05 0.416 Observations 8,913,196 8,913,196 8,913,196 8,913,196 8,913,196 R-Square 0.278 0.259 0.090 0.077 0.205
Notes: * p<0.10, ** p<0.05, *** p<0.01. This table presents least-squares estimates of Equation (6). Each observation is a patient episode. Payments and charges for physicians and facilities are winsorized at the top and bottom first percentile. EmCare and TeamHealth are indicators that denote whether an episode occurred in a facility owned by these firms. Each regression includes controls for patient age, gender, race, and Charlson score. Standard errors are clustered around hospitals.

44
Table 4: The Impact of the Entry of EmCare on Hospital Out-of-Network Rates
(1) (2) (3) (4) (5) (6)
Hospitals with Out-of-Network Rates Below 97% Prior to Entry
Hospitals with Out-of-Network Rates Above 97% Prior to Entry
OON Indicator OON Indicator
EmCare Entry 0.815*** 0.846*** 0.896*** -0.030 0.035 -0.032 (0.061) 0.073 (0.156) (0.044) (0.048) (0.060)
Hospital FE Yes Yes Yes Yes Yes Yes
Month FE Yes Yes Yes Yes Yes Yes
Mean 0.204 0.372 0.549 0.209 0.392 0.896
SD 0.403 0.483 0.498 0.407 0.488 0.306
Observations 8,351,799 1,654,456 34,876 8,401,884 1,704,541 85,741
Control All Non-
Entry Hospitals
Hospitals in Same
State
Propensity Score Match
All Non-Entry
Hospitals
Hospitals in Same
State
Propensity Score Match
Notes: * p<0.10, ** p<0.05, *** p<0.01. This table presents least-squares estimates of Equation (7) separately on hospitals with out-of-network (OON) rates below 11% (Columns 1-3) and above 97% (Columns 4-6). The dependent variable in all regressions is a binary indicator for whether a patient at an in-network hospital was treated by an out-of-network physician. Our analysis is run at the patient-level. The control groups for Columns (1) and (4) are all hospitals in the US that did not outsource their ED management to EmCare. The control groups for Columns (2) and (5) are all hospitals in same states as the treated hospitals, excluding hospitals that outsourced their ED services to EmCare. The control groups in Columns (3) and (6) are hospitals matched to treated hospitals using propensity scores calculated using entry as predicted by a treated hospital's beds, technology, and non-profit/for-profit status. Each regression includes controls for patient age, gender, race, and Charlson score. Standard errors are clustered around hospitals.

45
Table 5: The Impact of the Entry of EmCare on Payments and Provider Behavior
(1) (2) (3) (4) (5) (6) (7) (8)
Physician Charge
Physician Payment
Facility Charge
Facility Payment
Imaging Admissions Episode Count
CPT Severity
EmCare Entry 556.84*** 447.90*** 1683.63*** 294.58*** 0.014*** 0.021*** -104.0 0.148*** (62.12) (55.16) (401.04) (113.64) (0.005) (0.006) (218.1) (0.030)
Hospital FE Yes Yes Yes Yes Yes Yes Yes Yes Month FE Yes Yes Yes Yes Yes Yes Yes Yes Mean 578.95 383.64 6304.63 2744.27 0.278 0.090 1695.5 0.347 SD 364.61 297.99 12415.53 5034.47 0.448 0.286 1566.5 0.476 Observations 8,418,226 8,418,226 8,418,226 8,418,226 8,418,226 8,418,226 8,418,226 8,418,226
Control All
Hospitals All
Hospitals All
Hospitals All
Hospitals All
Hospitals All
Hospitals All
Hospitals All
Hospitals
Notes: * p<0.10, ** p<0.05, *** p<0.01. This table presents least-squares estimates of Equation (7). Each observation is a patient episode. The control group in all regressions is all hospitals in the US exclusive of those that outsourced their ED services to EmCare. We windsorized the top and bottom percentile of hospital and physician payments. Each regression includes controls for patient age, gender, race, and Charlson score. Standard errors are clustered around hospitals.

46
Table 6: Estimating the Impact of the Entry of EmCare by Year
(1) (2) (3) (4) (5) (6) (7) (8) (9) Out-of-Network
Rate
Physician Charge
Physician Payment
Facility Charge
Facility Payment
Imaging Admissions Episode Count
CPT Severity
Incremental entry effect (t-2) relative to (t-3)
0.030 -51.23 8.22 -158.46 -68.54 -0.010 -0.00003 183.9*** -0.009
(0.044) (46.86) (25.17) (211.86) (64.57) (0.007) (0.004) (50.1) (0.020) Incremental entry effect (t-1) relative to (t-2)
-0.023 111.12** 67.31*** 294.03 53.88 -0.006 0.001 21.5 0.023
(0.054) (22.83) (21.48) (284.19) (76.80) (0.008) (0.002) (127.2) (0.013) Incremental entry effect (t) relative to (t-1)
0.707*** 436.44*** 392.06*** 1192.50*** 231.48** 0.007 0.020*** -109.6 0.133***
(0.074) (63.67) (60.02) (347.75) (108.70) (0.004) (0.007) (139.2) (0.032) Incremental entry effect (t+1) relative to (t)
0.249** 98.05*** 40.63 377.80 65.34 0.019** -0.0006 -31.9 0.012*
(0.097) (20.57) (32.61) (288.58) (70.12) (0.008) (0.003) (50.9) (0.007) Incremental entry effect (t+2) relative to (t+1)
-0.016 9.41 -71.07** 761.56*** 53.12 0.002 0.001 -76.8 -0.012
(0.084) (17.43) (21.66) (205.82) (68.09) (0.009) (0.006) (55.8) (0.010)
Hospital FE Yes Yes Yes Yes Yes Yes Yes Yes Yes Month FE Yes Yes Yes Yes Yes Yes Yes Yes Yes Mean 0.204 578.95 383.64 6304.63 2744.27 0.278 0.090 1695.5 0.347 SD 0.403 364.61 297.99 12415.53 5034.47 0.448 0.286 1566.5 0.476 Observations 8,351,799 8,418,226 8,418,226 8,418,226 8,418,226 8,418,226 8,418,226 8,418,226 8,418,226
Control All
Hospitals All
Hospitals All
Hospitals All
Hospitals All
Hospitals All
Hospitals All
Hospitals All
Hospitals All
Hospitals
Notes: * p<0.10, ** p<0.05, *** p<0.01. This table presents least-squares estimates of Equation (7). Each observation is a patient episode. The control group in all regressions is all hospitals in the US exclusive of those that outsourced their ED services to EmCare.We windsorized the top and bottom percentile of hospital and physician payments. Standard errors are clustered around hospitals. Column (1) presents the estimates of entry on the sample of hospitals that have out-of-network rates below 10% prior to the entry of EmCare. In Column (1) we estimate the impact of EmCare entry on the sample of hospitals who have out-of-network rates below 11%.

47
Table 7: The Impact of the Entry of TeamHealth on Payments and Provider Behavior
(1) (2) (3) (4) (5) (6) (7) (8) (9)
Out-of-Network
Rate
Physician Charge
Physician Payment
Facility Charge
Facility Payment
Imaging Admissions Episode Count
CPT Severity
TeamHealth Entry 0.326*** 52.49 269.01*** 170.17 -52.19 -0.008** -0.006** 515.4*** 0.016 (0.030) (35.90) (19.06) (174.03) (82.70) (0.003) (0.002) (182.8) (0.015)
Hospital FE Yes Yes Yes Yes Yes Yes Yes Yes Yes Month FE Yes Yes Yes Yes Yes Yes Yes Yes Yes Mean 0.226 589.58 395.38 6400.68 2749.89 0.279 0.091 1692.1 0.346 SD 0.419 374.63 310.46 12555.33 5041.25 0.448 0.287 1557.4 0.476 Observations 8,661,796 8,661,796 8,661,796 8,661,796 8,661,796 8,661,796 8,661,796 8,661,796 8,661,796
Control All
Hospitals All
Hospitals All
Hospitals All
Hospitals All
Hospitals All
Hospitals All
Hospitals All
Hospitals All
Hospitals
Notes: * p<0.10, ** p<0.05, *** p<0.01. This table presents least-squared estimates of Equation (7). Each observation is a patient episode. The control group in all regressions is all hospitals in the US exclusive of those that outsourced their ED services to TeamHealth. We windsorized the top and bottom percentile of hospital and physician payments. Each regression includes controls for patient age, gender, race, and Charlson score. Standard errors are clustered around hospitals.

48
Table 8: Estimating the Impact of the New York State’s Surprise Billing Law
(1) (2) (3) (4) (5) (6) (7)
Out-of-Network
Rate
Physician Charge
Physician Payment
Facility Charge
Facility Payment
Out-of-Network
Rate (ASO)
Out-of-Network
Rate (Full Insurance)
NY*Post dummy -0.069** 21.46 -43.74*** -98.73 -1.21 -0.069** -0.062** (0.030) (20.74) (11.51) (148.39) (81.85) (0.031) (0.031)
Hospital FE Yes Yes Yes Yes Yes Yes Yes
Quarterly FE Yes Yes Yes Yes Yes Yes Yes
Mean 0.202 499.17 335.86 6100.52 2571.28 0.198 0.227
SD 0.401 313.11 251.95 12693.62 5122.37 0.399 0.419
Observations 905,441 905,441 905,441 905,441 905,441 787,005 116,642
R-Square 0.636 0.435 0.488 0.113 0.114 0.629 0.687
Notes: * p<0.10, ** p<0.05, *** p<0.01. This table presents least-squares estimates of Equation (9). All regressions are run at the patient level. Each estimate includes an indicator variable for whether the episode occurred in New York. The post dummy turns on in 2014 Q1 (when the NY vote was passed). Hospital and physician payments are winsorized at the top and bottom one percentile. The control states included are NJ, PA, CT, VT, and PA. Each regression includes controls for patient age, gender, race, and Charlson score. Standard errors are clustered around hospitals.

49
Figure 1: The Distribution of Hospital Out-of-Network Billing Rates in 2011
Notes: The table shows the distribution of ED physicians out-of-network rates across hospitals in 2011. The average rate across hospitals is not weighted by number of episodes. The mean hospital out-of-network rate in 2011 was 29%.

50
Figure 2: Conditional Correlates of Hospital Out-of-Network Billing
Notes: The figure shows the point estimates from a regression of hospital out-of-network rates on variables chosen from our Lasso. We used data from 2011 through 2015. Each observation is a hospital-year rate of out-of-network billing. The regression includes year fixed-effects. For continuous variables, the point estimates can be interpreted as the percentage point change in out-of-network rate for a one standard deviation increase in the explanatory variable. For binary variables, the point estimate illustrates the impact of having the variable take a value of one. To obtain these results, we first run a Lasso with all possible variables (90 in total). We then square and cube continuous variables chosen from the Lasso and run a second Lasso that includes all variables in addition to those that are now squared and cubed. We then run an OLS regression of hospital out-of-network rates on variables chosen from the Lasso. We also included measures of physician, hospital and insurer market concentration and physician group indicators.

51
Figure 3: Out-of-Network Rates at Hospitals Where EmCare Entered

52
Notes: This figure plots the average quarterly out-of-network rates at hospitals where EmCare entered. We present figures for hospitals that had out-of-network billing rates below 97% in 2011. We present data from the four quarters before and the four quarters after EmCare took over the management of each hospital’s ED.

53
Figure 4: Discontinuity Analysis at Hospitals Where EmCare Took Over Management of ED Services

54
Notes: The panels plot the monthly average by hospital from 12 months before entry to 12 months after EmCare entered the hospital. For Panel A, we limit our analysis to hospitals with out-of-network rates below 97% in 2011.

55
Figure 5: Out-of-Network Rates at Hospitals Where TeamHealth Entered
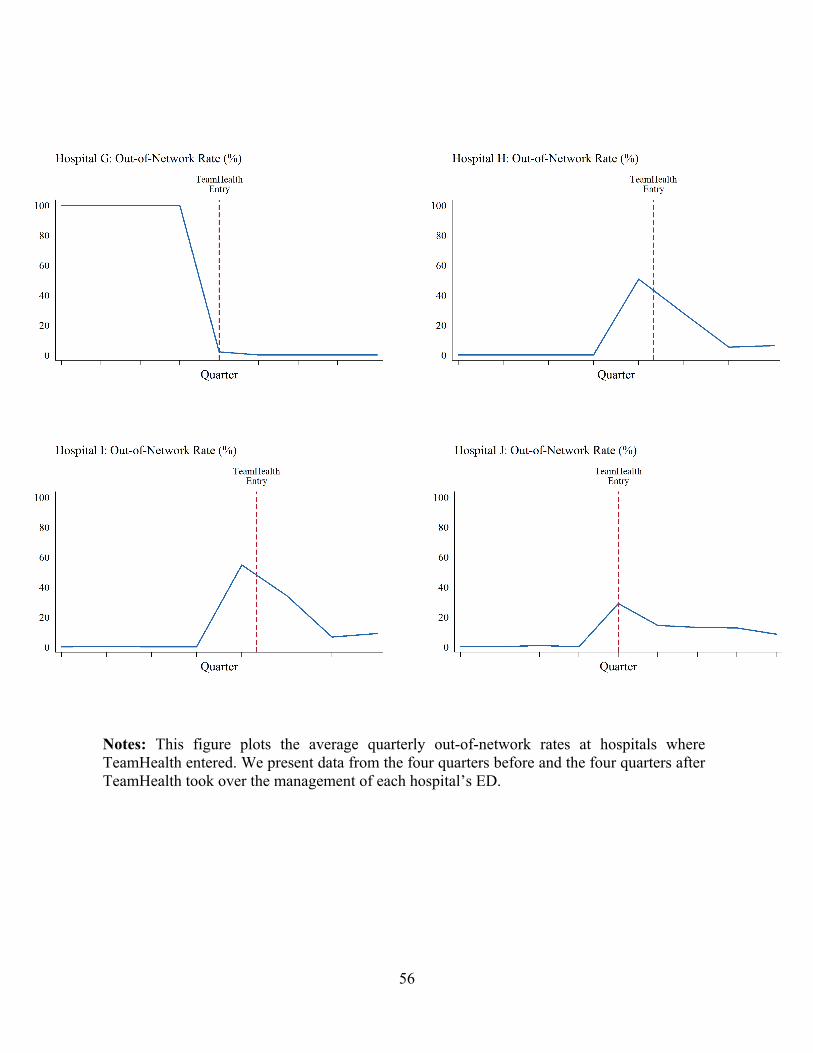
56
Notes: This figure plots the average quarterly out-of-network rates at hospitals where TeamHealth entered. We present data from the four quarters before and the four quarters after TeamHealth took over the management of each hospital’s ED.

57
Figure 6: Discontinuity Analysis at Hospitals Where TeamHealth Took Over Management of ED Services

58
Notes: The panels plot the monthly average by hospital from 12 months before entry to 12 months after TeamHealth entered the hospital.

59
Figure 7: Out-of-Network Billing Rates in New York Versus Surrounding States
Notes: The figure presents least-squares estimates of an episode-level regression where the dependent variable is whether or not a patient at an in-network ED received bill from an out-of-network physician. We regress that against an indicator for whether the episode occurred in the state of New York, a vector of quarterly fixed effects, and the interaction of the New York indicator and the quarterly fixed effects. Patient age, gender, race, and Charlson scores are included as controls. The omitted category is Q1 2014. We include a vector of hospital fixed effects. The control group is composed of ED episodes that occurred in New Jersey, Pennsylvania, Connecticut, Vermont, and Massachusetts. Standard errors are clustered around hospitals. The red dotted line denotes when the NY vote passed, and the green dotted line denotes when the NY law was enacted.

60
Figure 8: The Distribution of Out-of-Network Billing in New York in 2011 and 2015
Notes: The figure shows the kernel density distribution of hospital out-of-network rates in New York in 2013 and 2015

1
Appendix 1: Variables Used in Lasso
Description Source aha_admtot Total facility admissions AHA aha_births Total births (excluding fetal deaths) AHA aha_c_g Government AHA aha_c_np Non-profit AHA aha_fte Full-time equivalent total personnel AHA
aha_ftelpn Full-time equivalent licensed practical or vocational nurses
AHA
aha_ftemd Full-time equivalent physicians and dentists
AHA
aha_fteoth94 Full-time equivalent all other personnel AHA
aha_fteres Full-time equivalent medical and dental residents and interns
AHA
aha_ftern Full-time equivalent registered nurses AHA aha_ftetran Full-time equivalent other trainees AHA aha_ftettrn Full-time equivalent total trainees AHA aha_ftlab Full-time lab techs AHA aha_ftlpntf Full-time licensed nurses AHA aha_ftmdtf Full-time physicians and dentists AHA
aha_ftres Full-time medical & dental residents, interns
AHA
aha_fttoth Total full-time hospital unit personnel AHA aha_fttotlt Total full-time nursing home personnel AHA aha_fttran84 Full-time other trainees AHA aha_hcount_15m Hospital count 15m AHA aha_hmocon # HMO contracts AHA aha_hospbd Total hospital beds AHA aha_mapp1 Accreditation by JCAHO AHA aha_mapp10 Medicare certification AHA
aha_mapp11 Accreditation by American Osteopathic Association
AHA
aha_mapp12 Internship approved by AOA AHA aha_mapp13 Residency approved by AOA AHA aha_mapp16 Catholic church operated AHA aha_mapp19 Rural Referral Center AHA

2
Description Source aha_mapp2 Cancer program approved by ACS AHA aha_mapp20 Sole Community Provider AHA aha_mapp21 DNV AHA aha_mapp3 Residency training approval AHA aha_mapp5 Medical school affiliation AHA
aha_mapp6 Hospital-controlled professional nursing school
AHA
aha_mapp7 Accreditation by CARF AHA aha_mapp8 Teaching hospital AHA aha_mapp9 Blue Cross contracting or participating AHA aha_mcddc Total facility Medicaid discharges AHA aha_mcdipd Total facility Medicaid days AHA aha_mcrdc Total facility Medicare discharges AHA aha_npayben Total facility employee benefits AHA aha_paytot Facility payroll expenses AHA aha_prop_caid Proportion medicaid AHA aha_prop_care Proportion medicare AHA aha_ptlab Part-time laboratory technicians AHA
aha_ptlpntf Part-time licensed practical or vocational nurses
AHA
aha_ptmdtf Part-time physicians and dentists AHA aha_ptphr Part-time pharmacists, licensed AHA aha_ptpht Part-time pharmacy technicians AHA aha_ptrad Part-time radiology technicians AHA
aha_ptres Part-time medical and dental residents and interns
AHA
aha_ptresp Part-time respiratory therapists AHA aha_pttoth Total part-time hospital unit personnel AHA aha_pttotlt Total part-time nursing home personnel AHA aha_pttran84 Part-time other trainees AHA aha_sunits Separate nursing home AHA aha_suropip Inpatient surgical operations AHA
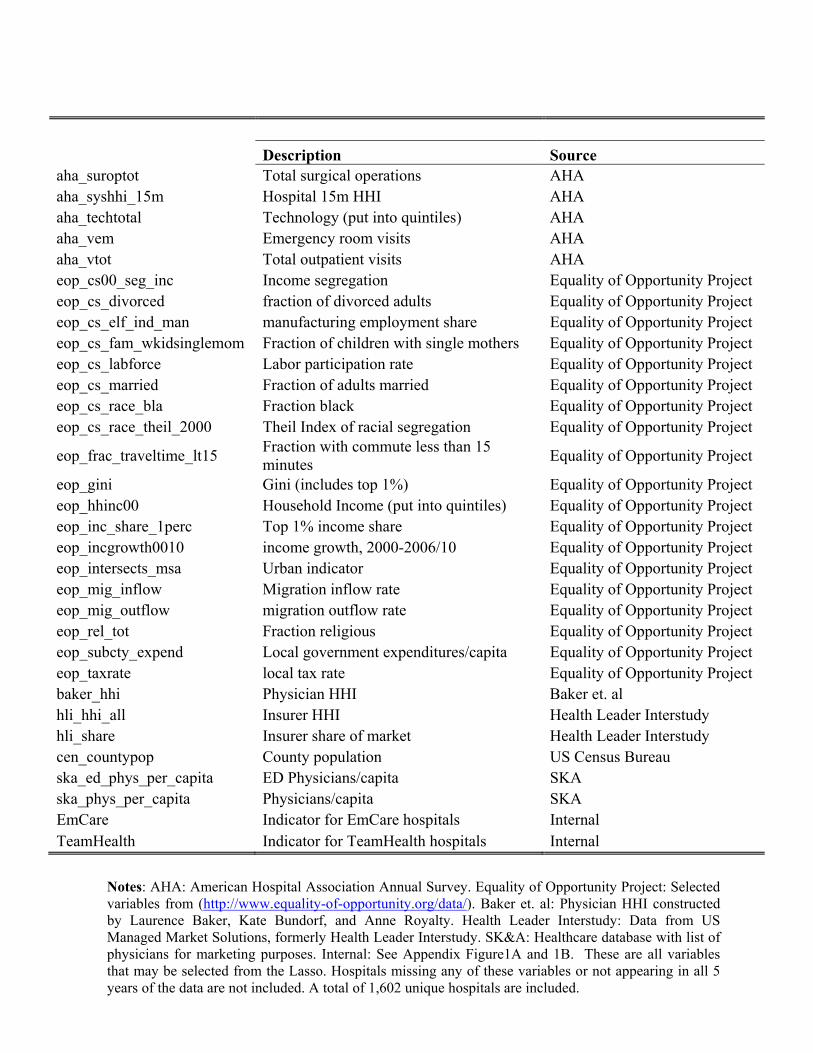
3
Description Source aha_suroptot Total surgical operations AHA aha_syshhi_15m Hospital 15m HHI AHA aha_techtotal Technology (put into quintiles) AHA aha_vem Emergency room visits AHA aha_vtot Total outpatient visits AHA eop_cs00_seg_inc Income segregation Equality of Opportunity Project eop_cs_divorced fraction of divorced adults Equality of Opportunity Project eop_cs_elf_ind_man manufacturing employment share Equality of Opportunity Project eop_cs_fam_wkidsinglemom Fraction of children with single mothers Equality of Opportunity Project eop_cs_labforce Labor participation rate Equality of Opportunity Project eop_cs_married Fraction of adults married Equality of Opportunity Project eop_cs_race_bla Fraction black Equality of Opportunity Project eop_cs_race_theil_2000 Theil Index of racial segregation Equality of Opportunity Project
eop_frac_traveltime_lt15 Fraction with commute less than 15 minutes
Equality of Opportunity Project
eop_gini Gini (includes top 1%) Equality of Opportunity Project eop_hhinc00 Household Income (put into quintiles) Equality of Opportunity Project eop_inc_share_1perc Top 1% income share Equality of Opportunity Project eop_incgrowth0010 income growth, 2000-2006/10 Equality of Opportunity Project eop_intersects_msa Urban indicator Equality of Opportunity Project eop_mig_inflow Migration inflow rate Equality of Opportunity Project eop_mig_outflow migration outflow rate Equality of Opportunity Project eop_rel_tot Fraction religious Equality of Opportunity Project eop_subcty_expend Local government expenditures/capita Equality of Opportunity Project eop_taxrate local tax rate Equality of Opportunity Project baker_hhi Physician HHI Baker et. al hli_hhi_all Insurer HHI Health Leader Interstudy hli_share Insurer share of market Health Leader Interstudy cen_countypop County population US Census Bureau ska_ed_phys_per_capita ED Physicians/capita SKA ska_phys_per_capita Physicians/capita SKA EmCare Indicator for EmCare hospitals Internal TeamHealth Indicator for TeamHealth hospitals Internal
Appendix 2: New York Consumer Out-of-Network Form
Notes: AHA: American Hospital Association Annual Survey. Equality of Opportunity Project: Selected variables from (http://www.equality-of-opportunity.org/data/). Baker et. al: Physician HHI constructed by Laurence Baker, Kate Bundorf, and Anne Royalty. Health Leader Interstudy: Data from US Managed Market Solutions, formerly Health Leader Interstudy. SK&A: Healthcare database with list of physicians for marketing purposes. Internal: See Appendix Figure1A and 1B. These are all variables that may be selected from the Lasso. Hospitals missing any of these variables or not appearing in all 5 years of the data are not included. A total of 1,602 unique hospitals are included.

4
Appendix 2: Surprise Billing Forms from New York State
New York State Out-of-Network Surprise Medical Bill
You may not be responsible for a surprise bill for out-of-network services
A “Surprise Bill” is when you have insurance coverage issued in the State of NY:
Hospital or surgical centers: You are a patient at a participating hospital or ambulatory surgical center and you receive services for which:
A network doctor was not available An out-of-network doctor provided without your knowledge Unforeseen medical circumstances arose at the time the
health care services were provided.
It will not be a surprise bill if you chose to receive services from an out-of-network doctor instead of form an available network doctor.
Referrals: Your network doctor did not ask your consent to refer you to an out-of-network doctor, lab or other health care provider, and did not tell you it would result in costs not covered by your health plan.
An independent dispute resolution entity (IDRE) can determine if you need to pay the bill. You, the plan or your doctor may request an independent dispute resolution (IDR) for surprise bills and referrals. Use the form on the next page to submit your request. You do not have to pay the bill in order to be eligible to submit the dispute for review to an IDRE.
Dispute resolution process
1. Submit your request for independent review: Complete the form on the next page. You can call Customer Service if you need help completing the form. The phone number is on you ID card. You may mail the form to us at:
Consolidated Health Plans 2077 Roosevelt Ave. Springfield, MA 01104
Or send the form electronically to: [email protected]
2. An independent dispute resolution entity (IDRE)
approved by the State of New York will screen your request for eligibility.
If the IDRE needs more information, it will contact the health plan or health care provider. If the requested information is not submitted with three business days, or if the application is not eligible, the IDRE will reject the application.
3. The IDRE will send a letter to the person who
initiated the request (you, the doctor, CHP)
The letter will include:
A request for the information needed to complete the review
A request for any additional information that may be available to support the request
Where to send the information
4. You must submit any requested information within
five business days of receiving the letter
If IDRE receives a partial response or no response, the dispute will be decided based on the available information. You cannot ask for reconsideration by submitting additional information after the decision is made.
5. The IDRE will make a determination within 30 days
of receiving the request
If IDRE feels either the provider’s bill or the health plan’s coverage policy is extreme, it may direct them to attempt a good faith negotiation for settlement. They will have up to ten business days for this negotiation.
A neutral and impartial reviewer with training and experience in health care billing, reimbursement, and usual and customary charges will review the dispute. The IDRE will forward copies of its decision to the health plan, the physician, superintendent, and as applicable, the nonparticipating referred health care provider and the patient, within two business days of making the decision.

5
New York State Out-of-Network Surprise Medical Bill Assignment of Benefits Form
Use this form if you receive a surprise bill for health care services and want the services to be treated as in network. To use this form, you must: (1) fill it out and sign it; (2) send a copy to your health care provider (include a copy of the bill or bills); and (3) send a copy to your insurer (include a copy of the bill or bills). If you don’t know if it is a surprise bill, contact the Department of Financial Services at 1-800-342-3736.
A surprise bill is when:
1. You received services from a nonparticipating physician at a participating hospital or ambulatory surgical center, where a participating physician was not available; or a nonparticipating physician provided services without your knowledge; or unforeseen medical circumstances arose at the time the services were provided. You did not choose to receive services from a nonparticipating physician instead of from an available participating physician; OR
2. You were referred by a participating physician to a nonparticipating provider, but you did not sign a written consent that you knew the services would be out-of-network and would result in costs not covered by your insurer. A referral occurs: (1) during a visit with your participating physician, a nonparticipating provider treats you; or (2) your participating physician takes a specimen from you in the office and sends it to a nonparticipating laboratory pathologist; or (3) for any other health care services when referrals are required under your plan.
I assign my rights to payment to my provider and I certify to the best of my knowledge that:
I (or my dependent/s) received a surprise bill from a health care provider. I want the provider to seek payment for this bill from my insurance company (this is an “assignment”). I want my health insurer to pay the provider for any health care services I or my dependent/s received that are covered under my health insurance. With my assignment, the provider cannot seek payment from me, except for any copayment, coinsurance or deductible that would be owed if I or my dependent/s used a participating provider. If my insurer paid me for the services, I agree to send the payment to the provider.
Your Name:
Your Address:
Insurer Name:
Your Insurance ID No:
Provider Name: Provider Phone Number:
Provider Address:
Date of Service:
Any person who knowingly and with intent to defraud any insurance company or other person files and application for insurance or statement of claim containing any materially false information, or conceals for the purpose of misleading, information concerning any fact thereto, commits a fraudulent insurance act, which is a crime, and shall also be subject to a civil penalty not to exceed five thousand dollars and the stated value of the claim for each such violation.
(Signature of patient) (Date of signature)

6
Appendix Table 1: Hospital Characteristics
All Hospitals EmCare TeamHealth
Hospital Characteristics
Insurer HHI 0.37 0.36 0.35
Insurer Market Share 0.13 0.14 0.16
Hospital HHI 0.55 0.57 0.59
Government 0.15 0.17 0.13
Non-profit 0.66 0.26 0.57
For-profit 0.19 0.56 0.29
Hospital Beds 228.37 185.43 197.63
Teaching 0.09 0.05 0.04
Technologies 55.52 44.38 47.79
Number of Hospitals 3,345 194 95
Notes: These are the hospital characteristics of all AHA identified hospitals in the ED episode data. Hospitals must appear in all five years of the data and have more than 10 episodes per year.

7
Appendix Table 2: Hospital Entry from EmCare and TeamHealth
EmCare TeamHealth
2012 3 Hospitals 1 Hospital
2013 1 System (8 hospitals); 1 Hospital 2 Hospitals
2014 4 Hospitals 1 Hospital
2015 0 1 System (5 hospitals); 1 Hospital
Total 9 Entries (16 hospitals) 5 Entries (10 hospitals)
Notes: We identified hospitals that entered into an outsourcing contract with EmCare and TeamHealth between 2011 and 2015 based on press releases and news stories.

8
Appendix Table 3: Comparison of Hospital Characteristics
EmCare Hospitals
EmCare Entry Hospitals
P-value from two-sided t-test
TeamHealth Hospitals
TeamHealth Entry Hospitals
P-value from two-sided t-test
Hospital Characteristics
Insurer HHI 0.36 0.35 0.73 0.35 0.40 0.35
Insurer Market Share 0.14 0.13 0.69 0.16 0.17 0.82
Hospital HHI 0.57 0.58 0.97 0.59 0.66 0.48
Government 0.18 0.21 0.75 0.13 0.00 0.22
Non-profit 0.28 0.21 0.62 0.57 0.70 0.45
For-profit 0.54 0.57 0.85 0.29 0.30 0.96
Hospital Beds 176.49 266.50 0.04 197.63 227.40 0.50
Teaching 0.05 0.00 0.40 0.04 0.00 0.54
Technologies 43.41 57.79 0.07 47.79 54.80 0.45
Notes: The table compares characteristics of identified EmCare and Teamhealth hospitals to characteristics of hospitals where we have entry. Hospitals with entry are excluded from identified Teamhealth and EmCare hospitals. We drop two hospitals with EmCare entry that are missing measures for variables in the table. The p-value is reported from a two-sided t-test comparing the difference in means between hospitals and hospitals with entry.

9
Appendix Table 4: ED Episode Descriptive Statistics
Mean SD Min P10 P25 P50 P75 P90 Max
Physician Payment 412.09 320.02 49.15 106.43 182.40 314.33 543.82 872.11 1,642.45
Physician Charge 614.92 385.70 107.10 224.64 332.80 519.18 787.52 1,136.10 2,146.42
Facility Payment 2,850.62 5,218.31 119.22 400.40 689.52 1,139.04 2,418.20 6,379.46 36,286.11
Facility Charge 6,642.39 13,011.33 172.38 552.70 1,065.90 2,325.69 5,802.44 15,300.48 90,184.31
Admissions 0.09 0.29 0 0 0 0 0 0 1
Imaging 0.28 0.45 0 0 0 0 1 1 1
Length of Stay 0.58 1.97 0 0 0 0 0 1 30
CPT 99281 0.05 0.21 0 0 0 0 0 0 1
CPT 99282 0.13 0.34 0 0 0 0 0 1 1
CPT 99283 0.48 0.50 0 0 0 0 1 1 1
CPT 99284 0.50 0.50 0 0 0 0 1 1 1
CPT 99285 0.35 0.48 0 0 0 0 1 1 1
Hispanic 0.08 0.28 0 0 0 0 0 0 1
Black 0.10 0.30 0 0 0 0 0 1 1
White 0.48 0.50 0 0 0 0 1 1 1
Ages 57-65 0.17 0.38 0 0 0 0 0 1 1
Ages 47-56 0.18 0.38 0 0 0 0 0 1 1
Ages 37-46 0.17 0.37 0 0 0 0 0 1 1
Ages 27-36 0.16 0.36 0 0 0 0 0 1 1
Ages 20-26 0.13 0.33 0 0 0 0 0 1 1

10
Ages 0-19 0.20 0.40 0 0 0 0 0 1 1
Charlson Scores 0.34 0.99 0 0 0 0 0 1 17
6-month Spending 6,248 17,195 0 0 149 757 3,548 14,254 115,499 Episodes per hospital 2,665 3,821 60 190 442 1,177 3,279 6,964 47,599
Notes: These are the descriptive statistics for all ED episodes in our data. These are limited to episodes that occurred at in-network hospitals. Payment and charges are winsorized at the top and bottom one percentiles. Payments and charges are also inflation adjusted into 2015 dollars using the BLS All Consumer Price Index.
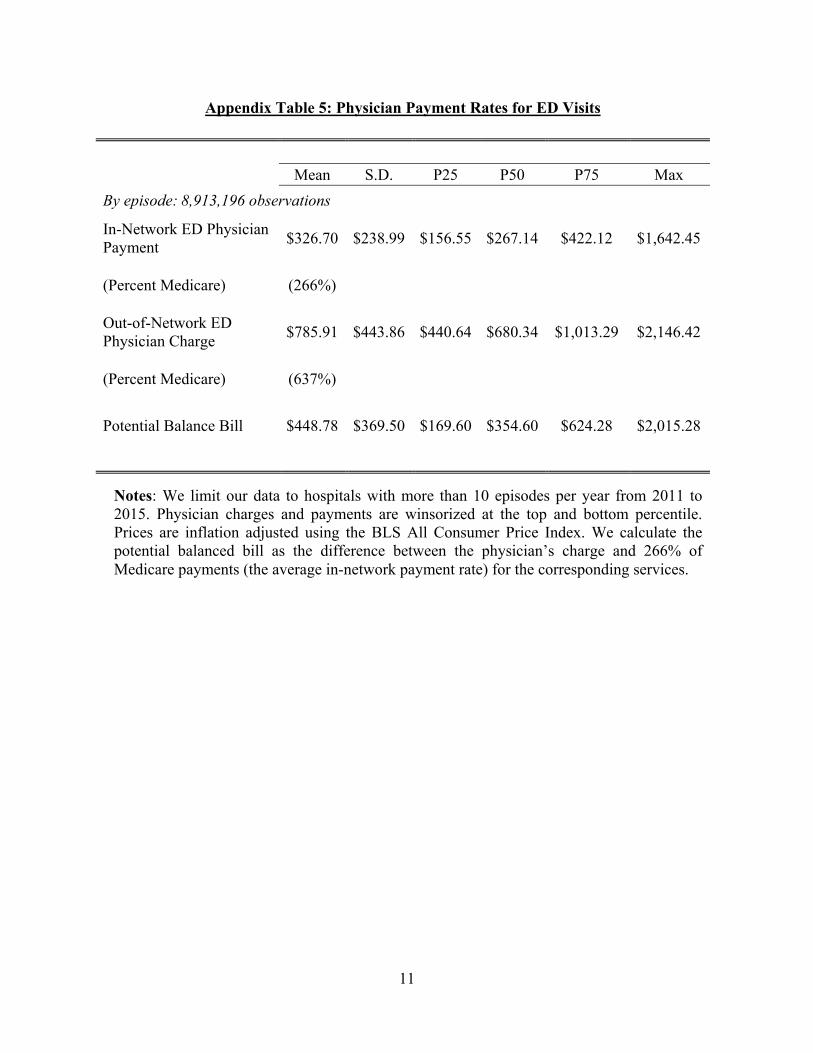
11
Appendix Table 5: Physician Payment Rates for ED Visits
Mean S.D. P25 P50 P75 Max
By episode: 8,913,196 observations
In-Network ED Physician Payment
$326.70 $238.99 $156.55 $267.14 $422.12 $1,642.45
(Percent Medicare) (266%)
Out-of-Network ED Physician Charge
$785.91 $443.86 $440.64 $680.34 $1,013.29 $2,146.42
(Percent Medicare) (637%)
Potential Balance Bill $448.78 $369.50 $169.60 $354.60 $624.28 $2,015.28
Notes: We limit our data to hospitals with more than 10 episodes per year from 2011 to 2015. Physician charges and payments are winsorized at the top and bottom percentile. Prices are inflation adjusted using the BLS All Consumer Price Index. We calculate the potential balanced bill as the difference between the physician’s charge and 266% of Medicare payments (the average in-network payment rate) for the corresponding services.
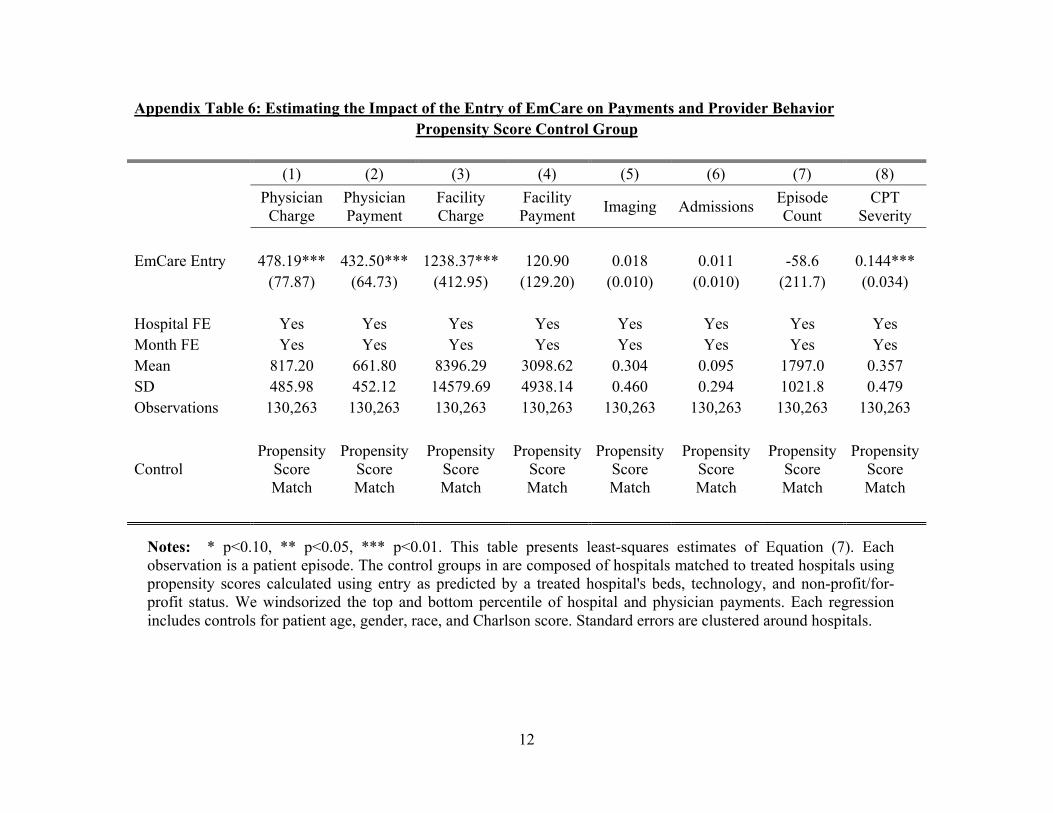
12
Appendix Table 6: Estimating the Impact of the Entry of EmCare on Payments and Provider Behavior Propensity Score Control Group
(1) (2) (3) (4) (5) (6) (7) (8)
Physician Charge
Physician Payment
Facility Charge
Facility Payment
Imaging AdmissionsEpisode Count
CPT Severity
EmCare Entry 478.19*** 432.50*** 1238.37*** 120.90 0.018 0.011 -58.6 0.144*** (77.87) (64.73) (412.95) (129.20) (0.010) (0.010) (211.7) (0.034)
Hospital FE Yes Yes Yes Yes Yes Yes Yes Yes Month FE Yes Yes Yes Yes Yes Yes Yes Yes Mean 817.20 661.80 8396.29 3098.62 0.304 0.095 1797.0 0.357 SD 485.98 452.12 14579.69 4938.14 0.460 0.294 1021.8 0.479 Observations 130,263 130,263 130,263 130,263 130,263 130,263 130,263 130,263
Control Propensity
Score Match
Propensity Score Match
Propensity Score Match
Propensity Score Match
Propensity Score Match
Propensity Score Match
Propensity Score Match
Propensity Score Match
Notes: * p<0.10, ** p<0.05, *** p<0.01. This table presents least-squares estimates of Equation (7). Each observation is a patient episode. The control groups in are composed of hospitals matched to treated hospitals using propensity scores calculated using entry as predicted by a treated hospital's beds, technology, and non-profit/for-profit status. We windsorized the top and bottom percentile of hospital and physician payments. Each regression includes controls for patient age, gender, race, and Charlson score. Standard errors are clustered around hospitals.

13
Appendix Table 7: Estimating the Impact of the Entry of EmCare on Payments and Provider Behavior Same-State Hospitals Control Group
(1) (2) (3) (4) (5) (6) (7) (8)
Physician Charge
Physician Payment
Facility Charge
Facility Payment
Imaging AdmissionsEpisode Count
CPT Severity
EmCare Entry 548.40*** 443.22*** 1522.14*** 237.41** 0.012*** 0.017*** -189.0 0.148*** (62.97) (56.13) (395.07) (112.91) (0.005) (0.006) (219.4) (0.030)
Hospital FE Yes Yes Yes Yes Yes Yes Yes Yes Month FE Yes Yes Yes Yes Yes Yes Yes Yes Mean 615.73 471.30 7306.00 3299.64 0.280 0.090 1542.9 0.357 SD 386.33 340.41 13678.35 5587.82 0.449 0.287 1288.7 0.479 Observations 1,720,883 1,720,883 1,720,883 1,720,883 1,720,883 1,720,883 1,720,883 1,720,883
Control Hospitals in Same
State
Hospitals in Same
State
Hospitals in Same
State
Hospitals in Same
State
Hospitals in Same
State
Hospitals in Same
State
Hospitals in Same
State
Hospitals in Same
State
Notes: * p<0.10, ** p<0.05, *** p<0.01. This table presents least-squares estimates of Equation (7). Each observation is a patient episode. The control includes hospitals in the same states as the treated hospitals. There are no hospitals that outsource their ED services to EmCare in the control group. We windsorized the top and bottom percentile of hospital and physician payments. Each regression includes controls for patient age, gender, race, and Charlson score. Standard errors are clustered around hospitals.

14
Appendix Table 8: The Impact of the Entry of EmCare on Payments and Provider Behavior Only Hospitals with High Out-of-Network Rates (8 Hospitals)
(1) (2) (3) (4) (5) (6) (7) (8)
Physician Charge
Physician Payment
Facility Charge
Facility Payment
Imaging Admissions Episode Count
CPT Severity
EmCare Entry 582.92*** 414.82*** 1969.88*** 348.33*** 0.013*** 0.022*** -137.5 0.161*** (65.52) (62.82) (453.98) (133.68) (0.005) (0.007) (265.8) (0.034)
Hospital FE Yes Yes Yes Yes Yes Yes Yes Yes Month FE Yes Yes Yes Yes Yes Yes Yes Yes Mean 578.72 383.27 6307.50 2745.23 0.278 0.090 1696.7 0.347 SD 364.43 297.52 12418.57 5036.10 0.448 0.286 1567.5 0.476 Observations 8,401,884 8,401,884 8,401,884 8,401,884 8,401,884 8,401,884 8,401,884 8,401,884
Control All
Hospitals All
Hospitals All
Hospitals All
Hospitals All
Hospitals All
Hospitals All
Hospitals All
Hospitals
Notes: * p<0.10, ** p<0.05, *** p<0.01. This table presents least-squares estimates of Equation (7) separately on hospitals with out-of-network (OON) rates above 97%. Each observation is a patient episode. The control group in all regressions is all hospitals in the US exclusive of those that outsourced their ED services to EmCare. We windsorized the top and bottom percentile of hospital and physician payments. Each regression includes controls for patient age, gender, race, and Charlson score. Standard errors are clustered around hospitals.

15
Appendix Table 9: The Impact of the Entry of EmCare on Payments and Provider Behavior Only Hospitals with Low Out-of-Network Rates (8 Hospitals)
(1) (2) (3) (4) (5) (6) (7) (8)
Physician Charge
Physician Payment
Facility Charge
Facility Payment
Imaging Admissions Episode Count
CPT Severity
EmCare Entry 443.75*** 593.24*** 437.89*** 60.29 0.018 0.013*** 42.7 0.093*** (129.24) (78.12) (106.51) (58.42) (0.014) (0.003) (32.6) (0.034)
Hospital FE Yes Yes Yes Yes Yes Yes Yes Yes Month FE Yes Yes Yes Yes Yes Yes Yes Yes Mean 576.67 380.87 6275.14 2740.55 0.277 0.090 1690.2 0.347 SD 362.08 294.61 12378.94 5035.83 0.448 0.286 1569.2 0.476 Observations 8,351,799 8,351,799 8,351,799 8,351,799 8,351,799 8,351,799 8,351,799 8,351,799
Control All
Hospitals All
Hospitals All
Hospitals All
Hospitals All
Hospitals All
Hospitals All
Hospitals All
Hospitals
Notes: * p<0.10, ** p<0.05, *** p<0.01. This table presents least-squares estimates of Equation (7) separately on hospitals with out-of-network (OON) rates below 11%. Each observation is a patient episode. The control group in all regressions is all hospitals in the US exclusive of those that outsourced their ED services to EmCare. We windsorized the top and bottom percentile of hospital and physician payments. Each regression includes controls for patient age, gender, race, and Charlson score. Standard errors are clustered around hospitals.

16
Appendix Table 10: Estimating the Impact of the Entry of TeamHealth on Payments and Provider Behavior Propensity Score Control Group
(1) (2) (3) (4) (5) (6) (7) (8) (9)
Out-of-Network
Rate
Physician Charge
Physician Payment
Facility Charge
Facility Payment
Imaging Admissions Episode Count
CPT Severity
TeamHealth Entry 0.261*** -28.42 234.04*** -153.30 -285.15* -0.008 -0.010 340.8* 0.027 (0.082) (44.01) (27.91) (270.94) (132.72) (0.010) (0.007) (181.8) (0.024)
Hospital FE Yes Yes Yes Yes Yes Yes Yes Yes Yes Month FE Yes Yes Yes Yes Yes Yes Yes Yes Yes Mean 0.232 705.85 503.96 7396.29 2972.14 0.304 0.083 2587.3 0.387 SD 0.422 372.52 304.59 12920.69 5045.28 0.460 0.275 1458.9 0.487 Observations 132,549 132,549 132,549 132,549 132,549 132,549 132,549 132,549 132,549
Control Propensity
Score Match
Propensity Score Match
Propensity Score Match
Propensity Score Match
Propensity Score Match
Propensity Score Match
Propensity Score Match
Propensity Score Match
Propensity Score Match
Notes: * p<0.10, ** p<0.05, *** p<0.01. This table presents least-squares estimates of Equation (7). Each observation is a patient episode. The control groups in are composed of hospitals matched to treated hospitals using propensity scores calculated using entry as predicted by a treated hospital's beds, technology, and non-profit/for-profit status. We windsorized the top and bottom percentile of hospital and physician payments. Each regression includes controls for patient age, gender, race, and Charlson score. Standard errors are clustered around hospitals.

17
Appendix Table 11: Estimating the Impact of the Entry of TeamHealth on Payments and Provider Behavior Same-State Hospitals Control Group
(1) (2) (3) (4) (5) (6) (7) (8) (9)
Out-of-Network
Rate
Physician Charge
Physician Payment
Facility Charge
Facility Payment
Imaging AdmissionsEpisode Count
CPT Severity
TeamHealth Entry 0.376*** 13.63 249.08*** 112.10 -96.24 -0.008** -0.008*** 507.3*** 0.023 (0.035) (37.39) (20.91) (179.33) (84.41) (0.004) (0.003) (188.0) (0.015)
Hospital FE Yes Yes Yes Yes Yes Yes Yes Yes Yes Month FE Yes Yes Yes Yes Yes Yes Yes Yes Yes Mean 0.305 635.76 451.66 6248.05 2862.60 0.280 0.082 1984.0 0.362 SD 0.460 397.92 342.54 12156.69 4983.97 0.449 0.274 1563.2 0.481 Observations 2,118,144 2,118,144 2,118,144 2,118,144 2,118,144 2,118,144 2,118,144 2,118,144 2,118,144
Control Hospitals in Same
State
Hospitals in Same
State
Hospitals in Same
State
Hospitals in Same
State
Hospitals in Same
State
Hospitals in Same
State
Hospitals in Same
State
Hospitals in Same
State
Hospitals in Same
State
Notes: * p<0.10, ** p<0.05, *** p<0.01. This table presents least-squares estimates of Equation (7). Each observation is a patient episode. The control includes hospitals in the same states as the treated hospitals. There are no hospitals that outsource their ED services to TeamHealth in the control group. We windsorized the top and bottom percentile of hospital and physician payments. Each regression includes controls for patient age, gender, race, and Charlson score. Standard errors are clustered around hospitals.
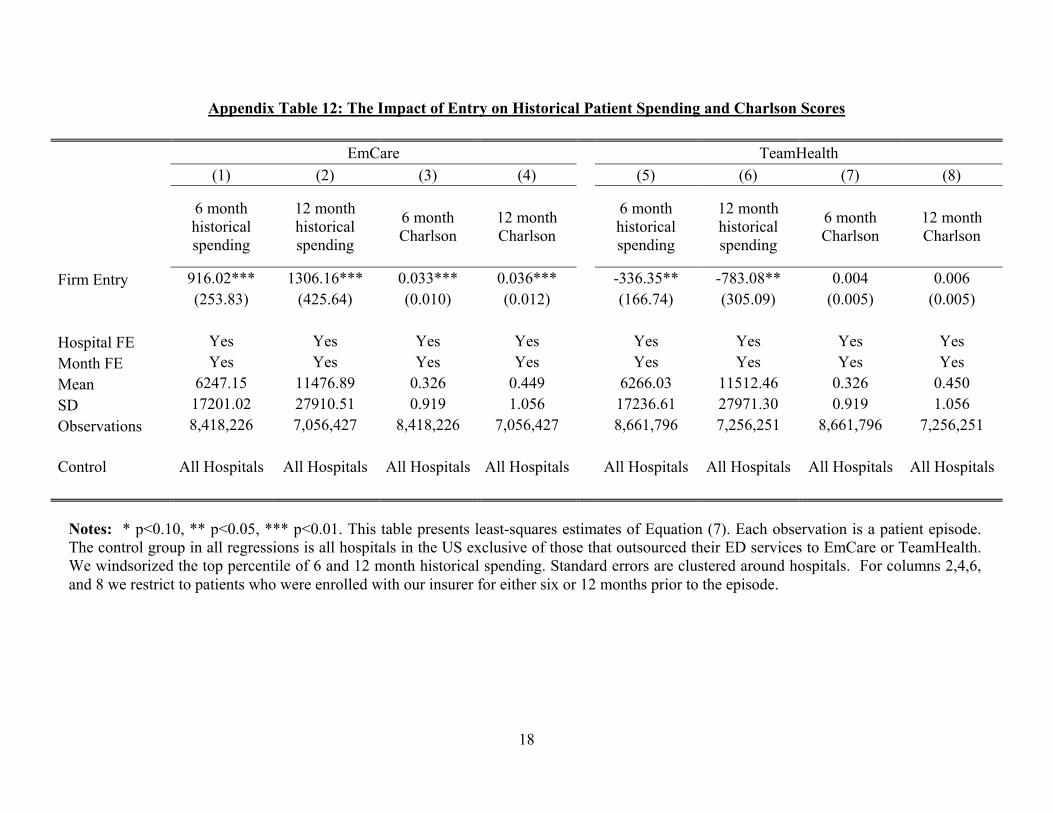
18
Appendix Table 12: The Impact of Entry on Historical Patient Spending and Charlson Scores
EmCare TeamHealth
(1) (2) (3) (4) (5) (6) (7) (8)
6 month historical spending
12 month historical spending
6 month Charlson
12 month Charlson
6 month historical spending
12 month historical spending
6 month Charlson
12 month Charlson
Firm Entry 916.02*** 1306.16*** 0.033*** 0.036*** -336.35** -783.08** 0.004 0.006 (253.83) (425.64) (0.010) (0.012) (166.74) (305.09) (0.005) (0.005)
Hospital FE Yes Yes Yes Yes Yes Yes Yes Yes
Month FE Yes Yes Yes Yes Yes Yes Yes Yes
Mean 6247.15 11476.89 0.326 0.449 6266.03 11512.46 0.326 0.450
SD 17201.02 27910.51 0.919 1.056 17236.61 27971.30 0.919 1.056
Observations 8,418,226 7,056,427 8,418,226 7,056,427 8,661,796 7,256,251 8,661,796 7,256,251
Control All Hospitals All Hospitals All Hospitals All Hospitals All Hospitals All Hospitals All Hospitals All Hospitals
Notes: * p<0.10, ** p<0.05, *** p<0.01. This table presents least-squares estimates of Equation (7). Each observation is a patient episode. The control group in all regressions is all hospitals in the US exclusive of those that outsourced their ED services to EmCare or TeamHealth. We windsorized the top percentile of 6 and 12 month historical spending. Standard errors are clustered around hospitals. For columns 2,4,6, and 8 we restrict to patients who were enrolled with our insurer for either six or 12 months prior to the episode.

19
Appendix Table 13: The Impact of the Entry of EmCare on Coding Severity from Physician Visits, Robustness Checks
(1) (2) (3) (4) (5) (6) (7) (8)
CPT Severity
CPT Severity
CPT Severity
CPT Severity
CPT Severity
CPT Severity
CPT Severity
CPT Severity
EmCare Entry 0.151*** 0.149*** 0.148*** 0.148*** 0.156*** 0.142*** 0.152*** 0.153*** (0.031) (0.030) (0.030) (0.030) (0.033) (0.030) (0.030) (0.031)
Hospital FE Yes Yes Yes Yes Yes Yes Yes Yes Month FE Yes Yes Yes Yes Yes Yes Yes Yes Mean 0.347 0.347 0.347 0.326 0.445 0.297 0.319 0.424 SD 0.476 0.476 0.476 0.469 0.497 0.457 0.466 0.494 Observations 8,418,226 8,418,226 8,418,226 6,960,514 1,457,712 2,806,097 2,806,055 2,806,074
Controls No
Controls Patient
Characteristics Patient and Charlson
Charlson Score of 0
Non-zero Charlson
Score
Lowest third of the historical spending
distribution
Middle third of the historical spending
distribution
Upper third of the
historical spending
distribution
Notes: * p<0.10, ** p<0.05, *** p<0.01. This table presents least-squares estimates of Equation (7). Each observation is a patient episode. The control group in all regressions is all hospitals in the US exclusive of those that outsourced their ED services to EmCare. We windsorized the top and bottom percentile of facility payments. Standard errors are clustered around hospitals. In columns 6,7, and 8 historical spending is split into thirds where each column contains the sample of patients from the bottom, middle, and upper third of spending.
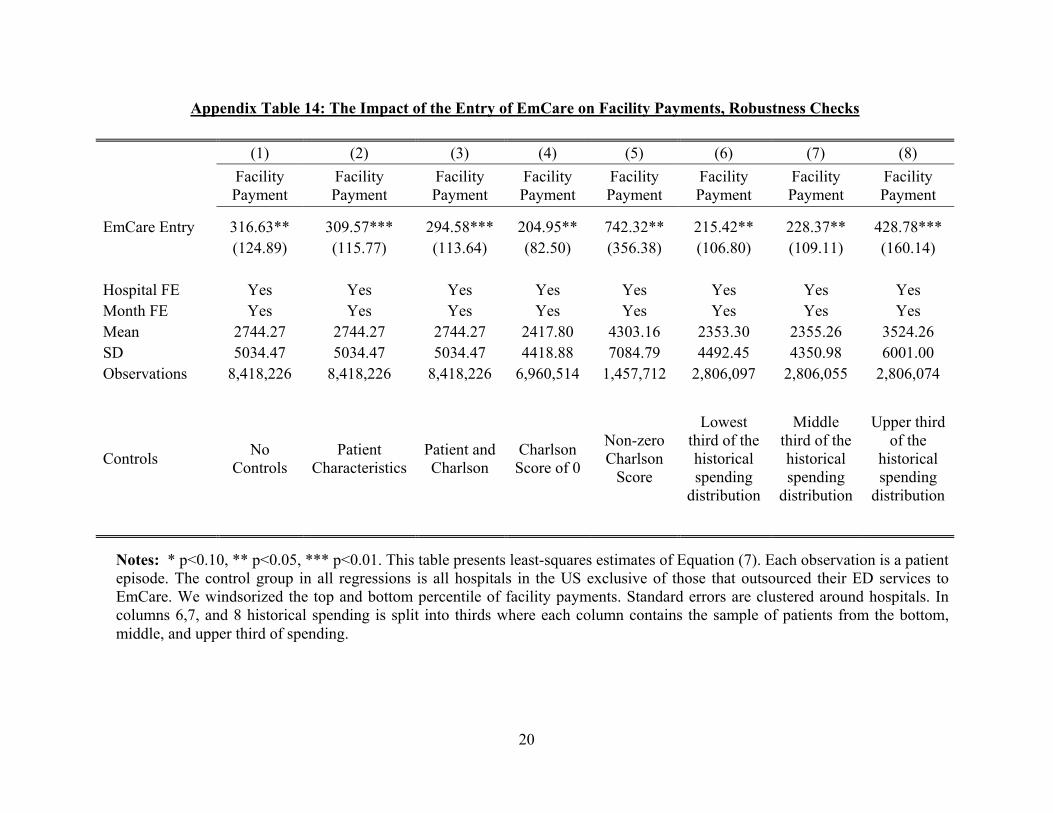
20
Appendix Table 14: The Impact of the Entry of EmCare on Facility Payments, Robustness Checks
(1) (2) (3) (4) (5) (6) (7) (8)
Facility Payment
Facility Payment
Facility Payment
Facility Payment
Facility Payment
Facility Payment
Facility Payment
Facility Payment
EmCare Entry 316.63** 309.57*** 294.58*** 204.95** 742.32** 215.42** 228.37** 428.78*** (124.89) (115.77) (113.64) (82.50) (356.38) (106.80) (109.11) (160.14)
Hospital FE Yes Yes Yes Yes Yes Yes Yes Yes Month FE Yes Yes Yes Yes Yes Yes Yes Yes Mean 2744.27 2744.27 2744.27 2417.80 4303.16 2353.30 2355.26 3524.26 SD 5034.47 5034.47 5034.47 4418.88 7084.79 4492.45 4350.98 6001.00 Observations 8,418,226 8,418,226 8,418,226 6,960,514 1,457,712 2,806,097 2,806,055 2,806,074
Controls No
Controls Patient
Characteristics Patient and Charlson
Charlson Score of 0
Non-zero Charlson
Score
Lowest third of the historical spending
distribution
Middle third of the historical spending
distribution
Upper third of the
historical spending
distribution
Notes: * p<0.10, ** p<0.05, *** p<0.01. This table presents least-squares estimates of Equation (7). Each observation is a patient episode. The control group in all regressions is all hospitals in the US exclusive of those that outsourced their ED services to EmCare. We windsorized the top and bottom percentile of facility payments. Standard errors are clustered around hospitals. In columns 6,7, and 8 historical spending is split into thirds where each column contains the sample of patients from the bottom, middle, and upper third of spending.

21
Appendix Table 15: The Impact of the Entry of EmCare on the Frequency of Imaging, Robustness Checks
(1) (2) (3) (4) (5) (6) (7) (8)
Imaging Imaging Imaging Imaging Imaging Imaging Imaging Imaging
EmCare Entry 0.016*** 0.014*** 0.014*** 0.013** 0.028*** 0.014** 0.017** 0.012** (0.005) (0.005) (0.005) (0.006) (0.009) (0.007) (0.008) (0.005)
Hospital FE Yes Yes Yes Yes Yes Yes Yes Yes Month FE Yes Yes Yes Yes Yes Yes Yes Yes Mean 0.278 0.278 0.278 0.268 0.324 0.254 0.261 0.319 SD 0.448 0.448 0.448 0.443 0.468 0.435 0.439 0.466 Observations 8,418,226 8,418,226 8,418,226 6,960,514 1,457,712 2,806,097 2,806,055 2,806,074
Controls No
Controls Patient
Characteristics Patient and Charlson
Charlson Score of 0
Non-zero Charlson
Score
Lowest third of the historical spending
distribution
Middle third of the historical spending
distribution
Upper third of the
historical spending
distribution
Notes: * p<0.10, ** p<0.05, *** p<0.01. This table presents least-squares estimates of Equation (7). Each observation is a patient episode. The control group in all regressions is all hospitals in the US exclusive of those that outsourced their ED services to EmCare. We windsorized the top and bottom percentile of facility payments. Standard errors are clustered around hospitals. In columns 6,7, and 8 historical spending is split into thirds where each column contains the sample of patients from the bottom, middle, and upper third of spending.

22
Appendix Table 16: The Impact of the Entry of EmCare on the Frequency of Admissions, Robustness Checks
(1) (2) (3) (4) (5) (6) (7) (8)
Admissions Admissions Admissions Admissions Admissions Admissions Admissions Admissions
EmCare Entry 0.022*** 0.022*** 0.021*** 0.014*** 0.053*** 0.011* 0.016*** 0.035*** (0.007) (0.006) (0.006) (0.005) (0.019) (0.006) (0.005) (0.010)
Hospital FE Yes Yes Yes Yes Yes Yes Yes Yes Month FE Yes Yes Yes Yes Yes Yes Yes Yes Mean 0.090 0.090 0.090 0.071 0.181 0.066 0.070 0.134 SD 0.286 0.286 0.286 0.257 0.385 0.248 0.256 0.341 Observations 8,418,226 8,418,226 8,418,226 6,960,514 1,457,712 2,806,097 2,806,055 2,806,074
Controls No
Controls Patient
CharacteristicsPatient and Charlson
Charlson Score of 0
Non-zero Charlson
Score
Lowest third of the historical spending
distribution
Middle third of the historical spending
distribution
Upper third of the
historical spending
distribution
Notes: * p<0.10, ** p<0.05, *** p<0.01. This table presents least-squares estimates of Equation (7). Each observation is a patient episode. The control group in all regressions is all hospitals in the US exclusive of those that outsourced their ED services to EmCare. We windsorized the top and bottom percentile of facility payments. Standard errors are clustered around hospitals. In columns 6,7, and 8 historical spending is split into thirds where each column contains the sample of patients from the bottom, middle, and upper third of spending.

23
Appendix Table 17: ED Episodes and Annual Spending
Emergency Episodes
Total Facility Spending
Total Physician Spending
Percent ASO
Share of Episodes at in-network hospitals
2011 61,331 $148,222,782 $19,125,875 87.6% 97.9%
2012 69,404 $170,582,628 $22,812,526 89.2% 99.0%
2013 67,317 $182,161,431 $22,551,581 91.5% 99.6%
2014 65,388 $187,074,086 $21,531,723 92.1% 99.8%
2015 60,496 $184,594,280 $21,197,031 90.4% 99.8%
Total 323,936 $872,635,207 $107,218,736 90.2% 99.2%
Notes: The table shows summary statistics for our data in New York State. Only episodes that occur in an in-network hospital are included. There are a small percentage of episodes (> 0.5%) that are missing a label for ASO or fully-insured.
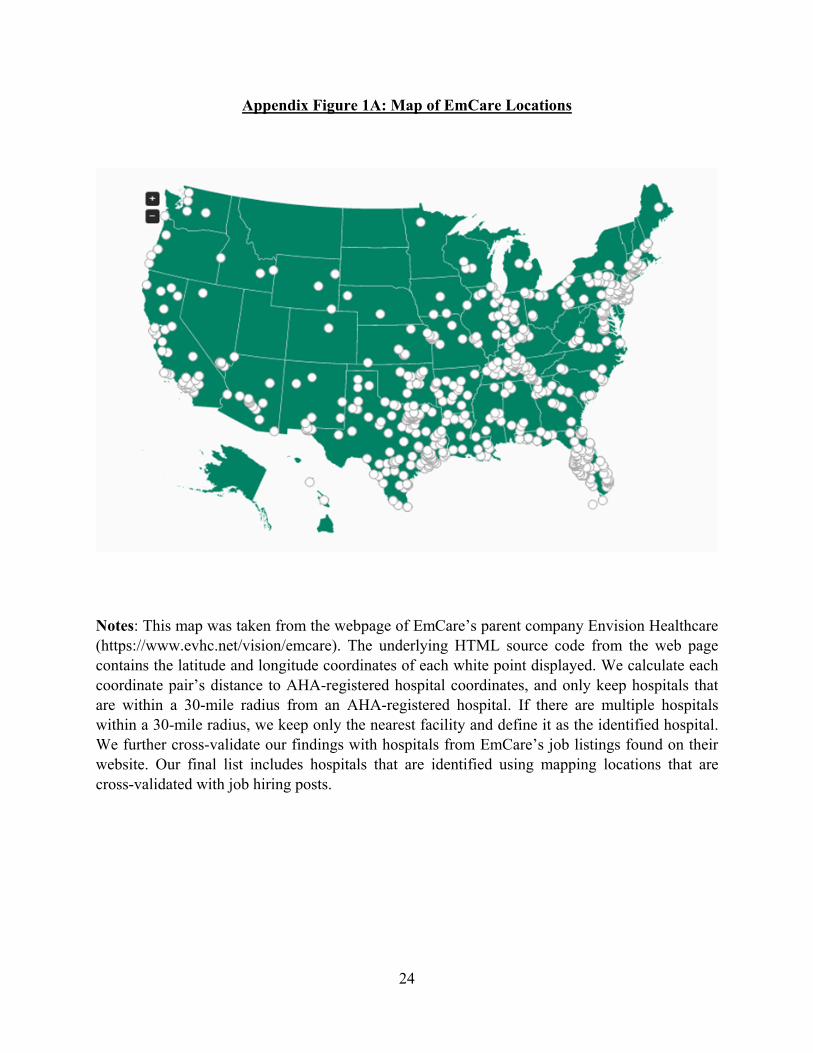
24
Appendix Figure 1A: Map of EmCare Locations
Notes: This map was taken from the webpage of EmCare’s parent company Envision Healthcare (https://www.evhc.net/vision/emcare). The underlying HTML source code from the web page contains the latitude and longitude coordinates of each white point displayed. We calculate each coordinate pair’s distance to AHA-registered hospital coordinates, and only keep hospitals that are within a 30-mile radius from an AHA-registered hospital. If there are multiple hospitals within a 30-mile radius, we keep only the nearest facility and define it as the identified hospital. We further cross-validate our findings with hospitals from EmCare’s job listings found on their website. Our final list includes hospitals that are identified using mapping locations that are cross-validated with job hiring posts.
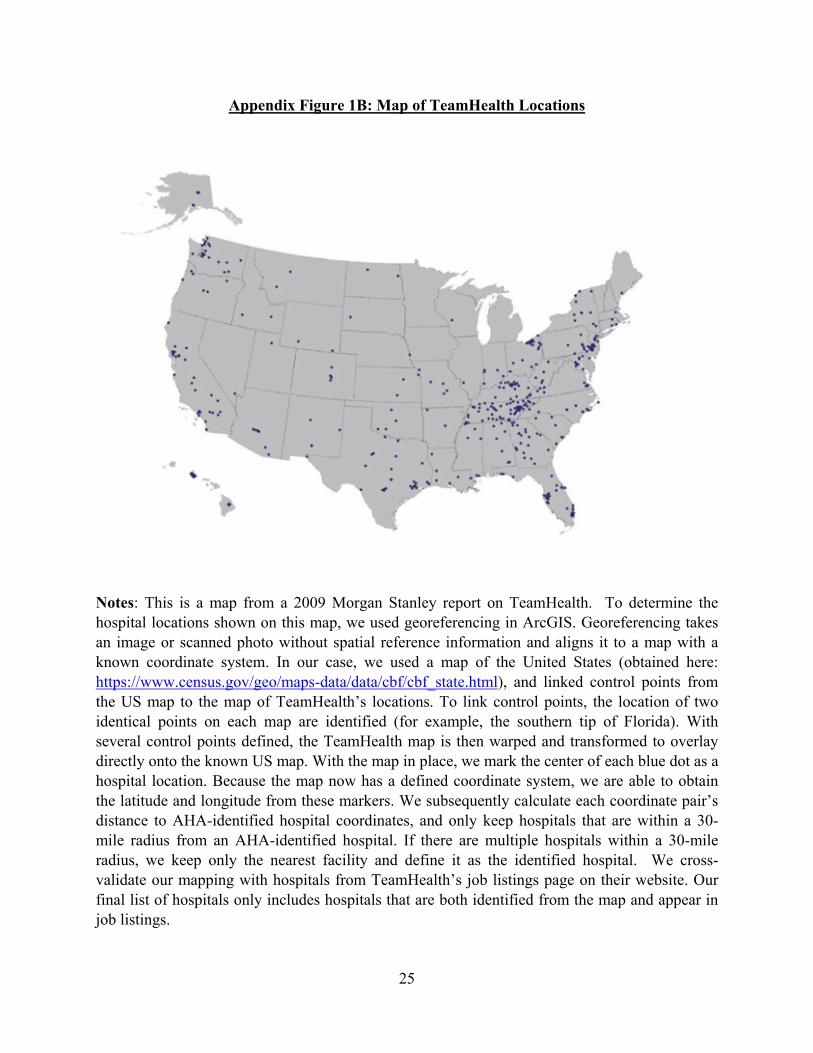
25
Appendix Figure 1B: Map of TeamHealth Locations
Notes: This is a map from a 2009 Morgan Stanley report on TeamHealth. To determine the hospital locations shown on this map, we used georeferencing in ArcGIS. Georeferencing takes an image or scanned photo without spatial reference information and aligns it to a map with a known coordinate system. In our case, we used a map of the United States (obtained here: https://www.census.gov/geo/maps-data/data/cbf/cbf_state.html), and linked control points from the US map to the map of TeamHealth’s locations. To link control points, the location of two identical points on each map are identified (for example, the southern tip of Florida). With several control points defined, the TeamHealth map is then warped and transformed to overlay directly onto the known US map. With the map in place, we mark the center of each blue dot as a hospital location. Because the map now has a defined coordinate system, we are able to obtain the latitude and longitude from these markers. We subsequently calculate each coordinate pair’s distance to AHA-identified hospital coordinates, and only keep hospitals that are within a 30-mile radius from an AHA-identified hospital. If there are multiple hospitals within a 30-mile radius, we keep only the nearest facility and define it as the identified hospital. We cross-validate our mapping with hospitals from TeamHealth’s job listings page on their website. Our final list of hospitals only includes hospitals that are both identified from the map and appear in job listings.

26
Appendix Figure 2: Example of EmCare Job Listing
Notes: This screen grab is taken from EmCare’s job hiring page. (https://www.emcare.com/careers/clinical-job-search).

27
Appendix Figure 3 – Map of 2011 to 2015 Out-of-Network Rates by HRR
Notes: The figure shows the 2011-2015 out-of-network rates by HRR. To be included, a HRR must have more than 2,000 episodes in the 5 years of data.

28
Appendix Figure 4: Quarterly Out-of-Network Rates from 2011 to 2015
Notes: The figure shows quarterly out-of-network rates for all ED episodes in our data from 2011-2015. Out-of-network rates are first constructed at the HRR level. An HRR’s out-of-network rate is weighted based on the count of episodes in 2011. An HRR must have more than 125 episodes per quarter.

29
Appendix Figure 5: The Distribution of Hospital Out-of-Network Rates, 2011, 2013, and 2015
Notes: The figure shows the distribution of hospital out-of-network rates in years 2011, 2013, and 2015. There are 3,345 hospitals that appear in each year of the data.
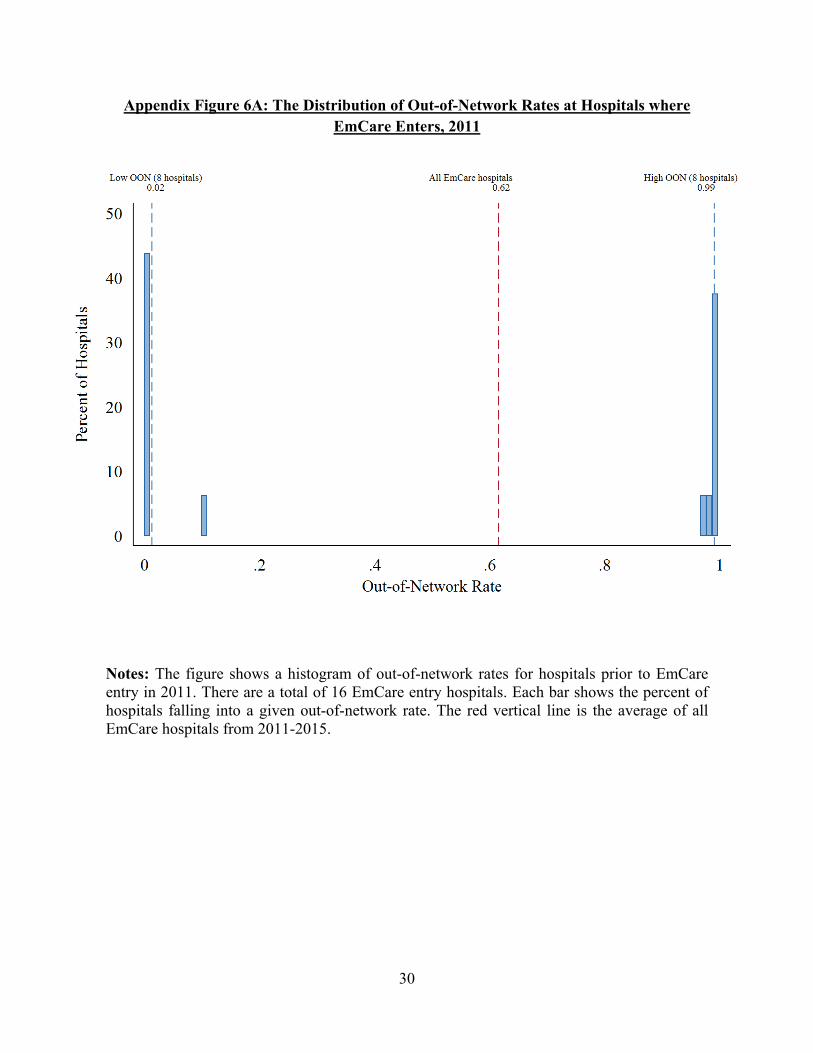
30
Appendix Figure 6A: The Distribution of Out-of-Network Rates at Hospitals where EmCare Enters, 2011
Notes: The figure shows a histogram of out-of-network rates for hospitals prior to EmCare entry in 2011. There are a total of 16 EmCare entry hospitals. Each bar shows the percent of hospitals falling into a given out-of-network rate. The red vertical line is the average of all EmCare hospitals from 2011-2015.

31
Appendix Figure 6B: The Distribution of Out-of-Network Rates at Hospitals Where TeamHealth Enters, 2011
Notes: The figure shows a histogram of out-of-network rates for hospitals prior to TeamHealth entry in 2011. There are a total of 10 TeamHealth entry hospitals. Each bar shows the percent of hospitals falling into a given out-of-network rate. The red vertical line is the average of all TeamHealth hospitals from 2011-2015.


![RP Billing Country Network TADIG $/1Mb Increment … Network TADIG MCC/MNC MNOID Profile $/1Mb RP Billing Increment ABW ARUBA MOBILE - (SETAR) [ABWSE] ABWSE 363/001 6 G+ 0,76764 3](https://static.fdocuments.us/doc/165x107/5b2b27837f8b9a0d4a8b4c09/rp-billing-country-network-tadig-1mb-increment-network-tadig-mccmnc-mnoid-profile.jpg)