Surgical Variance Report 2017 Orthopaedic Surgery Variance Report 2017 – Orthopaedic Surgery 2...
30
Surgical Variance Report 2017 Orthopaedic Surgery
Transcript of Surgical Variance Report 2017 Orthopaedic Surgery Variance Report 2017 – Orthopaedic Surgery 2...

Surgical Variance Report 2017Orthopaedic Surgery

Table of Contents
Introduction to Surgical Variance Report 2017: Orthopaedic Surgery
1
Foreword 2
Data used in this report 3
Indicators measured in this report 4
Hip replacement procedures 5
Knee replacement procedures 13
Knee ACL repair procedures 21
Sustainability Committee membership 26
Definitions 27

Surgical Variance Report 2017 – Orthopaedic Surgery 1
Introduction to Surgical Variance Report 2017: Orthopaedic Surgery
The Royal Australasian College of Surgeons’ (RACS) vision is to champion surgical standards, professionalism and surgical education in Australia and New Zealand. It is committed to advocating for sustainable, safe, affordable and high quality healthcare that represents best practice.
Similarly, Medibank is committed to improving our customers’ health outcomes, enhancing patient experiences and improving the affordability of healthcare for all Australians. In doing so, we aim to help to create a more affordable and sustainable health system for all.
In 2016 RACS and Medibank published the inaugural Surgical Variance Report, which covered five specialties, including general surgery, urology, otolaryngology, head and neck surgery, vascular surgery and orthopaedic surgery. These reports were based on de-identified Medibank claims data from 2014. These reports were sent to RACS Fellows and are available online. The purpose of developing and publishing these reports was to address a gap in the information available to surgeons on clinical and other indicators, for different procedures in their specialty, particularly within the private sector. These reports highlighted variation between surgeons in clinical and other indicators for a number of high volume procedures. In shining a light on this variation, the reports identified opportunities to provide guidance on best practice. One example was variation between surgeons in same day rates for hernia repair surgery. In response, RACS undertook a literature review on the evidence for same day hernia surgery, and have released a report which recommends a target for day hernia rates.
The feedback received on the inaugural Surgical Variance Reports was overwhelmingly positive and RACS and Medibank are pleased to publish updated reports for all five surgical specialties in 2017. This Surgical Variance Report 2017: Orthopaedic Surgery, is the second in the series of updated reports to be published over the next few months.
The procedures included and indicators analysed in these reports remain the same as those in the original Surgical Variance Reports, however these reports are based on analysis of de-identified Medibank claims data from the two most recent financial years (years 2015 and 2016).
We believe that information transparency is an important tool in improving clinical outcomes and patient care and hope that these reports encourage surgeons to reflect on their own practice. RACS and Medibank will continue to work together to identify opportunities to improve and enhance these reports so that they are as meaningful and useful as possible to surgeons, and we welcome everyone’s feedback and comments.
Mr John Batten
President Royal Australasian College of Surgeons
Dr Linda Swan
Chief Medical Officer Medibank

Surgical Variance Report 2017 – Orthopaedic Surgery 2
Foreword
Information transparency is the key to improving the outcomes and experience for patients using the healthcare sector, and ensuring its long term sustainability. Following the successful release of the inaugural Surgical Variance Reports by the Royal Australasian College of Surgeons (RACS) and Medibank in 2016, it was appropriate that ongoing responsibility for continuing and improving on this important transparency initiative was passed to the Sustainability in Healthcare Committee.
The Sustainability in Healthcare Committee contributes to the development of strategies that focus on the long-term provision of high quality healthcare that is affordable and financially sustainable.
These second editions of the Surgical Variance Reports contain the same procedures and indicators as the inaugural reports, but two years of data has been analysed to increase the number of surgeons included in the data sample as well as the number of procedures analysed.
The objective of these reports is to explore variation in surgical practice and to raise questions for surgeons to consider. The analysis presented in these reports provide numerous examples of observed variation between surgeons. The lengths of patient stay in hospital, the frequency of readmissions and the out of pockets charged for the same procedures are just some examples of observed variation between surgeons for the same procedures. This variation may be due to clinical factors, however it may also represent an opportunity to change clinical practice to improve patient outcomes and the sustainability of the healthcare system.
The Sustainability in Healthcare Committee will continue to explore how analysing and sharing healthcare data can contribute to driving high quality, affordable and financially sustainable healthcare. This will include working with Medibank to make this data available to individual surgeons, should they request it, so that they can see how they compare with their peers.
The debate about the financial sustainability of our healthcare system will continue, and surgeons should reflect on the important contribution they can make in the delivery of better value healthcare. These reports inform us about a number of the drivers of value in healthcare, and by making this information transparent and publically available, our hope is that they contribute to continuous improvement in our healthcare system.
Mr Lawrie Malisano Chair, Sustainability in Healthcare Committee
Surgical Variance Report 2017 – Orthopaedic Surgery 3
Data used in the report
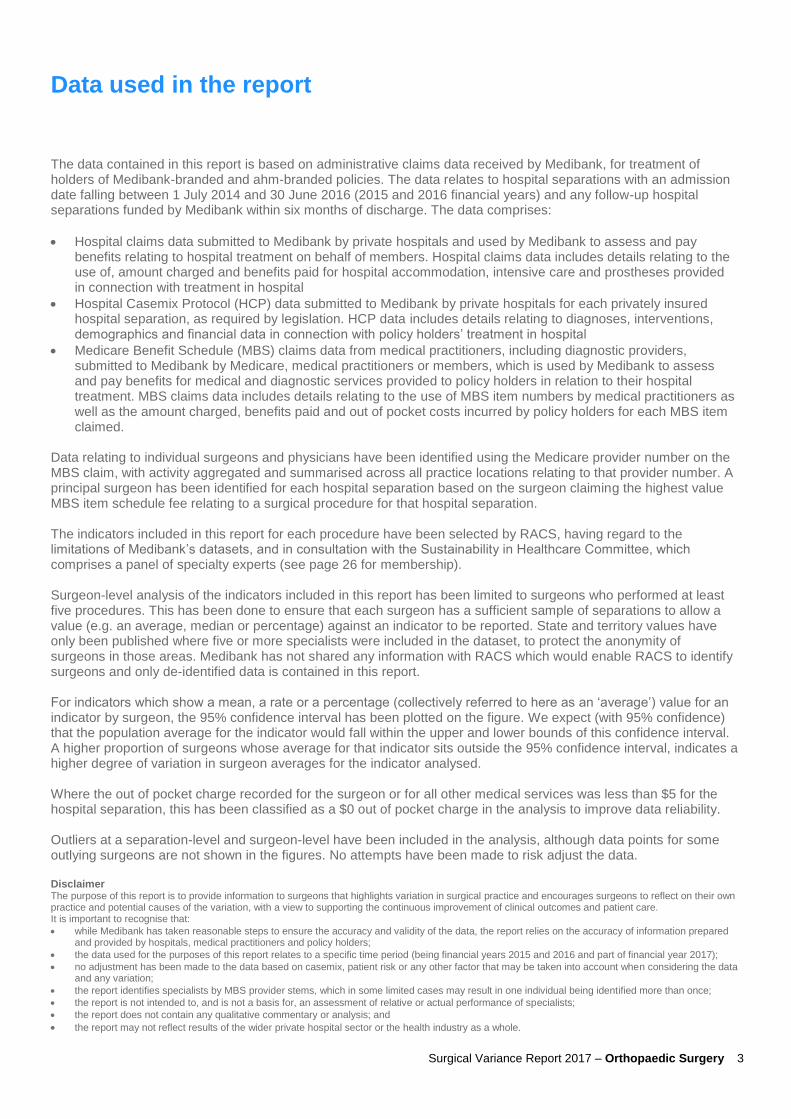
The data contained in this report is based on administrative claims data received by Medibank, for treatment of holders of Medibank-branded and ahm-branded policies. The data relates to hospital separations with an admission date falling between 1 July 2014 and 30 June 2016 (2015 and 2016 financial years) and any follow-up hospital separations funded by Medibank within six months of discharge. The data comprises:
Hospital claims data submitted to Medibank by private hospitals and used by Medibank to assess and pay benefits relating to hospital treatment on behalf of members. Hospital claims data includes details relating to the use of, amount charged and benefits paid for hospital accommodation, intensive care and prostheses provided in connection with treatment in hospital
Hospital Casemix Protocol (HCP) data submitted to Medibank by private hospitals for each privately insured hospital separation, as required by legislation. HCP data includes details relating to diagnoses, interventions, demographics and financial data in connection with policy holders’ treatment in hospital
Medicare Benefit Schedule (MBS) claims data from medical practitioners, including diagnostic providers, submitted to Medibank by Medicare, medical practitioners or members, which is used by Medibank to assess and pay benefits for medical and diagnostic services provided to policy holders in relation to their hospital treatment. MBS claims data includes details relating to the use of MBS item numbers by medical practitioners as well as the amount charged, benefits paid and out of pocket costs incurred by policy holders for each MBS item claimed.
Data relating to individual surgeons and physicians have been identified using the Medicare provider number on the MBS claim, with activity aggregated and summarised across all practice locations relating to that provider number. A principal surgeon has been identified for each hospital separation based on the surgeon claiming the highest value MBS item schedule fee relating to a surgical procedure for that hospital separation.
The indicators included in this report for each procedure have been selected by RACS, having regard to the limitations of Medibank’s datasets, and in consultation with the Sustainability in Healthcare Committee, which comprises a panel of specialty experts (see page 26 for membership). Surgeon-level analysis of the indicators included in this report has been limited to surgeons who performed at least five procedures. This has been done to ensure that each surgeon has a sufficient sample of separations to allow a value (e.g. an average, median or percentage) against an indicator to be reported. State and territory values have only been published where five or more specialists were included in the dataset, to protect the anonymity of surgeons in those areas. Medibank has not shared any information with RACS which would enable RACS to identify surgeons and only de-identified data is contained in this report.
For indicators which show a mean, a rate or a percentage (collectively referred to here as an ‘average’) value for an indicator by surgeon, the 95% confidence interval has been plotted on the figure. We expect (with 95% confidence) that the population average for the indicator would fall within the upper and lower bounds of this confidence interval. A higher proportion of surgeons whose average for that indicator sits outside the 95% confidence interval, indicates a higher degree of variation in surgeon averages for the indicator analysed. Where the out of pocket charge recorded for the surgeon or for all other medical services was less than $5 for the hospital separation, this has been classified as a $0 out of pocket charge in the analysis to improve data reliability. Outliers at a separation-level and surgeon-level have been included in the analysis, although data points for some outlying surgeons are not shown in the figures. No attempts have been made to risk adjust the data. Disclaimer The purpose of this report is to provide information to surgeons that highlights variation in surgical practice and encourages surgeons to reflect on their own practice and potential causes of the variation, with a view to supporting the continuous improvement of clinical outcomes and patient care. It is important to recognise that:
while Medibank has taken reasonable steps to ensure the accuracy and validity of the data, the report relies on the accuracy of information prepared and provided by hospitals, medical practitioners and policy holders;
the data used for the purposes of this report relates to a specific time period (being financial years 2015 and 2016 and part of financial year 2017);
no adjustment has been made to the data based on casemix, patient risk or any other factor that may be taken into account when considering the data and any variation;
the report identifies specialists by MBS provider stems, which in some limited cases may result in one individual being identified more than once;
the report is not intended to, and is not a basis for, an assessment of relative or actual performance of specialists;
the report does not contain any qualitative commentary or analysis; and
the report may not reflect results of the wider private hospital sector or the health industry as a whole.

Surgical Variance Report 2017 – Orthopaedic Surgery 4
Indicators measured in this report
A selection of the indicators described below have been analysed for each of the three procedures included in this report.
Indicator Explanation
Median age of patients The median age of a surgeon’s patients at the time of discharge.
Median length of stay (nights) The median number of nights that a surgeon’s patients stayed in hospital.
Percentage of separations where the patient was transferred to ICU
Separations where patients were transferred to an intensive care unit (ICU), expressed as a percentage of a surgeon’s total separations for that procedure.
Rate of Hospital Acquired Complications per 1,000 separations
Separations where a Hospital Acquired Complication was identified, expressed as a rate per 1,000 separations of a surgeon’s total separations for that procedure. Hospital Acquired Complications are Medibank’s subset of 82 International Classification of Diseases (ICD) codes drawn from the Australian Commission of Safety and Quality in Health Care’s hospital acquired complications dataset (see Table 27). They are selected on the basis that they occur frequently in private hospitals (relative to other complications) and are likely to result in increased costs. Separations for which Medibank did not have a matching Hospital Casemix Protocol record have been excluded from this analysis.
Percentage of patients transferred to inpatient rehabilitation
Separations where patients were transferred to inpatient rehabilitation within one day of discharge from the acute separation, expressed as a percentage of a surgeon’s total separations for that procedure.
Percentage of patients readmitted within 30 days
Separations where patients were readmitted to the same or a different hospital within 30 days of discharge from the original separation, expressed as a percentage of a surgeon’s total separations for that procedure. Readmissions for all-causes except for readmissions for rehabilitation, psychiatric treatment, dialysis and chemotherapy, were included. Separations involving a patient 80 years or older were excluded from this analysis.
Average number of MBS items billed
The total number of MBS items billed by a surgeon, expressed as an average number of MBS items billed per separation for a surgeon.
Average prostheses cost The total of all charges relating to prostheses items (including consumables) for a hospital separation, expressed as an average prostheses cost per separation for a surgeon.
Average separation cost The total of all charges relating to the hospital separation, expressed as an average cost per separation for a surgeon. Includes all charges raised by the hospital, medical practitioners, diagnostic providers and for prostheses items.
Average surgeon out of pocket charge
The patient out of pocket charge from the principal surgeon. Expressed as an average out of pocket charge per separation for a surgeon. This only includes out of pockets charged to the patient that were identified on the medical claim submitted to Medibank. Separations where the out of pocket charge recorded was less than $5 have been classified as a $0 out of pocket charge in the analysis to improve data reliability.
Average out of pocket charge for other medical services
The patient out of pocket charge for all other medical services (including charges from the anaesthetist, assistant surgeon and for diagnostics). Expressed as an average out of pocket charge for other medical services per separation, for a surgeon. This only includes out of pockets charged to the patient that were identified on the medical claim submitted to Medibank. Separations where the out of pocket charge recorded was less than $5 have been classified as a $0 out of pocket charge in the analysis to improve data reliability.

Surgical Variance Report 2017 – Orthopaedic Surgery 5
Hip replacement procedures
Hip replacement procedures
In financial years 2015 and 2016 Medibank funded 9,947 operations in private hospitals where hip replacement was recorded as the principal procedure (highest value MBS fee from the medical claim) for the hospital admission. The analysis is limited to those 9,947 procedures. 642 surgeons (identified through the stem of their Medicare provider number) billed Medibank for those procedures. 449 (70%) of these surgeons billed Medibank for five or more procedures during financial years 2015 and 2016. Surgeon-level analysis of the indicators considered for this procedure has been limited to those surgeons with five or more patient separations, so that each surgeon has a sufficient sample of separations from which a value (e.g. an average, median or percentage) for an indicator can be reported.
Table 1: MBS Codes
Procedure MBS Codes Volume of Separations
Percentage of Separations
Definition
Hip replacement procedures
49318 8,145 82% Hip, total replacement arthroplasty of, including minor bone grafting (Anaes.) (Assist.)
49321 1,802 18% Hip, total replacement arthroplasty of, including major bone grafting, including obtaining of graft (Anaes.) (Assist.)
----Surgeons with 5 or more separations
Across all the separations the median patient age was 69 years.
For the 449 surgeons who performed at least five procedures:
The median age of a surgeon’s patients ranged from 40 years to 82 years.
Is this variation in age clinically expected?

Surgical Variance Report 2017 – Orthopaedic Surgery 6
Hip replacement procedures
(2 low volume (less than five separations) outlier(s) not shown on chart)
----Surgeons with 5 or more separations
For the 449 surgeons who performed at least five procedures:
The median number of nights that a surgeon’s patients stayed in hospital ranged between 1 night (same day admission and discharge) and 10 nights with a median of 5 nights.
Table 2: Median length of stay (nights) by state/territory
State/territory ACT NSW NT QLD SA TAS VIC WA
Length of stay 5 5 4 5 5 4 5 4
What would you consider the most effective length of stay for this procedure?
----Surgeons with 5 or more separations
_____ 95% confidence interval (upper and lower bound)
Patients were transferred to an intensive care unit (ICU) in 4% of overall hospital separations. Administrative claims data does not indicate whether the transfers were planned or unplanned. For 264 (70%) of these ICU transfers, the patient was in ICU for one day or less.
For the 449 surgeons who performed at least five procedures:
162 (36%) surgeons had one or more patient separations during which patients were transferred to ICU
The percentage of a surgeon’s patients that were transferred to ICU ranged between 0% and 67% with a median of 0%.
Given that ICU transfers could indicate a difficult post-operative recovery, what would be the expected transfer rate?

Surgical Variance Report 2017 – Orthopaedic Surgery 7
Hip replacement procedures
_____ 95% confidence interval (upper and lower bound)
----Surgeons with 5 or more separations
(2 low volume (less than five separations) outlier(s) not shown on chart)
Hospital Acquired Complications are a Medibank subset of 82 International Classification of Diseases (ICD) codes drawn from the Australian Commission of Safety and Quality in Health Care’s hospital acquired complications (see Table 27). The rate of Hospital Acquired Complications was 14 per 1,000 hospital separations.*
For the 431 surgeons who performed at least five procedures:
87 (20%) surgeons had one or more patient separations during which a Hospital Acquired Complication was identified
The rate of Hospital Acquired Complications for a surgeon ranged between 0 per 1,000 separations to 400 per 1,000 separations with a median of 0 per 1,000 separations.
* Separations for which Medibank did not have a matching HCP record have been excluded from the analysis (as there was insufficient information to identify whether a Hospital Acquired Complication did or did not occur).
Table 3: Hospital Acquired Complications identified during the hospital separation
Description Number recorded
Other surgical complications 81
Post-operative haemorrhage and haematoma 15
Surgical site infection 11
Prosthesis associated infection 9
Intracranial injury 1
Other fractures 1
Venous thrombosis 1
What complications have you had for this procedure?

Surgical Variance Report 2017 – Orthopaedic Surgery 8
Hip replacement procedures
----Surgeons with 5 or more separations
_____ 95% confidence interval (upper and lower bound)
Across the total sample of 9,947 hospital separations, patients were transferred to inpatient rehabilitation* following 3,618 hospital separations (36%).
For the 449 surgeons who performed at least five procedures:
57 (13%) had no patients referred to inpatient rehabilitation
374 (83%) surgeons had one or more patients referred to inpatient rehabilitation
18 (4%) had all of their patients referred to inpatient rehabilitation
The percentage of a surgeon’s patients that were transferred to rehabilitation ranged between 0% and 100% with a median of 32%.
The data shows significant variation between surgeons as to whether they send their patients to inpatient rehabilitation or discharge them home (potentially for home-based, community-based or outpatient rehabilitation). Consequently, a large proportion of surgeons sit outside the 95% confidence interval (both above and below). Therefore we would caution against use of the 95% confidence interval to identify outliers from normal or indeed best practice. *Administrative claims data indicated that the patient was discharged from acute care and admitted to a rehabilitation facility (or rehabilitation ward within the same hospital) within 24 hours
Table 4: Percentage of patients transferred to rehabilitation by state/territory
Category ACT NSW NT QLD SA TAS VIC WA
Transfer rate 27% 54% 57% 27% 29% 6% 43% 12%
What would be the expected transfer rate to rehabilitation?

Surgical Variance Report 2017 – Orthopaedic Surgery 9
Hip replacement procedures
----Surgeons with 5 or more separations
_____ 95% confidence interval (upper and lower bound)
Following 613 (6%) of separations patients were readmitted (for all causes)* to a hospital within 30 days. Administrative claims data does not indicate whether the readmissions were planned or unplanned. The median age of patients readmitted was 69 years, compared with a median age of 67 years for those patients not readmitted. Of the 613 separations followed by a readmission:
474 readmissions were to a private hospital (either the same hospital or a different one). In 91 of these separations, at least one Hospital Acquired Complication was identified (see Table 5).
139 readmissions were to a public hospital (where the patient was treated as a private patient).
For the 425 surgeons who performed at least five procedures (on patients less than 80 years old), the percentage of a surgeon’s patients readmitted within 30 days ranged between 0% and 63% with a median of 6%. Readmissions to public hospitals, where patients were treated as public patients, are not captured in these datasets.
*This analysis excludes any separations where the patient was 80 years or older. Readmissions for rehabilitation, psychiatric treatment, dialysis and chemotherapy were excluded where identified.
Table 5: Hospital Acquired Complications identified on readmission
Description Number recorded
Surgical site infection 37
Prosthesis associated infection 27
Other surgical complications 18
Post-operative haemorrhage and haematoma 7
Fractured neck of femur 2
What are the reasons for readmission for this procedure, and what is the expected rate?

Surgical Variance Report 2017 – Orthopaedic Surgery 10
Hip replacement procedures
----Surgeons with 5 or more separations
_____ 95% confidence interval (upper and lower bound)
(1 low volume (less than five separations) outlier(s) not shown on chart)
The average number of MBS items billed by a surgeon (the principal surgeon only) was 1.4 per hospital separation.
Of the 449 surgeons who performed five or more procedures, the average number of MBS items billed by a surgeon ranged between 1 and 4.1 with a median of 1.1.
The top five MBS items billed by the surgeon for separations where MBS item # 49318 was the principal procedure (8,145 separations) are shown in the table below.
Table 6: Top five MBS items billed by the surgeon (principal procedure MBS # 49318)
MBS Item number
Description Total frequency Frequency per
separation
49318 Hip, total replacement arthroplasty of, including minor bone grafting (Anaes.) (Assist.)
8,156 1.00
00105 Professional attendance by a specialist in the practice of his or her specialty where the patient is referred to him or her each attendance subsequent to the first in a single course of treatment where that attendance is at consulting rooms, hospital or residential aged care facility
2,390 0.29
00104 Professional attendance by a specialist in the practice of his or her specialty where the patient is referred to him or her an attendance (other than a second or subsequent attendance in a single course of treatment) where that attendance is at consulting rooms, hospital or nursing home, not being a service to which item 106 applies
220 0.03
18222 Infusion of a therapeutic substance to maintain regional anaesthesia or analgesia, subsequent injection or revision of, where the period of continuous medical practitioner attendance is 15 minutes or less
70 0.01
47930 Plate, rod or nail and associated wires, pins or screws, 1 or more of, all of which were inserted for internal fixation purposes, removal of, not being a service associated with a service to which item 47924 or 47927 applies - per bone (Anaes.) (Assist.)
51 0.01
What are the reasons for the wide variation in the number of MBS items billed?

Surgical Variance Report 2017 – Orthopaedic Surgery 11
Hip replacement procedures
----Surgeons with 5 or more separations
_____ 95% confidence interval (upper and lower bound)
(1 low volume (less than five separations) outlier(s) not shown on chart)
The average cost of prostheses items was $11,671 per hospital separation.
For the 449 surgeons who performed at least five procedures, the average cost of prostheses for a surgeon ranged between $5,011 and $19,132 with a median of $11,450.
Are you aware of the associated costs for prostheses items used for this procedure? What are the reasons for the variation in costs between surgeons?
----Surgeons with 5 or more separations
_____ 95% confidence interval (upper and lower bound)
The separation cost includes the total charges for the hospital separation, including payments made by Medibank, Medicare and the patient. Costs include hospital, prostheses, medical practitioners and diagnostic services. The average total cost per hospital separation was $27,079.
For the 449 surgeons who performed at least five procedures, the average separation cost of a surgeon ranged between $19,439 and $42,007 with a median of $26,350.
Table 7: Average separation cost by state/territory
State/territory ACT NSW NT QLD SA TAS VIC WA
Average separation cost
$28,201 $27,762 $28,663 $26,145 $25,031 $27,145 $27,862 $25,796
Are you aware of the associated costs for this procedure such as pathology, diagnostic imaging, surgical assistants, anaesthetists, hospital bed fees? What are the reasons for variation in separation costs?

Surgical Variance Report 2017 – Orthopaedic Surgery 12
Hip replacement procedures
----Surgeons with 5 or more separations _____ 95% confidence interval (upper and lower bound)
Patients were charged an out of pocket fee by the principal surgeon in 42% of separations and the average out of pocket charged was $2,054. This only includes out of pocket charges that were identified on the medical claim submitted to Medibank.
For the 449 surgeons who performed at least five procedures, 158 (35%) did not charge any of their patients an out of pocket for the hospital admission. The average out of pocket charged by these surgeons ranged from $0 (no out of pocket charged) to $5,567 with a median of $141.
Table 8: Surgeon out of pocket charges by state/territory
State/territory ACT NSW NT QLD SA TAS VIC WA
% of separations with OOP
82% 63% 74% 49% 2% 39% 31% 37%
Average OOP charged
$2,591 $2,673 $2,697 $1,827 $556 $681 $1,997 $799
Why is there such variation in the average out of pocket charge?
----Surgeons with 5 or more separations
_____ 95% confidence interval (upper and lower bound)
Patients were charged an out of pocket fee for other medical services (including charges raised by the anaesthetist, assistant surgeon and for diagnostics) in 77% of the hospital separations and the average charge was $494. This only includes out of pocket charges that were identified on the medical claim submitted to Medibank.
For the 449 surgeons who performed at least five procedures, the average out of pocket charges received by their patients for other medical services ranged between $0 and $2,464 with a median of $209.
Table 9: Out of pocket charges for other medical services by state/territory
State/territory ACT NSW NT QLD SA TAS VIC WA
% of separations with OOP
95% 79% 91% 78% 65% 40% 80% 82%
Average OOP charged
$1,194 $965 $524 $425 $181 $136 $325 $214
Why is there such variation in the average out of pocket charge?
Surgical Variance Report 2017 – Orthopaedic Surgery 13
Knee replacement procedures
Knee replacement procedures
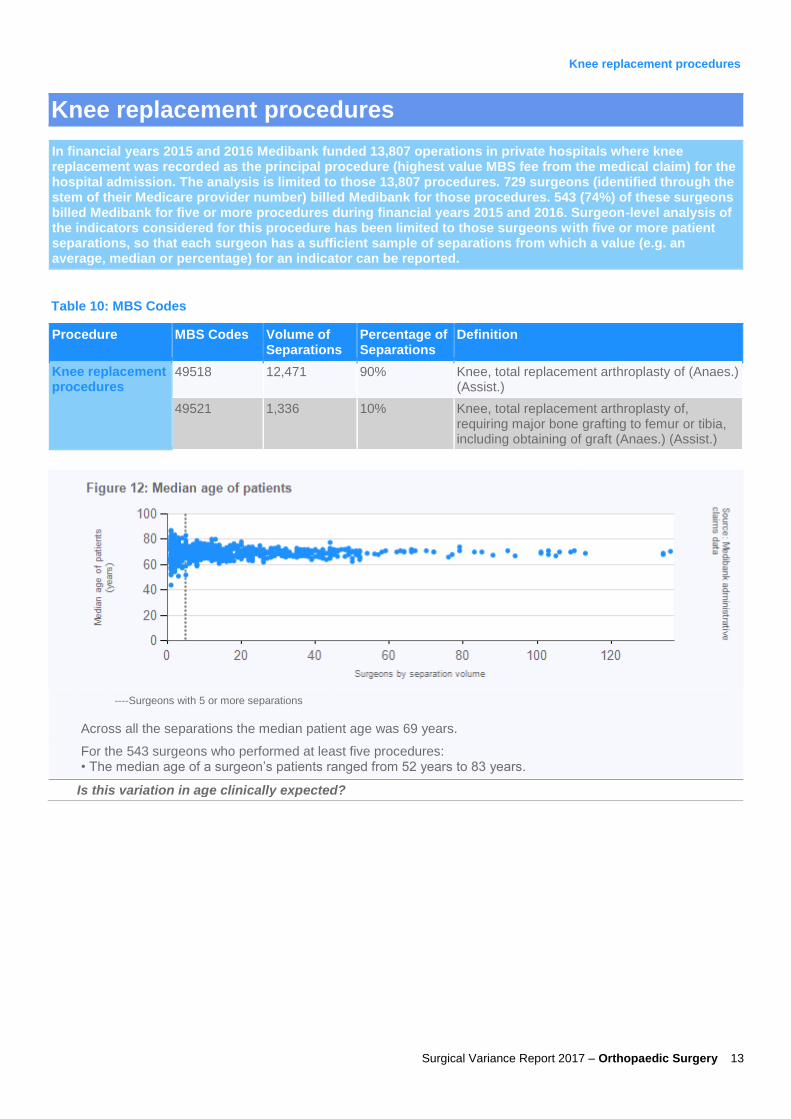
In financial years 2015 and 2016 Medibank funded 13,807 operations in private hospitals where knee replacement was recorded as the principal procedure (highest value MBS fee from the medical claim) for the hospital admission. The analysis is limited to those 13,807 procedures. 729 surgeons (identified through the stem of their Medicare provider number) billed Medibank for those procedures. 543 (74%) of these surgeons billed Medibank for five or more procedures during financial years 2015 and 2016. Surgeon-level analysis of the indicators considered for this procedure has been limited to those surgeons with five or more patient separations, so that each surgeon has a sufficient sample of separations from which a value (e.g. an average, median or percentage) for an indicator can be reported.
Table 10: MBS Codes
Procedure MBS Codes Volume of Separations
Percentage of Separations
Definition
Knee replacement procedures
49518 12,471 90% Knee, total replacement arthroplasty of (Anaes.) (Assist.)
49521 1,336 10% Knee, total replacement arthroplasty of, requiring major bone grafting to femur or tibia, including obtaining of graft (Anaes.) (Assist.)
----Surgeons with 5 or more separations
Across all the separations the median patient age was 69 years.
For the 543 surgeons who performed at least five procedures: • The median age of a surgeon’s patients ranged from 52 years to 83 years.
Is this variation in age clinically expected?

Surgical Variance Report 2017 – Orthopaedic Surgery 14
Knee replacement procedures
----Surgeons with 5 or more separations
(4 low volume (less than five separations) outlier(s) not shown on chart)
For the 543 surgeons who performed at least five procedures:
The median number of nights that a surgeon’s patients stayed in hospital ranged between 1 night (same day admission and discharge) and 8.5 nights with a median of 5 nights.
Table 11: Median length of stay (nights) by state/territory
State/territory ACT NSW NT QLD SA TAS VIC WA
Length of stay 5 5 3 5 5 6 5 5
What would you consider the most effective length of stay for this procedure?
----Surgeons with 5 or more separations
_____ 95% confidence interval (upper and lower bound)
Patients were transferred to an intensive care unit (ICU) in 3% of overall hospital separations. Administrative claims data does not indicate whether the transfers were planned or unplanned. For 271 (77%) of these ICU transfers, the patient was in ICU for one day or less.
For the 543 surgeons who performed at least five procedures:
162 (30%) surgeons had one or more patient separations during which patients were transferred to ICU
The percentage of a surgeon’s patients that were transferred to ICU ranged between 0% and 40% with a median of 0%.
Given that ICU transfers could indicate a difficult post-operative recovery, what would be the expected transfer rate?

Surgical Variance Report 2017 – Orthopaedic Surgery 15
Knee replacement procedures
----Surgeons with 5 or more separations
_____ 95% confidence interval (upper and lower bound)
(8 low volume (less than five separations) outlier(s) not shown on chart)
Hospital Acquired Complications are a Medibank subset of 82 International Classification of Diseases (ICD) codes drawn from the Australian Commission of Safety and Quality in Health Care’s hospital acquired complications (see Table 27). The rate of Hospital Acquired Complications was 11 per 1,000 hospital separations.*
For the 513 surgeons who performed at least five procedures:
96 (19%) surgeons had one or more patient separations during which a Hospital Acquired Complication was identified
The rate of Hospital Acquired Complications for a surgeon ranged between 0 per 1,000 separations to 200 per 1,000 separations with a median of 0 per 1,000 separations.
* Separations for which Medibank did not have a matching HCP record have been excluded from the analysis (as there was insufficient information to identify whether a Hospital Acquired Complication did or did not occur).
Table 12: Hospital Acquired Complications identified during the hospital separation
Description Number recorded
Other surgical complications 65
Post-operative haemorrhage and haematoma 24
Prosthesis associated infection 18
Surgical site infection 17
Blood stream infection 4
Pulmonary embolism 2
What complications have you had for this procedure?
Surgical Variance Report 2017 – Orthopaedic Surgery 16
Knee replacement procedures
----Surgeons with 5 or more separations
_____ 95% confidence interval (upper and lower bound)
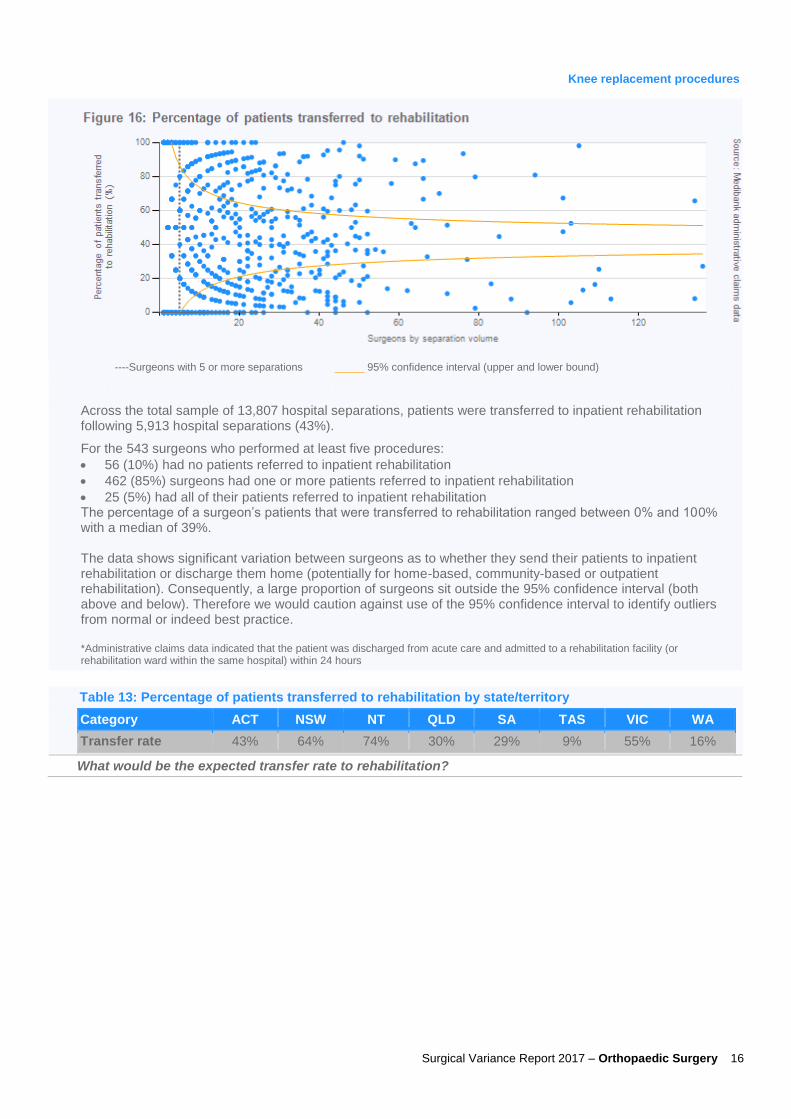
Across the total sample of 13,807 hospital separations, patients were transferred to inpatient rehabilitation following 5,913 hospital separations (43%).
For the 543 surgeons who performed at least five procedures:
56 (10%) had no patients referred to inpatient rehabilitation
462 (85%) surgeons had one or more patients referred to inpatient rehabilitation
25 (5%) had all of their patients referred to inpatient rehabilitation The percentage of a surgeon’s patients that were transferred to rehabilitation ranged between 0% and 100% with a median of 39%. The data shows significant variation between surgeons as to whether they send their patients to inpatient rehabilitation or discharge them home (potentially for home-based, community-based or outpatient rehabilitation). Consequently, a large proportion of surgeons sit outside the 95% confidence interval (both above and below). Therefore we would caution against use of the 95% confidence interval to identify outliers from normal or indeed best practice. *Administrative claims data indicated that the patient was discharged from acute care and admitted to a rehabilitation facility (or rehabilitation ward within the same hospital) within 24 hours
Table 13: Percentage of patients transferred to rehabilitation by state/territory
Category ACT NSW NT QLD SA TAS VIC WA
Transfer rate 43% 64% 74% 30% 29% 9% 55% 16%
What would be the expected transfer rate to rehabilitation?

Surgical Variance Report 2017 – Orthopaedic Surgery 17
Knee replacement procedures
----Surgeons with 5 or more separations
_____ 95% confidence interval (upper and lower bound)
Following 960 (7%) of separations patients were readmitted (for all causes)* to a hospital within 30 days. Administrative claims data does not indicate whether the readmissions were planned or unplanned. The median age of patients readmitted was 70 years, compared with a median age of 68 years for those patients not readmitted. Of the 960 separations followed by a readmission:
700 readmissions were to a private hospital (either the same hospital or a different one). In 120 of these separations, at least one Hospital Acquired Complication was identified (see Table 14).
260 readmissions were to a public hospital (where the patient was treated as a private patient).
For the 528 surgeons who performed at least five procedures (on patients less than 80 years old), the percentage of a surgeon’s patients readmitted within 30 days ranged between 0% and 67% with a median of 6%. Readmissions to public hospitals, where patients were treated as public patients, are not captured in these datasets.
*This analysis excludes any separations where the patient was 80 years or older. Readmissions for rehabilitation, psychiatric treatment, dialysis and chemotherapy were excluded where identified.
Table 14: Hospital Acquired Complications identified on readmission
Description Number recorded
Surgical site infection 44
Prosthesis associated infection 31
Post-operative haemorrhage and haematoma 25
Other surgical complications 17
Stage III ulcer 3
What are the reasons for readmission for this procedure, and what is the expected rate?

Surgical Variance Report 2017 – Orthopaedic Surgery 18
Knee replacement procedures
----Surgeons with 5 or more separations
_____ 95% confidence interval (upper and lower bound)
The average number of MBS items billed by a surgeon (the principal surgeon only) was 1.4 per hospital separation.
Of the 543 surgeons who performed five or more procedures, the average number of MBS items billed by a surgeon ranged between 1 and 4.8 with a median of 1.1.
The top five MBS items billed by the surgeon for separations where MBS item # 49518 was the principal procedure (12,470 separations) are shown in the table below.
Table 15: Top five MBS items billed by the surgeon (principal procedure MBS # 49518)
MBS Item number Description Total frequency Frequency per separation
49518 Knee, total replacement arthroplasty of (Anaes.) (Assist.) 12,493 1.00
00105 Professional attendance by a specialist in the practice of his or her specialty where the patient is referred to him or her each attendance subsequent to the first in a single course of treatment where that attendance is at consulting rooms, hospital or residential aged care facility
3,192 0.26
49509 Knee, total synovectomy of, arthrodesis of, patello-femoral stabilisation or repair of cruciate ligament - any 1 procedure (Anaes.) (Assist.)
419 0.03
48400 Phalanx, metatarsal, accessory bone or sesamoid bone, osteotomy or osteectomy of, excluding services to which item 49848 or 49851 applies (Anaes.) (Assist.)
105 0.01
18222 Infusion of a therapeutic substance to maintain regional anaesthesia or analgesia, subsequent injection or revision of, where the period of continuous medical practitioner attendance is 15 minutes or less
69 0.01
What are the reasons for the wide variation in the number of MBS items billed?

Surgical Variance Report 2017 – Orthopaedic Surgery 19
Knee replacement procedures
----Surgeons with 5 or more separations
_____ 95% confidence interval (upper and lower bound)
The average cost of prostheses items was $9,191 per hospital separation.
For the 543 surgeons who performed at least five procedures, the average cost of prostheses for a surgeon ranged between $6,211 and $15,438 with a median of $8,958.
Are you aware of the associated costs for prostheses items used for this procedure? What are the reasons for the variation in costs between surgeons?
----Surgeons with 5 or more separations
_____ 95% confidence interval (upper and lower bound)
The separation cost includes the total charges for the hospital separation, including payments made by Medibank, Medicare and the patient. Costs include hospital, prostheses, medical practitioners and diagnostic services. The average total cost per hospital separation was $22,925.
For the 543 surgeons who performed at least five procedures, the average separation cost of a surgeon ranged between $17,797 and $30,285 with a median of $22,639.
Table 16: Average separation cost by state/territory
State/territory ACT NSW NT QLD SA TAS VIC WA
Average separation cost
$24,415 $23,674 $21,754 $22,505 $21,030 $21,814 $23,394 $22,441
Are you aware of the associated costs for this procedure such as pathology, diagnostic imaging, surgical assistants, anaesthetists, hospital bed fees? What are the reasons for variation in separation costs?

Surgical Variance Report 2017 – Orthopaedic Surgery 20
Knee replacement procedures
----Surgeons with 5 or more separations
_____ 95% confidence interval (upper and lower bound)
Patients were charged an out of pocket fee by the principal surgeon in 39% of separations and the average out of pocket charged was $1,885. This only includes out of pocket charges that were identified on the medical claim submitted to Medibank.
For the 543 surgeons who performed at least five procedures, 192 (35%) did not charge any of their patients an out of pocket for the hospital admission. The average out of pocket charged by these surgeons ranged from $0 (no out of pocket charged) to $5,137 with a median of $162.
Table 17: Surgeon out of pocket charges by state/territory
State/territory ACT NSW NT QLD SA TAS VIC WA
% of separations with OOP
79% 59% 58% 46% 1% 29% 24% 42%
Average OOP charged
$2,588 $2,499 $2,065 $1,725 $397 $496 $1,609 $804
Why is there such variation in the average out of pocket charge?
----Surgeons with 5 or more separations
_____ 95% confidence interval (upper and lower bound)
Patients were charged an out of pocket fee for other medical services (including charges raised by the anaesthetist, assistant surgeon and for diagnostics) in 72% of the hospital separations and the average charge was $457. This only includes out of pocket charges that were identified on the medical claim submitted to Medibank.
For the 543 surgeons who performed at least five procedures, the average out of pocket charges received by their patients for other medical services ranged between $0 and $2,382 with a median of $171.
Table 18: Out of pocket charges for other medical services by state/territory
State/territory ACT NSW NT QLD SA TAS VIC WA
% of separations with OOP
93% 73% 79% 74% 61% 33% 75% 80%
Average OOP charged
$1,273 $893 $501 $377 $181 $150 $281 $166
Why is there such variation in the average out of pocket charge?
Surgical Variance Report 2017 – Orthopaedic Surgery 21
Knee ACL repair procedures
Knee ACL repair procedures
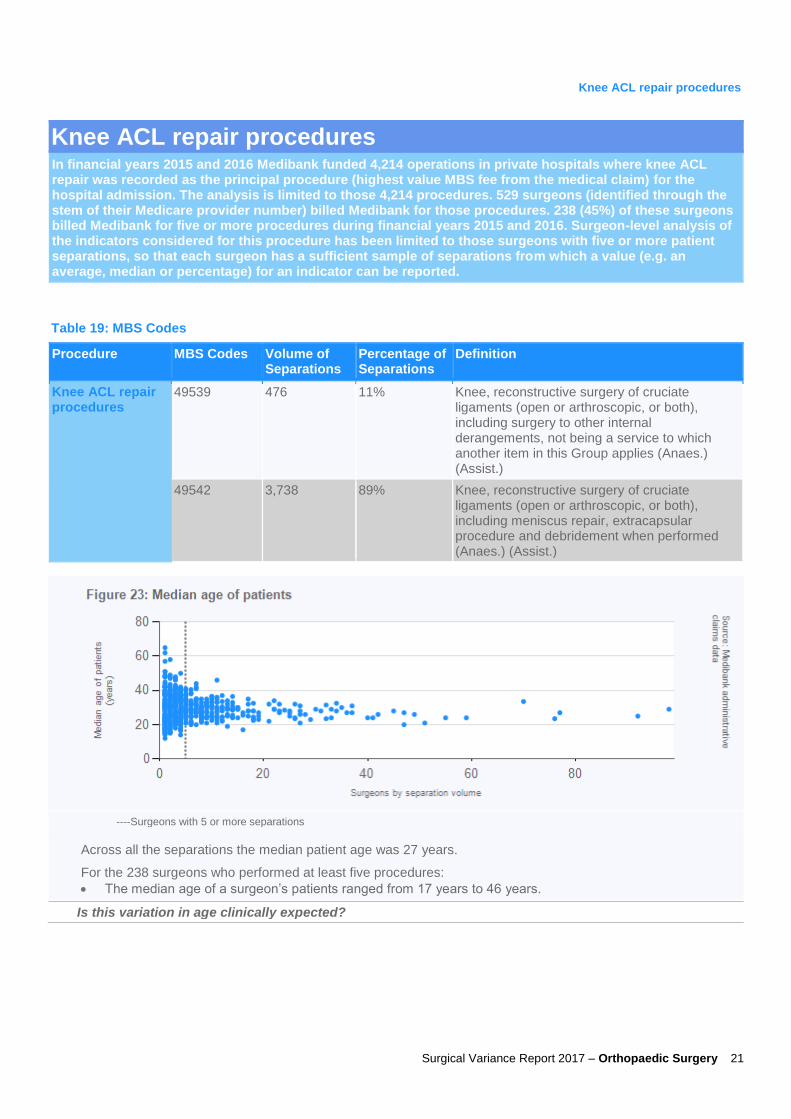
In financial years 2015 and 2016 Medibank funded 4,214 operations in private hospitals where knee ACL repair was recorded as the principal procedure (highest value MBS fee from the medical claim) for the hospital admission. The analysis is limited to those 4,214 procedures. 529 surgeons (identified through the stem of their Medicare provider number) billed Medibank for those procedures. 238 (45%) of these surgeons billed Medibank for five or more procedures during financial years 2015 and 2016. Surgeon-level analysis of the indicators considered for this procedure has been limited to those surgeons with five or more patient separations, so that each surgeon has a sufficient sample of separations from which a value (e.g. an average, median or percentage) for an indicator can be reported.
Table 19: MBS Codes
Procedure MBS Codes Volume of Separations
Percentage of Separations
Definition
Knee ACL repair procedures
49539 476 11% Knee, reconstructive surgery of cruciate ligaments (open or arthroscopic, or both), including surgery to other internal derangements, not being a service to which another item in this Group applies (Anaes.) (Assist.)
49542 3,738 89% Knee, reconstructive surgery of cruciate ligaments (open or arthroscopic, or both), including meniscus repair, extracapsular procedure and debridement when performed (Anaes.) (Assist.)
----Surgeons with 5 or more separations
Across all the separations the median patient age was 27 years.
For the 238 surgeons who performed at least five procedures:
The median age of a surgeon’s patients ranged from 17 years to 46 years.
Is this variation in age clinically expected?
Surgical Variance Report 2017 – Orthopaedic Surgery 22
Knee ACL repair procedures
----Surgeons with 5 or more separations
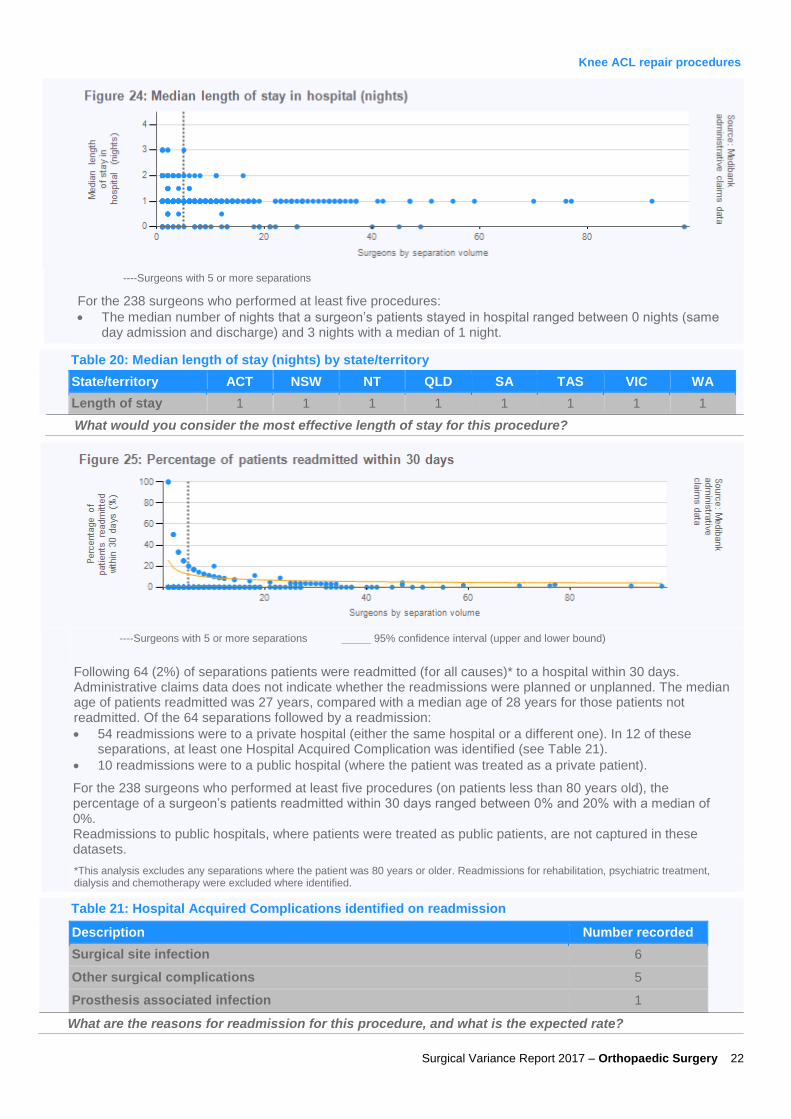
For the 238 surgeons who performed at least five procedures:
The median number of nights that a surgeon’s patients stayed in hospital ranged between 0 nights (same day admission and discharge) and 3 nights with a median of 1 night.
Table 20: Median length of stay (nights) by state/territory
State/territory ACT NSW NT QLD SA TAS VIC WA
Length of stay 1 1 1 1 1 1 1 1
What would you consider the most effective length of stay for this procedure?
----Surgeons with 5 or more separations
_____ 95% confidence interval (upper and lower bound)
Following 64 (2%) of separations patients were readmitted (for all causes)* to a hospital within 30 days. Administrative claims data does not indicate whether the readmissions were planned or unplanned. The median age of patients readmitted was 27 years, compared with a median age of 28 years for those patients not readmitted. Of the 64 separations followed by a readmission:
54 readmissions were to a private hospital (either the same hospital or a different one). In 12 of these separations, at least one Hospital Acquired Complication was identified (see Table 21).
10 readmissions were to a public hospital (where the patient was treated as a private patient).
For the 238 surgeons who performed at least five procedures (on patients less than 80 years old), the percentage of a surgeon’s patients readmitted within 30 days ranged between 0% and 20% with a median of 0%. Readmissions to public hospitals, where patients were treated as public patients, are not captured in these datasets.
*This analysis excludes any separations where the patient was 80 years or older. Readmissions for rehabilitation, psychiatric treatment, dialysis and chemotherapy were excluded where identified.
Table 21: Hospital Acquired Complications identified on readmission
Description Number recorded
Surgical site infection 6
Other surgical complications 5
Prosthesis associated infection 1
What are the reasons for readmission for this procedure, and what is the expected rate?

Surgical Variance Report 2017 – Orthopaedic Surgery 23
Knee ACL repair procedures
----Surgeons with 5 or more separations
_____ 95% confidence interval (upper and lower bound)
(1 low volume (less than five separations) outlier(s) not shown on chart)
The average number of MBS items billed by a surgeon (the principal surgeon only) was 1.3 per hospital separation.
Of the 238 surgeons who performed five or more procedures, the average number of MBS items billed by a surgeon ranged between 1 and 3.2 with a median of 1.1.
The top five MBS items billed by the surgeon for separations where MBS item # 49542 was the principal procedure (3,738 separations) are shown in the table below.
Table 22: Top five MBS items billed by the surgeon (principal procedure MBS # 49542)
MBS Item number Description Total frequency Frequency per separation
49542 Knee, reconstructive surgery of cruciate ligaments (open or arthroscopic, or both), including meniscus repair, extracapsular procedure and debridement when performed (Anaes.) (Assist.)
3,743 1.00
00105 Professional attendance by a specialist in the practice of his or her specialty where the patient is referred to him or her each attendance subsequent to the first in a single course of treatment where that attendance is at consulting rooms, hospital or residential aged care facility
702 0.19
47966 Tendon or ligament transfer, not being a service to which another item in this Group applies (Anaes.) (Assist.)
112 0.03
48206 Tibia, bone graft to (Anaes.) (Assist.) 98 0.03
51303 Assistance at any operation for which the fee exceeds $325.45 or at a combination of operations for which the aggregate fee exceeds $325.45 provided that the fee for at least 1 of the operations exceeds $183.20
42 0.01
What are the reasons for the wide variation in the number of MBS items billed?

Surgical Variance Report 2017 – Orthopaedic Surgery 24
Knee ACL repair procedures
----Surgeons with 5 or more separations
_____ 95% confidence interval (upper and lower bound)
(2 low volume (less than five separations) outlier(s) not shown on chart)
The average cost of prostheses items was $1,560 per hospital separation.
For the 238 surgeons who performed at least five procedures, the average cost of prostheses for a surgeon ranged between $0 and $7,120 with a median of $1,257.
Are you aware of the associated costs for prostheses items used for this procedure? What are the reasons for the variation in costs between surgeons?
----Surgeons with 5 or more separations
_____ 95% confidence interval (upper and lower bound)
(1 low volume (less than five separations) outlier(s) not shown on chart)
The separation cost includes the total charges for the hospital separation, including payments made by Medibank, Medicare and the patient. Costs include hospital, prostheses, medical practitioners and diagnostic services. The average total cost per hospital separation was $8,364.
For the 238 surgeons who performed at least five procedures, the average separation cost of a surgeon ranged between $5,076 and $13,950 with a median of $8,135.
Table 23: Average separation cost by state/territory
State/territory ACT NSW NT QLD SA TAS VIC WA
Average separation cost
$9,365 $8,794 $7,242 $8,335 $7,330 $7,276 $8,346 $8,310
Are you aware of the associated costs for this procedure such as pathology, diagnostic imaging, surgical assistants, anaesthetists, hospital bed fees? What are the reasons for variation in separation costs?

Surgical Variance Report 2017 – Orthopaedic Surgery 25
Knee ACL repair procedures
----Surgeons with 5 or more separations
_____ 95% confidence interval (upper and lower bound)
(1 low volume (less than five separations) outlier(s) not shown on chart)
Patients were charged an out of pocket fee by the principal surgeon in 54% of separations and the average out of pocket charged was $1,767. This only includes out of pocket charges that were identified on the medical claim submitted to Medibank.
For the 238 surgeons who performed at least five procedures, 57 (24%) did not charge any of their patients an out of pocket for the hospital admission. The average out of pocket charged by these surgeons ranged from $0 (no out of pocket charged) to $2,907 with a median of $374.
Table 24: Surgeon out of pocket charges by state/territory
State/territory ACT NSW NT QLD SA TAS VIC WA
% of separations with OOP
89% 72% 21% 65% 5% 30% 45% 46%
Average OOP charged
$2,338 $2,248 $2,229 $1,577 $415 $321 $1,671 $1,014
Why is there such variation in the average out of pocket charge?
----Surgeons with 5 or more separations
_____ 95% confidence interval (upper and lower bound)
(2 low volume (less than five separations) outlier(s) not shown on chart)
Patients were charged an out of pocket fee for other medical services (including charges raised by the anaesthetist, assistant surgeon and for diagnostics) in 62% of the hospital separations and the average charge was $431. This only includes out of pocket charges that were identified on the medical claim submitted to Medibank.
For the 238 surgeons who performed at least five procedures, the average out of pocket charges received by their patients for other medical services ranged between $0 and $1,362 with a median of $155.
Table 25: Out of pocket charges for other medical services by state/territory
State/territory ACT NSW NT QLD SA TAS VIC WA
% of separations with OOP
92% 72% 69% 61% 56% 29% 68% 31%
Average OOP charged
$731 $696 $387 $428 $218 $176 $250 $205
Why is there such variation in the average out of pocket charge?

Surgical Variance Report 2017 – Orthopaedic Surgery 26
Sustainability in Healthcare Committee membership
Dr Lawrie Malisano
(Orthopaedic Surgeon, QLD), Chair
Dr Richard Perry (General Surgeon, NZ) Mr Christopher Perry (Otolaryngology, Head and Neck Surgeon, QLD)
Prof David Fletcher (General Surgeon, WA)
Prof Mark Frydenberg (Urology Surgeon, VIC)
Mr Bruce Hall (Neurosurgeon, QLD)
Mr Richard Lander (Orthopaedic Surgeon, NZ)
Dr Sally Langley (Plastic and Reconstructive Surgeon, NZ)
Prof Guy Maddern (General Surgeon, SA)
Mr John Quinn (Vascular Surgeon, QLD)
Mr John Crozier (Vascular Surgeon, NSW) Mr David Winkle (Urology Surgeon, QLD)

Surgical Variance Report 2017 – Orthopaedic Surgery 27
Definitions
Table 26: Definitions
Term Definition
ACT Australian Capital Territory
HCP Hospital Casemix Protocol. HCP data includes details of diagnoses, interventions, demographics and financial data relating to members’ treatment in hospital
Hospital Acquired Complication Medibank’s subset of 82 ICD10 codes drawn from the Australian Commission of Safety and Quality in Healthcare’s high priority complications dataset (see Table 27).
ICD International Classification of Diseases. The ICD is the standard diagnostic tool for epidemiology, health management and clinical purposes.
ICU Intensive Care Unit
MBS Medicare Benefit Schedule
Median The middle number in a given sequence of numbers
NSW New South Wales
NT Northern Territory
QLD Queensland
SA South Australia
Operation Surgery performed on a patient that may involve one or more surgical procedures
Out of pocket charge The amount payable by the patient to a medical provider (including medical practitioners and diagnostics providers) for services performed during the hospital separation
Principal surgeon/specialist The surgeon/specialist who billed the MBS item with the highest fee in a separation
Primary procedure The procedure performed on the patient with the highest value MBS fee
RACS Royal Australasian College of Surgeons
Separation The episode of admitted patient care
VIC Victoria
WA Western Australia
Table 27: Categories of Hospital Acquired Complications
Category Sub-Category
Pressure Injury NA (only includes type 3 and 4 pressure ulcers)
Falls Cranial Injury Other Fracture Femoral Fracture
Healthcare Associated Infection Urinary Tract Infection Surgical Site Infection
Blood Stream Infection Prostheses Site Infection
Surgical Complication Post-operative Haemorrhage and Haematoma
Other surgical complications including, thrombophlebitis, transfusion reaction, accidental puncture and laceration, wound disruption
Venous Thromboembolism Pulmonary Embolism Venous Thrombosis

For enquiries in relation to this report please contact
[email protected] enquiries – Dr David Rankin: [email protected] enquiries – Bronwyn Perry: [email protected]