Surface charge features of Kaolinite particles and their ...
227
SURFACE CHARGE FEATURES OF KAOLINITE PARTICLES AND THEIR INTERACTIONS by Vishal Gupta A dissertation submitted to the faculty of The University of Utah in partial fulfillment of the requirements for the degree of Doctor of Philosophy Department of Metallurgical Engineering The University of Utah May 2011
Transcript of Surface charge features of Kaolinite particles and their ...
SURFACE CHARGE FEATURES OF KAOLINITE
PARTICLES AND THEIR INTERACTIONS
by
Vishal Gupta
A dissertation submitted to the faculty of The University of Utah
in partial fulfillment of the requirements for the degree of
Doctor of Philosophy
Department of Metallurgical Engineering
The University of Utah
May 2011
Copyright Vishal Gupta 2011
All Rights Reserved
T h e U n i v e r s i t y o f U t a h G r a d u a t e S c h o o l
STATEMENT OF DISSERTATION APPROVAL
The dissertation of Vishal Gupta
has been approved by the following supervisory committee members
Jan D Miller Chair 11232010
Date Approved
Vladimir Hlady Member 11232010
Date Approved
Sivaraman Guruswamy Member 11232010
Date Approved
Michael L Free Member 11232010
Date Approved
Xuming Wang Member 11232010
Date Approved
and by Jan D Miller Chair of
the Department of Metallurgical Engineering
and by Charles A Wight Dean of The Graduate School
ABSTRACT
Kaolinite is both a blessing and a curse As an important industrial mineral
commodity kaolinite clays are extensively used in the paper ceramic paint plastic and
rubber industries In all these applications the wettability aggregation dispersion
flotation and thickening of kaolinite particles are affected by its crystal structure and
surface properties It is therefore the objective of this research to investigate selected
physical and surface chemical properties of kaolinite specifically the surface charge of
kaolinite particles
A pool of advanced analytical techniques such as XRD XRF SEM AFM FTIR
and ISS were utilized to investigate the morphological and surface chemistry features of
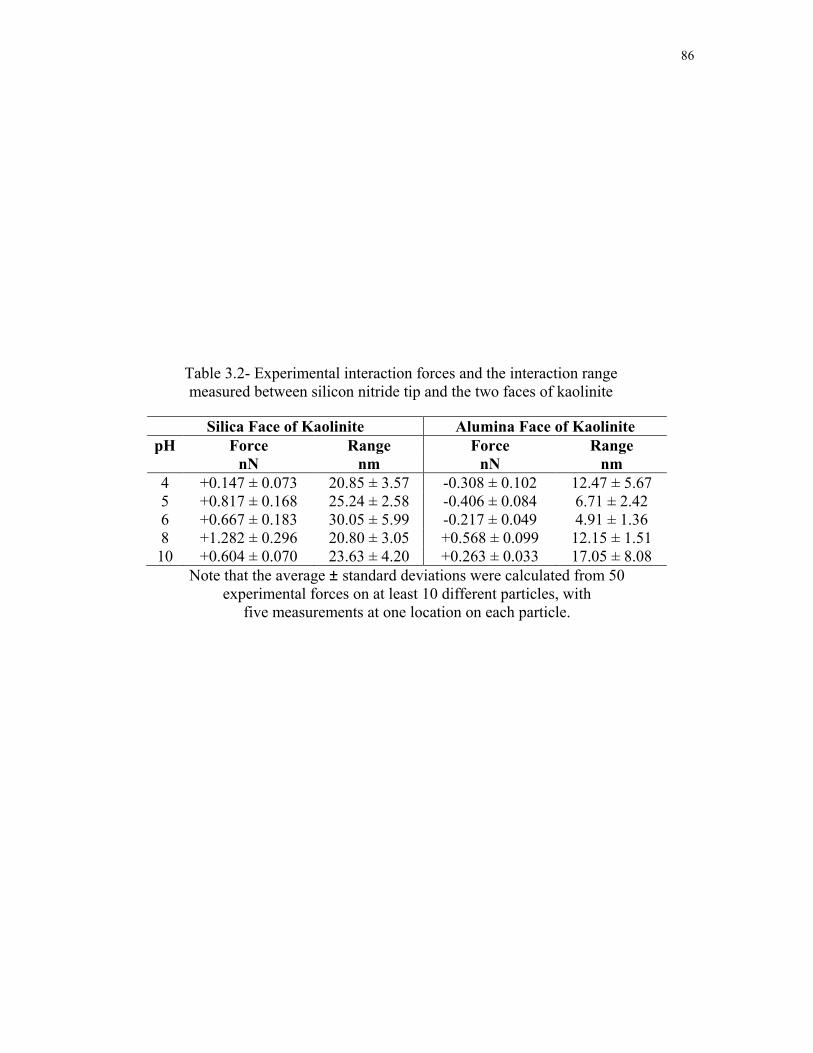
kaolinite Surface force measurements revealed that the silica tetrahedral face of kaolinite
is negatively charged at pH gt 4 whereas the alumina octahedral face of kaolinite is
positively charged at pH lt 6 and negatively charged at pH gt 8
Based on electrophoresis measurements the apparent iso-electric point for
kaolinite particles was determined to be less than pH 3 In contrast the point of zero
charge was determined to be pH 45 by titration techniques which corresponds to the iso-
electric point of between pH 4 and 5 as determined by surface force measurements
Results from kaolinite particle interactions indicate that the silica facendashalumina
face interaction is dominant for kaolinite particle aggregation at low and intermediate pH
values which explains the maximum shear yield stress at pH 5-55
iv
Lattice resolution images reveal the hexagonal lattice structure of these two face
surfaces of kaolinite Analysis of the silica face of kaolinite showed that the center of the
hexagonal ring of oxygen atoms is vacant whereas the alumina face showed that the
hexagonal surface lattice ring of hydroxyls surround another hydroxyl in the center of the
ring
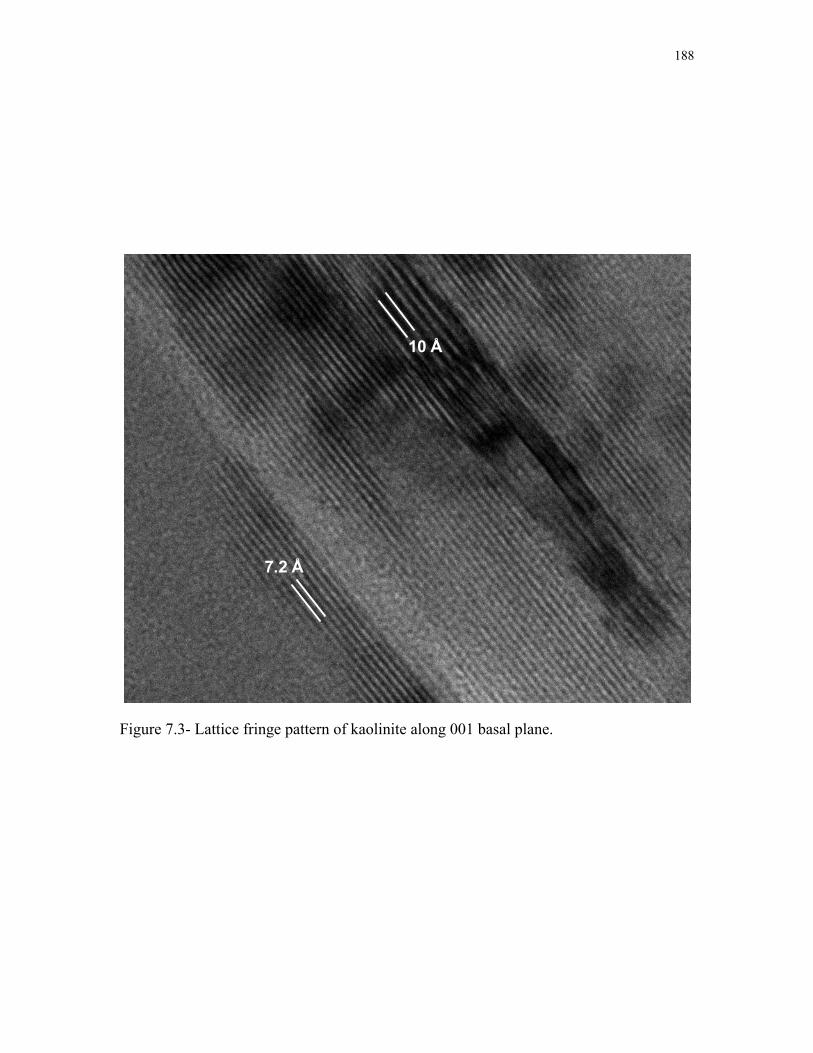
High resolution transmission electron microscopy investigation of kaolinite has
indicated that kaolinite is indeed composed of silicaalumina bilayers with a c-spacing of
72 Aring
The surface charge densities of the silica face the alumina face and the edge
surface of kaolinite all influence particle interactions and thereby affect the mechanical
properties of kaolinite suspensions The improved knowledge of kaolinite surface
chemistry from this dissertation research provides a foundation for the development of
improved process strategies for both the use and disposal of clay particles such as
kaolinite
To my family and my wife Priyanka
CONTENTS
ABSTRACT iii
LIST OF TABLES ix
LIST OF FIGURES x
ACKNOWLEDGMENTS xv
CHAPTER
1 INTRODUCTION 1
11 Review of Literature 8 12 Clay Mineralogy 9
121 Bilayer Clay Minerals (11) 9 122 Triple Layer Clay Minerals (21) 12
13 Kaolinite Structure 14 14 Kaolinite Chemistry 14 15 Kaolinite Optical and Physical Properties 16 16 Kaolinite Genesis 16 17 Surface Chemistry of Kaolinite 17 18 Overall Objective 20 19 Research Organization 21
2 CHARACTERIZATION OF KAOLINITE PARTICLES 24
21 Introduction 25 22 Materials and Methods 28
221 Sample Preparation 28 222 Surface Area 28 223 Chemical Composition 29
2231 Energy Dispersive Spectrometry (EDS) 29 2232 X-ray Fluorescence Spectroscopy (XRF) 30
224 Mineralogy 31 225 Kaolinite Particle Size and Thickness 33
2251 Scanning Electron Microscopy (SEM) 33 2252 Atomic Force Microscopy (AFM) 34
226 Surface Spectroscopy of Kaolinite 38
vii
2261 X-ray Photoelectron Spectroscopy (XPS) 39 2262 Ion Scattering Spectroscopy (ISS) 41 2263 Chemical Bonding ndash FTIR Spectroscopy 44
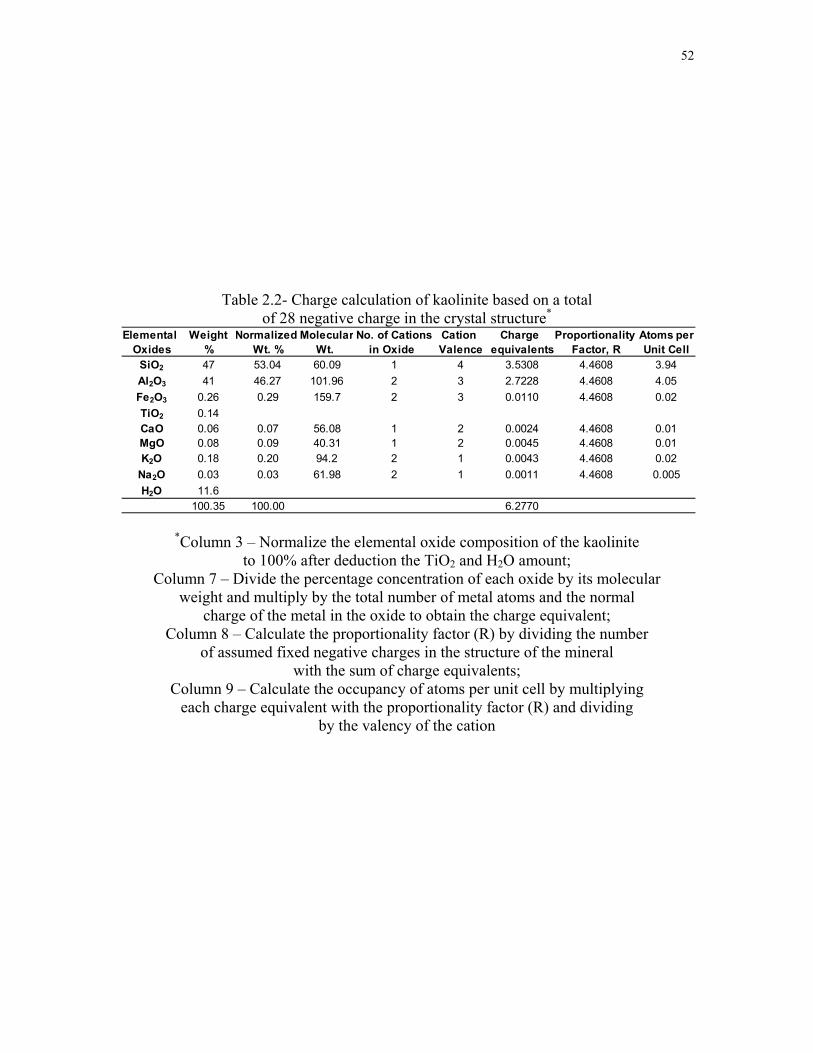
23 Results and Discussion 47 231 Mineralogy and Elemental Analysis 47 232 Structural Formula 47 233 Shape Size and Aspect Ratio 53 234 Surface Spectroscopy of Kaolinite 56
24 Summary 61
3 SURFACE FORCE MEASUREMENTS AT THE BASAL PLANES OF ORDERED KAOLINITE PARTICLES 63
31 Introduction 64 32 Materials and Methods 68
321 Sample Preparation 68 322 Substrate Preparation 68 323 Atomic Force Microscopy 69 324 DLVO (Derjaguin-Landau-Verwey-Overbeek) Model 72
33 Results and Discussion 76 331 Interaction Forces at Reference Substrates 76 332 Interaction Forces at Kaolinite Faces 82 333 Surface Potential and Surface Charge 88
34 Summary 92
4 ELECTROKINETICS AND TITRATION OF KAOLINITE PARTICLES 94
41 Introduction 95 42 Materials and Methods 96
421 Sample Preparation 96 422 Zeta-Potential Measurements 97 423 Mular-Roberts (M-R) Titration 98 424 Potentiometric Titration 98
43 Electrokinetic Theory 99 431 Electrophoresis in the Limit κa ≪ 1 111 432 Electrophoresis in the Limit κa ≫ 1 116
44 Results and Discussion 119 441 Zeta-Potential of Kaolinite by Electrophoresis 119 442 Mular-Roberts (M-R) Titration 122 443 Potentiometric Titration 124 444 Zeta-Potential of Kaolinite by Surface Force Measurements 126 445 Cation Exchange Capacity (CEC) 129
45 Summary 134
5 PARTICLE INTERACTIONS IN KAOLINITE SUSPENSIONS AND CORRESPONDING AGGREGATE STRUCTURES 135
viii
51 Introduction 136 52 Materials and Methods 141
521 Sample Preparation 141 522 Aggregate Size 142 523 Cryo-SEM 143 524 DLVO Model 144
53 Results and Discussion 147 531 Particle Interactions 148 532 Influence of Aspect Ratio 155 533 Influence of Electrical Double Layer Thickness 157 534 Aggregate Structure 157 535 Aggregate Size 162
54 Summary 165
6 CRYSTAL LATTICE IMAGING OF THE SILICA AND ALUMINA FACES OF KAOLINITE USING ATOMIC FORCE MICROSCOPY 167
61 Introduction 168 62 Materials and Methods 170
621 Sample Preparation 170 622 Substrate Preparation 171 623 Atomic Force Microscopy 172
63 Results and Discussion 173 64 Summary 180
7 HIGH RESOLUTION TRANSMISSION ELECTRON MICROSCOPY OF KAOLINITE 181
71 Introduction 181 72 Sample Preparation 183 73 Electron Microscopy 184 74 Results and Discussion 184 75 Summary 193
8 CONCLUSIONS AND FUTURE RESEARCH 194
REFERENCES 199
LIST OF TABLES
Table
11- World kaolin production [2]
Page
2
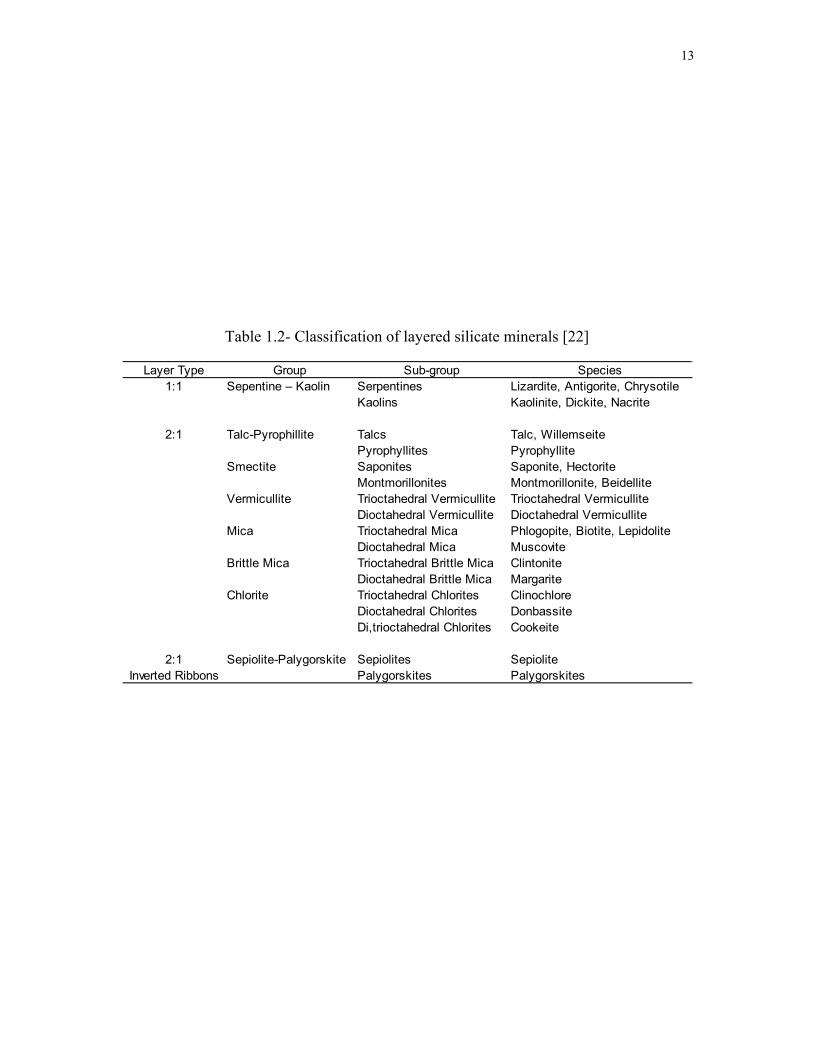
12- Classification of layered silicate minerals [22] 13
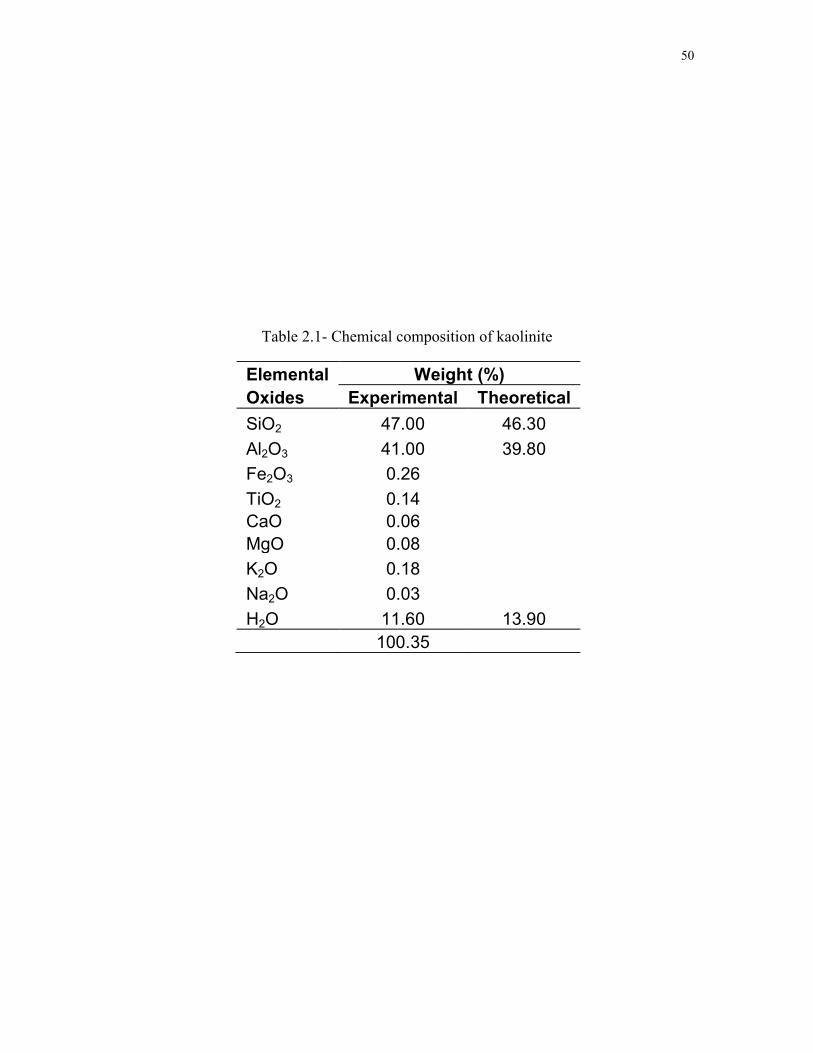
21- Chemical composition of kaolinite 50
22- Charge calculation of kaolinite based on a total of 28 negative charge in the crystal structure 52
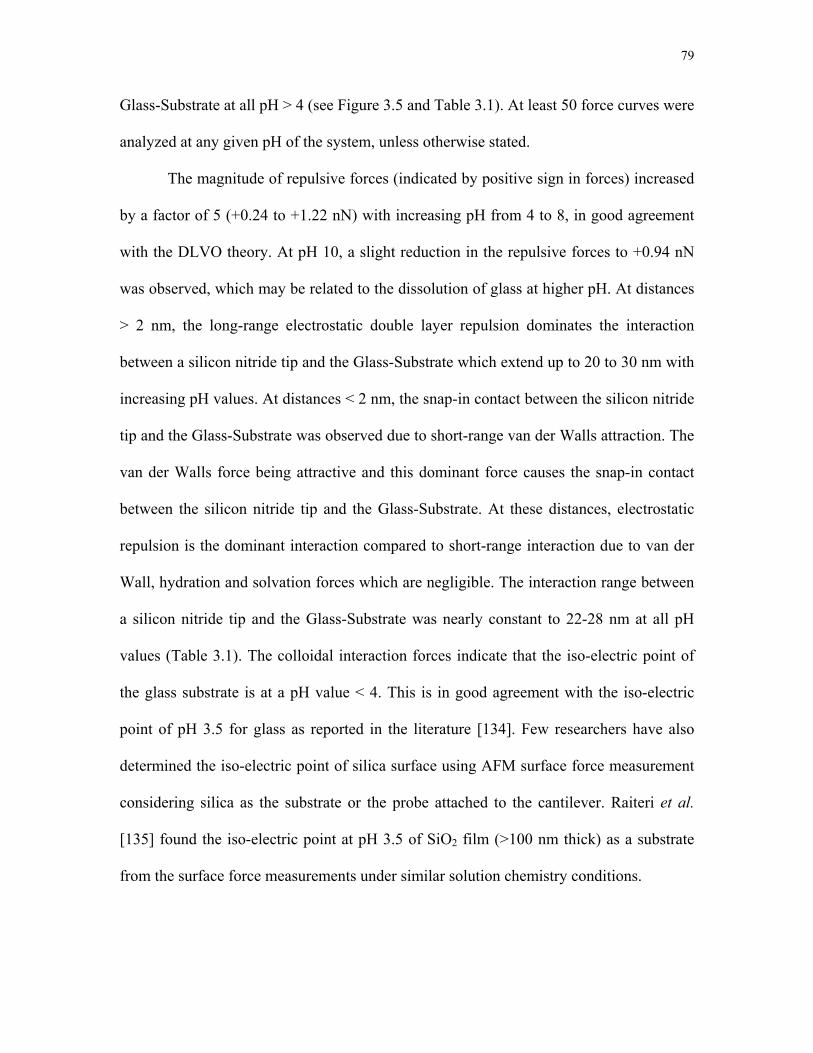
31- Experimental interaction forces and the interaction range measured between silicon nitride tip and the substrates 80
32- Experimental interaction forces and the interaction range measured between silicon nitride tip and the two faces of kaolinite 86
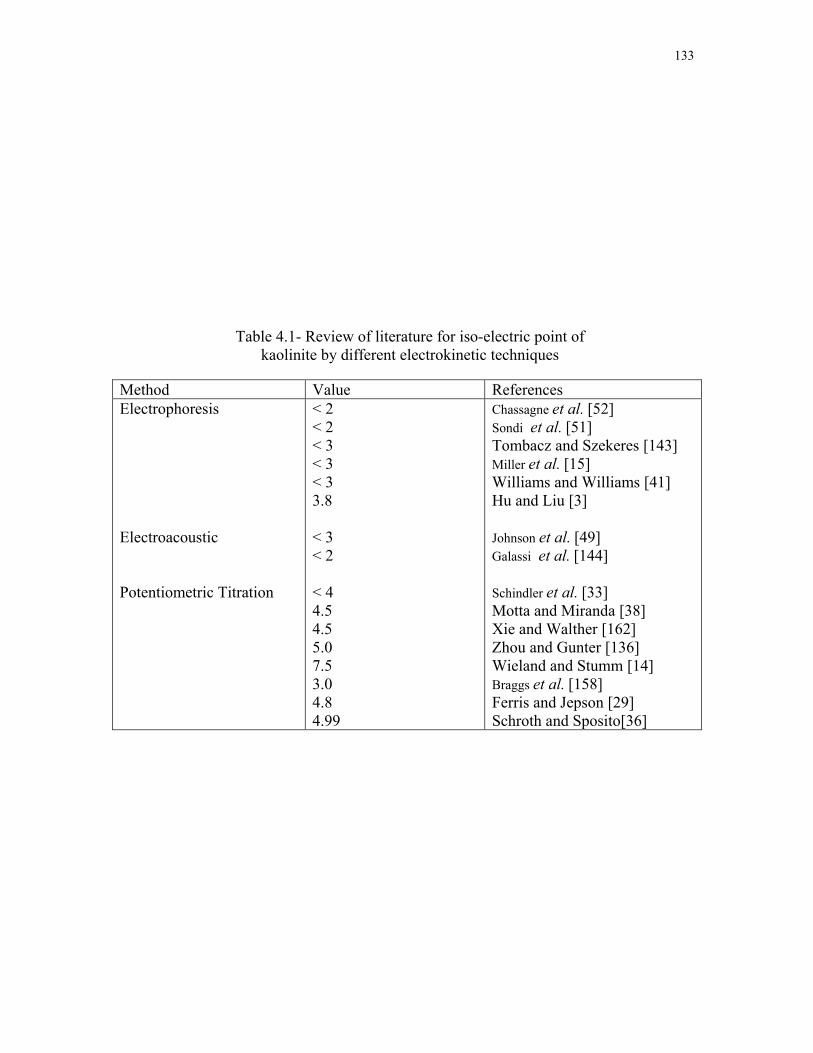
41- Review of literature for iso-electric point of kaolinite by different electrokinetic techniques 133
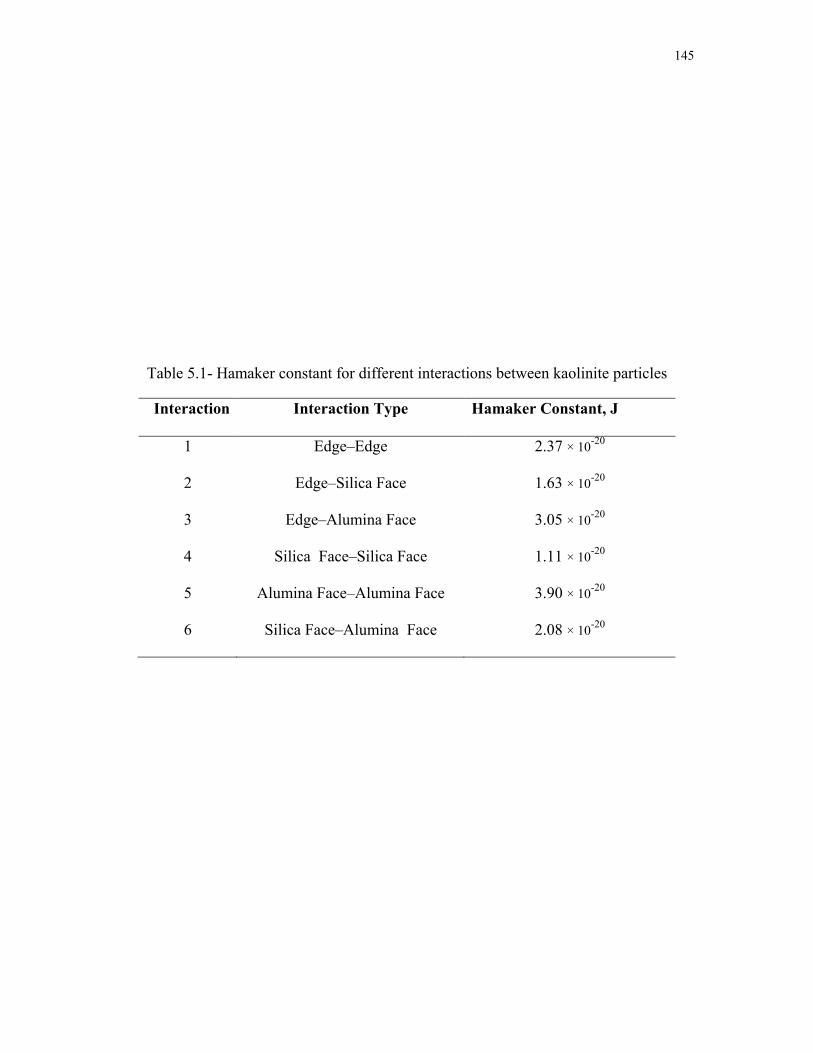
51- Hamaker constant for different interactions between kaolinite particles 145
LIST OF FIGURES
Figure Page
11-Side view (A) and top view (B) of kaolinite (001) surface structure The silica tetrahedra (red oxygen blue silicon) and the alumina octahedra (yellow aluminum green hydroxyl) bilayers thought to be bound together via hydrogen bonding are illustrated in (A)
6
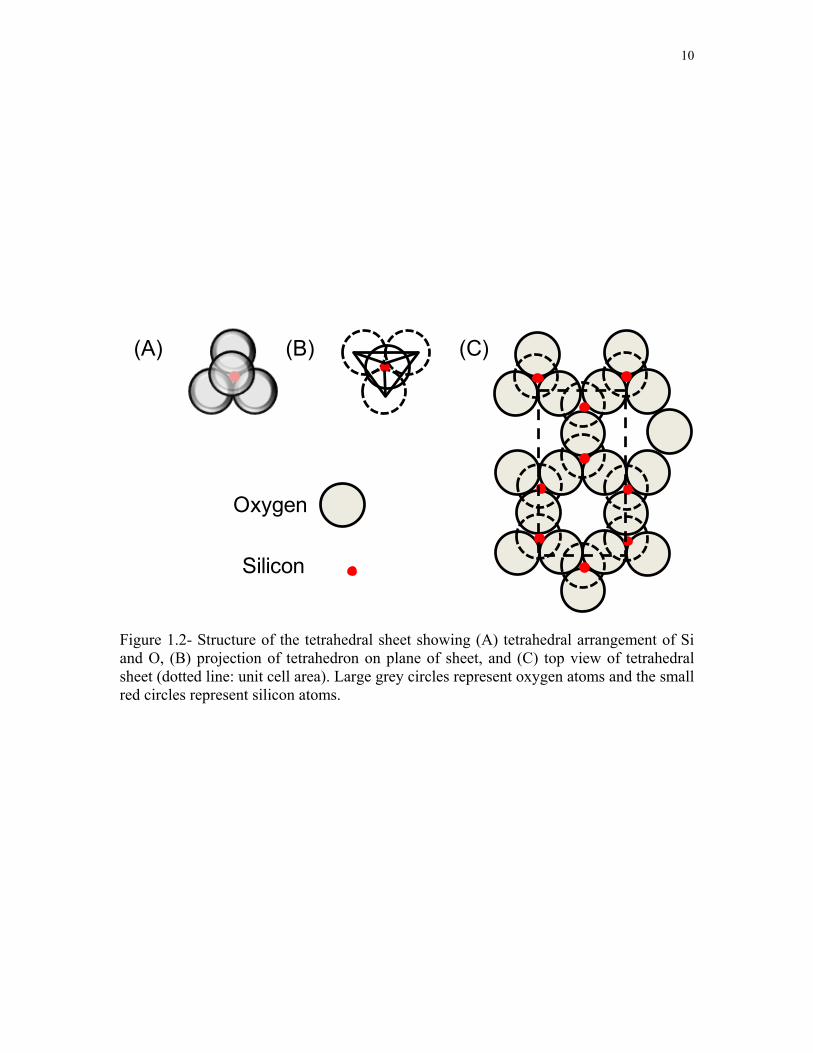
12- Structure of the tetrahedral sheet showing (A) tetrahedral arrangement of Si and O (B) projection of tetrahedron on plane of sheet and (C) top view of tetrahedral sheet (dotted line unit cell area) Large grey circles represent oxygen atoms and the small red circles represent silicon atoms 10
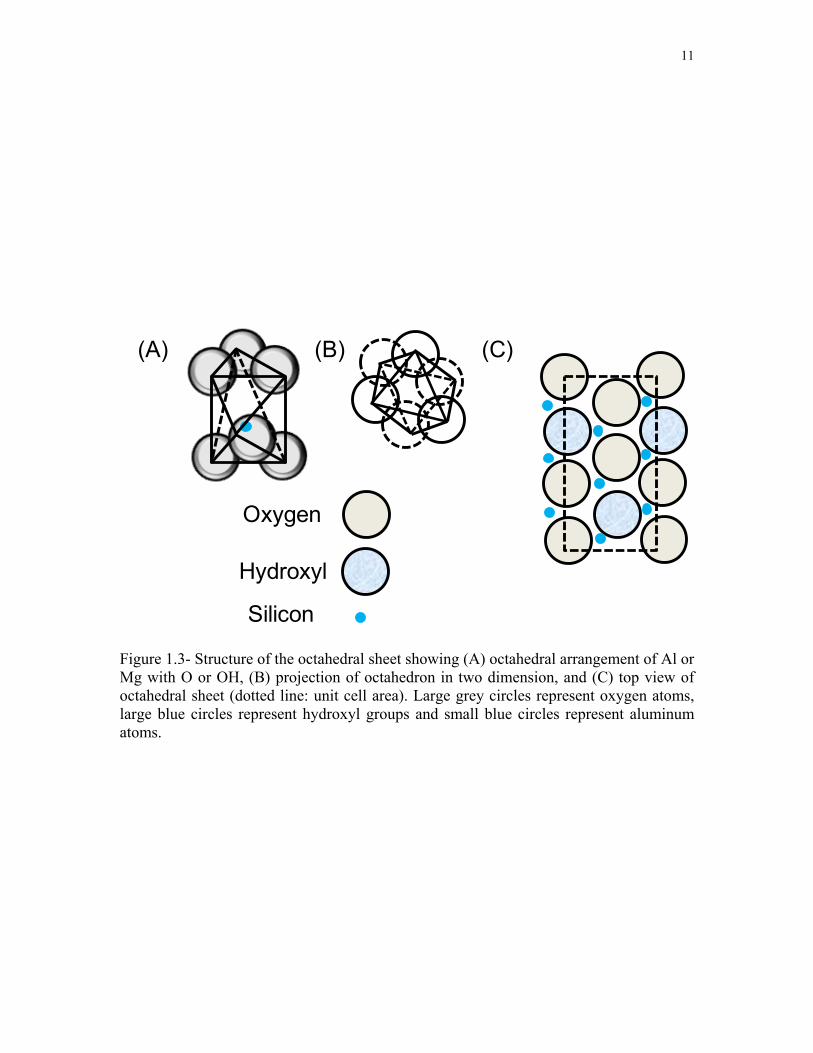
13- Structure of the octahedral sheet showing (A) octahedral arrangement of Al or Mg with O or OH (B) projection of octahedron in two dimension and (C) top view of octahedral sheet (dotted line unit cell area) Large grey circles represent oxygen atoms large blue circles represent hydroxyl groups and small blue circles represent aluminum atoms 11
14- The structure of kaolinite clays 15
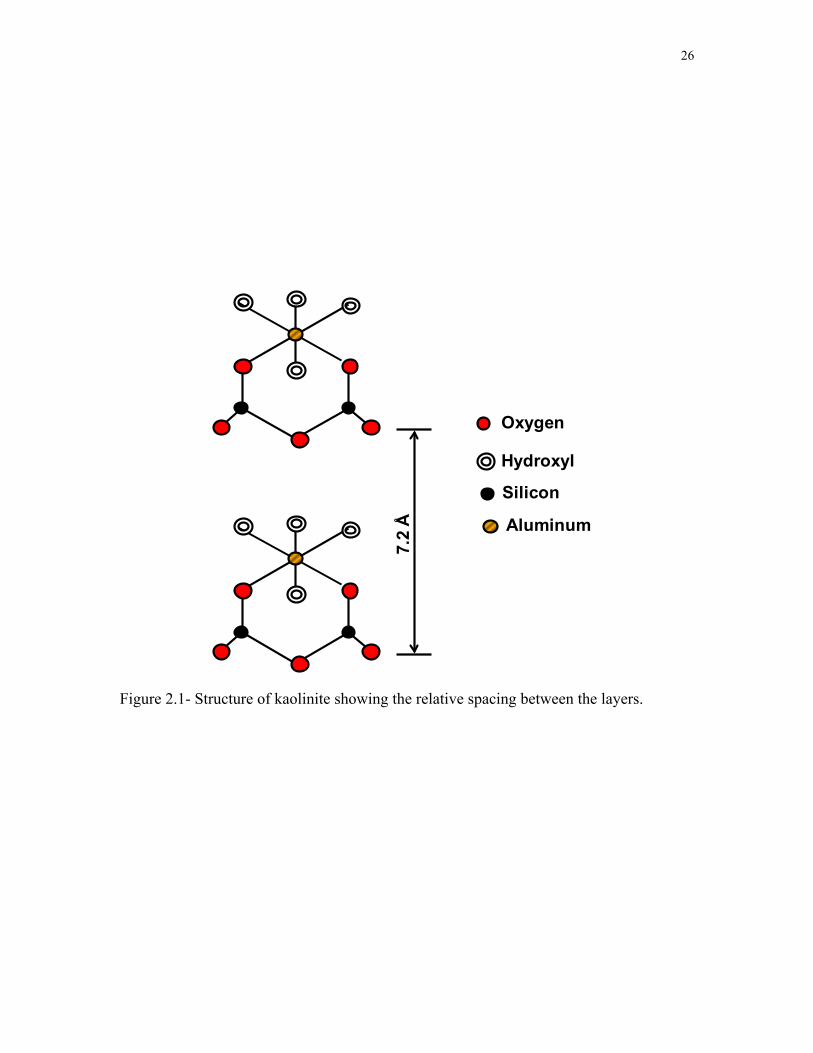
21- Structure of kaolinite showing the relative spacing between the layers 26
22- Schematic representation of AFM A mineral sample is positioned on a piezoelectric scanner which moves the sample in three-dimensions relative to the sensor (cantilever) The cantilever deflects due to attractive or repulsive forces between the tip and the sample Deflection of cantilever is monitored by a laser reflecting off the top and into a photodiode array 36
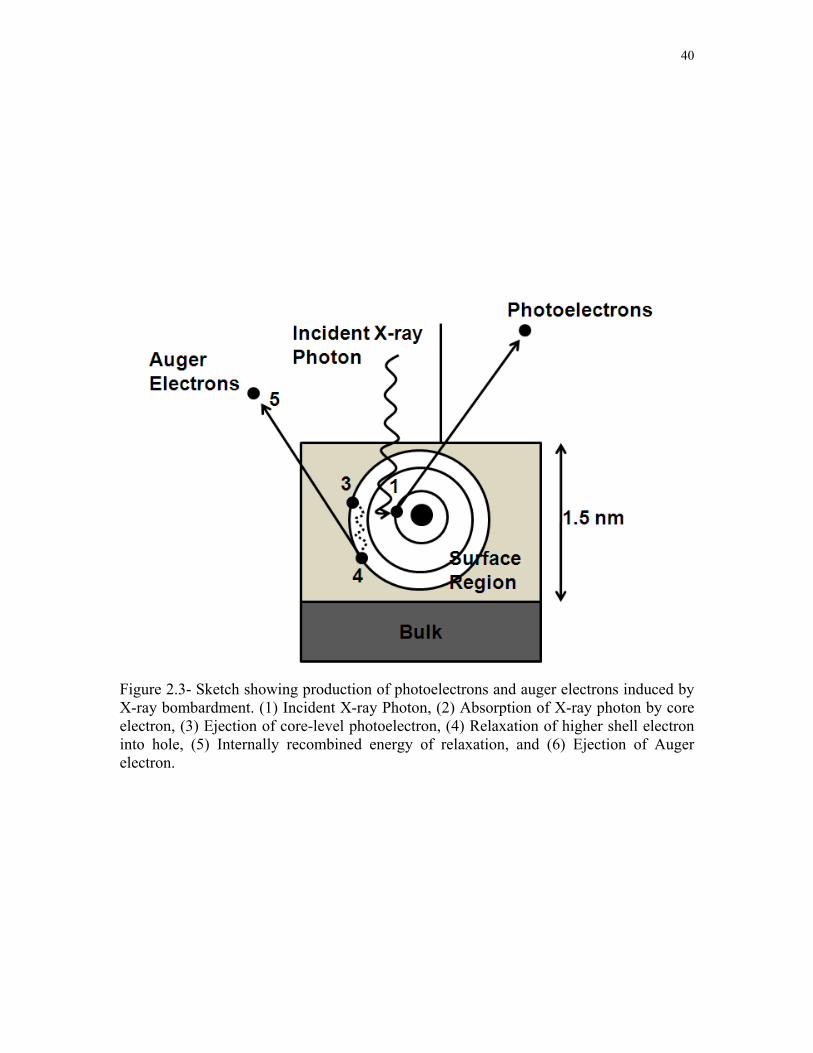
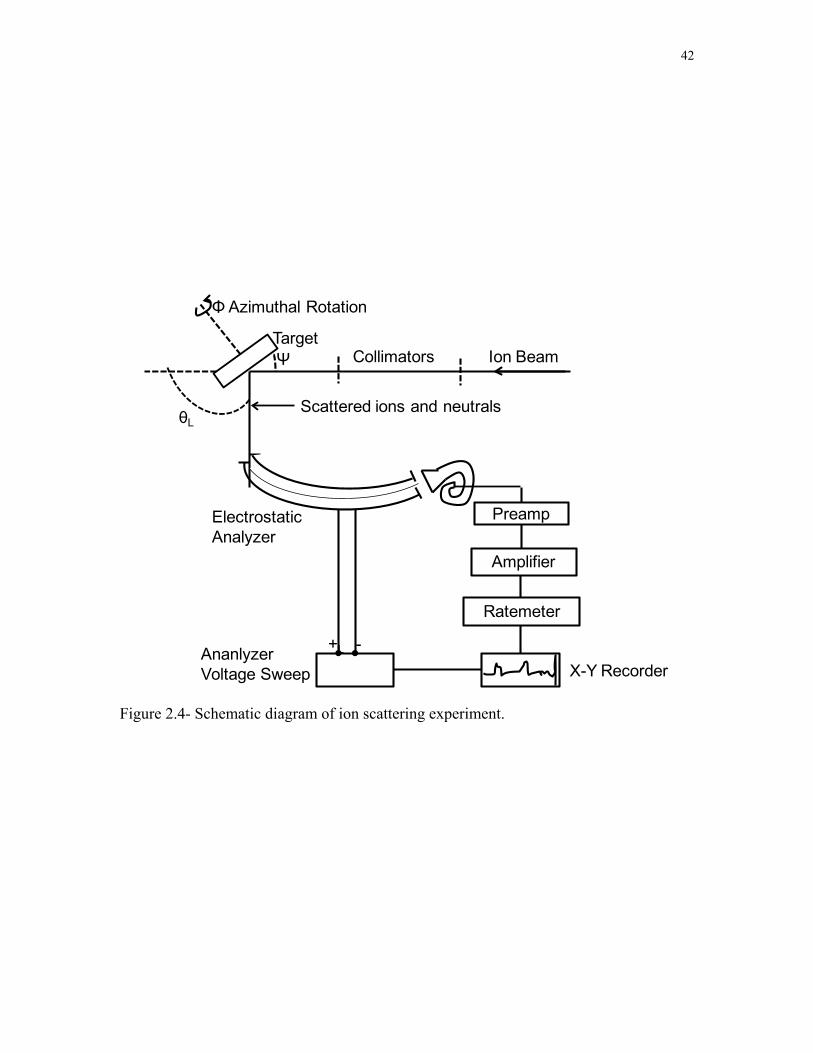
23- Sketch showing production of photoelectrons and auger electrons induced by X-ray bombardment (1) Incident X-ray Photon (2) Absorption of X-ray photon by core electron (3) Ejection of core-level photoelectron (4) Relaxation of higher shell electron into hole (5) Internally recombined energy of relaxation and (6) Ejection of Auger electron 40
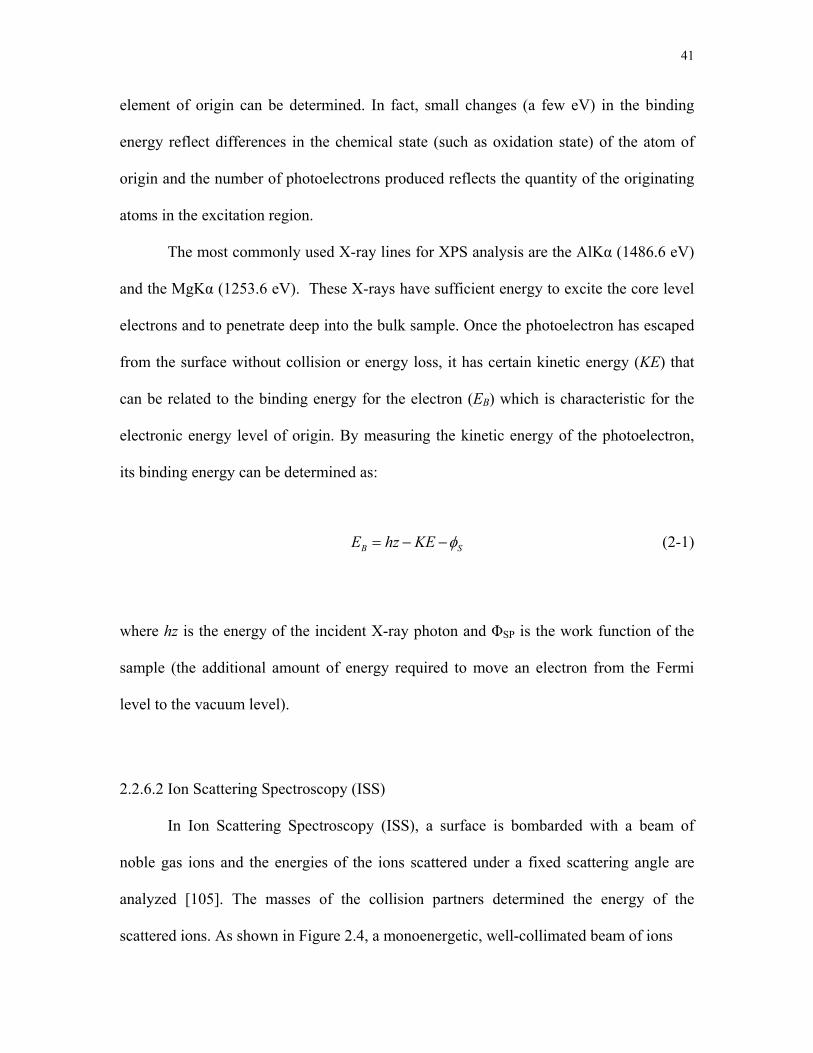
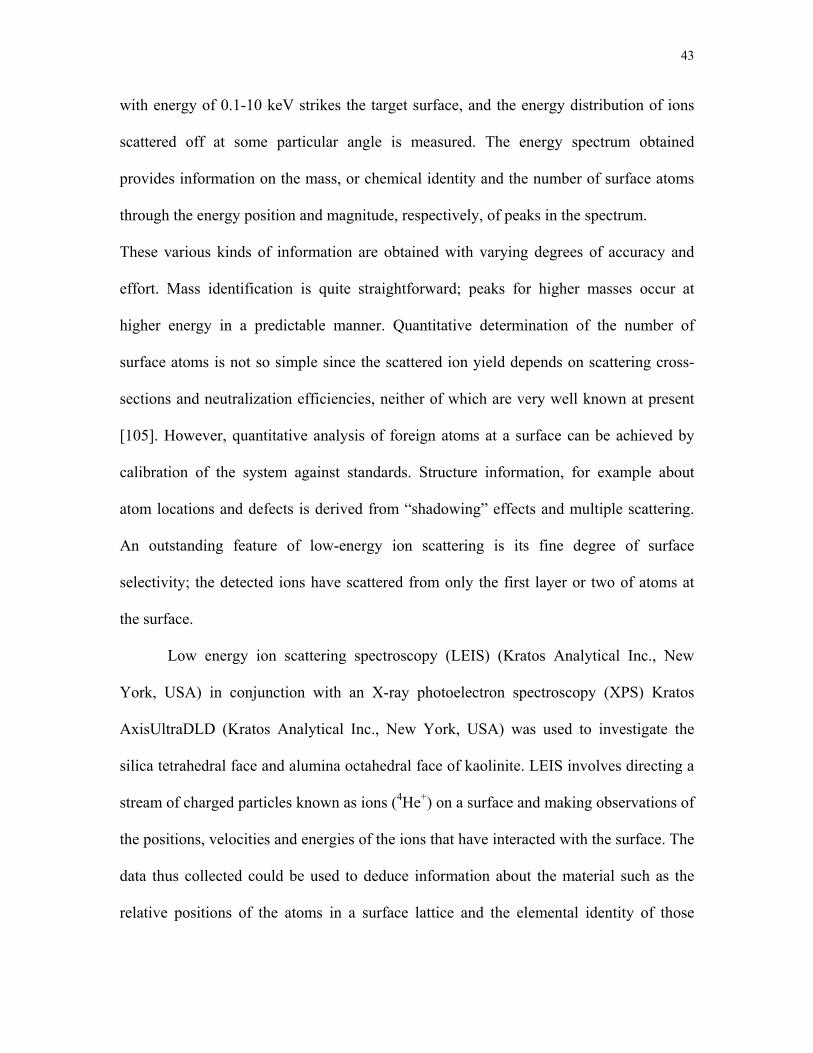
24- Schematic diagram of ion scattering experiment 42
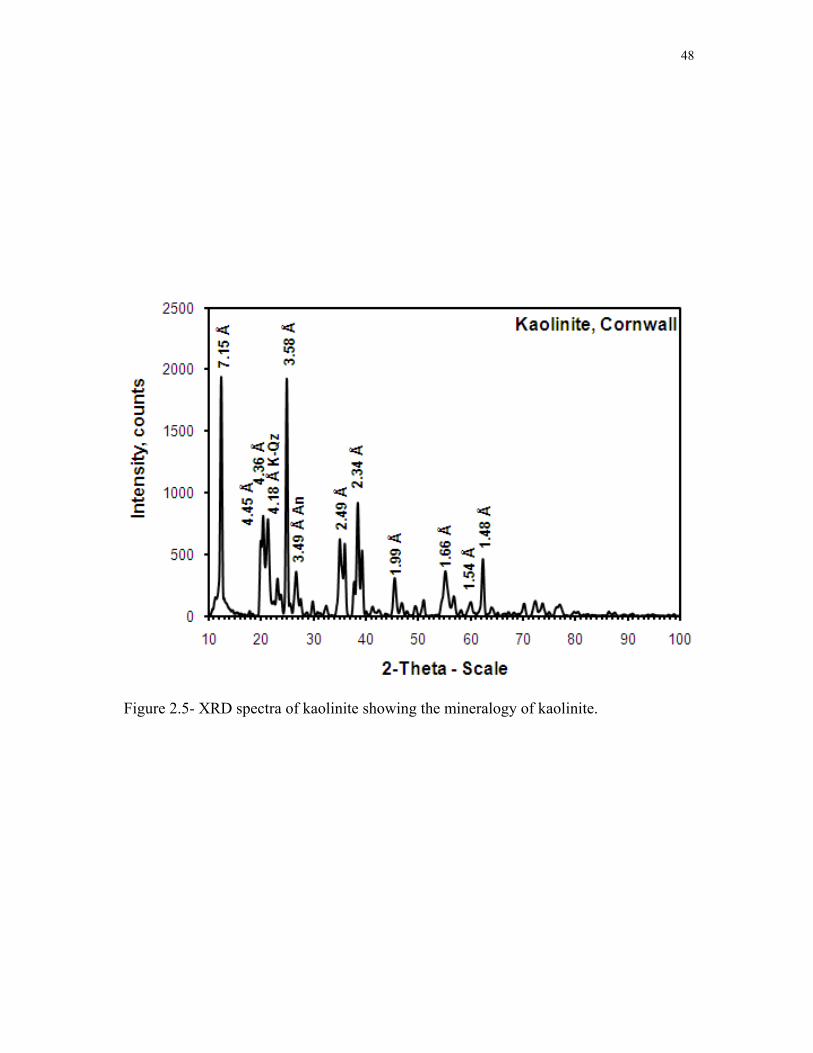
25- XRD spectra of kaolinite showing the mineralogy of kaolinite 48
xi
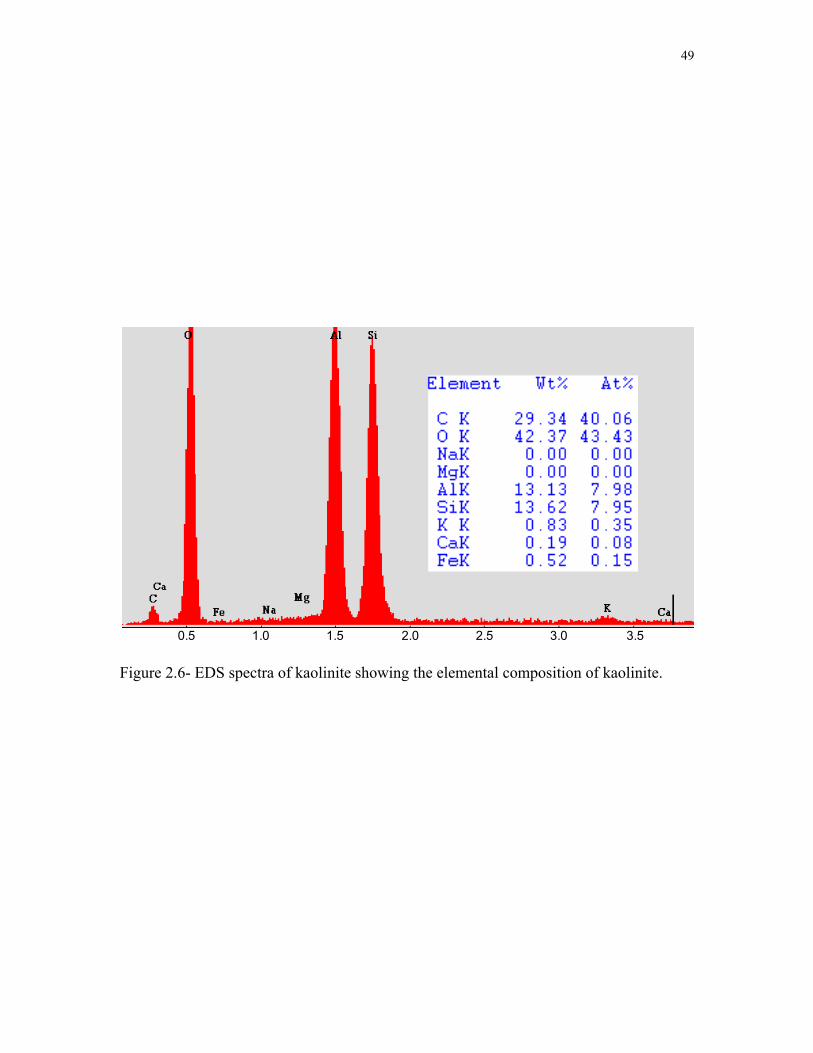
26- EDS spectra of kaolinite showing the elemental composition of kaolinite 49
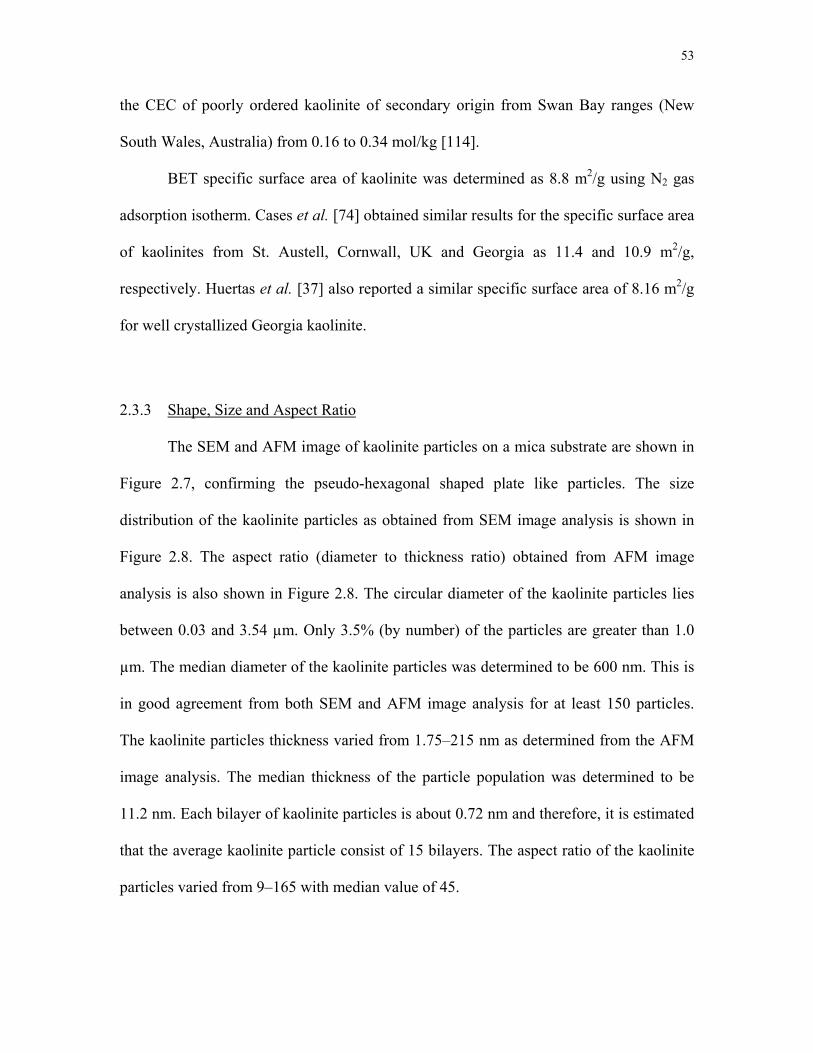
27- (A) SEM (B) AFM images of kaolinite particles showing the pseudo-hexagonal shaped plate like particles 54
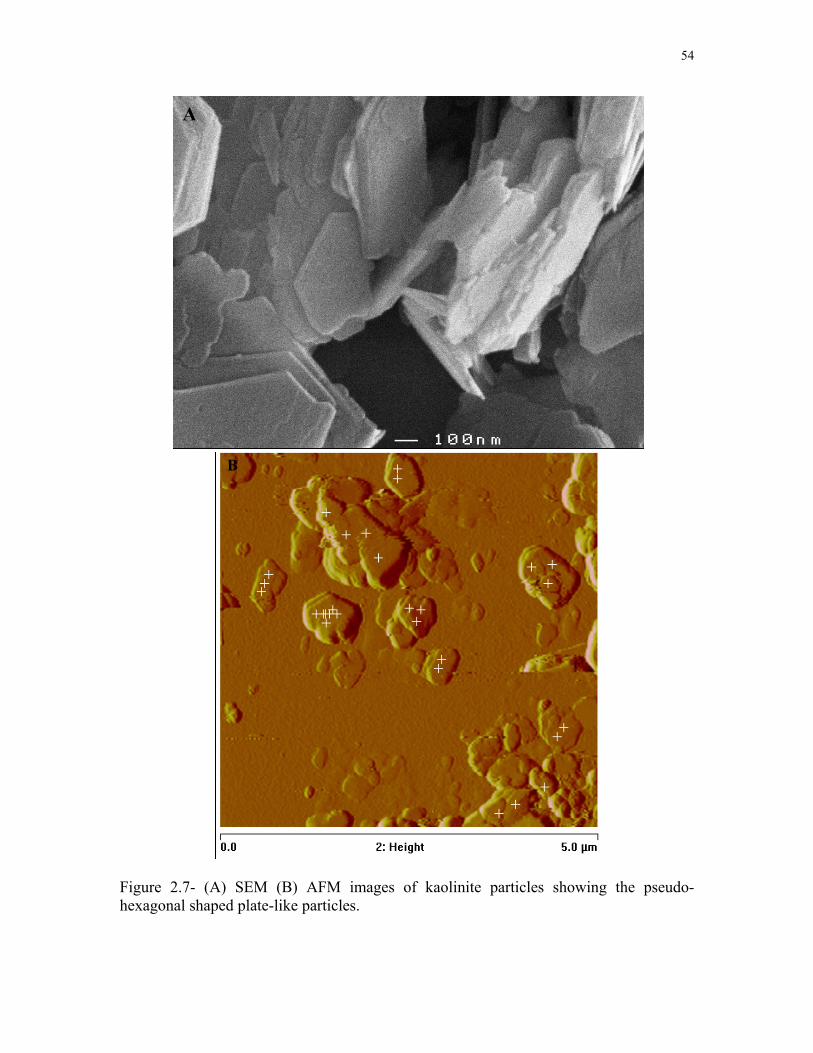
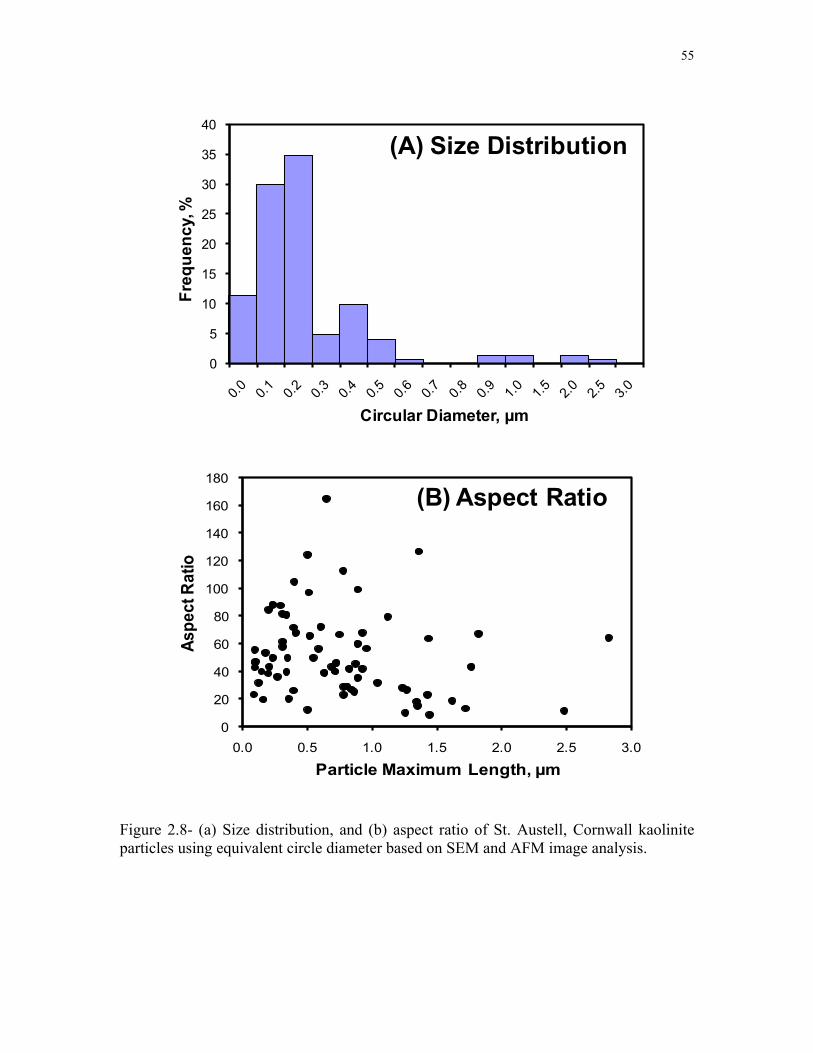
28- (a) Size distribution and (b) aspect ratio of St Austell Cornwall kaolinite particles using equivalent circle diameter based on SEM and AFM image analysis 55
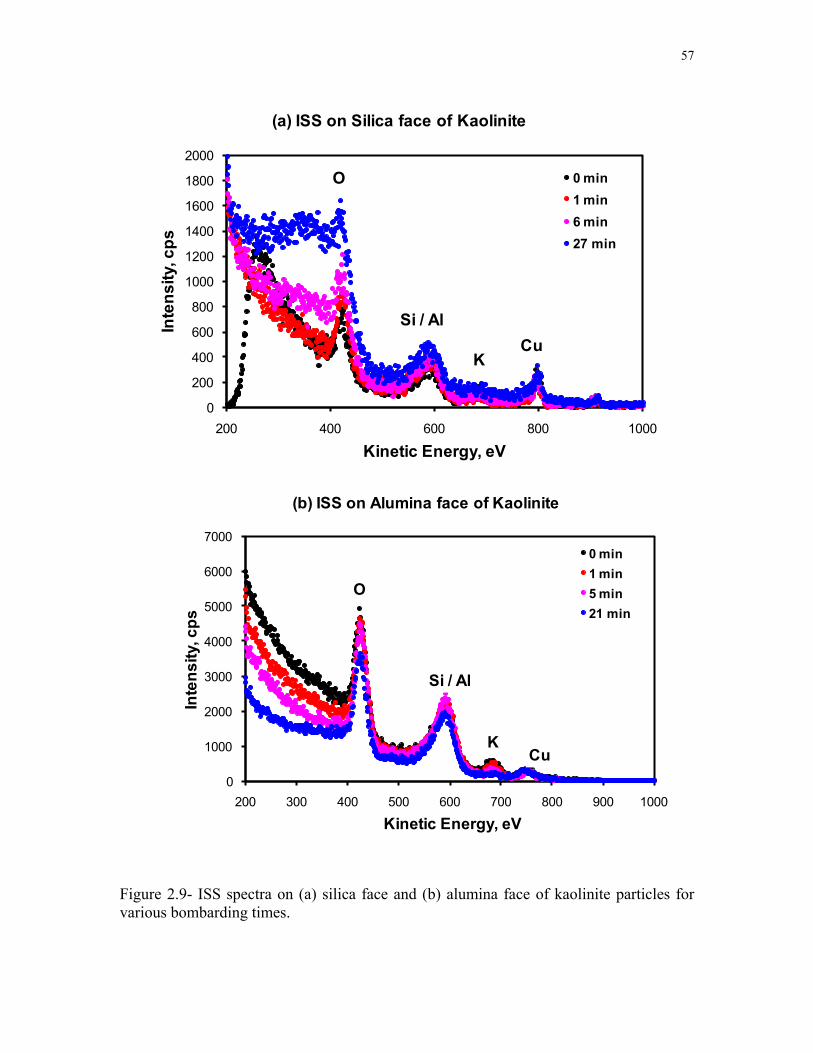
29- ISS spectra on (a) silica face and (b) alumina face of kaolinite particles for various bombarding times 57
210- Ratio of aluminum to silicon peak areas from both silica and alumina face of kaolinite as a function of bombarding time 58
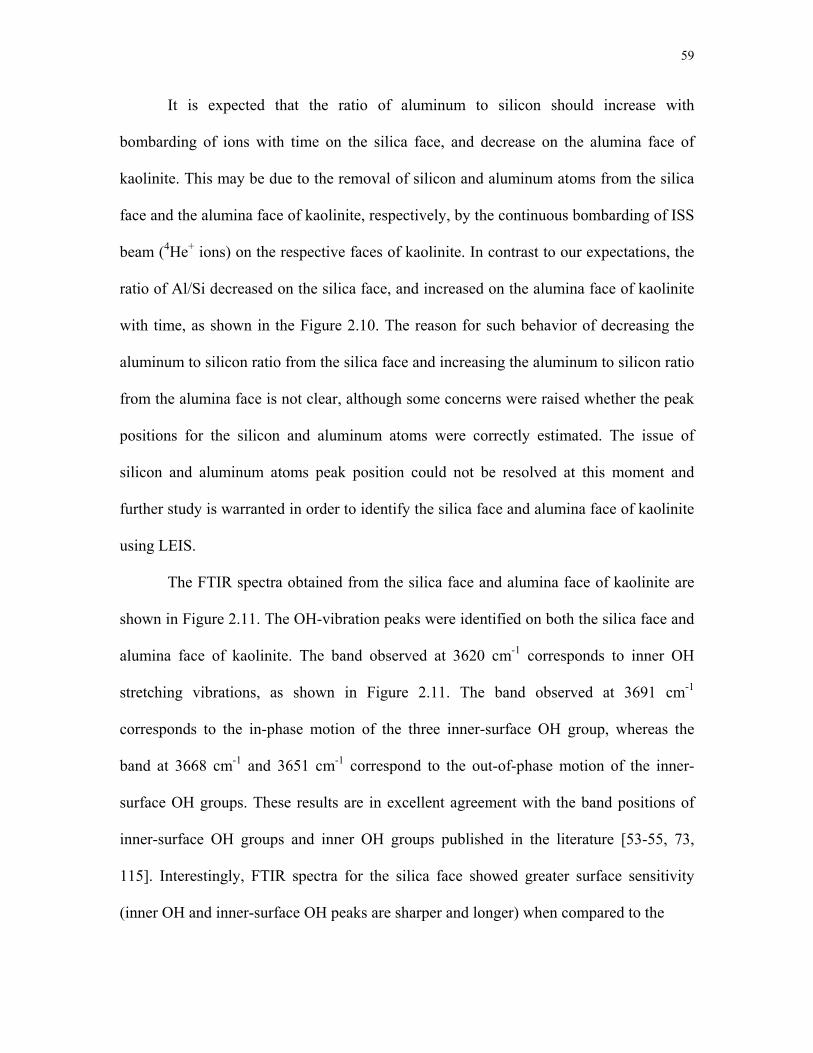
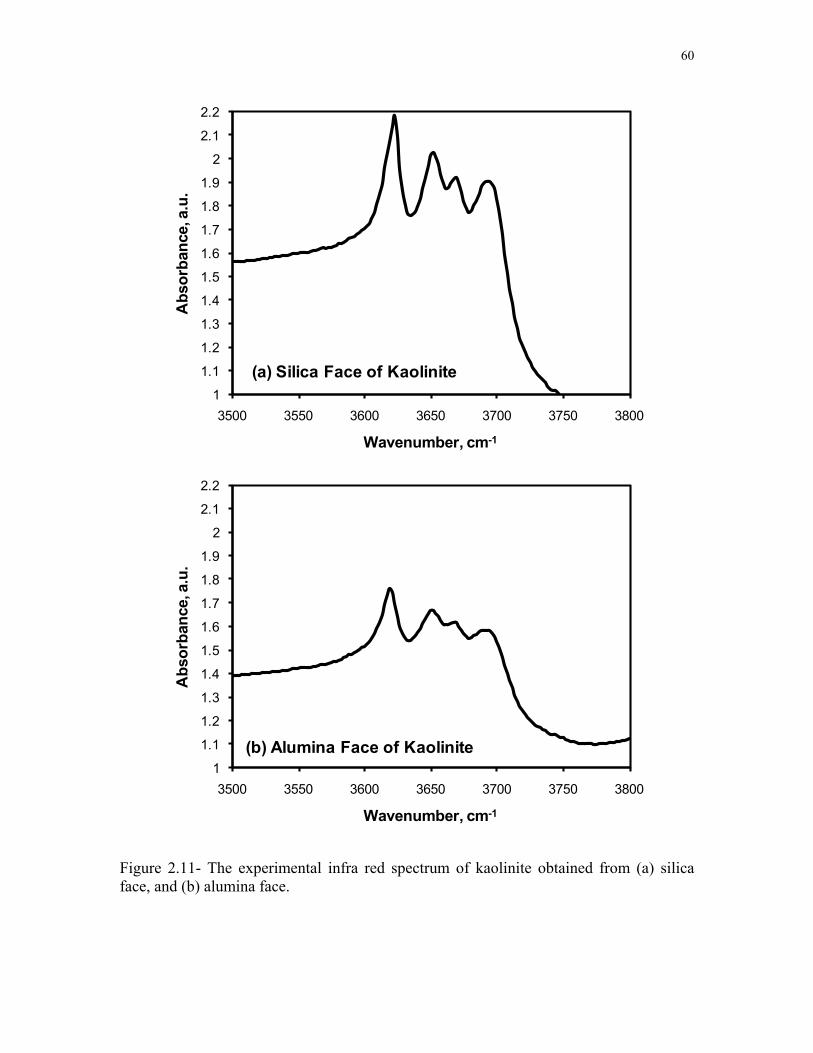
211- The experimental infra red spectrum of kaolinite obtained from (a) silica face and (b) alumina face 60
31- Schematic representation for the organization and ordering of kaolinite particles 67
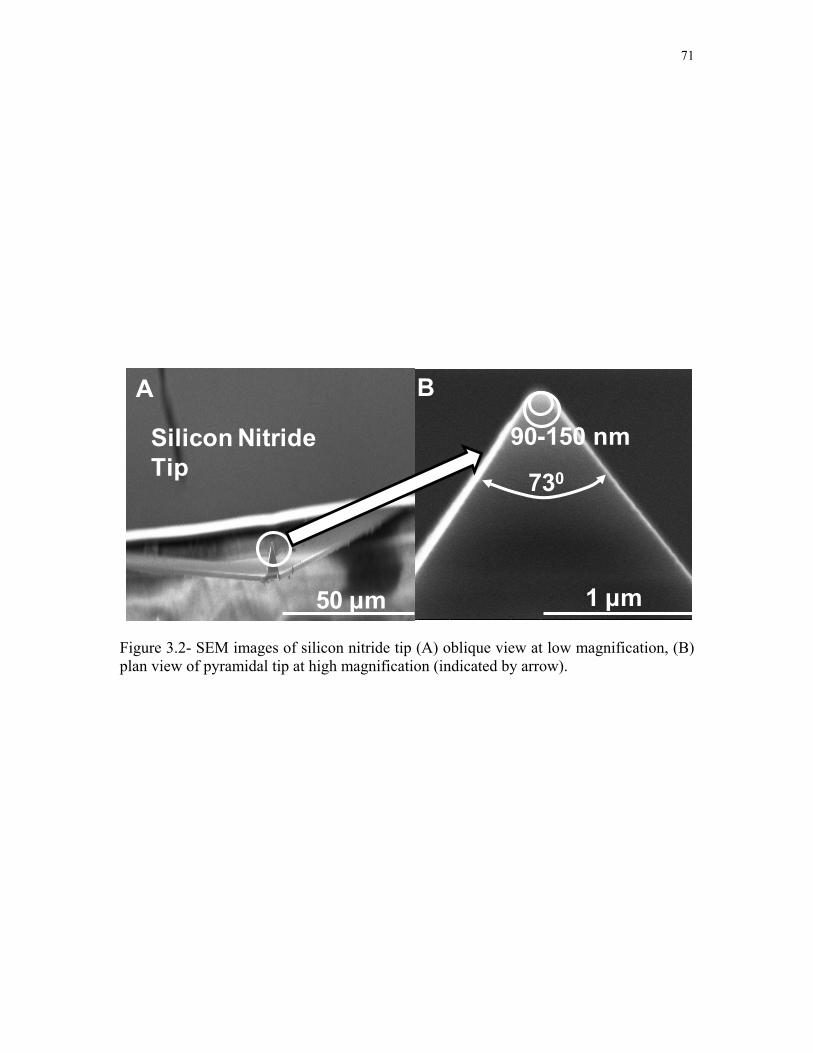
32- SEM images of silicon nitride tip (A) oblique view at low magnification (B) plan view of pyramidal tip at high magnification (indicated by arrow) 71
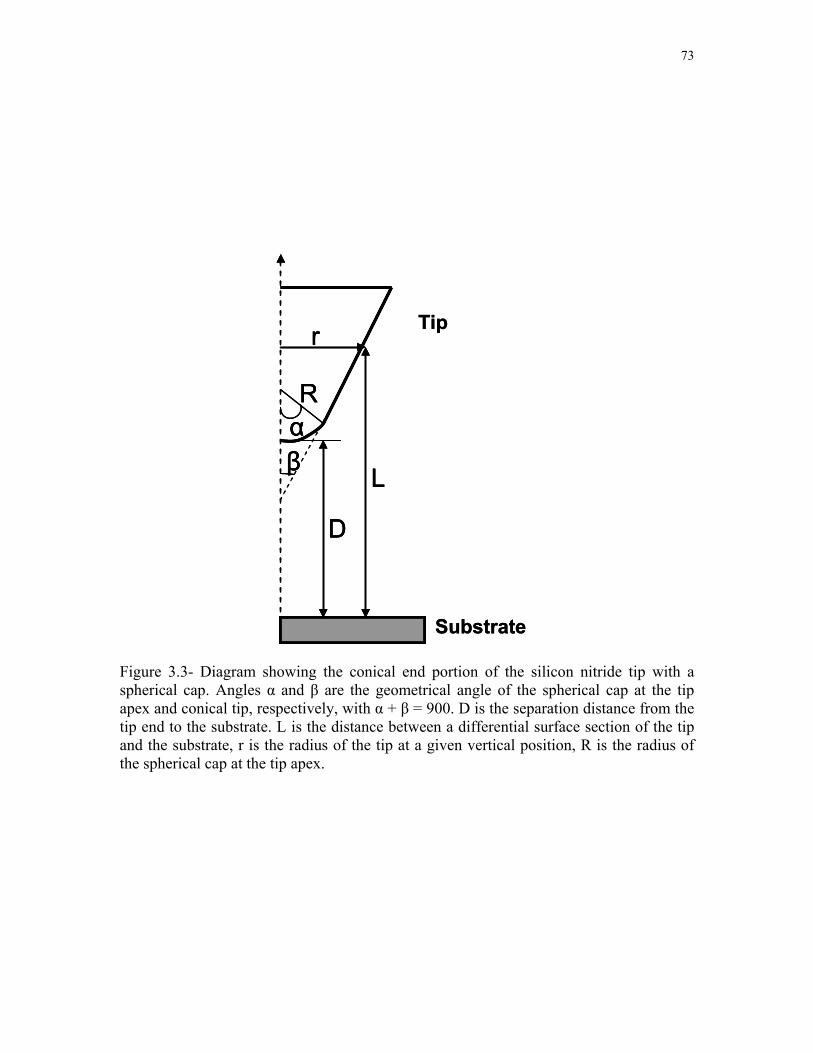
33- Diagram showing the conical end portion of the silicon nitride tip with a spherical cap Angles α and β are the geometrical angle of the spherical cap at the tip apex and conical tip respectively with α + β = 900 D is the separation distance from the tip end to the substrate L is the distance between a differential surface section of the tip and the substrate r is the radius of the tip at a given vertical position R is the radius of the spherical cap at the tip apex 73
34- Topographic height images of Glass-Substrate (A1 and B1 above) and Fused Alumina-Substrate (A2 and B2) as obtained by AFM using a silicon nitride tip in contact mode The white cross-bars on the A1 and A2 images show the location where force measurements between the silicon nitride tip and the substrate were performed 77
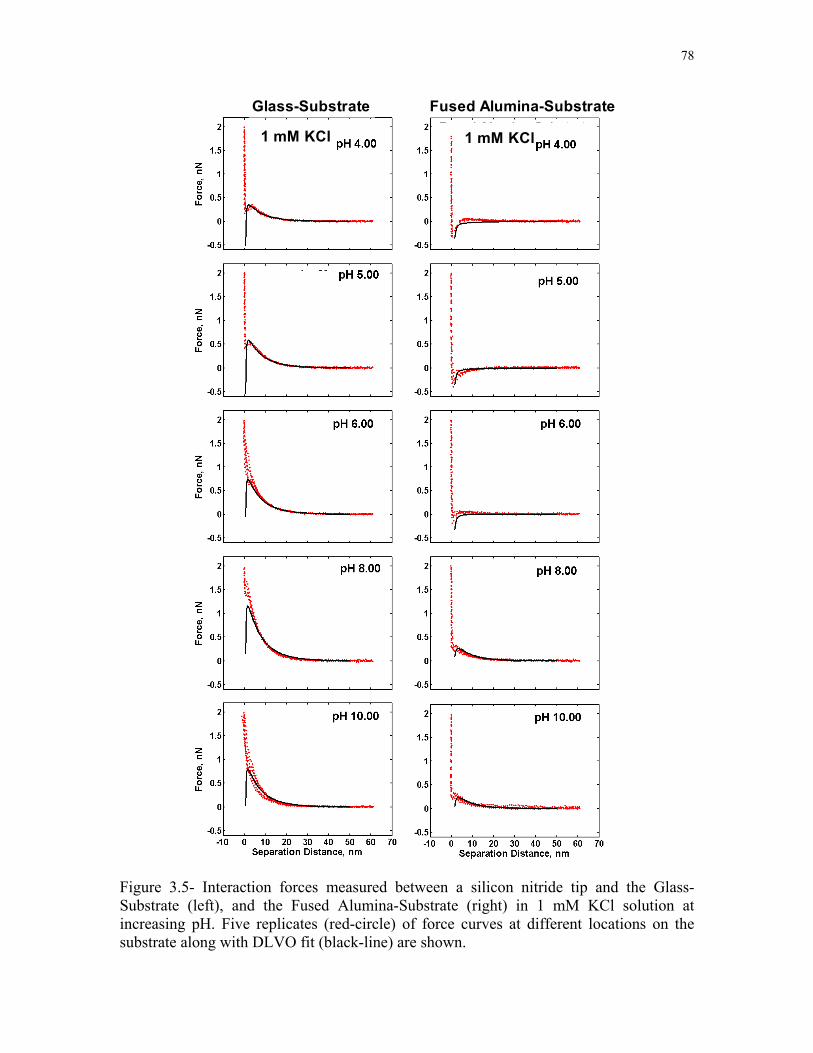
35- Interaction forces measured between a silicon nitride tip and the Glass-Substrate (left) and the Fused Alumina-Substrate (right) in 1 mM KCl solution at increasing pH Five replicates (red-circle) of force curves at different locations on the substrate along with DLVO fit (black-line) are shown 78
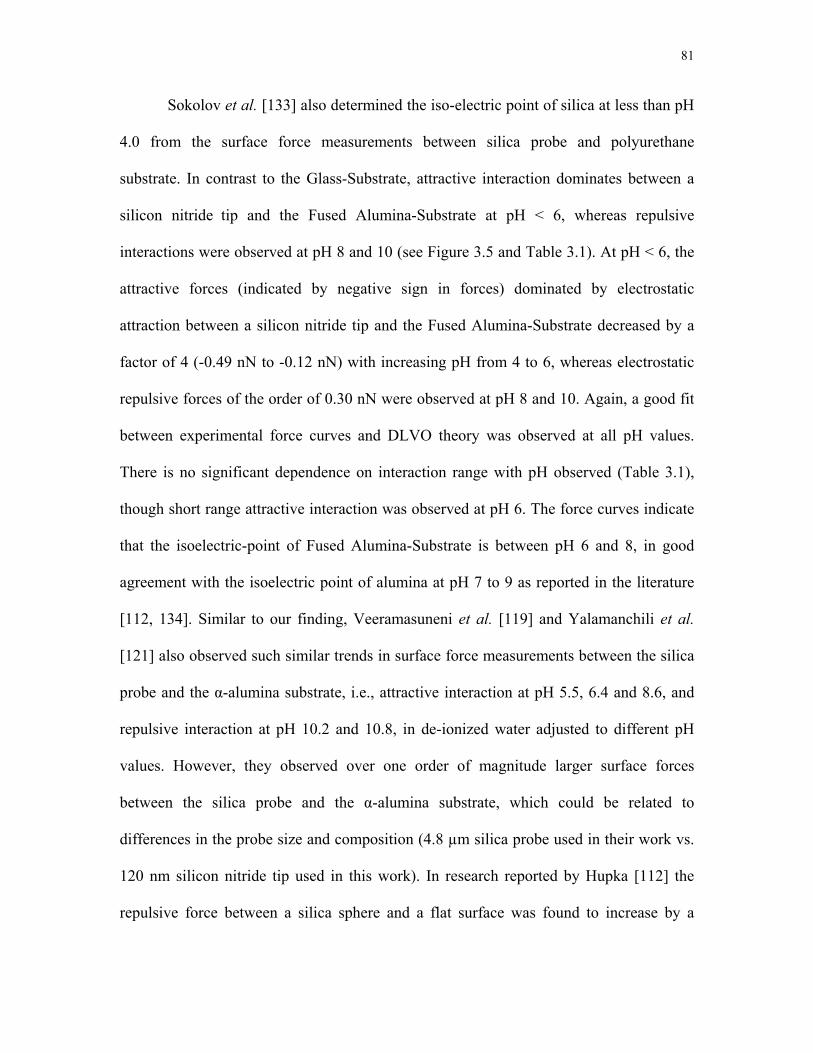
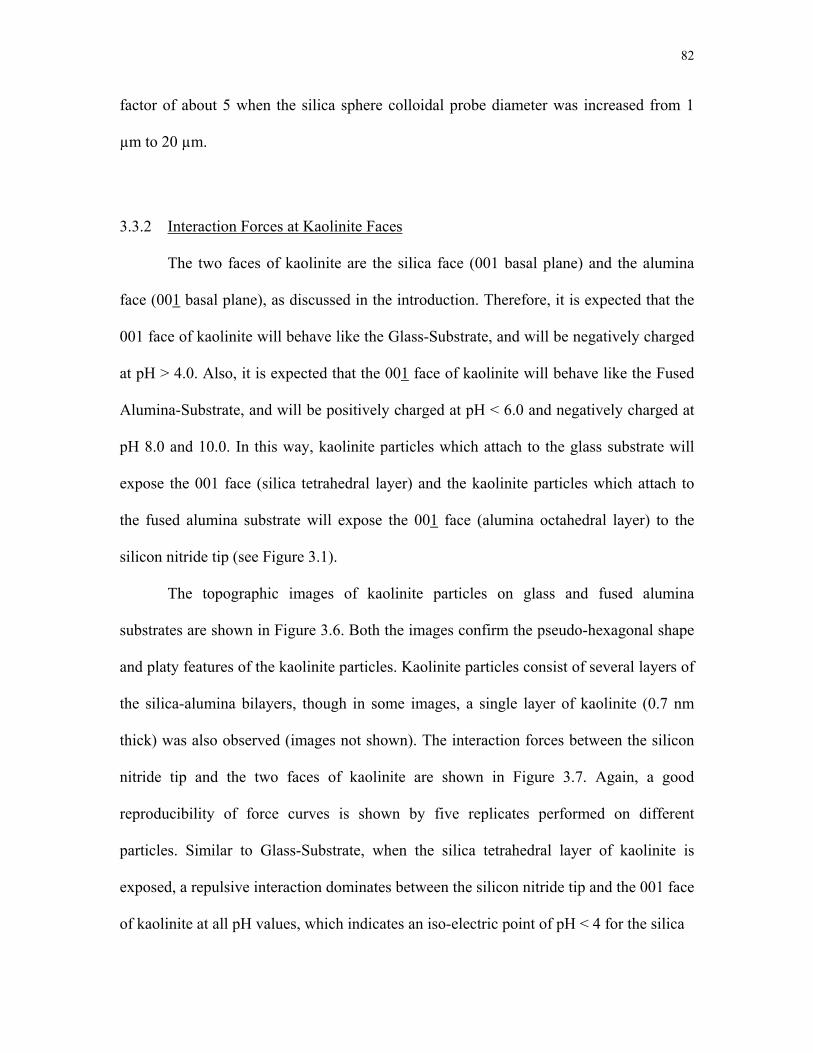
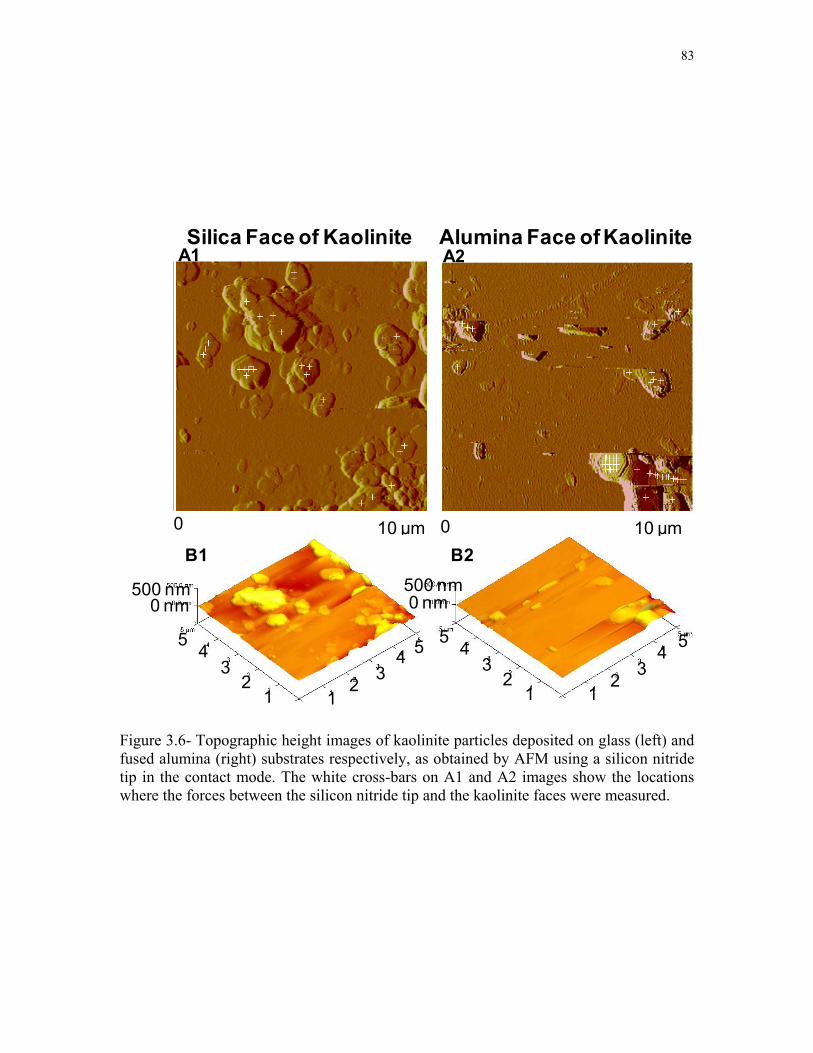
36- Topographic height images of kaolinite particles deposited on glass (left) and fused alumina (right) substrates respectively as obtained by AFM using a silicon nitride tip in the contact mode The white cross-bars on A1 and A2 images show the locations where the forces between the silicon nitride tip and the kaolinite faces were measured 83
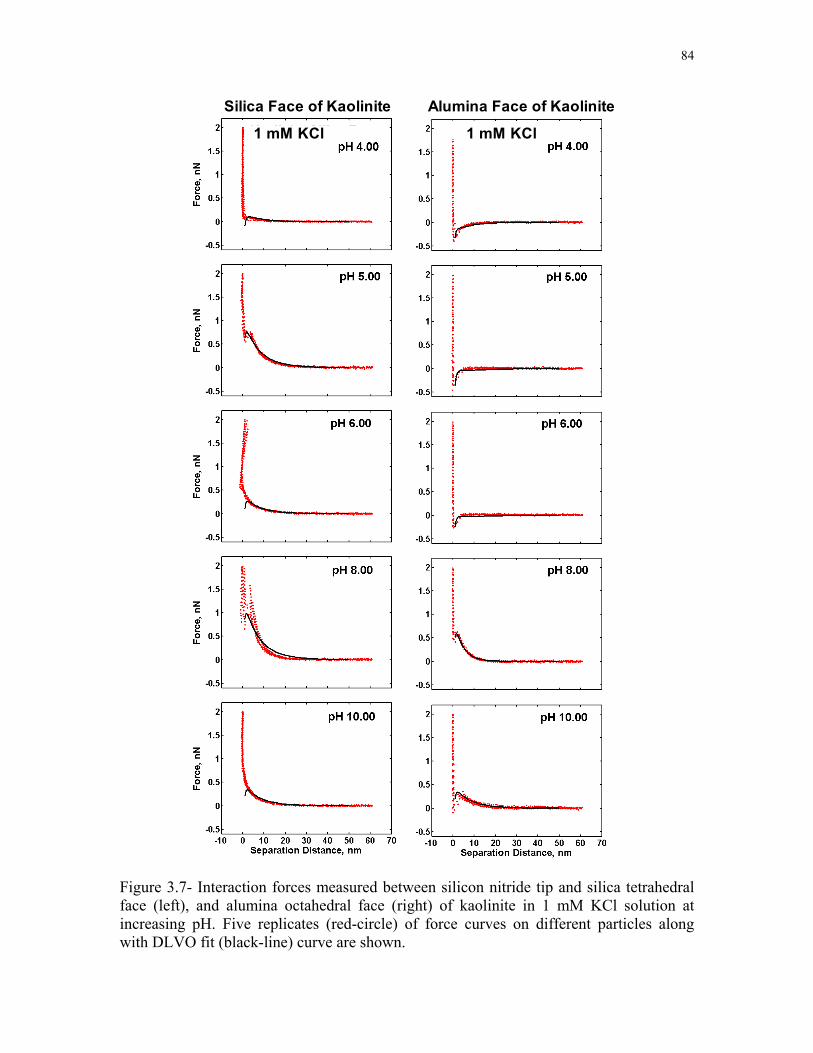
37- Interaction forces measured between silicon nitride tip and silica tetrahedral face (left) and alumina octahedral face (right) of kaolinite in 1 mM KCl solution at
xii
increasing pH Five replicates (red-circle) of force curves on different particles along with DLVO fit (black-line) curve are shown 84
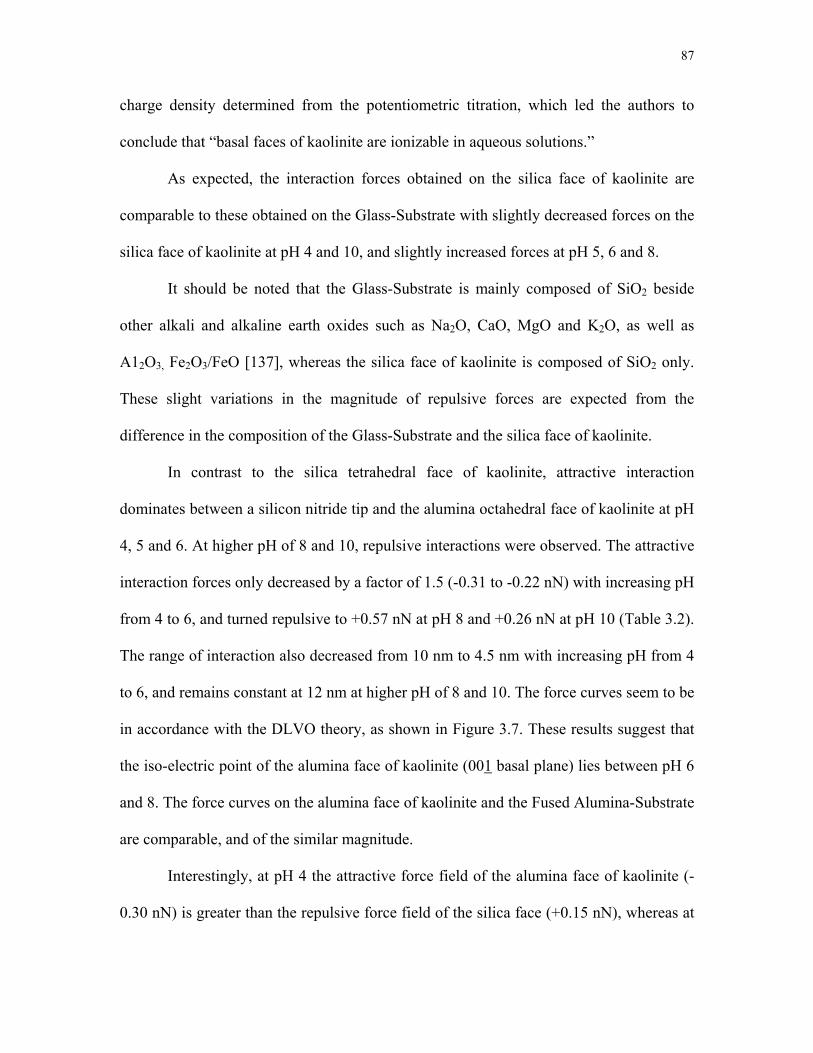
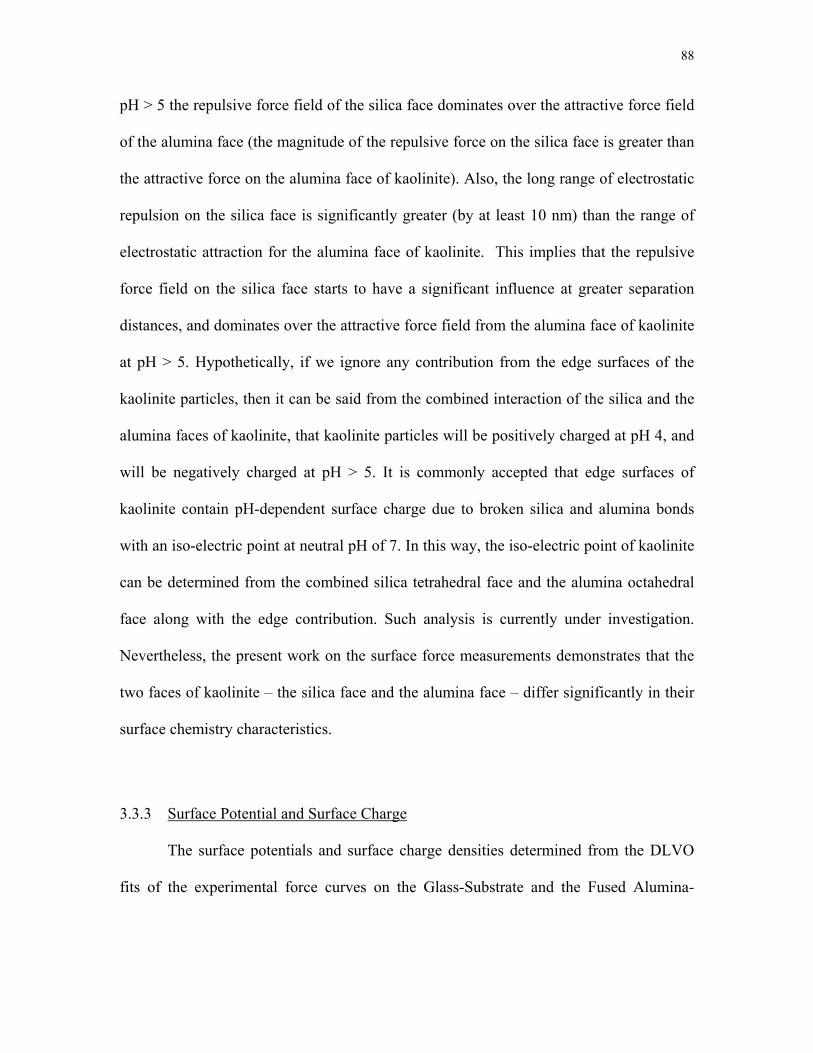
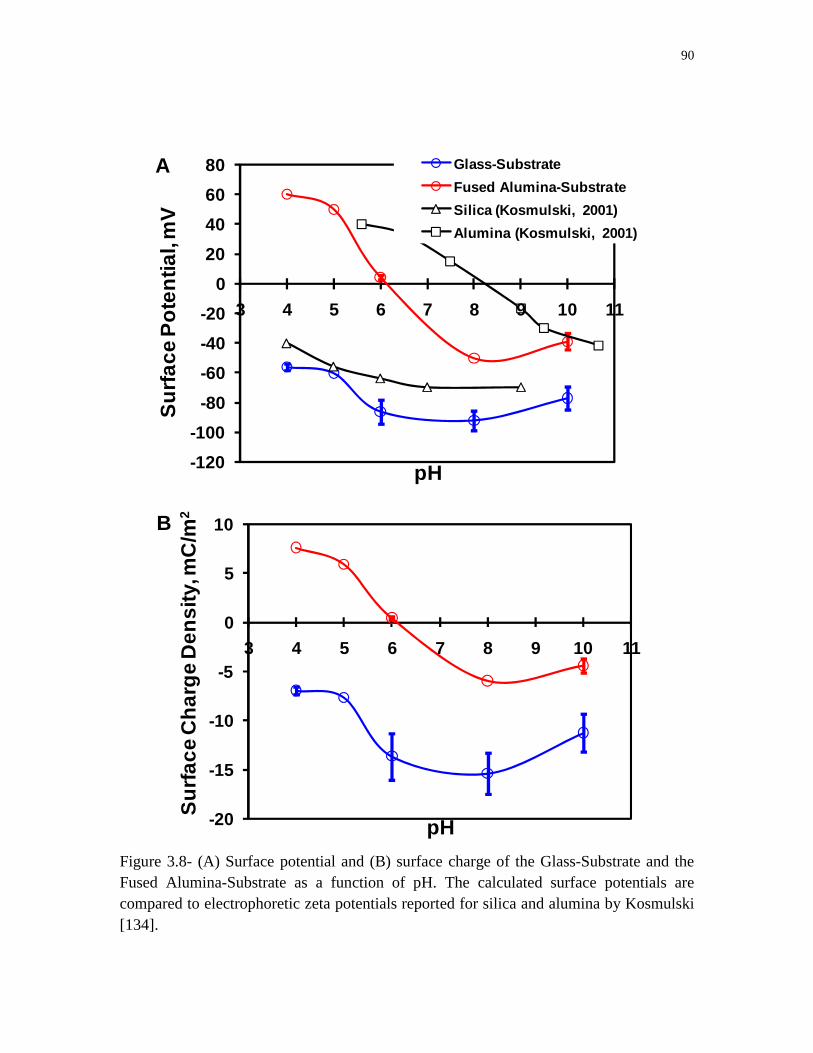
38- (A) Surface potential and (B) surface charge of the Glass-Substrate and the Fused Alumina-Substrate as a function of pH The calculated surface potentials are compared to electrophoretic zeta potentials reported for silica and alumina by Kosmulski [134] 90
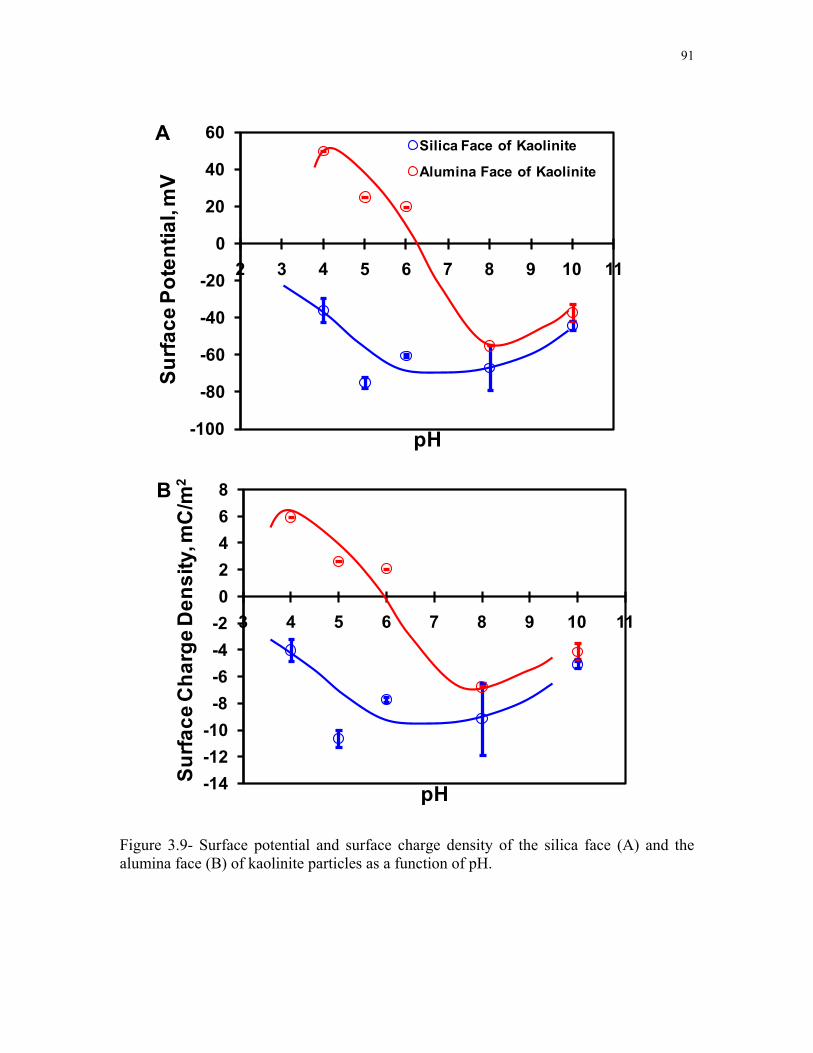
39- Surface potential and surface charge density of the silica face (A) and the alumina face (B) of kaolinite particles as a function of pH 91
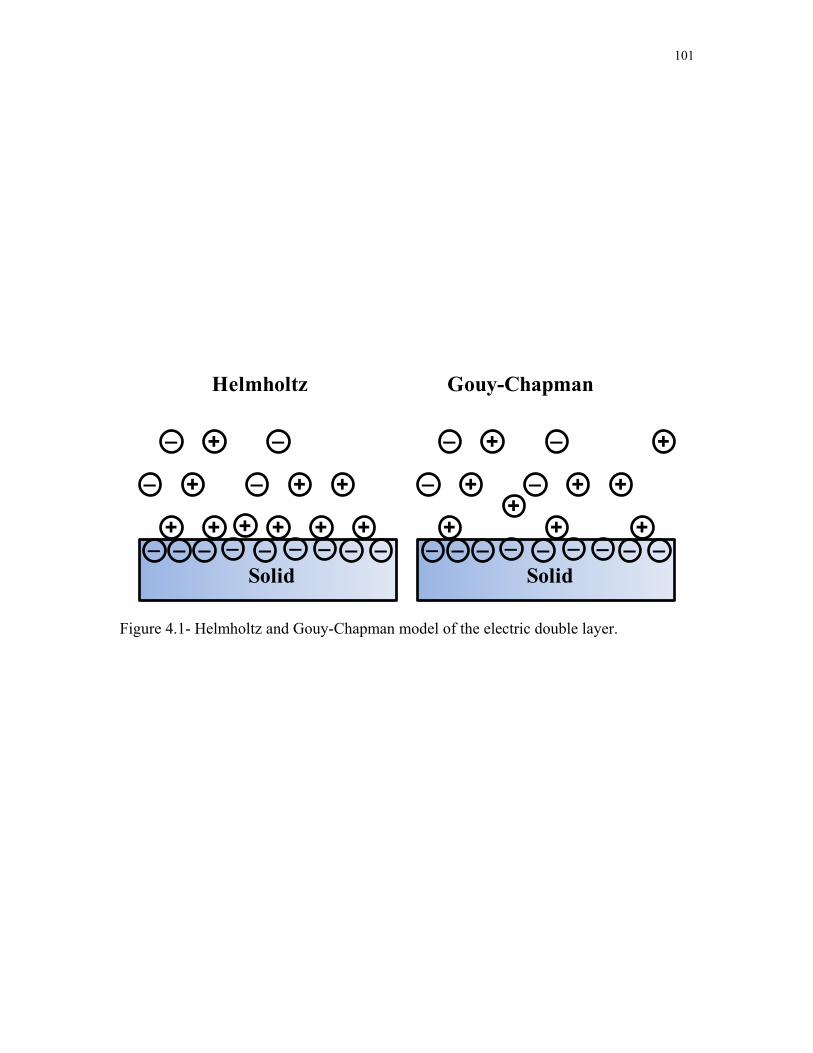
41- Helmholtz and Gouy-Chapman model of the electric double layer 101
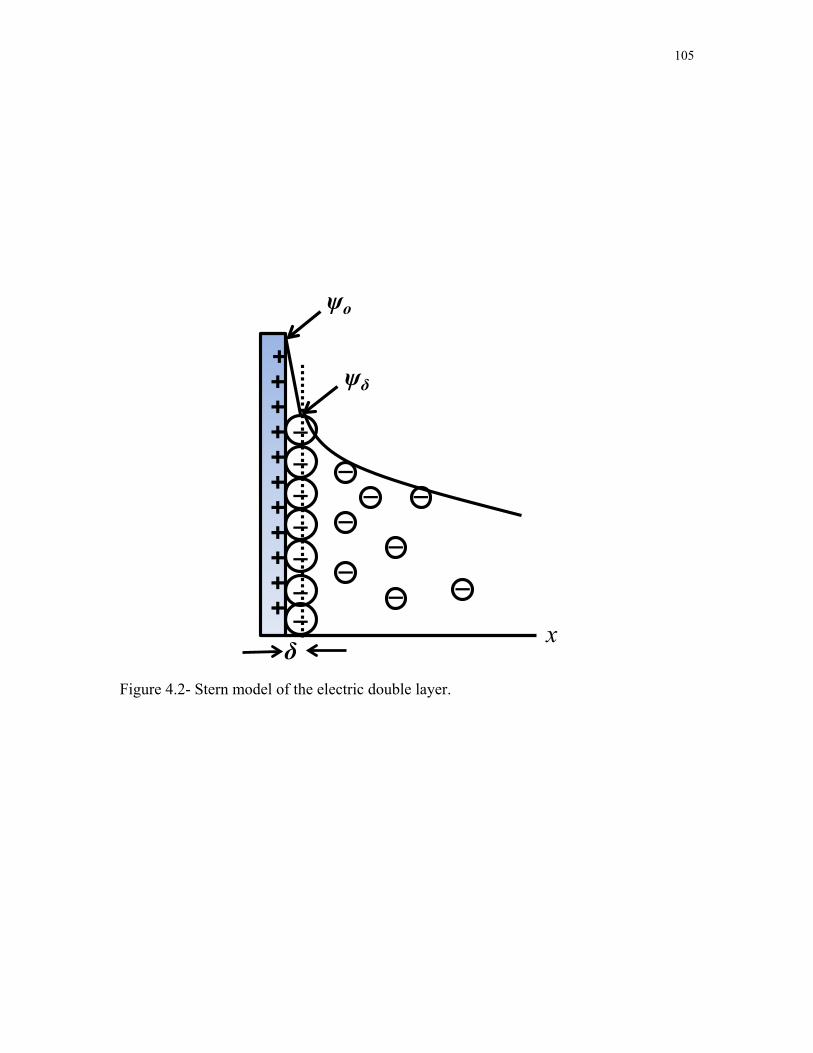
42- Stern model of the electric double layer 105
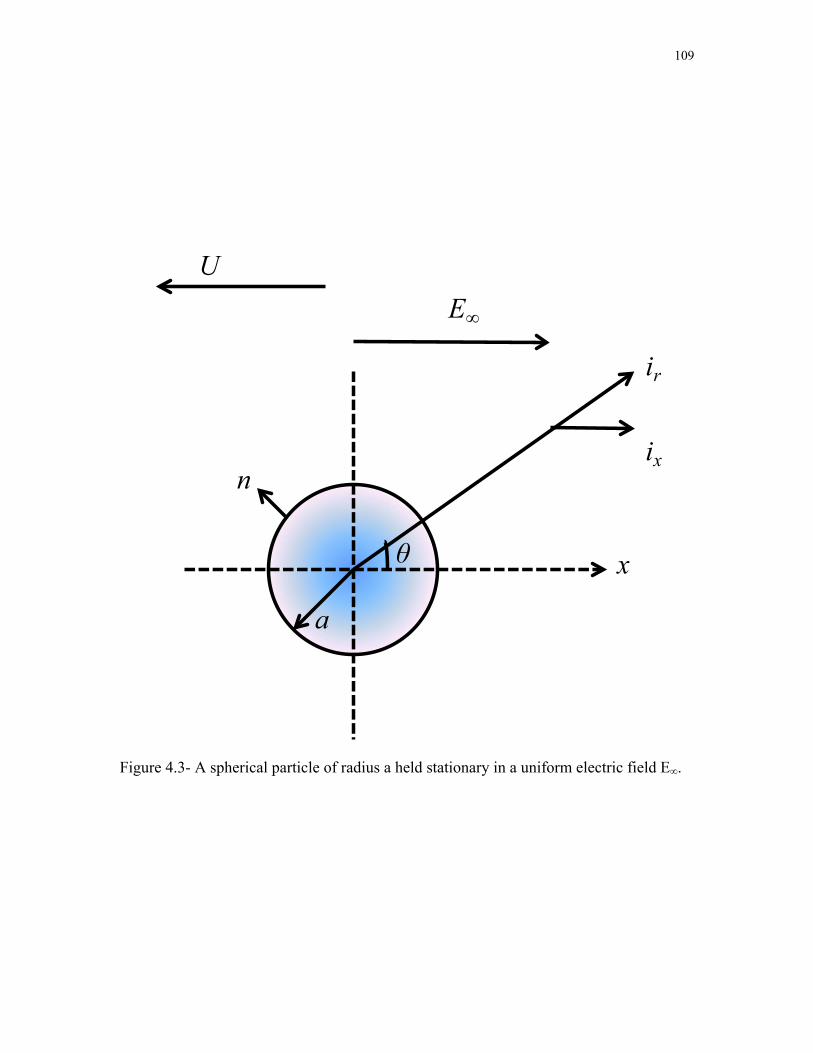
43- A spherical particle of radius a held stationary in a uniform electric field Einfin 109
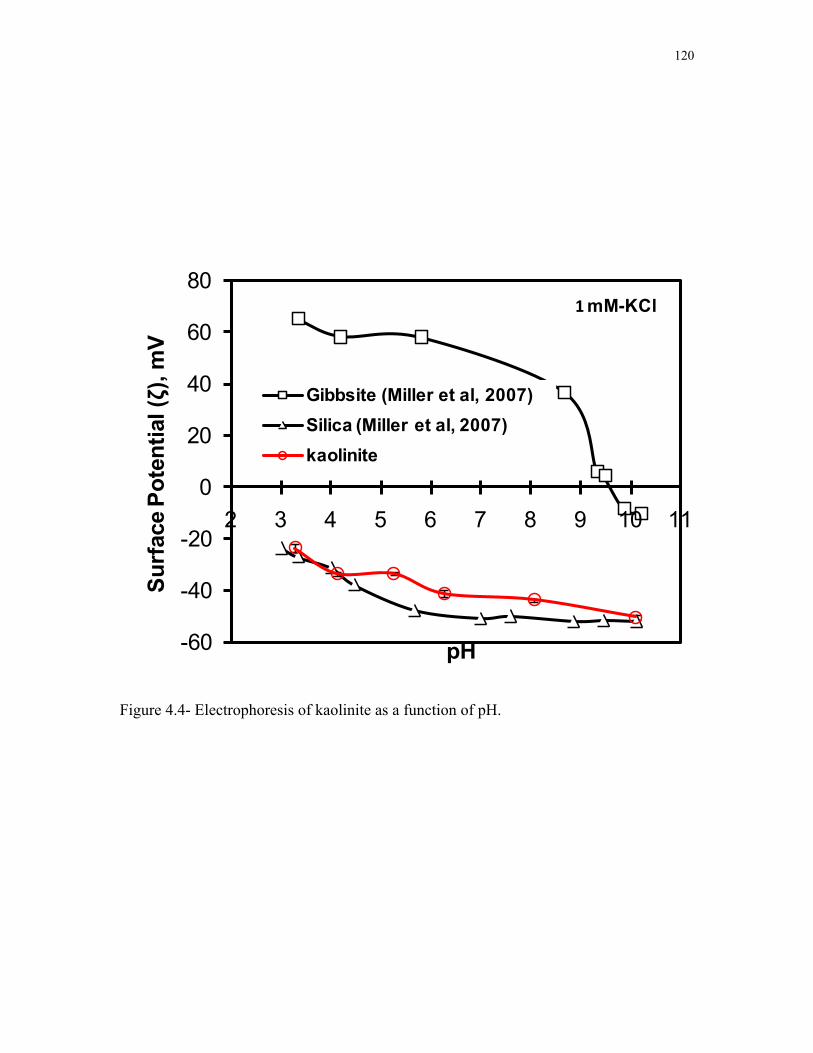
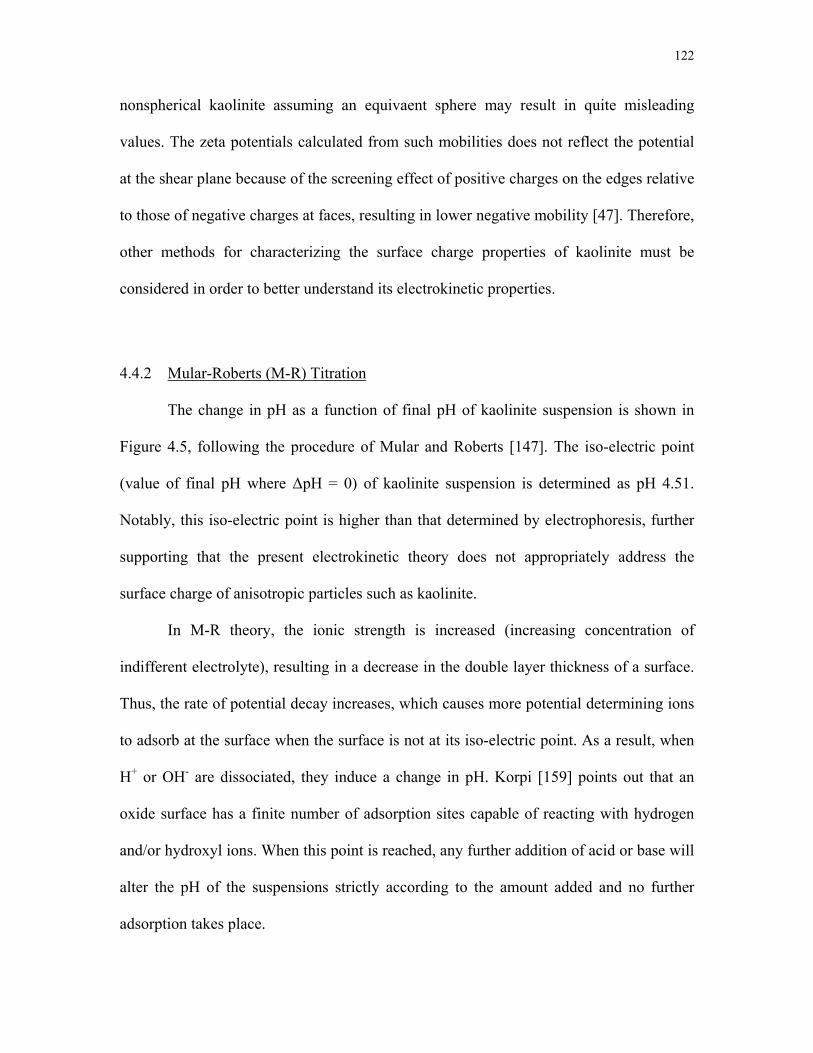
44- Electrophoresis of kaolinite as a function of pH 120
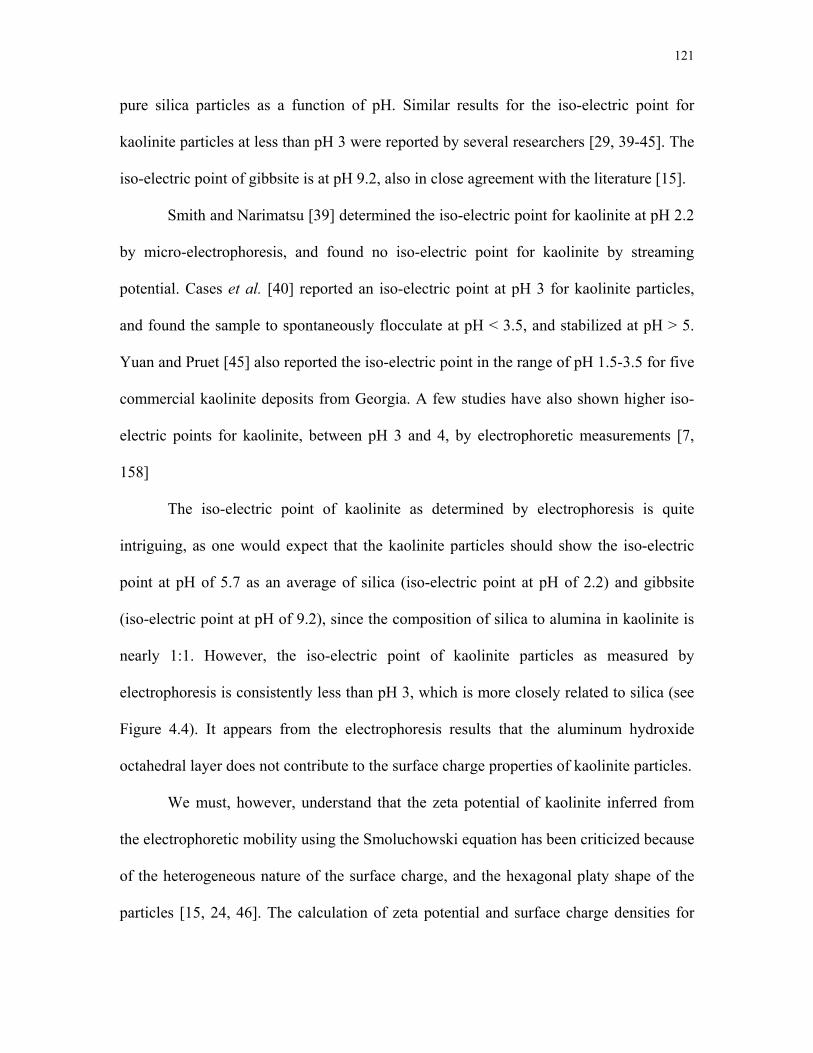
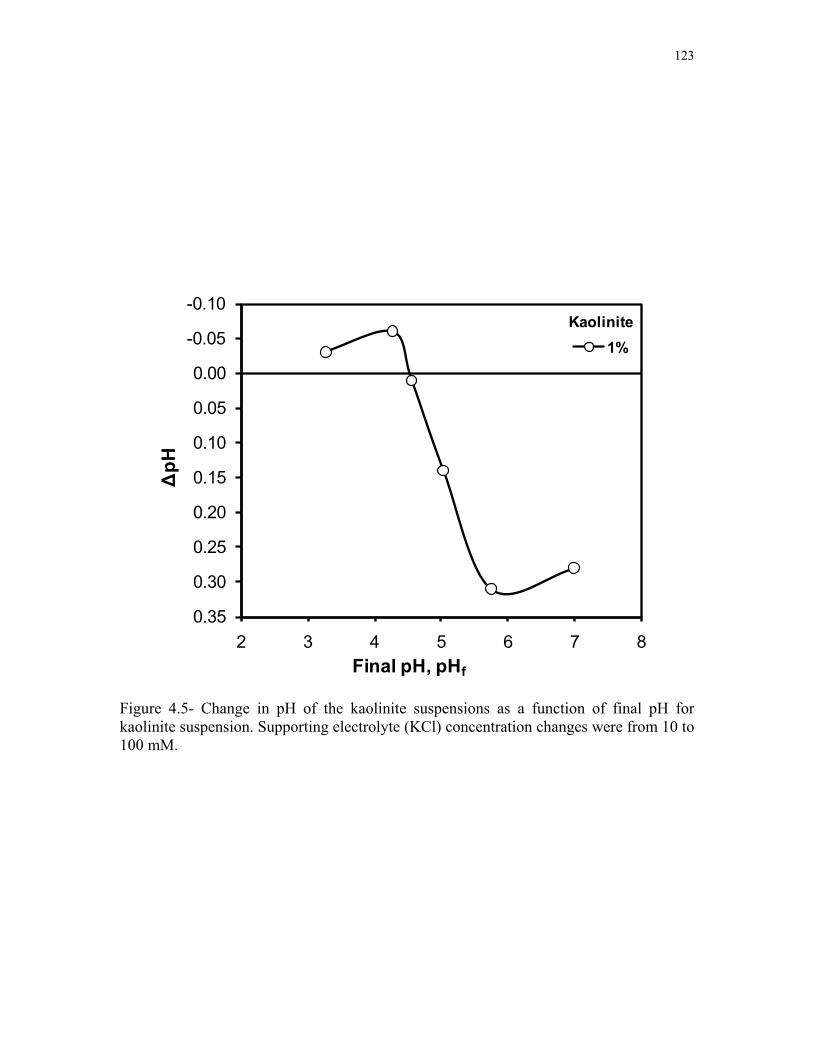
45- Change in pH of the kaolinite suspensions as a function of final pH for kaolinite suspension Supporting electrolyte (KCl) concentration changes were from 10 to 100 mM 123
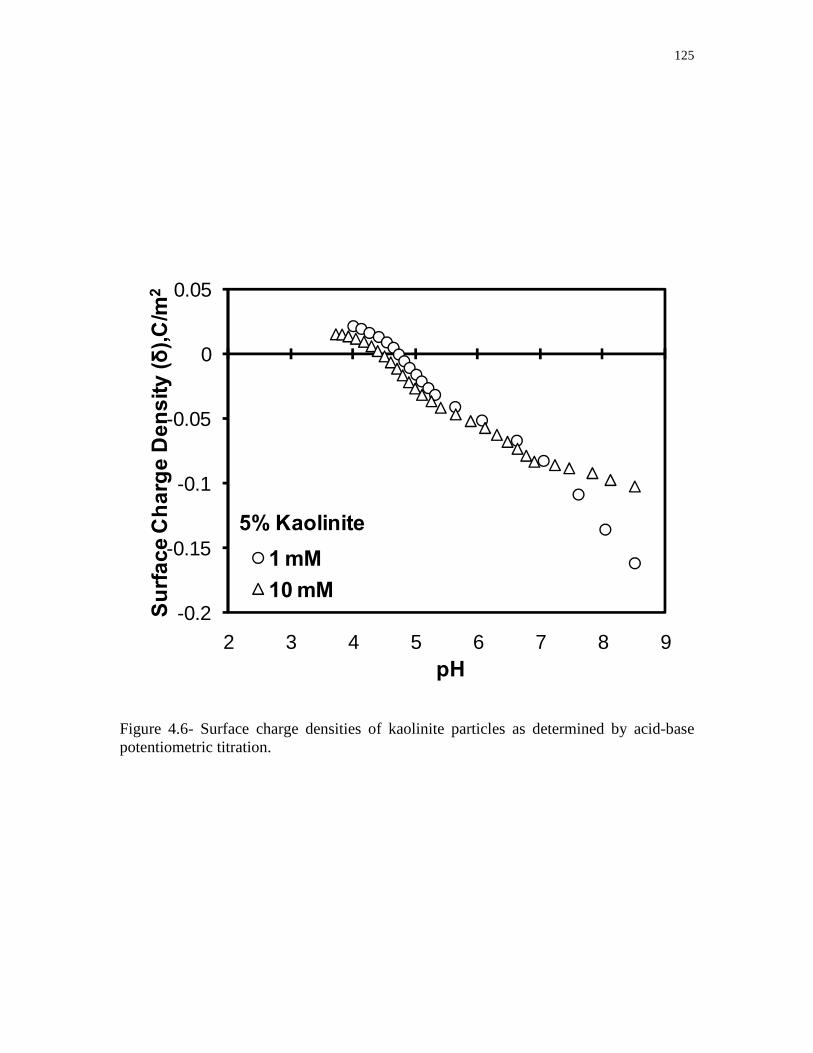
46- Surface charge densities of kaolinite particles as determined by acid-base potentiometric titration 125
47- Surface charge densities of kaolinite particles as determined by acid-base potentiometric titration applying equation (4-3) 127
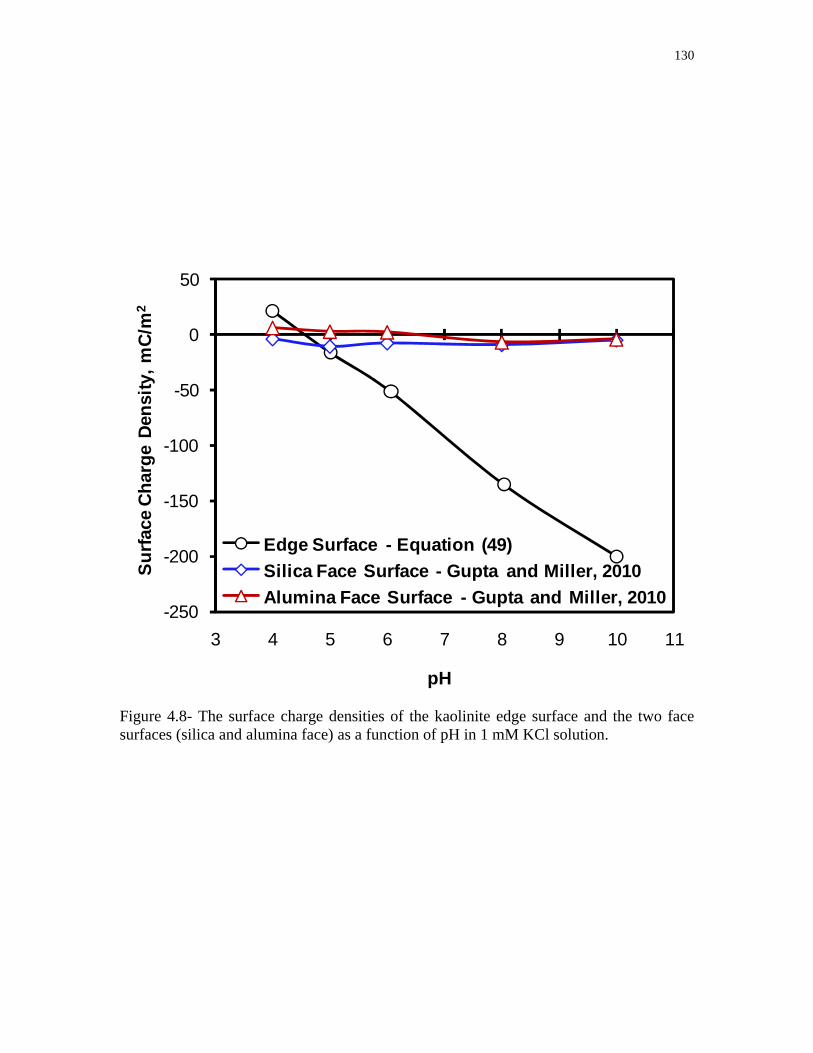
48- The surface charge densities of the kaolinite edge surface and the two face surfaces (silica and alumina face) as a function of pH in 1 mM KCl solution 130
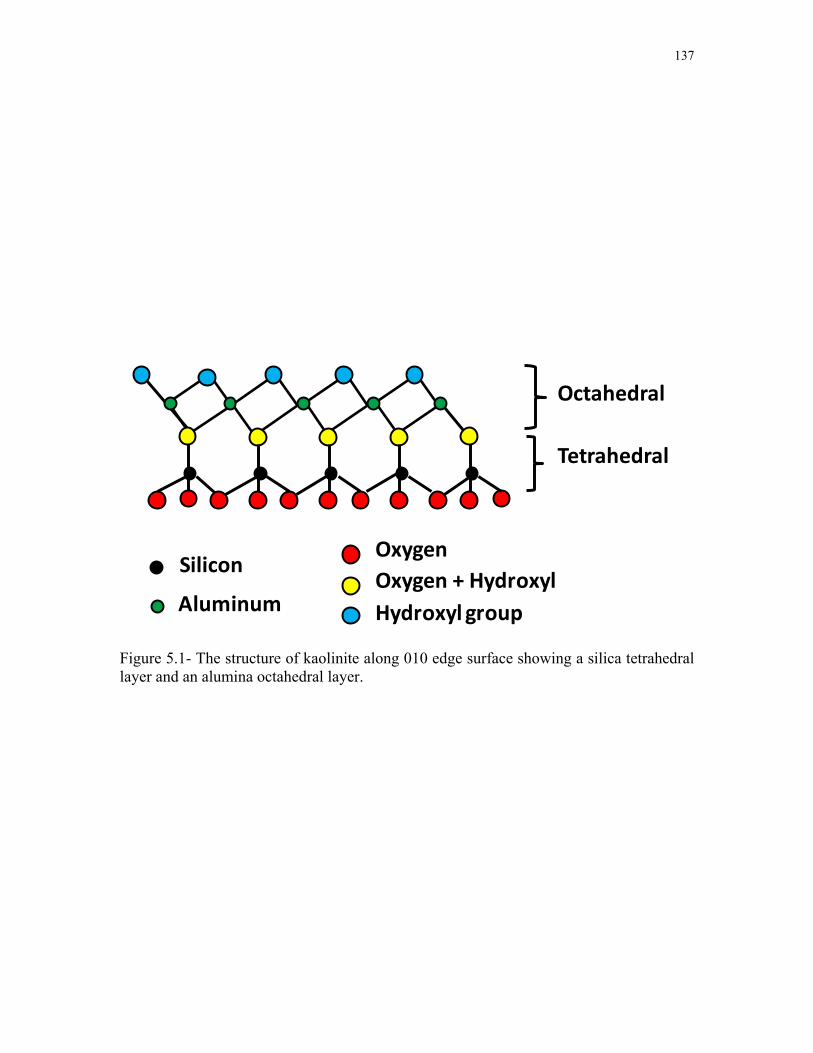
51- The structure of kaolinite along 010 edge surface showing a silica tetrahedral layer and an alumina octahedral layer 137
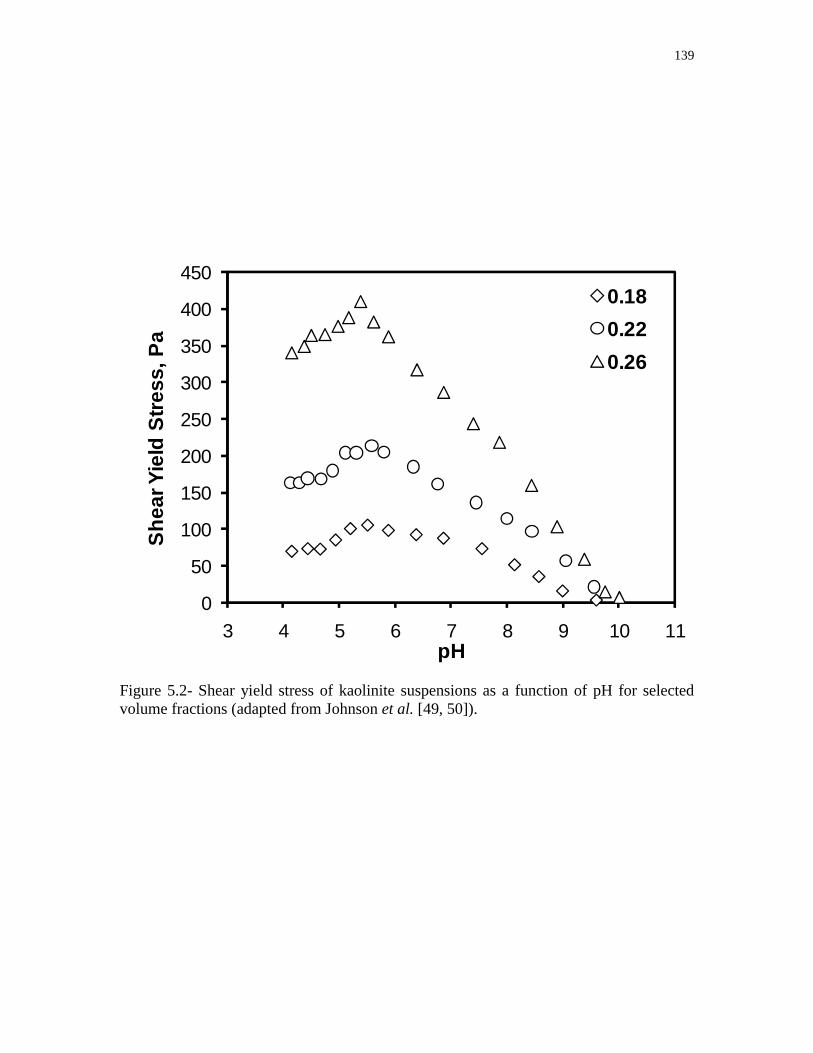
52- Shear yield stress of kaolinite suspensions as a function of pH for selected volume fractions (adapted from Johnson et al [49 50]) 139
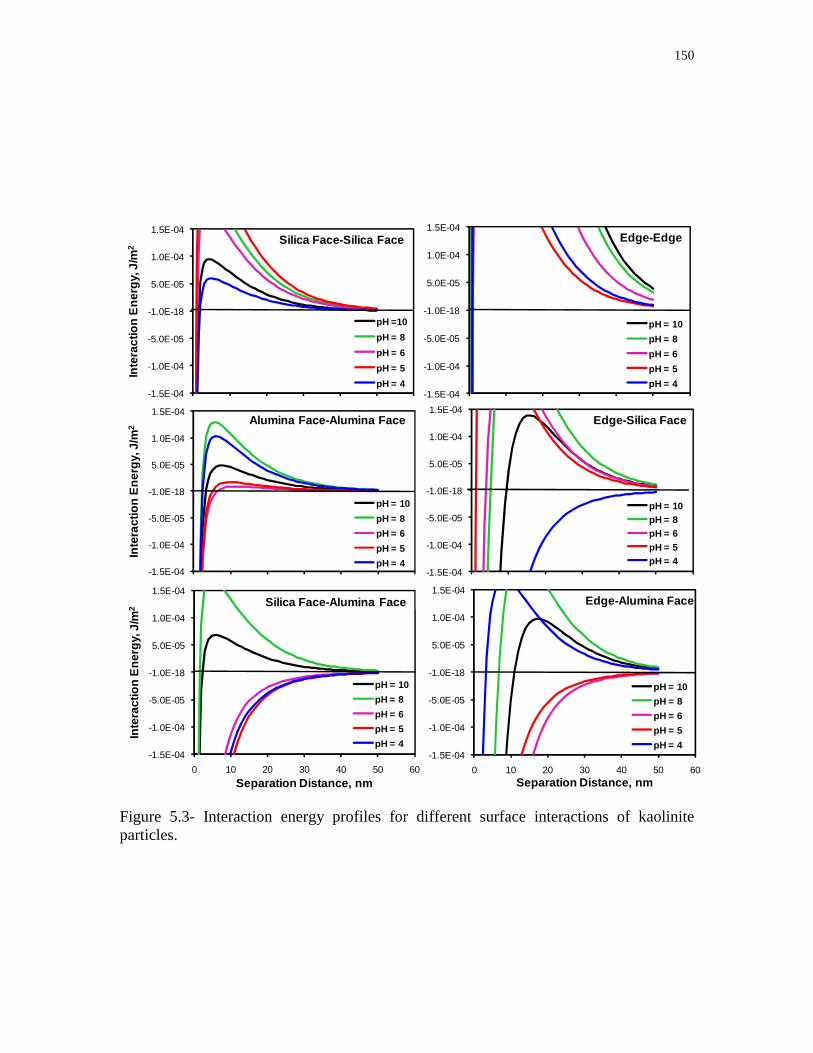
53- Interaction energy profiles for different surface interactions of kaolinite particles 150
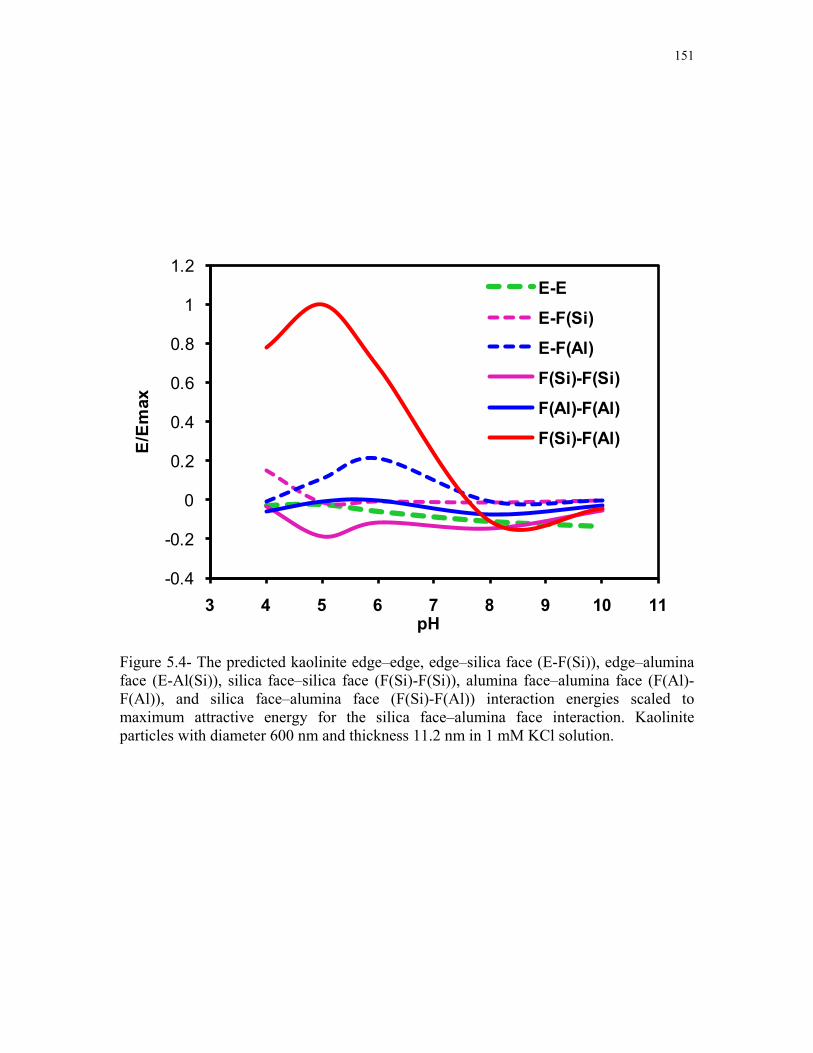
54- The predicted kaolinite edgendashedge edgendashsilica face (E-F(Si)) edgendashalumina face (E-Al(Si)) silica facendashsilica face (F(Si)-F(Si)) alumina facendashalumina face (F(Al)-F(Al)) and silica facendashalumina face (F(Si)-F(Al)) interaction energies scaled to maximum attractive energy for the silica facendashalumina face interaction Kaolinite particles with diameter 600 nm and thickness 112 nm in 1 mM KCl solution 151
xiii
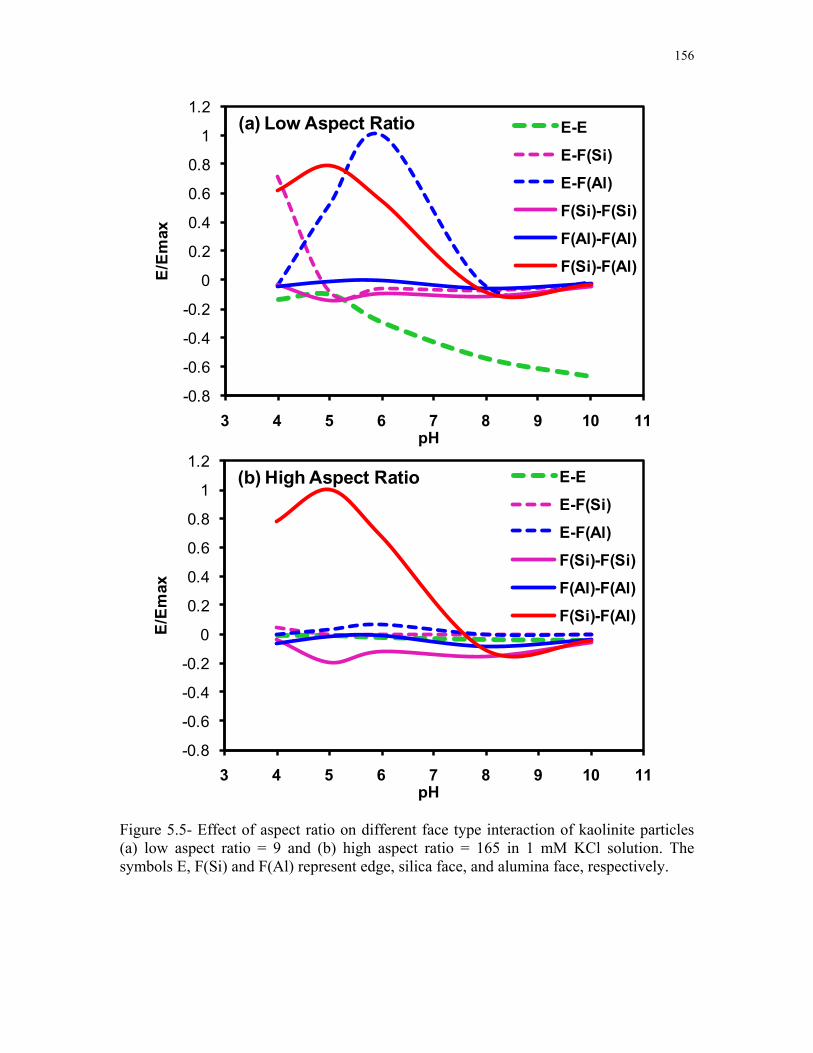
55- Effect of aspect ratio on different face type interaction of kaolinite particles (a) low aspect ratio = 9 and (b) high aspect ratio = 165 in 1 mM KCl solution The symbols E F(Si) and F(Al) represent edge silica face and alumina face respectively 156
56- Effect of electric double layer thickness (κ-1) on different surface interactions for kaolinite particles with particle diameter 600 nm and thickness 112 nm at (a) κ-1 = 96 nm (1 mM KCl solution) and (b) κ-1 = 304 nm (10 mM KCl solution) The zeta-potentials of the silica face and the alumina face are assumed to be reduced by 30 with increasing ionic strength from 1 mM to 10 mM KCl solution The edge surface potential data for 10 mM KCl solution were taken from literature[41] The symbols E F(Si) and F(Al) represent edge silica face and alumina face surfaces respectively 158
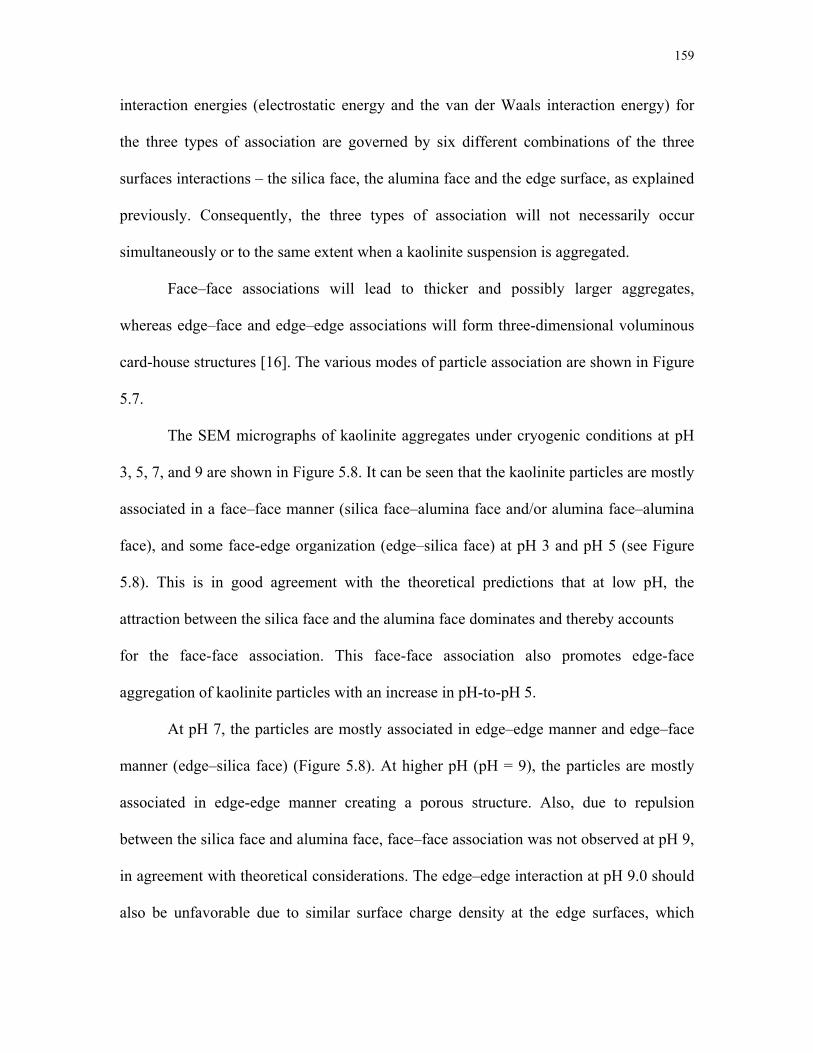
57- The formation of aggregate structures in kaolinite suspensions as (a) dispersed (b) facendashface (c) edgendashface (d) edgendashedge and (e) a combination of (b) (c) and (d) depending on the solution chemistry of the suspension 160
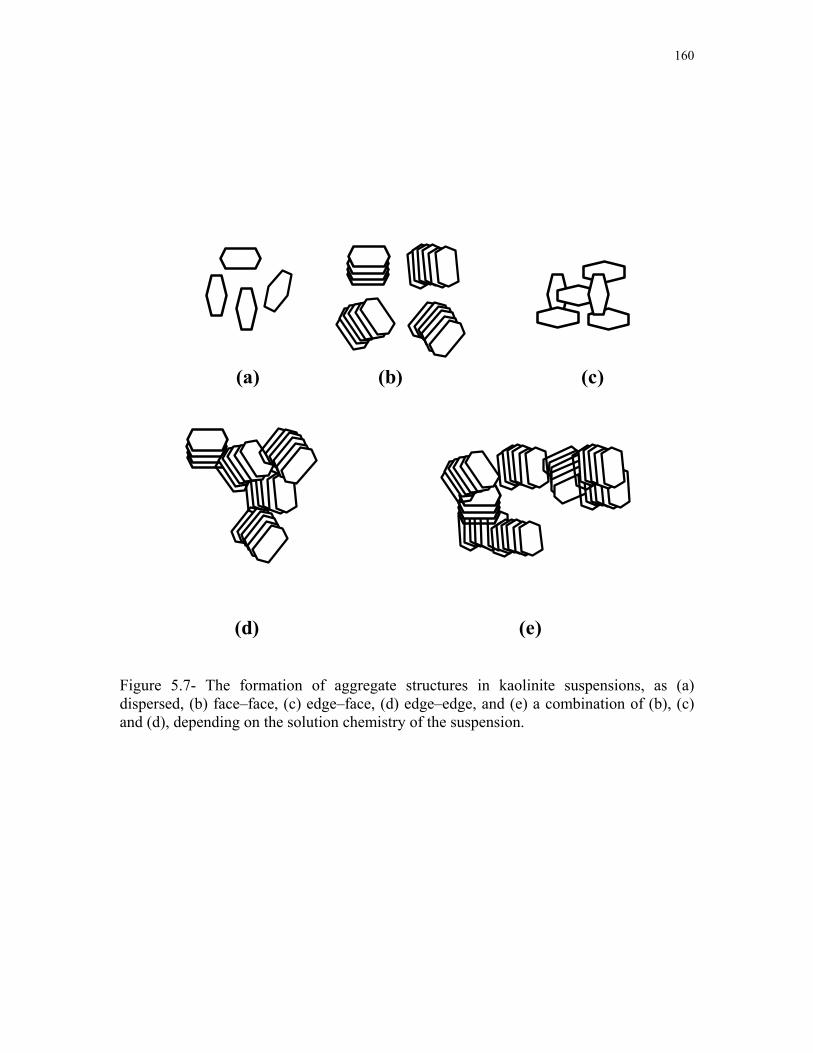
58- Cryo-SEM micrographs of kaolinite aggregates at pH 3 5 7 and 9 at low (left) and high (right) magnification 161
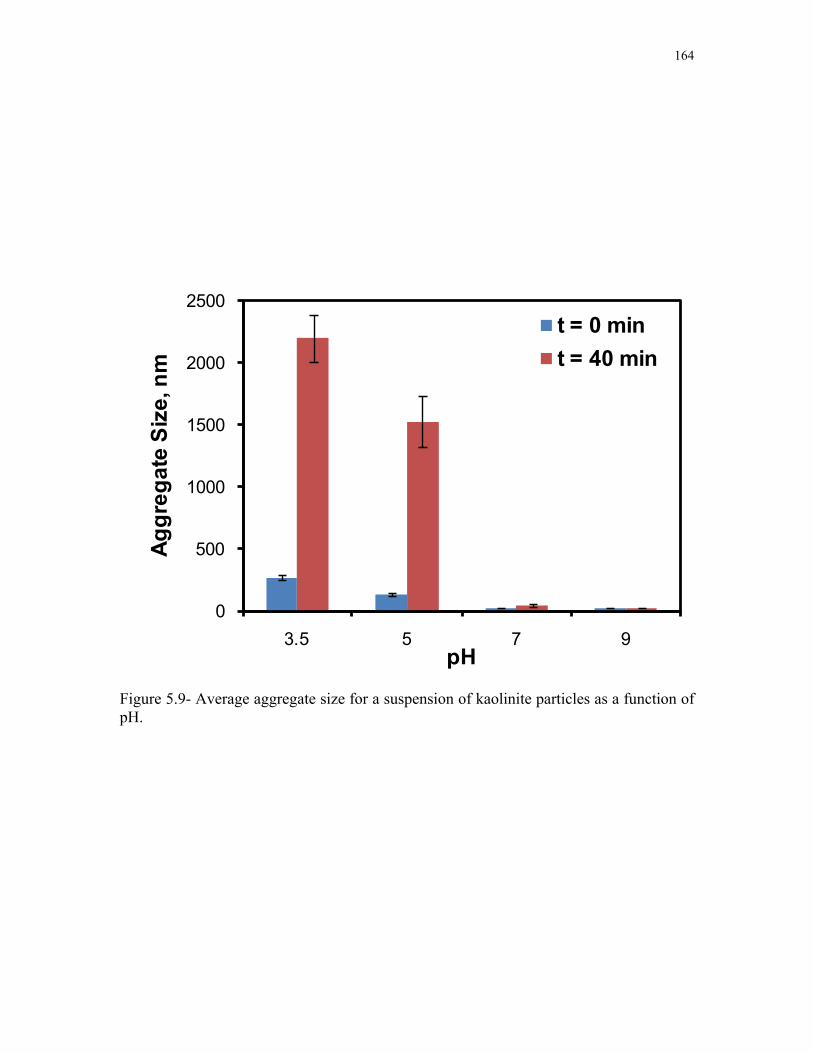
59- Average aggregate size for a suspension of kaolinite particles as a function of pH 164
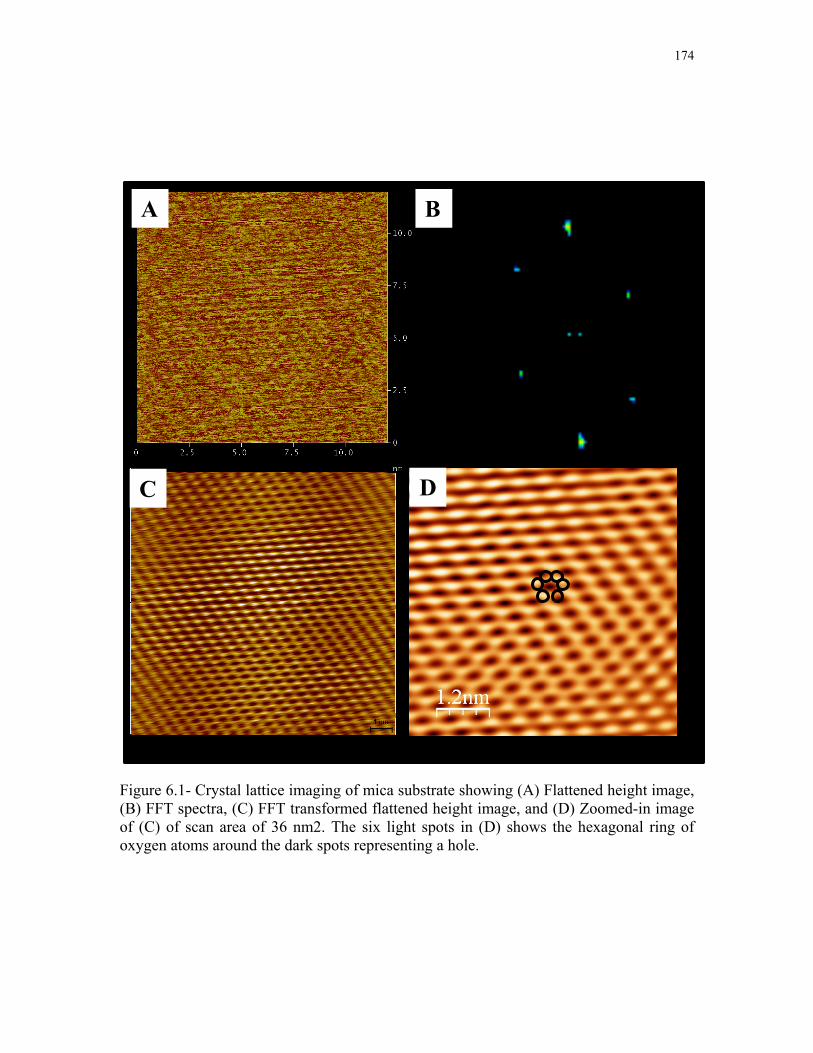
61- Crystal lattice imaging of mica substrate showing (A) Flattened height image (B) FFT spectra (C) FFT transformed flattened height image and (D) Zoomed-in image of (C) of scan area of 36 nm2 The six light spots in (D) shows the hexagonal ring of oxygen atoms around the dark spots representing a hole 174
62- (A) Topography and (B) Deflection images of kaolinite particle on the mica substrate 176
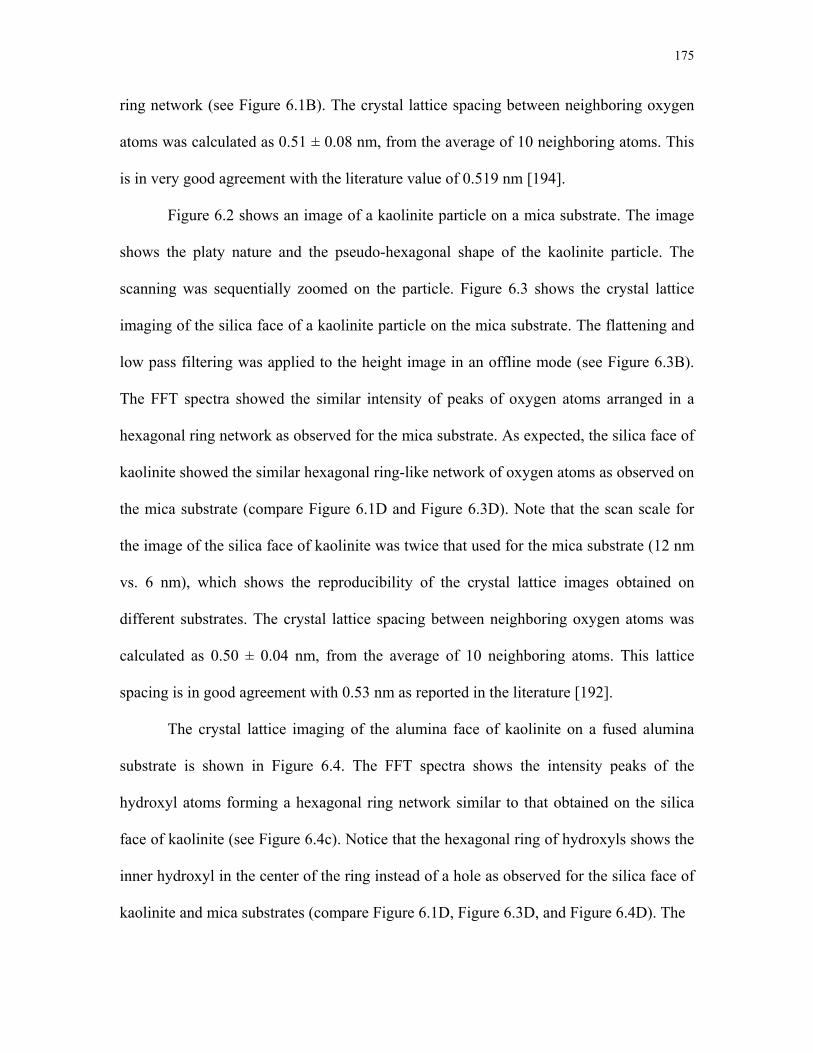
63- Crystal lattice imaging of the silica face of kaolinite showing (A) Theoretical atomic lattice structure (B) Flattened-low pass filtered height image (C) FFT spectra and (D) FFT transformed flattened-low pass filtered height image of scan size 36 nm2 The six black circles in (D) shows the hexagonal ring of oxygen atoms around the dark spots representing a hole 177
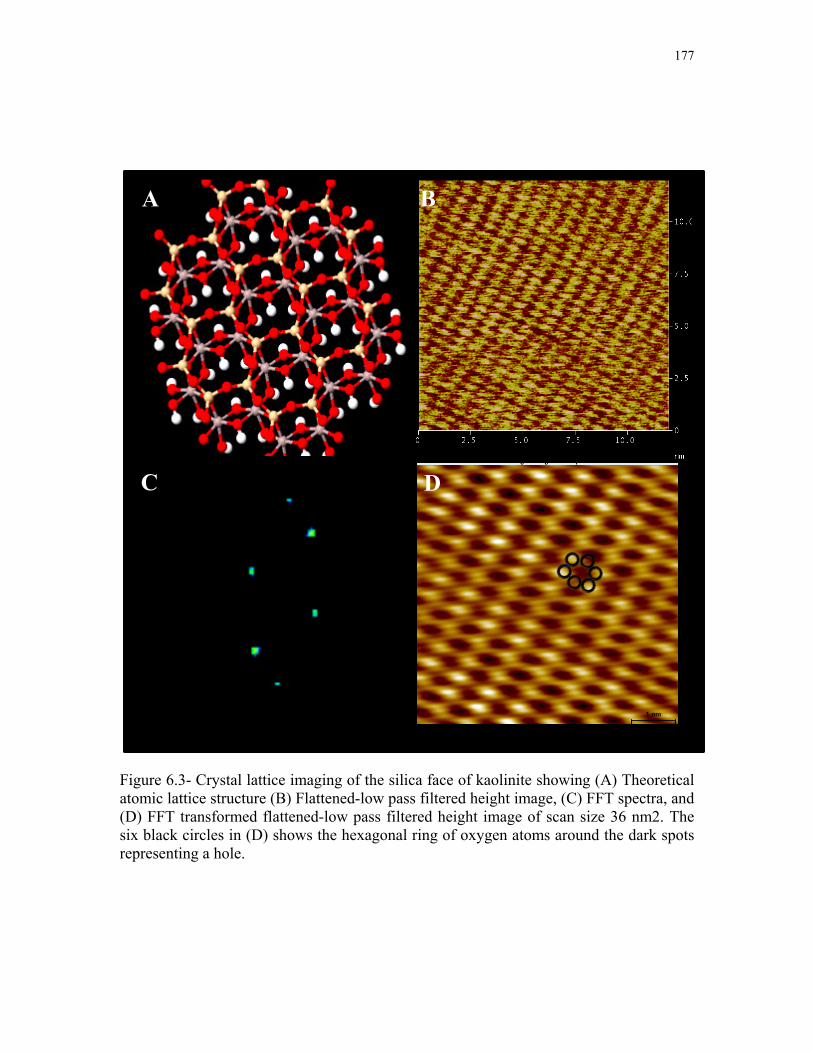
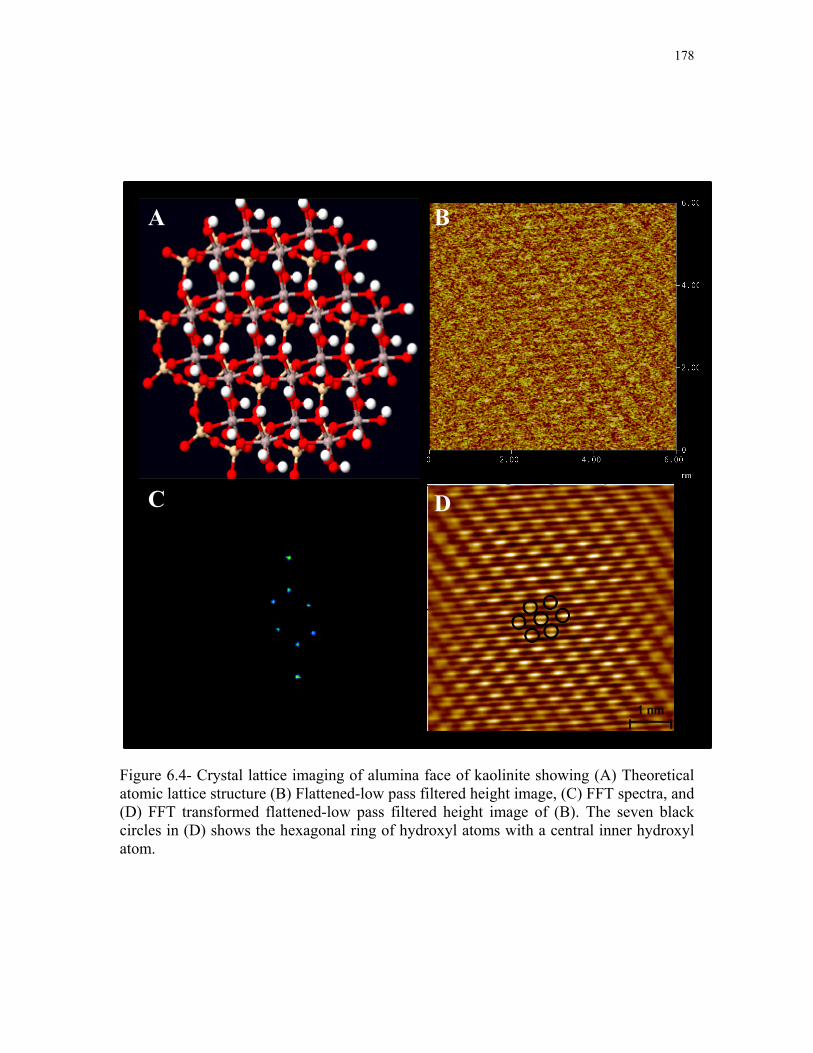
64- Crystal lattice imaging of alumina face of kaolinite showing (A) Theoretical atomic lattice structure (B) Flattened-low pass filtered height image (C) FFT spectra and (D) FFT transformed flattened-low pass filtered height image of (B) The seven black circles in (D) shows the hexagonal ring of hydroxyl atoms with a central inner hydroxyl atom 178
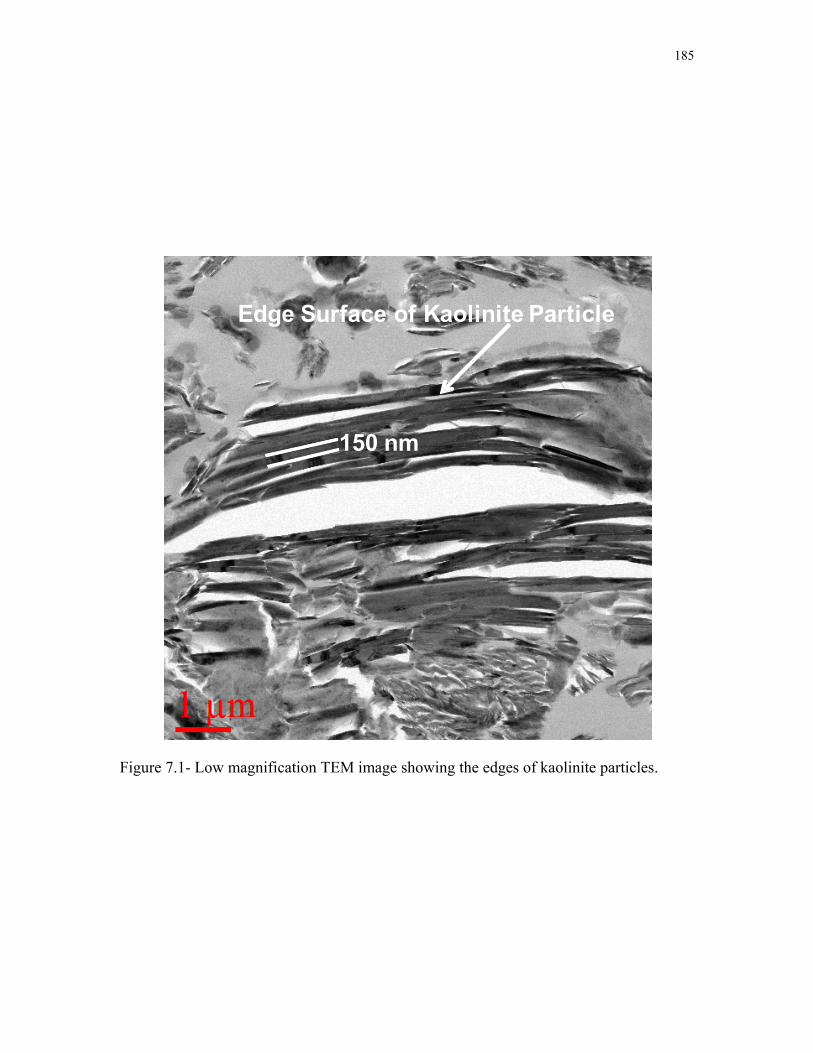
71- Low magnification TEM image showing the edges of kaolinite particles 185
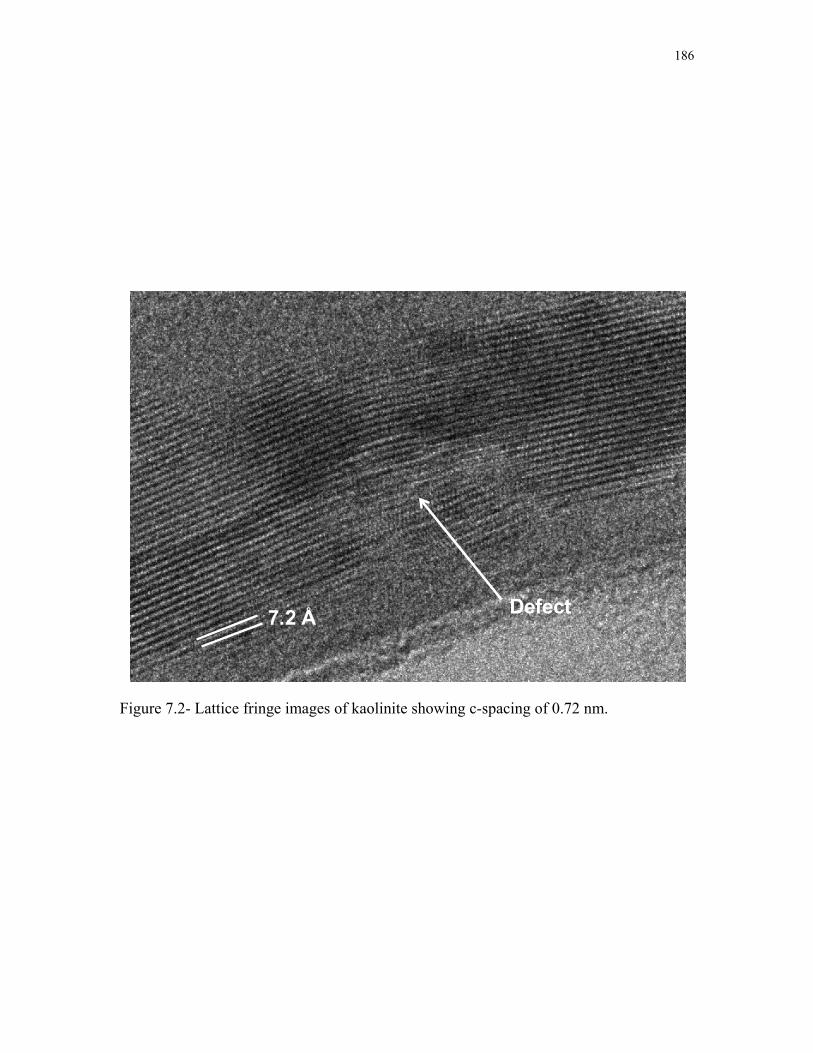
72- Lattice fringe images of kaolinite showing c-spacing of 072 nm 186
73- Lattice fringe pattern of kaolinite along 001 basal plane 188
xiv
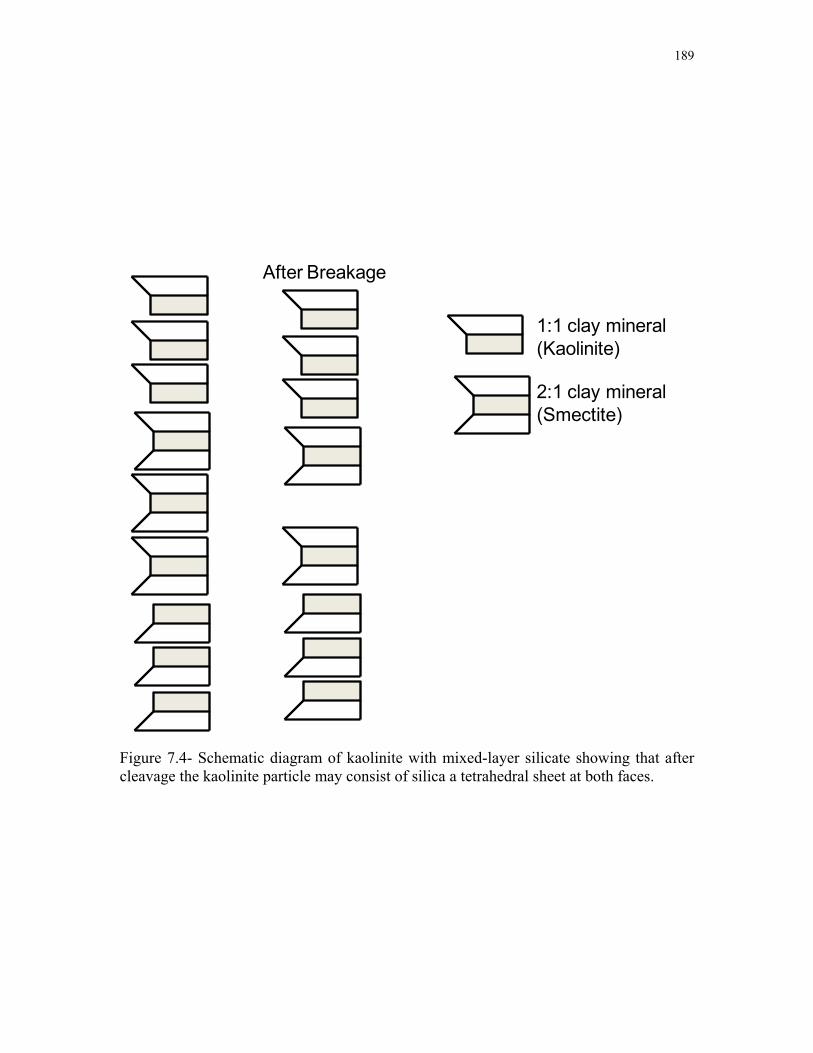
74- Schematic diagram of kaolinite with mixed-layer silicate showing that after cleavage the kaolinite particle may consist of silica a tetrahedral sheet at both faces 189
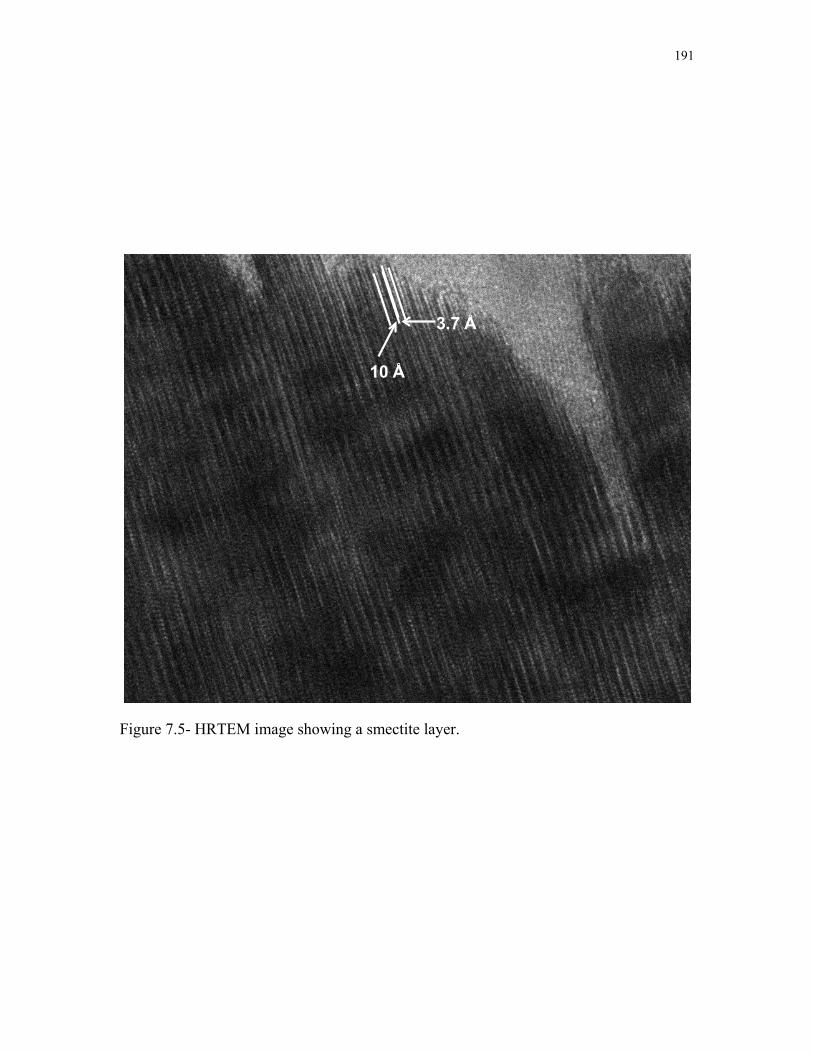
75- HRTEM image showing a smectite layer 191
ACKNOWLEDGMENTS
I would like to express my sincere appreciation to Professor Jan D Miller advisor
and chair of my supervisory committee for all his help support guidance and
encouragement during the course of this dissertation research Professor Miller has been a
great mentor with a beautiful vision for the research I have always learned from him
enjoyed discussion with him and I salute him for his endless knowledge in mineral
processing and surface chemistry I am always touched by his beautiful quotations
written on his office wall ldquoFear Godrdquo and ldquoWork Hardrdquo to mention a few It is my hope
to mimic Professor Miller all my life carry on his teachings and apply them in the real
world
Thanks are also extended to Dr V Hlady Dr S Guruswamy Dr M Free and
Dr X Wang for their positive disposition to be members of the supervisory committee
and their valuable advice and comments on some aspects of this work I have especially
learned a great deal in surface chemistry from Prof Hladyrsquos course in ldquoPhysical Nature
of Surfacesrdquo
Thanks are also extended to Dr Anh V Nguyen at University of Queensland
Brisbane Australia for giving me a chance to work on different areas of surface
chemistry A great deal of work in this dissertation was completed under his guidance
and support from his research group particularly from Drs J Stokes M Hampton and
O Ozdemir was wonderful in completing different tasks
xvi
Thanks are also due to Dr S K Biswal Scientist Institute of Minerals and
Materials Technology Bhubaneswar India for motivating me towards a PhD in the area
of mineral processing and surface chemistry Without his encouragement it would have
been impossible for me to come to Utah and relish this beautiful sea of minerals surface
chemistry
I would also like to thank Dr Jakub Nalaskowski Dr Shoeleh Assemi and all my
colleagues and friends for their continuous support particularly in the bad times and for
providing motivation to finish this dissertation
Finally I would thank the Department of Metallurgical Engineering at the
University of Utah for providing me this wonderful opportunity to work with researchers
all around the world I have learned so much from them whether about research or
everyday discussions which I will treasure for my life
Last but not least the successful completion of this dissertation research would
have not been possible without the major contribution of my wife for bringing good luck
in my life I would like to express my deep love and appreciation to my family for their
support all these years
CHAPTER 1
INTRODUCTION
Clays and clay minerals and their properties are important in geology geo-
technology agriculture and the production of engineered materials Of particular
importance are kaolins Kaolin is a rock term a clay mineral group and also an industrial
mineral commodity [1] The kaolin group of minerals includes kaolinite halloysite
dickite and nacrite The most important kaolin mineral is kaolinite of which physical and
chemical properties will be discussed in this research Kaolinite is white or near white
soft fine in particle size platy in shape low in surface area and chemically inert All of
these properties distinguish the kaolinite mineral as an important industrial commodity
In fact the significance of the kaolin industry is revealed from production statistics
presented in Table 11 which shows the continued demand for this important industrial
mineral
Kaolinite is primarily used in the paper industry where it is used both as filler and
as a coating for paper sheet Another larger user of kaolinite is the ceramic industry
particularly in whiteware sanitaryware insulators and refractories Kaolinite is also
calcined to produce special grades One such grade is produced by thermal treatment of
kaolinite to 6500C (just above the dehydroxylation temperature) to produce metakaolin
2
Table 11- World kaolin production [2]
Country 2005 2006 2007Albania 310 000 300 000 300 000Belgium 300 000 300 000 300 000Bulgaria 200 000 240 000 240 000Czech Republic 649 000 673 000 682 000France 319 464 300 000 307 253Germany 750 000 750 000 750 000Italy 183 804 180 000 180 000Spain 463 398 476 327 475 000Turkey 615 271 600 000 600 000Ukraine 216 600 251 000 244 000United Kingdom 1 910 874 1 762 328 1 671 426Egypt 415 400 400 000 300 000Mexico 877 147 961 800 970 598USA 7 800 000 7 470 000 7 330 000Brazil 2 410 000 2 455 000 2 527 000Australia 231 611 182 304 213 905World Total 25 500 000 25 400 000 25 500 000
3
This metakaolin product is bulky and has an excellent dielectric property being
used as filler in electrical wire coatings A second grade is produced by further heating
kaolinite to about 1050oC at which point the metakaolin is reorganized to form mullite
and cristobalite These mullite needles have a very high brightness and good opacity
which makes them suitable to be used as an extender for titanium dioxide in many
applications in order to reduce formulation costs particularly in paper coating and filling
and in paints Kaolinites are also chemically modified using ionic andor nonionic
surfactants to make them hydrophobic or organophilic Such surface-modified kaolinites
are used in paper paint plastics rubber ink and other more specialized applications
Other applications of kaolinite include use in cracking catalysts fiberglass cement
adhesives pharmaceuticals insecticides food additives fertilizers plaster filter aids
cosmetics polishing compounds etc
Kaolinite is also found as gangue minerals in ores treated in mineral processing
plants In this case kaolinite creates problems in making efficient particle separations
(concentration) and in sedimentation for waste disposal (tailings) for example during the
flotation separation of valuable minerals such as diaspore from gangue minerals such as
kaolinite The Al2O3-to-SiO2 ratio of most diasporic bauxite deposits in China is between
5 and 8 Thus it is desired to treat such materials in order to increase the Al2O3-to-SiO2
mass ratio by physical separation such as flotation so that the Bayer process can be
applied In this regard reverse flotation to remove silicate ore such as kaolinite from
diasporic bauxite is very important for the economic utilization of these resources [3-9]
In another situation kaolinite poses a problem during recovery of bitumen from
oil sand and sedimentation of oil sand tailing ponds Oil sands from the Athabasca region
4
of northern Alberta Canada are composed of bitumen (~12) sand silts clays (mineral
content ~85) and water (3-6) The clay component is comprised of kaolinite (50-
60) and illite (30-50) with some montmorillonite [10 11] Typical bitumen
recoveries range from 88 to 95 depending on oil sands grade and origin Tailings
include a mixture of water sand silt clay and residual bitumen This tailings slurry is
approximately 55 solids (82 sand and 18 fines lt 44 μm) Historically the tailings
were pumped into large settling basins where the sand fraction settled out rapidly to form
beaches Some fines were trapped within the sand matrix of the beaches However the
remaining thin slurry of fines and water (8 solids) flowed into the settling basin where
the solids settled gradually to form a densified zone of fine tailings at depth Released
water was recycled back to the extraction plant After a few years the fines settle to 30 to
35 by weight and are referred to as mature fine tailings (MFT) Further consolidation of
the MFT is expected to take centuries [10 11] The wettability aggregation dispersion
flotation and thickening of kaolinite are affected by its crystal structure and surface
properties [7 12-15] It is therefore desired to understand the physical and surface
chemical properties of kaolinite
The physical and chemical properties account for the use of kaolinite in all of the
above stated applications The physical properties such as shape size and the aspect ratio
of kaolinite particles are important in their use in papermaking as a dispersing agent in
paints and inks and in almost all applications Analysis of the surface chemistry features
such as electrokinetic phenomena is complicated by the anisotropic platy structure of the
particles which manifests itself in the presence of both edge surfaces and face surfaces
Even more so the mineral structure suggests that there should be two types of surface
5
faces defined by the 001 and the 001 basal planes In this way ideally one face should be
described as a silica tetrahedral layer and the other face should be described by an
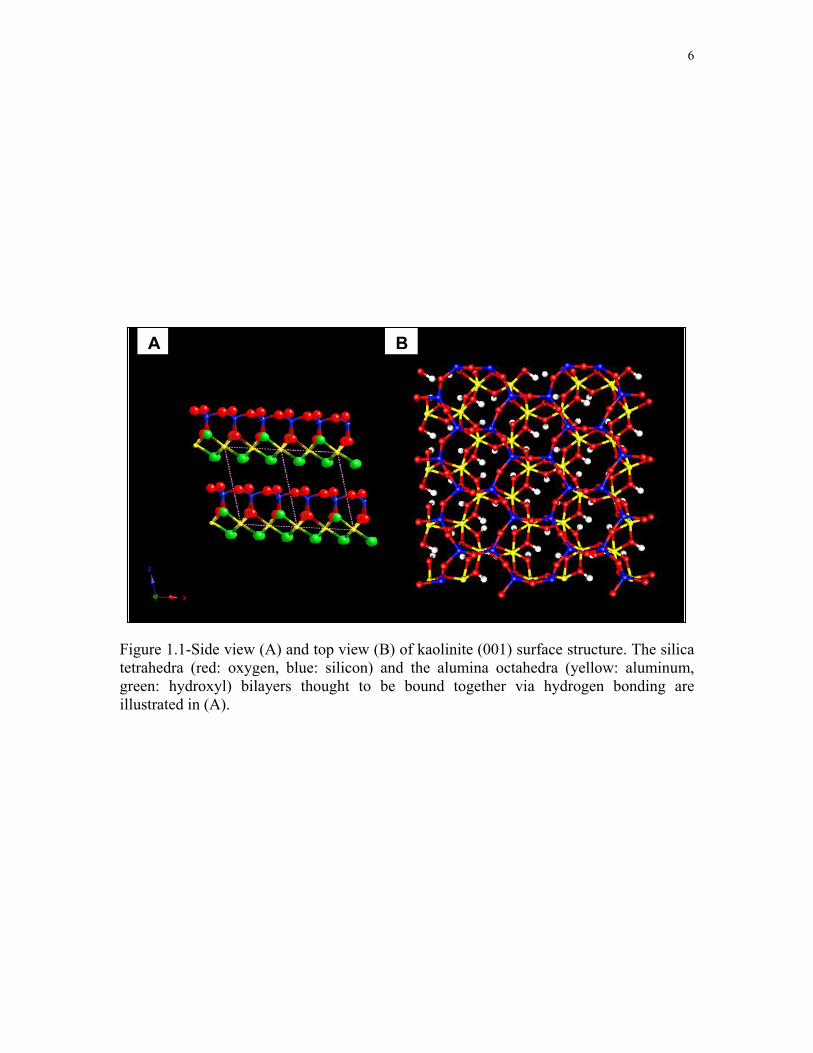
aluminum hydroxide (alumina) octahedral layer as shown in Figure 11
It is believed that the basal planes of kaolinite carry a permanent negative charge
due to isomorphous substitution of Al3+ for Si4+ in the silica tetrahedral and Mg2+ for
Al3+ in the alumina octahedral layer whereas the edge surface carries a positive or
negative charge depending on the pH of the system Therefore it is commonly assumed
that the basal planes do not show a surface charge dependency with variation in pH
However this assumption has never been verified due to the difficulty in isolating the
two faces of kaolinite (silica tetrahedral and alumina octahedral faces) and the lack of
instrumentation to investigate the two faces when dealing with nanosized particles
Electrokinetic measurements of kaolinite particles are particularly important in
order to describe its surface charge properties and hence its behavior in suspension The
electrophoresis technique is commonly followed to estimate the surface potentialzeta
potential of particles as a function of solution pH Generally it has been found that
kaolinite particles exhibit a negative zeta potential at all pH values greater than pH 3
This negative surface charge of kaolinite particles is similar to the surface charge of
quartz particles which also have a negative zeta potential at pH values greater than pH 3
Although electrophoretic mobility measurements describe the overall electrokinetic
characteristics of the anisotropic kaolinite particles these measurements do not provide
details of the charge at various kaolinite surfaces The surface potential of the kaolinite
particle should be defined by the surface charge of its 001 and 001 basal planes and edge
faces The basal plane 001 consists of a silica tetrahedral layer whereas the basal plane
6
Figure 11-Side view (A) and top view (B) of kaolinite (001) surface structure The silica tetrahedra (red oxygen blue silicon) and the alumina octahedra (yellow aluminum green hydroxyl) bilayers thought to be bound together via hydrogen bonding are illustrated in (A)
A B
7
001 consists of an alumina octahedral layer The edge faces of broken covalent bonds
become hydrated and form silanol and aluminol groups It is expected therefore that the
zeta-potential of kaolinite should exhibit the average zeta-potential behavior for pure
silica and pure alumina particles Nevertheless electrophoresis measurements repeatedly
show a negative zeta potential for kaolinite which reflects the dominance of the silica
tetrahedral layer The reason for this behavior requires clarification It is realized that the
electrophoresis measurements for kaolinite reflect a composite picture of the anisotropic
platy shape and the heterogeneous nature of the charge distribution A complete theory
covering arbitrary shape and charge of the particles describing the electrokinetic behavior
of the particles is still lacking due to the complexities of particle surface charge and
particle shape as well as the motion of such particles in an electric field
Interactions between particles are important in order to explain the rheology of
kaolinite suspensions The particle interactions are frequently governed by the surface
charge properties of kaolinite particles Traditionally the basal plane faces (the silica
tetrahedral layer and the alumina octahedral layer) were considered similar and thereby
the only interactions considered were those between the face-face the face-edge and the
edge-edge surfaces It is again emphasized here that in all previous studies distinction
between the basal plane face surfaces (the silica tetrahedral layer and the alumina
octahedral layer) had not been made and these face surfaces were assumed to be the
same These different particles interactions are important for they define the aggregation
state of the kaolinite particles and the rheology of kaolinite suspensions The aggregation
state will define the network structure of kaolinite particles in suspension whether they
form loose aggregates or compact three-dimensional card-house structures The strength
8
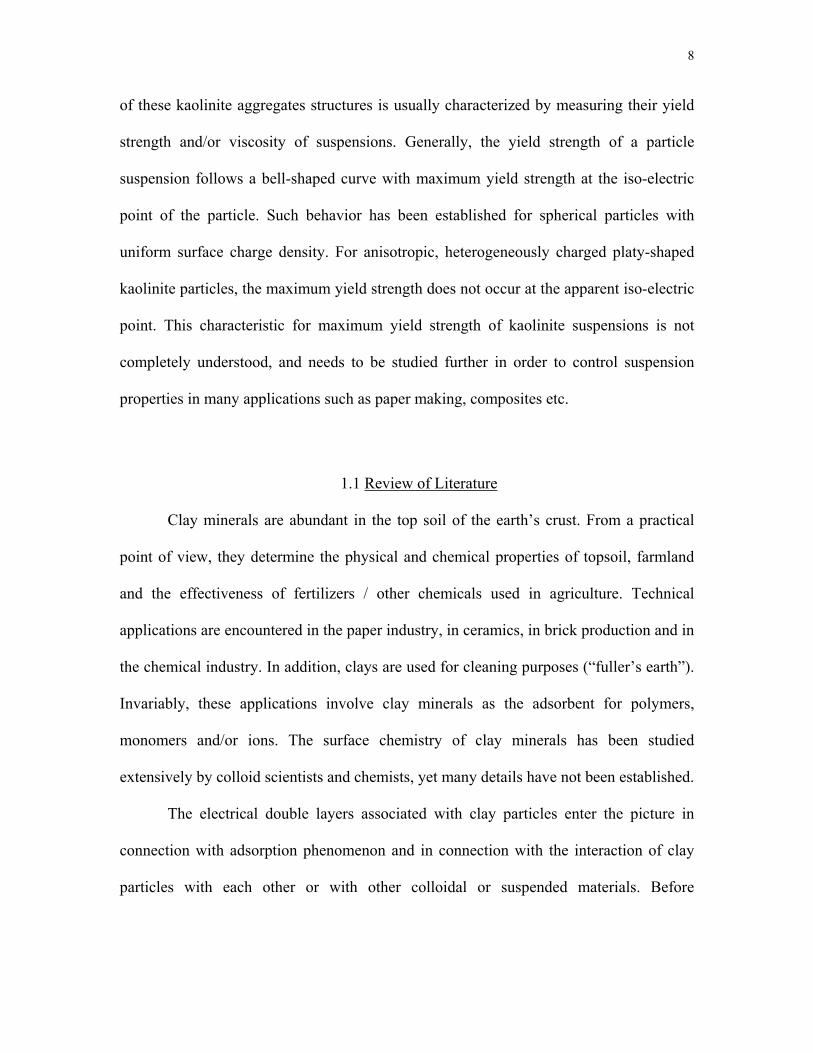
of these kaolinite aggregates structures is usually characterized by measuring their yield
strength andor viscosity of suspensions Generally the yield strength of a particle
suspension follows a bell-shaped curve with maximum yield strength at the iso-electric
point of the particle Such behavior has been established for spherical particles with
uniform surface charge density For anisotropic heterogeneously charged platy-shaped
kaolinite particles the maximum yield strength does not occur at the apparent iso-electric
point This characteristic for maximum yield strength of kaolinite suspensions is not
completely understood and needs to be studied further in order to control suspension
properties in many applications such as paper making composites etc
11
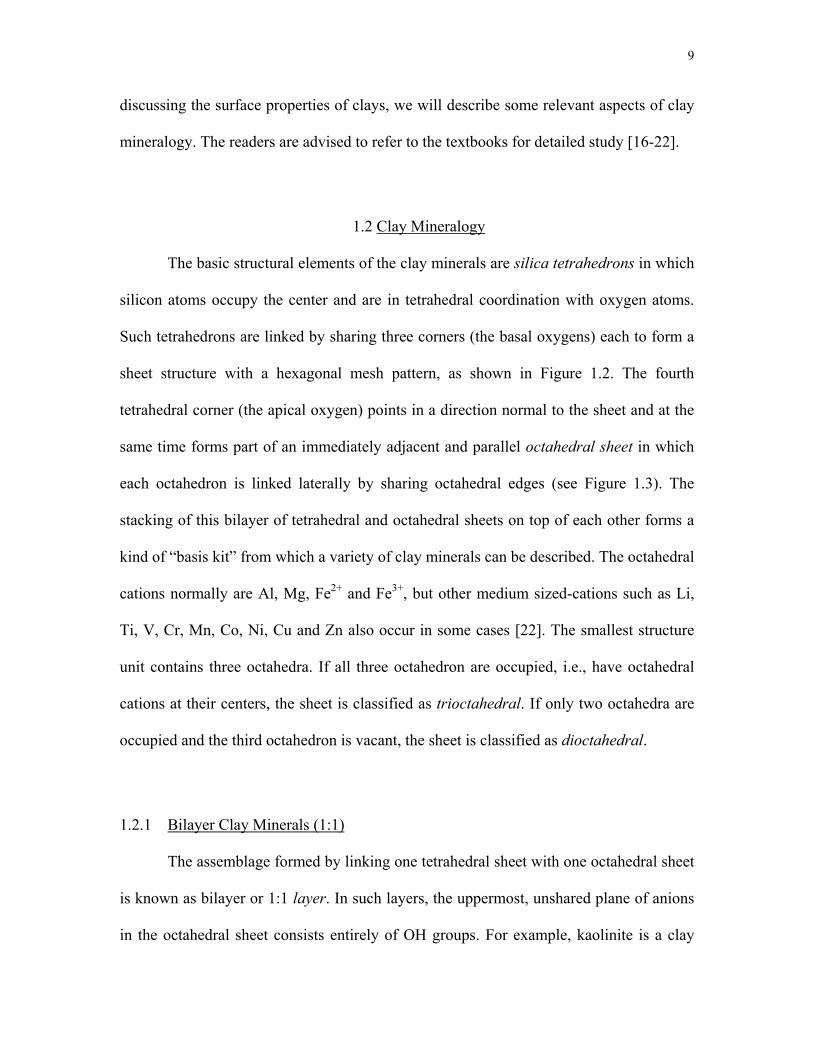
Clay minerals are abundant in the top soil of the earthrsquos crust From a practical
point of view they determine the physical and chemical properties of topsoil farmland
and the effectiveness of fertilizers other chemicals used in agriculture Technical
applications are encountered in the paper industry in ceramics in brick production and in
the chemical industry In addition clays are used for cleaning purposes (ldquofullerrsquos earthrdquo)
Invariably these applications involve clay minerals as the adsorbent for polymers
monomers andor ions The surface chemistry of clay minerals has been studied
extensively by colloid scientists and chemists yet many details have not been established
Review of Literature
The electrical double layers associated with clay particles enter the picture in
connection with adsorption phenomenon and in connection with the interaction of clay
particles with each other or with other colloidal or suspended materials Before
9
discussing the surface properties of clays we will describe some relevant aspects of clay
mineralogy The readers are advised to refer to the textbooks for detailed study [16-22]
12
The basic structural elements of the clay minerals are silica tetrahedrons in which
silicon atoms occupy the center and are in tetrahedral coordination with oxygen atoms
Such tetrahedrons are linked by sharing three corners (the basal oxygens) each to form a
sheet structure with a hexagonal mesh pattern as shown in
Clay Mineralogy
Figure 12 The fourth
tetrahedral corner (the apical oxygen) points in a direction normal to the sheet and at the
same time forms part of an immediately adjacent and parallel octahedral sheet in which
each octahedron is linked laterally by sharing octahedral edges (see Figure 13) The
stacking of this bilayer of tetrahedral and octahedral sheets on top of each other forms a
kind of ldquobasis kitrdquo from which a variety of clay minerals can be described The octahedral
cations normally are Al Mg Fe2+ and Fe3+ but other medium sized-cations such as Li
Ti V Cr Mn Co Ni Cu and Zn also occur in some cases [22] The smallest structure
unit contains three octahedra If all three octahedron are occupied ie have octahedral
cations at their centers the sheet is classified as trioctahedral If only two octahedra are
occupied and the third octahedron is vacant the sheet is classified as dioctahedral
121
The assemblage formed by linking one tetrahedral sheet with one octahedral sheet
is known as bilayer or 11 layer In such layers the uppermost unshared plane of anions
in the octahedral sheet consists entirely of OH groups For example kaolinite is a clay
Bilayer Clay Minerals (11)
10
Figure 12- Structure of the tetrahedral sheet showing (A) tetrahedral arrangement of Si and O (B) projection of tetrahedron on plane of sheet and (C) top view of tetrahedral sheet (dotted line unit cell area) Large grey circles represent oxygen atoms and the small red circles represent silicon atoms
Oxygen
Silicon
(A) (C)(B)
11
Figure 13- Structure of the octahedral sheet showing (A) octahedral arrangement of Al or Mg with O or OH (B) projection of octahedron in two dimension and (C) top view of octahedral sheet (dotted line unit cell area) Large grey circles represent oxygen atoms large blue circles represent hydroxyl groups and small blue circles represent aluminum atoms
Oxygen
Silicon
(A) (C)(B)
Hydroxyl
12
mineral consisting of a repetition of this bilayer double sheet The repeating unit has a
dimension of 072 nm The double sheets are bonded to each other by hydrogen bonds
(involving OH of the octahedral sheet and oxygens of the adjacent silica sheet) and van
der Waal forces The kaolinite has a rigid crystal structure that cannot be swollen by
changing pH or solution ionic strength It is a nonswelling clay mineral In this research
work kaolinite clays will be discussed in greater detail
122
The other category called 21 clay minerals has a triple layer as the repeating
unit It consists of an alumina or magnesium oxide layer sandwiched on both sides by
silica tetrahedral sheets The dimension of this trilayer is 10 nm thick The
physicochemical behavior of 21 clay minerals depends strongly on the degree of
substitution of Si4+ by Al3+ in the tetrahedral layers and the substitution of Al3+ by Mg2+
or Fe2+ in the octahedral layers These substitution cause charge imbalance for both 21
and also 11 clay minerals The excess layer charge is compensated by various interlayer
materials including individual cations (as in the mica group) hydrated cations (as in
smectites) and hydroxide octahedral groups and sheets (as in chlorite minerals) With
these basic units a variety of clay minerals have been identified depending on the
variations in the sequence of the basic building kits or variations in chemical
compositions (Mg or Al octahedrons substitutions of Si4+ by Al3+ in the tetrahedral layer
and Al3+ by Mg2+ in the octahedral layer etc) Clay minerals are classified into eight
major groups on the basis of layer type (11 or 21) layer charge and type of interlayer
as presented in
Triple Layer Clay Minerals (21)
Table 12
13
Table 12- Classification of layered silicate minerals [22]
Layer Type Group Sub-group Species11 Sepentine ndash Kaolin Serpentines Lizardite Antigorite Chrysotile
Kaolins Kaolinite Dickite Nacrite
21 Talc-Pyrophillite Talcs Talc WillemseitePyrophyllites Pyrophyllite
Smectite Saponites Saponite HectoriteMontmorillonites Montmorillonite Beidellite
Vermicullite Trioctahedral Vermicullite Trioctahedral VermiculliteDioctahedral Vermicullite Dioctahedral Vermicullite
Mica Trioctahedral Mica Phlogopite Biotite LepidoliteDioctahedral Mica Muscovite
Brittle Mica Trioctahedral Brittle Mica ClintoniteDioctahedral Brittle Mica Margarite
Chlorite Trioctahedral Chlorites ClinochloreDioctahedral Chlorites DonbassiteDitrioctahedral Chlorites Cookeite
21 Sepiolite-Palygorskite Sepiolites SepioliteInverted Ribbons Palygorskites Palygorskites
14
13
The kaolinite structure as described above consists of a sheet of (Si4O10)4- formed
by the linkage of SiO4 tetrahedra in a hexagonal array the vertices all pointing in one
direction The apical oxygens together with some additional (OH)- ions located over the
center of hexagons form the base of a gibbsite-type layer or alumina octahedral layer
The structure of kaolinite is shown in
Kaolinite Structure
Figure 14 Kaolinite has triclinic unit cell crystal
structure with a = 515 Å b= 895 Å c= 739 Å α = 918deg β = 1048deg and γ = 90deg
14
The chemical formula of kaolinite can be written in terms of oxides as
Al2O32SiO22H2O The chemical analysis indicates that various ions may substitute in
the structure for example Al3+ for Si4+ in the silica tetrahedral layer and Mg2+ or Fe2+ for
Al3+ in the alumina octahedral layer [23]
Kaolinite Chemistry
Kaolinite has a low cation exchange capacity of about 5 meq100 g compared
with other 21 type clay minerals such as montmorillonite (100 meq100g) [16 24] The
anion exchange capacity of kaolinite on the other hand is higher than its cation exchange
capacity and may be attributed to the replaceable (OH)- ions of the exposed alumina
octahedral layer
Kaolinite contains little or no surface adsorbed water in its structural unit
therefore most of the dehydration (loss of constitutional OH) takes place between 400
and 525 When the kaolinite minerals are heated so that all water molecules and (OH)-
ions are driven off at about 800 the product is called metakaolinite When kaolinite
minerals are heated beyond 800 the layered structure is further disrupted and cannot
15
Figure 14- The structure of kaolinite clays
O
OH-
Si+4
Al+3
16
be reconstituted by rehydration The final products of thermal decomposition are mullite
and cristobalite
15
The kaolinite may occur in compact massive blocks in vermin-form or granular
aggregates as radiating platelets or as piles of platelets or lsquobooksrsquo Kaolinite shows a
perfect cleavage along the 001 plane The particles are white in color sometimes with
reddish brownish or bluish tints and colorless in thin sections The refractive index
values for kaolinite are
Kaolinite Optical and Physical Properties
nα = 1553 - 1563 nβ = 1559 - 1569 and nγ = 1560 - 1570
16
Kaolinite occurs in hydrothermal residual and sedimentary deposits The
hydrothermal and residual occurrences are called primary and the sedimentary
occurrences are referred to as secondary deposits Primary kaolins are those that have
formed in situ by the alteration of crystalline rocks such as granites and rhyolites The
alteration results from surface weathering groundwater movement below the surface or
hydrothermal action Secondary kaolins are sedimentary and were eroded transported
and deposited as beds or lenses associated with sedimentary rocks
Kaolinite Genesis
Kaolin minerals form at relatively low temperatures and pressures The most
common parent minerals are feldspar and muscovite both of which contain desired
alumina and silica from which the kaolin minerals are formed The transformation of
17
potassium feldspar into kaolinite occurs by intense weathering of the feldspar and
leaching of K and SiO2 according to the equation
Potassium Feldspar Kaolinite Silica Potash
2KAlSi3O8 + 3H2O rarr Al2Si2O5(OH)4 + 4SiO2 + 2KOH
All of the potassium must be lost in solution because small amounts of unleached
potassium favor illite formation rather than kaolinite Dissolution is essential to chemical
weathering and to the formation of kaolinite A few researchers [14 25] studied the
dissolution reaction of kaolinite and determined the free energy of formation of kaolinite
ranged from -9025 to -9038 kcalmol [25] Kittrick concluded from the solubility
experiments that the ion activities during kaolinite dissolution appears to be controlled by
soluble small particles which may be present as impurities [25]
17
The surface chemistry features of kaolinite reside in its bilayer structure which is
composed of one sheet of silica and a sheet of alumina The basal planes of kaolinite are
thus half siloxane and half hydroxylated alumina When these anisotropic structural
features are considered together with chemical features further understanding of the
electrokinetic behavior can be obtained
Surface Chemistry of Kaolinite
It is well known that kaolinite has a heterogeneous surface charge The basal
planes of kaolinite (silica tetrahedral layer and alumina octahedral layer) are commonly
assumed to carry a constant structural charge due to isomorphous substitution of Al3+ for
18
Si4+ in the silica tetrahedral layer and Fe2+ or Mg2+ for Al3+ in the alumina octahedral
layer The charge on the edge surfaces is due to the protonation deprotonation of surface
hydroxyl groups and therefore depends on the solution pH [16 23 26-28] However this
assumption has never been verified due to the difficulty in isolating the two faces of
kaolinite (silica tetrahedral and alumina octahedral faces) and the lack of instrumentation
to investigate the two faces when dealing with nanosized particles
The earlier studies were concentrated to determine the cation exchange capacity
of kaolinite Depending on the different counterions and source of kaolinite different
values for cation exchange capacity for kaolinite are reported in the literature in the range
of 36-100 micro-moleg [29-32] Ferris and Jepson [29] do not agree that kaolinite has
definite cation exchange capacity They concluded that a structural charge does not exist
on the basal surface of their kaolinite samples
The surface charge density for kaolinite particles was also determined by titration
[14 33-37] Despite these numerous studies experimental results are still disparate The
pHPZNPC (point of zero net proton charge) for kaolinite varies from pH 4 [33] to pH 75
[14] One reason for these discrepancies could be linked to contrasting experimental
methods some researchers used continuous potentiometric titrations with short
equilibration times [14 37] while others used potentiometric measurements in batch
experiments over long equilibration times [33 34 38]
The iso-electric point of kaolinite as determined by electrophoresis is quite
intriguing as one would expect that the kaolinite particles should show the iso-electric
point at pH of 57 as an average of silica (iso-electric point at pH of 22) and gibbsite
(iso-electric point at pH of 92) since the composition of silica to alumina in kaolinite is
19
nearly 11 However the iso-electric point of kaolinite particles as measured by
electrophoresis is consistently less than pH 3 which is more closely related to the iso-
electric point of silica [29 39-45] However it was pointed out that the zeta potential of
kaolinite inferred from the electrophoretic mobility using the Smoluchowski equation has
been criticized because of the heterogeneous nature of the surface charge and the
hexagonal shape of the particles [15 24 46] The calculation of zeta potential and surface
charge densities for nonspherical kaolinite assuming an equivaent sphere may result in
quite misleading values The zeta potentials calculated from such mobilities do not reflect
the potential at the shear plane because of the screening effect of positive charges on the
edges relatives to those of negative charges at faces resulting in lower negative mobility
[47]
The surface charge properties of kaolinite will have an influence on the particle
interactions in a suspension and thereby affecting its rheological properties Several
researchers have defined the rheological properties of kaolinite and have explained the
abnormal behavior of a maximum yield stress for kaolinite suspensions at pH 5-55 [26
48-50] Such a maximum might be expected at kaolinitersquos iso-electric point of pH lt 3
[51 52] Johnson et al [49 50] followed the common assumption the basal planes of
kaolinite are permanently negative charged and explained this abnormal rheological
behavior based on the aggregation behavior of kaolinite particles which is described
mainly by favorable interactions between negatively charged faces and positively charged
edges On this basis the maximum shear-yield stress at pH 55 was explained However
the kaolinite particle interactions theory should be considered carefully due to the
20
underlying assumption of negatively charged faces (silica face and alumina face) of
kaolinite
Limited research has been reported on the experimental characterization of the
face surfaces and edge surface of kaolinite [15] A few studies have reported the average
FTIR spectra of both faces of kaolinite [53-55] Recent development of advanced
analytical techniques (XPS - X-ray photoelectron spectroscopy LEISS - Low energy ion
scattering spectroscopy and ToF-SIMS - Time of flight-secondary ions mass
spectroscopy) seem promising to facilitate investigation of the two faces of kaolinite
provided that the particles can be oriented and that the instrumentation is sufficiently
surface sensitive to collect signals from just the very first layer For example a recent
study attempted to use ToF-SIMS to study the talc surface [56] However these results
were averaged over a few layers of talc Johnston [57] examined the hydrogen bonding
for kaolinite particles using vibrational spectroscopy and concluded that the type and
strength of interlayer hydrogen bonds of the structural OH groups govern their size shape
and their surface chemistry In addition they also revealed an additional set of lsquodisorder-
indicatorrsquo bands of disordered kaolinite using FTIR spectroscopy Recently many
researchers have used scanning electron microscopy (SEM) [58 59] transmission
electron microscopy (TEM) [60] and atomic force microscopy (AFM) [59 61 62] as
imaging tools to characterize particle shape and morphology
18
The overall objective of this dissertation research is to investigate the physical
characteristics structure and surface chemistry features of kaolinite in order to further
Overall Objective
21
explain the electrokinetic behavior of kaolinite particles their interactions and the
rheology of their aqueous suspensions
19
Chapter 2 discusses the literature review of the physical and chemical properties
of kaolinite Different instrumentation techniques are discussed in order to characterize
these properties of kaolinite
Research Organization
Chapter 3 discusses the physical properties (shape and size) and chemical
composition of kaolinite This study focuses on the surface properties of a very high
purity kaolinite sample from St Austell area in Cornwall UK A pool of advanced
analytical techniques were utilized to investigate the morphological and surface
properties of kaolinite including Brunauer-Emmett-Teller (BET) surface area
measurements X-ray diffraction (XRD) X-ray fluorescence (XRF) scanning electron
microscopy (SEM) atomic force microscopy (AFM) Fourier-transform infrared
spectroscopy (FTIR) and ion scattering spectroscopy (ISS)
Chapter 4 discusses surface force measurements made by AFM using a silicon
nitride tip in order to interrogate the surface charge characteristics of the silica and the
alumina faces of 500 nm size kaolinite particles and their dependence on solution pH A
protocol for surface force measurements was developed To order kaolinite particles with
the silica face exposed a negatively charged glass-substrate was used so that the alumina
face of kaolinite was attracted to the glass-substrate In contrast to expose the alumina
face of kaolinite particles a positively charged fused alumina-substrate was used so that
the silica face attached to the fused alumina-substrate The surface force measurements
22
were analyzed using DLVO theory and on this basis the surface charge characteristics of
the silica and the alumina faces of kaolinite are established
Chapter 5 discusses the electrokinetic features of kaolinite particles as
investigated using electrophoresis potentiometric titration techniques (M-R titration and
acid-base titration) and surface force measurements The differences in the results
between electrophoresis and potentiometric titration are explained with the limitation of
the current electrokinetic theory for the anisotropic and platy nature of the kaolinite
particles
Chapter 6 discusses rheological measurements conducted to study particle
interactions in kaolinite suspensions and to further explain the anomalous behavior of
concentrated kaolinite suspensions showing maximum yield strength at pH 5-55 The
surface charge data of the silica face surface the alumina face surface and the edge
surface were used to describe particle interactions and the rheological behavior of
kaolinite suspensions The interactions between different faces of kaolinite particles ndash the
silica face surface the alumina face surface and the edge surface are considered and the
aggregation state of kaolinite particle suspensions is discussed
Chapter 7 discusses the identification of the silica face and alumina face of
kaolinite by atomic force microscopy The edge surface is examined by high resolution
transmission electron microscopy The basal plane surfaces and the edge surfaces of
kaolinite were further investigated using atomic force microscopy and high resolution
transmission electron microscopy respectively in order to verify whether the faces can
be distinguished from one another For example the mineral structure suggests that there
should be two types of surface faces defined by the 001 and the 001 basal planes In this
23
way one face should be described as a silica tetrahedral layer and the other face should
be described as an aluminum hydroxide (alumina) octahedral layer For confirmation the
crystal lattice structure of the silica face surface and the alumina face surface were
investigated using atomic force microscopy whereas the lattice fringe pattern of the
kaolinite edge faces was investigated using high resolution transmission electron
microscopy
Finally Chapter 8 discusses the milestones achieved in this dissertation and
suggests some new directions for future research on other clay minerals in general and
kaolinite in particular
CHAPTER 2
CHARACTERIZATION OF KAOLINITE PARTICLES
This chapter discusses a pool of advanced analytical techniques utilized to
investigate the morphological and surface chemistry features of kaolinite X-ray
fluorescence (XRF) spectrometry was used to determine the chemical composition of
kaolinite and thereby predict the structural formula as (Si394Al006)IV(Al399Fe001)VIO10
(OH)8Fe001Ca001Mg001K002Na0005 X-ray diffraction analysis (XRD) showed that
kaolinite was the dominant mineral phase with some minor impurities of quartz and
anatase Scanning electron microscopy (SEM) and atomic force microscopy (AFM)
confirmed the platy nature and hexagonal to subhedral shape of kaolinite The median
diameter and thickness of kaolinite was determined as 600 nm and 11 nm respectively
The surface chemistry features as revealed by Fourier transform infrared
spectroscopy (FTIR) determined the OH group vibrations of the kaolinite surface from
the inner OH group stretching vibrations at 3620 cm-1 and inner-surface OH group
vibrations at 3691 cm-1 3668 cm-1 and 3651 cm-1 Low energy ion scanning spectroscopy
(ISS) revealed an overlapping band of SiAl elements detected from the silica and
alumina faces of kaolinite These surface analytical techniques offer better understanding
of the surface chemistry and bonding details of kaolinite and other clay mineral surfaces
25
21
Kaolinite clays are extensively used in the paper ceramic paint plastic rubber
and cracking catalyst industries yet their surface properties are not completely
understood [1 63-68] A complete understanding of the surface chemistry features and
morphological properties of kaolinite crystallites is desired in order to better control its
properties in the above said applications and many new applications such as smart
materials and clay-polymer nanocomposites
Introduction
The chemical structure of kaolinite is Al2Si2O5(OH)4 which represents two-layer
silicates and are known to consist of a silica tetrahedral layer covalently bonded to
alumina octahedral layer through an apical oxygen atom as shown in Figure 21
Kaolinite is found as pseudo-hexagonal triclinic crystals These particles have a
maximum dimension less than 2 microm a thickness of 072 nm and a density of 26 gcm3
The lattice parameters of kaolinite are a = 0515 nm b = 0895 nm c = 0740 nm α =
9168deg β = 10487deg γ = 899deg [17]
The surface chemistry features particularly the charge properties of kaolinite
have been investigated by many researchers [14 23 26 34 35 41 50 69-71] However
the surface charge properties have been explained based on the commonly followed
assumption that the basal planes of kaolinite carry a permanent negative charge due to
isomorphous substitution of Al3+ for Si4+ in the silica tetrahedral and Mg2+ for Al3+ in the
alumina octahedral layer whereas the edge surface carries a positive or negative charge
depending on the pH of the system This assumption was only recently examined by
surface force measurements on the two faces of kaolinite using atomic force microscopy
[72]
26
Figure 21- Structure of kaolinite showing the relative spacing between the layers
72
AringOxygen
Hydroxyl
Silicon
Aluminum
27
It was demonstrated that the silica tetrahedral face of kaolinite is negatively
charged at pH gt 4 whereas the alumina octahedral face of kaolinite is positively charged
at pH lt 6 and negatively charged at pH gt 8
A few studies have reported the Fourier transform infrared (FTIR) spectra of
kaolinite [53-55 73] Recent development of advanced analytical techniques such as XPS
- X-ray photoelectron spectroscopy LEISS - Low energy ion scattering spectroscopy
and ToF-SIMS - Time of flight-secondary ions mass spectroscopy seem promising to
facilitate investigation of the basal plane surfaces of kaolinite provided the particles can
be oriented and that the instrumentation is sufficiently surface sensitive to collect signals
from just the very first surface layer For example a recent study attempted ToF-SIMS
analysis to study the talc surface [56] However these results were averaged over a few
layers at the talc surface
Cases et al [74] used low-temperature adsorption calorimetry shadowed
transmission electron microscopy adsorption isotherms of alkyldodecylammonium ions
and particle size distribution curves to obtain morphological information Recently many
researchers have used scanning electron microscopy (SEM) [58 59] transmission
electron microscopy (TEM) [60 75] and atomic force microscopy (AFM) [60 62 76] as
imaging tools to characterize particle shape and morphology However none of the
studies to the knowledge of the author have used a pool of surface analytical instruments
to characterize the surface chemistry features and the morphological properties of
kaolinite crystals
28
The objective of this chapter is to characterize the morphological and surface
chemistry features of the kaolinite surface through a pool of advanced analytical
techniques in order to better understand its surface properties
22
221
Materials and Methods
A clean English kaolin (Imerys Inc UK) was obtained from the St Austell area
in Cornwall UK The sample was cleaned with water only using elutriation to achieve
classification at a size of less than 2 microm No other chemical treatment was done Further
details about the kaolinite extraction and preparation are given in the literature [77] The
kaolinite was used as received in this research All liquid suspensions were prepared in
high purity Milli-Q water (Millipore Inc) The resistivity of the water was above 18 MΩ-
cm in all experiments
Sample Preparation
222
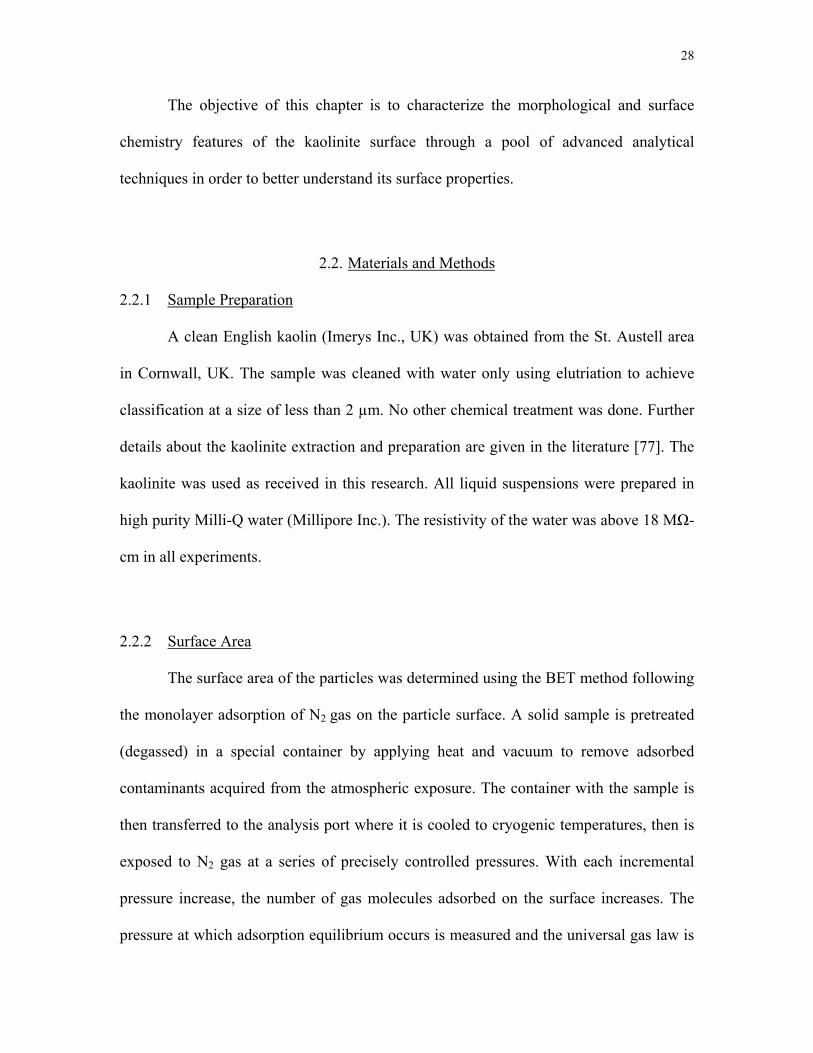
The surface area of the particles was determined using the BET method following
the monolayer adsorption of N2 gas on the particle surface A solid sample is pretreated
(degassed) in a special container by applying heat and vacuum to remove adsorbed
contaminants acquired from the atmospheric exposure The container with the sample is
then transferred to the analysis port where it is cooled to cryogenic temperatures then is
exposed to N2 gas at a series of precisely controlled pressures With each incremental
pressure increase the number of gas molecules adsorbed on the surface increases The
pressure at which adsorption equilibrium occurs is measured and the universal gas law is
Surface Area
29
applied to determine the quantity of the gas adsorbed and subsequently the sample
surface area
223
The kaolinite chemical composition was determined using X-ray fluorescence
(XRF) spectrometry The elemental composition was determined using energy dispersive
spectrometry (EDS) The kaolinite powder was sprayed on dual side sticky carbon tape
which in turn is glued to the standard metal stub for EDS analysis A brief introduction of
both techniques is presented in the following subsections
Chemical Composition
2231 Energy Dispersive Spectrometry (EDS)
When the electron beam strikes the sample X-rays are produced from interactions
of the beam with the sample The X-ray produced can be placed into two broad
categories white X-rays and characteristic X-rays When an electron beam is in-
elastically scattered by the nucleus the electrons lose energy resulting in the formation
of white X-rays These X-rays do not have energies characteristics of the sample
composition but instead have a variety of energies ranging up to that of the incident
beam However when the beam electron strikes an inner shell electron the primary
electron beam loses energy equivalent to the binding energies of the K L or M shells and
the electrons are ejected The difference in energy results in either the production of
characteristic X-rays or the ejection of the Auger electron Characteristic X-rays are
called such because the energy of the X-rays produced can be used to identify the
elements present in the sample
30
An X-ray spectrum is collected for an area of specimen using an energy
dispersive X-ray analyzer (EDS) or multiple X-ray goniometers These spectra can be
used to obtain an estimate of the chemical composition of the selected area The chemical
composition of the area impacted by the electron beam can be estimated using EDS by
viewing a graph with the energy of the X-rays produced on the x-axis and the number of
X-rays counted at that energy on the y-axis The regions appearing as peaks are the result
of characteristic X-rays production while the intensity in the regions between peaks in
the result of white X-rays In general the relative intensity of the EDS peaks is
proportional to the relative composition on the molar basis
2232 X-ray Fluorescence Spectroscopy (XRF)
X-ray fluorescence spectroscopy (XRF) is a method of elemental analysis which
assesses the presence and concentration of various elements in the powder sample by
measuring the characteristic secondary radiation emitted from a sample that has been
excited with an X-ray source A good review of XRF treatment could be found elsewhere
[78-83] and only a brief description is provided here
When a primary X-ray excitation source from an X-ray tube or a radioactive
source strikes a sample the X-ray can either be absorbed by the atom or scattered through
the material The process in which an X-ray is absorbed by the atom by transferring all of
its energy to an innermost electron is called the photoelectric effect During this
process if the primary X-ray had sufficient energy electrons are ejected from the inner
shells creating vacancies These vacancies present an unstable condition for the atom As
the atom returns to its stable condition electrons from the outer shells are transferred to
31
the inner shells and in the process give off a characteristic X-ray whose energy is the
difference between the two binding energies of the corresponding shells Because each
element has a unique set of energy levels each element produces X-rays at a unique set
of energies allowing one to nondestructively measure the elemental composition of a
sample The process of emissions of characteristic X-rays is called X-ray fluorescence or
XRF In most cases the innermost K and L shells are involved in XRF detection
The difference between EDS and XRF is the type of radiation hitting the sample
EDS uses an electron beam while XRF uses an X-ray beam Due to the small beam size
possible with electrons elemental analysis can be obtained for volumes as small as 1 microm
in diameter
224
X-ray diffraction (XRD) is a technique that provides detailed information about
the atomic structure of crystalline substances It is a powerful tool in the identification of
minerals in rocks and soils XRD has long been a mainstay in the identification of clay-
sized minerals in soils
Mineralogy
Many references are available which describe XRD principles in detail [84 85]
Other useful sources of information about XRD theory and interpretation applied
specifically to powder methods are also available [86-88] The following section provides
a brief introduction to some fundamental aspects of XRD
X-ray diffraction analysis uses monochromatic radiation Intense X-radiation at a
specific wavelength can be produced when electrons from a source (eg tube filament)
dislodge inner shell electrons from the atoms of a metal target Instantaneous replacement
32
of the dislodged electron by an electron from a specific energy shell results in the
quantum release of a packet of energy corresponding to a specific wavelength and termed
characteristic radiation The characteristic radiation used in XRD termed Kα is produced
by replacement of K shell electrons by L shell electrons
X-ray diffraction occurs when X-rays are scattered by atoms arranged in an
orderly array in crystals The atoms serve as scattering centers reemitting X-rays at the
same wavelength as the incident radiation in all directions (coherent scattering) [88] The
orderly arrangement of atoms results in the scattered X-rays within the crystal being (i) in
phase in specific directions dictated by symmetry and atomic spacing and (ii) out of
phase in all direction The X-rays that are in phase constructively interface and emerge as
intense beams (diffracted beams) from the crystal while those that are out of phase
destructively interface and hence have minimal emergence The systematic combination
of constructive and destructive interference arising from the periodicity of atoms in
crystals is X-ray diffraction
The diffractometer records the intensity of the diffracted beam electronically at
precise angles as the specimen is scanned over an angular range These intensity patterns
at specific angles are matched with the intensity of standard samples at precise angular
locations The mineralogical information from the sample is thus obtained
In this dissertation research the kaolinite powder was characterized for the
identification of different mineral phases using a Siemens D5000 X-ray powder
diffractometer (Bruker AXS Inc Madison WI USA) in the range of 100le 2θ le 1000
with Cu-Kα radiation monochromated with a curved-graphite monochromators placed
after the sample at 40 KV and 30 mAmps The kaolinite powder was packed in a
33
standard flat sample holder without any special treatment The step scan technique was
employed at an interval of 002008 seconds X-ray diffraction (XRD) data thus obtained
was analyzed using Diffrac Plus v 3 software (Bruker AXS Inc Madison WI USA)
225
The kaolinite particles shape and thickness was characterized using environmental
scanning electron microscopy (ESEM) and atomic force microscopy (AFM) The
description of SEM and AFM imaging procedures is discussed below
Kaolinite Particle Size and Thickness
2251 Scanning Electron Microscopy (SEM)
Scanning electron microscopy (SEM) has diverse uses for the study of clay
minerals The SEM has a large magnification range allowing examination of solids with
almost no magnification to imaging at well over 100000 times Another important
feature is the large depth of field of SEM images which have a three-dimensional
perspective In this way an SEM image provides much more information about a
specimenrsquos topography and surface structures than light microscopy at the same
magnification
The first prototype SEM was constructed by Knoll and von Ardenne in Germany
Following several refinements made by Zworykin as well as improvements made by
Mcullan and Oatley the first commercial SEM became available in 1963 The
environmental scanning electron microscope (ESEM) is a recent modification of the
traditional SEM The major difference between ESEM and traditional SEM is the much
higher specimen chamber pressures that are allowed in the ESEM A differential
34
pumping system allows pressures of several hundred Pa in the specimen chamber while
maintaining a pressure of 13 times 10-11 MPa near the electron gun The high vacuum near
the electron gun makes it possible to use high intensity filaments such as a LaB6 filament
and get a significant signal despite the higher pressure in the sample chamber
The SEM can be subdivided into a number of components such as the electron
optical system specimen stage secondary electron detector and vacuum system An
electron optical system is involved in the focusing and control of the electron beam A
specimen stage is needed so that the specimen may be inserted and situated relative to the
beam A secondary electron detector is used to collect the electrons and to generate a
signal that is processed and ultimately displayed on viewing and recording monitors A
vacuum system is necessary to remove air molecules that might impede the passage of
the high energy electrons down the column as well as to permit the low energy secondary
electrons to travel to the detector Greater details about SEM principles and operation are
available in the literature [89]
2252 Atomic Force Microscopy (AFM)
Atomic force microscopy (AFM) was invented in 1986 by Binnig et al [90] and
has since become an important instrument for high resolution imaging of the micro-to-
nano-morphology of surfaces a technique to probe fundamental intermolecular forces
between substances and a tool to manipulate atoms and molecules The technique is
particularly important to various aspects of soil science and biogeochemistry because it
allows for high resolution imaging of organic microbial and mineral surfaces and
35
characterization of surface chemical properties under environments relevant to extreme
conditions
The basic operating principles of AFM have been described previously in the
literature [90 91] and are reviewed in brief here For most commonly used AFMs a
sample is mounted atop a piezoelectric scanner composed of materials such as lead-
zirconium-titanite that permit movement with Angstrom-level precision (see Figure 22)
The sample is scanned continuously in two dimensions (x-y) beneath a force sensing
probe consisting of a tip that is attached to or part of a cantilever Z-direction (height)
movements are also made by the scanner as required to compensate for changes in
sample height or forces between the tip and the sample Attractive and repulsive forces
between the tip and the sample cause the cantilever to bend or defect This deflection can
be monitored in a number of ways Most commonly laser light reflects off the back of
the cantilever into a photodiode detector This so-called optical-lever detection system is
sensitive to Angstrom-level movements of the cantilever [92-94] For soil microbiologic
purposes some AFMs keep the sample stationary while the scanner rasters the cantilever
above it so that the AFM can be used concurrently with an inverted optical microscope
The most common mode of AFM imaging is the so-called contact mode Contact-
mode imaging can be conducted in air or immersed in a liquid such as an electrolyte
solution In contact-mode AFM the tip is brought directly into contact with the sample
surface which is scanned beneath it The tip-sample interaction is primarily repulsive in
nature (eg due to the short-range forces associated with the Pauli Exclusion Principle)
The interaction force can be as low as 10-9 N which is approximately the interaction
force between atoms in solids Once the tip is brought in contact with the sample surface
36
Figure 22- Schematic representation of AFM A mineral sample is positioned on a piezoelectric scanner which moves the sample in three-dimensions relative to the sensor (cantilever) The cantilever deflects due to attractive or repulsive forces between the tip and the sample Deflection of cantilever is monitored by a laser reflecting off the top and into a photodiode array
PiezoelectricScanner
Mineral
Photodiode
Laser
Sensor
37
the piezoelectric scanner drives the sample upward in the z-direction a predefined
distance This causes the cantilever deflect The predefined cantilever deflection is
present by the system software and is known as the ldquoset pointrdquo A feedback loop
maintains a constant set-point level throughout the imaging process When the tip goes
over a feature on the sample surface the computer feedback loop adjusts the z-piezo to
keep the cantilever deflection at the set-point value The imaging is conducted at a
constant force so that this mode of imaging is often called ldquoconstant forcerdquo imaging The
greater the cantilever deflection the higher the imaging force exerted by the tip on the
sample A three-dimensional AFM image is generated as the computer plots the
correction to the z-piezo as a function of x-y position throughout the scan
The kaolinite particles images were obtained with an FEI Quanta 600 FEG
environmental SEM (FEI Oregon USA) under low voltage of 5 KV to avoid charging A
drop of kaolinite suspension (1000 ppm) in Milli-Q water at pH 9 was placed on a freshly
cleaved mica sheet The mica sheet was heated on a hot plate to immediately dry the
suspension In this way the kaolinite particles were dispersed on the mica substrate and
separated by several microns [62] The mica sheet was then attached to a sample holder
using dual sided sticky tape for ESEM analysis The images were obtained as received
without any conductive coating After the images were captured 150 kaolinite particles
were analyzed using Image-J software for area distribution Only those particles which lie
flat on the substrate and which were not aggregated were analyzed A mask was created
on the particle following its profile and then the area was determined by the pixels area
fitted in that mask The particle diameters were determined from the ESEM images based
on the equivalent circular disc area
38
The kaolinite particle thickness and diameter (longest dimension) was also
determined using AFM A picoforce AFM with Nanoscope V controller (Veeco
Instruments Inc Santa Barbara CA) was used with a PF-type scanner designed for
picoforce measurements Triangular beam silicon nitride (Si3N4) cantilevers (Veeco
Instruments Inc Santa Barbara CA) having pyramid-shaped tips with spring constants
of about 012 Nm were used The kaolinite samples were prepared in a similar fashion
on mica substrate as for the ESEM study The topography (height) images were obtained
with the contact mode in air The images were analyzed using Nanoscope v 72 software
(Veeco Instruments Inc Santa Barbara CA) The section analysis feature of the software
was used to obtain the particle thickness and the longest dimension from the height
images
226
Surface properties of kaolinite play an important role in the adsorption
dissolution and precipitation of ions in the solution In recent years the development of
surface sensitive analytical techniques eg X-ray photoelectron spectroscopy (XPS) ion
scattering spectroscopy (ISS) auger electron spectroscopy (AES) secondary ion mass
spectroscopy (SIMS) Fourier transform infrared spectroscopy (FTIR) etc have allowed
direct probing of surface phenomenon Of these surface techniques XPS is widely used
to obtain elemental chemical state and semiquantitative compositional information from
clay such as kaolinite and other minerals ISS has recently gained significant attention to
obtain the elemental information from the very first atomic layer of crystalline minerals
Surface Spectroscopy of Kaolinite
39
XPS ISS and FTIR are used in this study for obtaining elemental information from the
kaolinite surface and will be discussed in the subsequent sections
2261 X-ray Photoelectron Spectroscopy (XPS)
X-ray photoelectron spectroscopy (XPS) technique is popular among soil- and
geo-chemists because it provides elemental chemical state and semiquantitative
compositional information XPS is particularly useful in the determination of surface
elemental composition [95-97] site occupancy [97] oxidation and reduction chemistry
[98] chemical weathering [99 100] Lewis and Brǿnsted acid sites [101] adsorption of
cations and anions chemical bonding and surface reactivity [102-104] and differentiation
of exchangeable and nonexchangeable clay components [97] These reviews discuss
elegant applications of XPS to geo- and soil-chemistry research The principles of XPS
are briefly reviewed below
When a solid material is bombarded by a photon the photonrsquos energy is
transmitted to an electron The electron can be ejected from the atom provided the photon
is of sufficient energy This process is called photoemission and is shown in Figure 23
When the excitation occurs sufficiently close to the surface the photoelectron can escape
from the material The photoelectron leaves the atom in an excited state which then must
lose the energy gained The excess energy can be lost through various de-excitation
processes including the ejection of a second electron called an Auger electron (see Figure
23) All elements have a unique set of core level electrons whose binding energies are
spread out over a thousand electron volts (eV) or more These are the electrons that are of
interest for XPS analysis By determining the binding energies of the photoelectrons the
40
Figure 23- Sketch showing production of photoelectrons and auger electrons induced by X-ray bombardment (1) Incident X-ray Photon (2) Absorption of X-ray photon by core electron (3) Ejection of core-level photoelectron (4) Relaxation of higher shell electron into hole (5) Internally recombined energy of relaxation and (6) Ejection of Auger electron
41
element of origin can be determined In fact small changes (a few eV) in the binding
energy reflect differences in the chemical state (such as oxidation state) of the atom of
origin and the number of photoelectrons produced reflects the quantity of the originating
atoms in the excitation region
The most commonly used X-ray lines for XPS analysis are the AlKα (14866 eV)
and the MgKα (12536 eV) These X-rays have sufficient energy to excite the core level
electrons and to penetrate deep into the bulk sample Once the photoelectron has escaped
from the surface without collision or energy loss it has certain kinetic energy (KE) that
can be related to the binding energy for the electron (EB) which is characteristic for the
electronic energy level of origin By measuring the kinetic energy of the photoelectron
its binding energy can be determined as
B SE hz KE φ= minus minus (2-1)
where hz is the energy of the incident X-ray photon and ΦSP is the work function of the
sample (the additional amount of energy required to move an electron from the Fermi
level to the vacuum level)
2262 Ion Scattering Spectroscopy (ISS)
In Ion Scattering Spectroscopy (ISS) a surface is bombarded with a beam of
noble gas ions and the energies of the ions scattered under a fixed scattering angle are
analyzed [105] The masses of the collision partners determined the energy of the
scattered ions As shown in Figure 24 a monoenergetic well-collimated beam of ions
42
Figure 24- Schematic diagram of ion scattering experiment
Ratemeter
X-Y Recorder
ElectrostaticAnalyzer
AnanlyzerVoltage Sweep
TargetCollimators Ion Beam
Φ Azimuthal Rotation
θL
Ψ
Scattered ions and neutrals
+L -
Amplifier
Preamp
43
with energy of 01-10 keV strikes the target surface and the energy distribution of ions
scattered off at some particular angle is measured The energy spectrum obtained
provides information on the mass or chemical identity and the number of surface atoms
through the energy position and magnitude respectively of peaks in the spectrum
These various kinds of information are obtained with varying degrees of accuracy and
effort Mass identification is quite straightforward peaks for higher masses occur at
higher energy in a predictable manner Quantitative determination of the number of
surface atoms is not so simple since the scattered ion yield depends on scattering cross-
sections and neutralization efficiencies neither of which are very well known at present
[105] However quantitative analysis of foreign atoms at a surface can be achieved by
calibration of the system against standards Structure information for example about
atom locations and defects is derived from ldquoshadowingrdquo effects and multiple scattering
An outstanding feature of low-energy ion scattering is its fine degree of surface
selectivity the detected ions have scattered from only the first layer or two of atoms at
the surface
Low energy ion scattering spectroscopy (LEIS) (Kratos Analytical Inc New
York USA) in conjunction with an X-ray photoelectron spectroscopy (XPS) Kratos
AxisUltraDLD (Kratos Analytical Inc New York USA) was used to investigate the
silica tetrahedral face and alumina octahedral face of kaolinite LEIS involves directing a
stream of charged particles known as ions (4He+) on a surface and making observations of
the positions velocities and energies of the ions that have interacted with the surface The
data thus collected could be used to deduce information about the material such as the
relative positions of the atoms in a surface lattice and the elemental identity of those
44
atoms LEIS spectrum of the silica face and alumina face of kaolinite particles was
obtained with 4He+ at 1000 Volts XPS involves probing the sample surface with Al-Kα
photon energy source The X-ray photon interacts with the sample surface and ejects the
photoelectron from the top few surface layers The energy of the photoelectrons leaving
the sample was determined using a concentric hemispherical analyzer and this gives a
spectrum with a series of photoelectron peaks The binding energy of the peak areas are
analyzed to determine the surface composition
2263 Chemical Bonding ndash FTIR Spectroscopy
Fourier transform infrared spectroscopy (FTIR) is a technique used to obtain an
infrared spectrum of absorption emission photoconductivity or Raman scattering and
chemical bonding information of a solid liquid or gas [106] Infrared radiation covers the
segment of the electromagnetic spectrum that lies between the visible light (about 08
μm) and microwave radiation (about 1000 μm)
There are several techniques available for infrared spectroscopic investigations
such as diffuse reflectance internal reflectance and attenuated total reflectance methods
etc bulk properties can be studied as well as the properties of surfaces and with the use
of infrared microscopy even spectra of microscopic objects or details thereof can be
recorded [106-111]
Infrared radiation can be described as electromagnetic wave of the length λ the
frequency ν or as commonly called within the infrared spectroscopy as the wavenumber
ν These quantities are related as follows
45
1cνν
λ= = (2-2)
where c is the velocity of light in a vacuum The energy of infrared electromagnetic
waves is directly proportional to the frequency (or wavenumber) as
hcE h hcν νλ
= = = (2-3)
where h is Planckrsquos constant Most applications of vibrational spectroscopy are in the
mid-IR spectral range (400-4000 cm-1) however soil related applications in the far-IR
(10-400 cm-1) and near-IR (4000-10000 cm-1) regions are being reported more frequently
Molecular vibrations occur at discrete energies in the IR region of the
electromagnetic spectrum and are referred to as vibrational modes or as normal modes of
vibration These modes can be divided into two categories internal vibration modes and
phonon modes Internal vibrational modes correspond to the periodic motion of atoms
within a crystal or molecule They are described by three types of motion
i Bond stretching
ii Bending
iii Torsional motions
Internal vibrational modes are usually found in the 400 to 4000 cm-1 range
Crystalline materials also have vibrational transitions in the 10 to 400 cm-1 region termed
phonon modes resulting from the movement of one unit-cell or functional unit relative to
another
46
Fourier transforms infrared spectroscopy (FTIR) (Varian Inc Palo Alto CA
USA) was used to investigate the surface hydroxyl group on the alumina face and the
inner-hydroxyl group between the silica tetrahedral sheet and alumina octahedral sheet of
the kaolinite bilayer The silica tetrahedral layer of kaolinite is composed of a hexagonal
ring network of oxygen atoms on the 001 basal plane whereas the alumina octahedral
layer consist of a hexagonal ring network of hydroxyl atoms (OH) on the 001 basal plane
These hydroxyl atoms on the alumina octahedral face will be termed as inner surface
hydroxyl atoms which are hydrogen-bonded with the basal plane of oxygen atoms of the
next layer Other OH groups are located inside the bilayer between the dioctahedral
alumina sheet and tetrahedral silica sheet pointing horizontally toward the center of the
ditrigonal cavity These OH groups will be called the inner hydroxyl group
A similar technique as demonstrated by Gupta and Miller [72] was followed
[72]to order kaolinite particles exposing the silica tetrahedral face and alumina octahedral
face of kaolinite on a glass substrate and a fused alumina substrate respectively Briefly
20 microl of kaolinite suspension (5) at pH 50 prepared in high purity Milli-Q water
(Millipore Inc) was air-dried overnight on two cleaned glass substrates (SC1 cleaned) in
a petri-dish cover In order to achieve good coverage of kaolinite particles on the glass
substrate kaolinite suspension was redeposited two times (20 microl each times) on the
previously deposited kaolinite particles on the glass substrate In this way a very good
film of kaolinite particles was obtained on the glass substrate (visual observation) AFM
imaging conducted on one such ordered kaolinite particle substrate showed a root-mean-
square roughness of about 5 nm It should be expected that the kaolinite particles
deposited on the glass substrate should expose their silica face In the second experiment
47
a suspension of the kaolinite particles (5 by weight at pH 50) was deposited on two
cleaned fused alumina substrates (Piranha cleaned) The details of alumina substrate
cleaning are described elsewhere [112] It should be expected that the kaolinite particles
deposited on the fused alumina substrate should expose their alumina face
23
231
Results and Discussion
Kaolinite was determined as the primary mineral in the powder sample using
XRD (see
Mineralogy and Elemental Analysis
Figure 25) Other minerals present in minor amounts are quartz and anatase
The main intensity peak showed c-spacing of 715 Aring which is indicative of the 001 basal
plane of kaolinite A small peak at 2θ of 2550 with c-spacing of 349 Aring is indicative of
anatase mineral
As expected the elemental analysis of the kaolinite particles using EDS showed
that silicon aluminum and oxygen are the main elements of the crystal structure whereas
potassium calcium and iron are present as interlayer cations (see Figure 26) The ratio of
silicon to aluminum is nearly 1 which matches well with the theoretical ratio of silicon to
aluminum (see Table 21) The carbon peak in the EDS spectra originates from the
background carbon tape
232
The chemical composition of kaolinite as determined using XRF is shown in
Structural Formula
Table 21 As shown the experimental and theoretical compositions are in reasonable
48
Figure 25- XRD spectra of kaolinite showing the mineralogy of kaolinite
49
Figure 26- EDS spectra of kaolinite showing the elemental composition of kaolinite
05 10 15 20 25 30 35
50
Table 21- Chemical composition of kaolinite
Elemental Weight () Oxides Experimental Theoretical SiO2 4700 4630 Al2O3 4100 3980 Fe2O3 026
TiO2 014 CaO 006 MgO 008 K2O 018 Na2O 003 H2O 1160 1390
10035
51
agreement The kaolinite also contains minor amounts of Fe Ca Mg K and Na in its
crystal structure as well as small inclusions of TiO2 [113] The water is present as
structural water [113]
Utilizing the chemical composition of kaolinite the structural formula of kaolinite
was calculated based on the ideal hydroxyl composition and a total of 28 negative
charges in the crystal structure [113] as shown in Table 22 It is restated here that the
water is present as structural water whereas TiO2 is present as impurities This amount
should be deducted from the total amount as shown in column 3 of Table 22 The
structural formula of the kaolinite is then given as
(Si394Al006)IV(Al399Fe001)VIO10(OH)8Fe001Ca001Mg001K002Na0005
Only 006 equivalents of the aluminum from the octahedral layer contribute to the
isomorphic substitution of Si4+ for Al3+ in the silica tetrahedral layer This is in excellent
agreement for kaolinite from Nigata Japan which also showed 006 equivalents of
substitution of Si4+ for Al3+ in the silica tetrahedral layer [17] The kaolinite from
Georgia USA also showed good agreement which showed 005 equivalents of
substitution of Si4+ by Al3+ in the silica tetrahedral layer [113] The deficiency of charge
in the alumina octahedral layer was neutralized using Fe2+Fe3+ ions All other ions such
as Fe Ca Mg K and Na exist as interlayer cations in between kaolinite layers
This minor amount of substitution of Si4+ for Al3+ also corresponds well with the
experimental cation exchange capacity (CEC) which showed a low CEC of well ordered
kaolinite from Pittong ranges (Victoria Australia) from 0028 to 0050 molkg whereas
52
Table 22- Charge calculation of kaolinite based on a total of 28 negative charge in the crystal structure
Column 3 ndash Normalize the elemental oxide composition of the kaolinite to 100 after deduction the TiO2 and H2O amount
Column 7 ndash Divide the percentage concentration of each oxide by its molecular weight and multiply by the total number of metal atoms and the normal
charge of the metal in the oxide to obtain the charge equivalent Column 8 ndash Calculate the proportionality factor (R) by dividing the number
of assumed fixed negative charges in the structure of the mineral with the sum of charge equivalents
Column 9 ndash Calculate the occupancy of atoms per unit cell by multiplying each charge equivalent with the proportionality factor (R) and dividing
by the valency of the cation
Elemental Weight Normalized Molecular No of Cations Cation Charge Proportionality Atoms perOxides Wt Wt in Oxide Valence equivalents Factor R Unit Cell
SiO2 47 5304 6009 1 4 35308 44608 394Al2O3 41 4627 10196 2 3 27228 44608 405Fe2O3 026 029 1597 2 3 00110 44608 002TiO2 014CaO 006 007 5608 1 2 00024 44608 001MgO 008 009 4031 1 2 00045 44608 001K2O 018 020 942 2 1 00043 44608 002
Na2O 003 003 6198 2 1 00011 44608 0005H2O 116
10035 10000 62770
53
the CEC of poorly ordered kaolinite of secondary origin from Swan Bay ranges (New
South Wales Australia) from 016 to 034 molkg [114]
BET specific surface area of kaolinite was determined as 88 m2g using N2 gas
adsorption isotherm Cases et al [74] obtained similar results for the specific surface area
of kaolinites from St Austell Cornwall UK and Georgia as 114 and 109 m2g
respectively Huertas et al [37] also reported a similar specific surface area of 816 m2g
for well crystallized Georgia kaolinite
233
The SEM and AFM image of kaolinite particles on a mica substrate are shown in
Shape Size and Aspect Ratio
Figure 27 confirming the pseudo-hexagonal shaped plate like particles The size
distribution of the kaolinite particles as obtained from SEM image analysis is shown in
Figure 28 The aspect ratio (diameter to thickness ratio) obtained from AFM image
analysis is also shown in Figure 28 The circular diameter of the kaolinite particles lies
between 003 and 354 microm Only 35 (by number) of the particles are greater than 10
microm The median diameter of the kaolinite particles was determined to be 600 nm This is
in good agreement from both SEM and AFM image analysis for at least 150 particles
The kaolinite particles thickness varied from 175ndash215 nm as determined from the AFM
image analysis The median thickness of the particle population was determined to be
112 nm Each bilayer of kaolinite particles is about 072 nm and therefore it is estimated
that the average kaolinite particle consist of 15 bilayers The aspect ratio of the kaolinite
particles varied from 9ndash165 with median value of 45
54
Figure 27- (A) SEM (B) AFM images of kaolinite particles showing the pseudo-hexagonal shaped plate-like particles
A
B
I 00 2 Height
I 50 11m
55
Figure 28- (a) Size distribution and (b) aspect ratio of St Austell Cornwall kaolinite particles using equivalent circle diameter based on SEM and AFM image analysis
0
5
10
15
20
25
30
35
40
Freq
uenc
y
Circular Diameter microm
(A) Size Distribution
0
20
40
60
80
100
120
140
160
180
00 05 10 15 20 25 30
Aspe
ct R
atio
Particle Maximum Length microm
(B) Aspect Ratio
56
In contrast to these results Zbik and Smart [61] determined median aspect ratio
for Georgia kaolinite of 34 and 53 using SEM and AFM techniques respectively For a
kaolinite from North Queensland the median aspect ratio was determined as 39 and 68
using SEM and AFM techniques respectively [61] It should be noted that the Georgia
kaolinite is found in naturally thicker booklets and therefore a lower aspect ratio when
compared to the Cornwall kaolinite used in this dissertation research
234
Figure 29
Surface Spectroscopy of Kaolinite
shows the ISS spectra of the silica face and alumina face of kaolinite
The ISS spectra showed a sharp peak for oxygen a broad peak for silicon and aluminum
a small peak for potassium and a copper peak The copper peak originates from the
background copper strip used to attach the sample It should be noted that due to poor
signal-to-noise ratio the spot size of the ions on the substrate was increased Therefore
some signal was collected from the background copper strip
The broad peak consists of both aluminum and silicon elements as the broad peak
coincided with the calculated silicon and aluminum atomic peak positions at kinetic
energies of 578 eV and 597 eV respectively These peak positions are close to each other
due to the similar mass of silicon atoms (2808 amu) and the aluminum atoms (2698
amu) A deconvolution algorithm was applied to separate the two peaks at kinetic
energies of 578 eV and 597 eV representing the aluminum and silicon elements
respectively The area under the two peaks was integrated following Gaussian
distribution and the ratio of areas representing aluminum and silicon peaks are plotted as
function of time as shown in Figure 210
57
Figure 29- ISS spectra on (a) silica face and (b) alumina face of kaolinite particles for various bombarding times
0
200
400
600
800
1000
1200
1400
1600
1800
2000
200 400 600 800 1000
Inte
nsity
cps
Kinetic Energy eV
(a) ISS on Silica face of Kaolinite
0 min1 min6 min27 min
O
Si Al
K Cu
0
1000
2000
3000
4000
5000
6000
7000
200 300 400 500 600 700 800 900 1000
Inte
nsity
cps
Kinetic Energy eV
(b) ISS on Alumina face of Kaolinite
0 min1 min5 min21 min
O
K Cu
Si Al
58
Figure 210- Ratio of aluminum to silicon peak areas from both silica and alumina face of kaolinite as a function of bombarding time
02
04
06
08
10
12
14
0 5 10 15 20 25
Rat
io o
f Al(5
78)S
i(597
)
Time min
Silica face of Kaolinite
Alumina Face of Kaolinite
59
It is expected that the ratio of aluminum to silicon should increase with
bombarding of ions with time on the silica face and decrease on the alumina face of
kaolinite This may be due to the removal of silicon and aluminum atoms from the silica
face and the alumina face of kaolinite respectively by the continuous bombarding of ISS
beam (4He+ ions) on the respective faces of kaolinite In contrast to our expectations the
ratio of AlSi decreased on the silica face and increased on the alumina face of kaolinite
with time as shown in the Figure 210 The reason for such behavior of decreasing the
aluminum to silicon ratio from the silica face and increasing the aluminum to silicon ratio
from the alumina face is not clear although some concerns were raised whether the peak
positions for the silicon and aluminum atoms were correctly estimated The issue of
silicon and aluminum atoms peak position could not be resolved at this moment and
further study is warranted in order to identify the silica face and alumina face of kaolinite
using LEIS
The FTIR spectra obtained from the silica face and alumina face of kaolinite are
shown in Figure 211 The OH-vibration peaks were identified on both the silica face and
alumina face of kaolinite The band observed at 3620 cm-1 corresponds to inner OH
stretching vibrations as shown in Figure 211 The band observed at 3691 cm-1
corresponds to the in-phase motion of the three inner-surface OH group whereas the
band at 3668 cm-1 and 3651 cm-1 correspond to the out-of-phase motion of the inner-
surface OH groups These results are in excellent agreement with the band positions of
inner-surface OH groups and inner OH groups published in the literature [53-55 73
115] Interestingly FTIR spectra for the silica face showed greater surface sensitivity
(inner OH and inner-surface OH peaks are sharper and longer) when compared to the
60
Figure 211- The experimental infra red spectrum of kaolinite obtained from (a) silica face and (b) alumina face
1
11
12
13
14
15
16
17
18
19
2
21
22
3500 3550 3600 3650 3700 3750 3800
Abs
orba
nce
au
Wavenumber cm-1
(a) Silica Face of Kaolinite
1
11
12
13
14
15
16
17
18
19
2
21
22
3500 3550 3600 3650 3700 3750 3800
Abs
orba
nce
au
Wavenumber cm-1
(b) Alumina Face of Kaolinite
61
alumina face of kaolinite This high surface sensitivity from the silica face of kaolinite
was not reported before and should be further investigated with highly surface sensitive
techniques such as vibrational frequency spectrometry
FTIR was compromised by greater penetration depth (~ 100 nm) and signals
were collected from both the silica and alumina faces of kaolinite particles However it
would have been ideal to gather information from the first layer of the surface only
Recently Burdukova [56] used time-of-flight secondary ions mass spectroscopy
(ToF SIMS) to analyze the talc surface However these results were averaged over a few
trilayers of the talc surface The advancement of surface analysis technique seems
promising to gather information about the kaolinite faces as well as other clay surfaces
Further research is warranted to improve our understanding and establish the surface
chemistry features of clay surfaces particularly kaolinite
24
A pool of advanced analytical instruments such as BET XRF XRD EDS SEM
AFM LEIS and FTIR was used for kaolinite particle characterization The surface area
of the particles was estimated using BET whereas XRD and EDS were used to identify
the mineralogy and elemental composition of kaolinite Based on the elemental
composition the structural formula of kaolinite was determined Only 005 equivalents of
aluminum from the octahedral layer contributed to the silica tetrahedral layer SEM and
AFM confirmed the pseudo-hexagonal shape of the platy shaped kaolinite particles The
mean diameter and thickness of kaolinite were determined as 600 nm and 112 nm LEIS
and FTIR was used to obtain the spectra from the silica and alumina faces of kaolinite in
Summary
62
order to distinguish them from each other The ISS spectra showed a combined broad
peak for silicon and aluminum atoms which could not be resolved in the present analysis
and further research is warranted to better understand the surface properties of the
kaolinite faces
CHAPTER 3
SURFACE FORCE MEASUREMENTS AT THE BASAL
PLANES OF ORDERED KAOLINITE PARTICLES
An experimental procedure is presented to order kaolinite particles on substrates
for interrogation of the two basal plane surfaces by atomic force microscopy Surface
force measurements were performed between a silicon nitride tip and each of the two
kaolinite faces (silica tetrahedral face and alumina octahedral face) in 1 mM KCl solution
at pH 4 5 6 8 and 10 using atomic force microscopy The colloidal force measurements
reveal that the silica tetrahedral face of kaolinite is negatively charged at pH gt 4 whereas
the alumina octahedral face of kaolinite is positively charged at pH lt 6 and negatively
charged at pH gt 8 Such measurements have not been reported previously and the results
suggest that the iso-electric point of the silica tetrahedral face is at pH lt 4 and that the
iso-electric point of the alumina octahedral face lies between pH 6 and 8 These results
contradict the generally accepted view that basal plane surfaces of kaolinite carry a
permanent negative charge due to minor substitution of Al3+ for Si4+ in the silica
tetrahedral layer and suggest some surface charge dependency of the two faces with
respect to solution pH With this new information it may be possible to further explain
64
the electrokinetic behavior of kaolinite particles and their interactions in aqueous
suspensions
31
The interaction of kaolinite [Al2Si2O5(OH)4] particles is of particular importance
in widespread applications eg in ceramics in the manufacture of paper (as a coating
pigment and filler) in inks and paints (as an extender) and as an additive in the
production of rubber and polymers [53 63 116] Newer applications of kaolinite include
its use as a raw material in the production of fiberglass calcined kaolins cosmetics and
pharmaceuticals [116] Kaolinite naturally exists as micron-to-nanosized pseudo-
hexagonal platy-shaped thin particles The behavior of these nanosized kaolinite
particles in suspensions pastes and composite materials is controlled by surface
chemistry features Analysis of the surface chemistry features such as electrokinetic
phenomena is complicated by the anisotropic platy structure of the particles which
manifests itself in edge surfaces and face surfaces Even more so the mineral structure
suggests that there should be two types of surface faces defined by the 001 and the 001
basal planes In this way one face should be described as a silica tetrahedral layer and the
other face should be described as an aluminum hydroxide (alumina) octahedral layer as
shown in
Introduction
Figure 11
It is believed that the basal planes of kaolinite carry a permanent negative charge
due to isomorphous substitution of Al3+ for Si4+ in the silica tetrahedral and Mg2+ for
Al3+ in the alumina octahedral layer whereas the edge surface carries a positive or
negative charge depending on the pH of the system Therefore it is commonly assumed
65
that the basal planes do not show a surface charge dependency with varying pH
However this assumption has never been verified due to the difficulty in isolating the
two faces of kaolinite (silica tetrahedral and alumina octahedral faces) and the lack of
instrumentation to investigate the two faces when dealing with nanosized particles
Limited research has been reported on the experimental characterization of these
face surfaces if the faces can even be distinguished from one another for that matter [15]
Frequently the surface potential andor surface charge of the kaolinite particles as
measured by electrophoresis are reported in the literature [3 4 15 52 117] It is evident
however that the electrophoretic measurement does not take into consideration the
particle shape and the structural anisotropic characteristics In fact it is not exactly clear
what the measured electrophoretic mobility of kaolinite represents
A few studies have reported the averaged FTIR spectra of both faces of kaolinite
[53-55 115] Recent development of advanced analytical techniques (XPS - X-ray
photoelectron spectroscopy LEISS - Low energy ion scattering spectroscopy and ToF-
SIMS - Time of flight-secondary ions mass spectroscopy) seem promising to facilitate
investigation of the two faces of kaolinite provided the particles can be oriented and that
the instrumentation is sufficiently surface sensitive to collect signals from just the very
first layer of a face surface For example a recent study attempted ToF-SIMS analysis to
study the talc surface [56] However these results were averaged over a few layers of
talc Recently many researchers have used scanning electron microscopy (SEM) [58
59] transmission electron microscopy (TEM) [60 75] and atomic force microscopy
(AFM) [59 62 76] as imaging tools to characterize particle shape and morphology
66
It is now well established that AFM instrumentation can also be used to measure
surface forces between the cantilever probetip and a selected substrate In this regard an
experimental procedure has been developed to organize a set of well ordered nanosized
kaolinite particles for in-situ AFM surface force measurements following the approach
of Drelich et al [118] where they have preferentially deposited silica nanoparticles on an
alumina substrate and alumina nanoparticles on a silica substrate for AFM investigation
The significance of these AFM surface force measurements is that the electrokinetic
characteristics of the face surfaces of nanosized kaolinite particles can be described
following earlier research in which the cantilever probetip is used as a reference to
establish the electrokinetic features of a flat surface Such measurements have been
reported for alumina [119-122] and for fluorite [123]
The objective of this chapter is two folds (1) to describe an experimental
procedure to order kaolinite particles so that a selected face is exposed for in-situ
examination and (2) to characterize the two faces of kaolinite (the silica face and the
alumina face) by surface force measurements using AFM To order kaolinite particles
with the silica face exposed a negatively charged glass substrate is used so that the
alumina face might attach to the glass substrate as shown in Figure 31 In contrast to
expose the alumina face of the kaolinite particles a positively charged fused alumina
substrate is used so that the silica face will attach to the fused alumina substrate as
shown in Figure 31
67
Figure 31- Schematic representation for the organization and ordering of kaolinite particles
_ _ _ _ _ _ _ _ _ _ _ + + + + + + + + + + + +
Silica Face Exposed
Silica FaceAlumina Face
Alumina Face Exposed
Glass Fused Alumina
Silica Face
Alumina Face
_ _ _ _ _ _ _ _ _ _ _ + + + + + + + + + + + +
Silica Face Exposed
Silica FaceAlumina FaceSilica FaceAlumina Face
Alumina Face Exposed
GlassGlass Fused AluminaFused Alumina
Silica Face
Alumina Face
68
32
321
Materials and Methods
A clean English kaolin (Imerys Inc UK) was obtained from the St Austell area
in Cornwall UK The sample was cleaned with water only using elutriation to achieve
classification at a size of less than 2 microm No other chemical treatment was done Further
details about the kaolinite extraction and preparation are given in the literature [124] The
kaolinite was used as-received in this research The kaolinite suspension (1000 ppm) was
prepared in high purity Milli-Q water (Millipore Inc) The resistivity of the water was
above 18 MΩ-cm in all experiments Potassium chloride (1 mM solution) was used as
background electrolyte for surface force measurements The pH was adjusted to its
desired value using 01 M HCl or 01 M KOH solutions All chemicals used were of ACS
grade
Sample Preparation
XRD analysis conducted on the kaolinite sample confirmed that the kaolinite is
the dominant mineral phase EDAX analysis of the kaolinite sample showed nearly 11
atomic distribution of aluminum (798) and silicon (795) with trace amounts of
potassium (035) calcium (008) and iron (015)
322
Two substrates ndash a microscopic glass slide (Fisher Scientific Inc) and a fused
alumina substrate (Red Optronics Mountain View CA) were used to order the kaolinite
particles Two cut pieces of microscopic glass slide (10 x 10 x 05 mm) were cleaned
following SC1 procedure [125] Briefly the glass piece was cleaned in 511 mix of
H2ONH4OHH2O2 solution at 80oC for 20 minutes followed by rinsing with a copious
Substrate Preparation
69
amount of high purity Milli-Q water and dried with ultra high purity N2 gas On one
glass substrate a drop of kaolinite suspension at pH of 750 was air-dried overnight in a
petri-dish cover A second glass substrate was prepared in the same way without kaolinite
and used as reference (referred to as Glass-Substrate) for surface force measurements
Two fused alumina substrates were prepared by cleaning in 10 micro-90 solution at
850C for 3 hours followed by rinsing with a copious amount of high purity Milli-Q
water The alumina substrates were sonicated in 1 NaOH solution for 10 minutes to
remove excess surfactant rinsed with a copious amount of Milli-Q water and finally
blown dry with ultra high purity N2 gas A few drops of kaolinite suspension (1000 ppm)
at pH of 5 were air-dried overnight on the one alumina substrate in a petri dish cover
whereas the second alumina substrate was used as reference (referred to as Fused
Alumina-Substrate) for the surface force measurements All substrates were attached to a
standard sample puck for the surface force measurement using double-sided tape The
Fused Alumina-Substrate was cleaned in ultra-violet light cleaner (Bioforce Nanoscience
Inc IA) for 10 minutes just before surface force measurements Kaolinite particles
attached to glass and alumina substrates were each sonicated for 1 minute in Milli-Q
water to remove loosely adhered kaolinite particles washed with Mill-Q water and
gently blown with N2 gas before AFM surface force measurements
323
A picoforce AFM with Nanoscope V controller (Veeco Instruments Inc Santa
Barbara CA) was used with a PF-type scanner designed for picoforce measurements
Triangular beam silicon nitride (Si3N4) cantilevers (Veeco Instruments Inc Santa
Atomic Force Microscopy
70
Barbara CA) having pyramid-shaped tips with spring constants of about 015 Nm were
used The spring constant was determined using the thermal tuning method provided in
Nanoscope v 720 software The spring constants were determined after all the force
measurements were made Prior to force measurements the tip curvature and the conical
angle of the pyramid-shaped tip (Figure 32) were determined from the images captured
with a field emission scanning electron microscope (FEI Hillsboro Oregon) SEM
images were taken after the cantilever was glued with a carbon tape on the tilted
specimen stage to capture the side view of the top-portion of the tip as shown in Figure
32 The tip apex curvature was determined by fitting two circles to the curvature of the
tip The radii of the two circles were determined and an average value of the two radii
representing the tip curvature was calculated
The force measurements were made in 1 mM KCl solution at pH 4 5 6 8 and 10
using the picoforce AFM equipped with a fluid cell First an image of the substrate with
or without particles was obtained and then using the point and shoot feature of the
Nanoscope software the surface forces of particles and substrates were measured The
contact mode of operation was used to obtain images of the surface The raw data
(deflection in volts versus distance in nanometers) were then corrected for the baseline
(zero force ie when the silicon nitride tip is far away from the substrate) and constant
compliance to convert into force versus separation distance curves [126] At least 50
force measurements were made on glass and alumina substrates at 10 random locations
with 5 repetitions at any given location More than 75 surface force measurements were
made on 15 different kaolinite particles attached to each glass and alumina substrates
The force measurements were made on kaolinite particles which are at least 2-3 times
71
Figure 32- SEM images of silicon nitride tip (A) oblique view at low magnification (B) plan view of pyramidal tip at high magnification (indicated by arrow)
90-150 nm
1 μm1 μm1 μm
B
730
A
Silicon Nitride Tip
50 μm
72
larger than the cantilever tip to minimize the influence of the substrate All the force
measurements were performed at a scan rate of 1 Hz and captured at a resolution of 512
pointsmeasurement Approach force curves (when the cantilever is approaching the
substrate or the particles) were analyzed to determine the colloidal interaction forces
between the silicon nitride tip and the substrate Maximum repulsive forces were
recorded just before the silicon nitride tip jumps-in contact to the substrate The
interaction range between the silicon nitride tip and the substrate were determined when
the repulsive or attractive forces (from their maximum value) were within the 10 of the
zero force Zero force was determined from the average of 100 force data points when the
cantilever is far from the substrate
324
The cantilevers used for the surface force measurements have pyramidal shaped
silicon nitride tips The shape of the tips can be reasonably approximated as conical with
a spherical cap at its apex (see
DLVO (Derjaguin-Landau-Verwey-Overbeek) Model
Figure 33) DLVO theory accounts for electrostatic and
van der Walls (vdW) forces that may be of significance between the silicon nitride tip
and the substrate or kaolinite particle faces The derivation of DLVO theory for a
pyramidal-shaped tip and a flat substrate is given in the literature [127] and only the final
equations are listed below
DLVO Electrostatic vdWF F F= + (3-1)
73
Figure 33- Diagram showing the conical end portion of the silicon nitride tip with a spherical cap Angles α and β are the geometrical angle of the spherical cap at the tip apex and conical tip respectively with α + β = 900 D is the separation distance from the tip end to the substrate L is the distance between a differential surface section of the tip and the substrate r is the radius of the tip at a given vertical position R is the radius of the spherical cap at the tip apex
R
D
L
r
αβ
Substrate
Tip
R
D
L
r
αβ
R
D
L
r
αβ
Substrate
Tip
74
van der Waals force
12 21
2 21 1
( ) 26
10 ( sin tan ) (1 cos )3 tan
vdW R D LA R DFL D
A R D RL L
α α αα
+ minus minus= minus minus
minus minus minus
+
(3-2)
Electrostatic force (constant surface potential case)
( ) ( )( )1 1
1 1
22 2 20 0 1 0 2 3
2 220
1 2
4 2
( )4tan 2
T S
T S
L LElectrostatic D DT S
L LT S
F a e a e a e a e
b e b e
κ κκ κ
κ κ
πε εψ ψ πε ε ψ ψ
ψ ψπε εκ ψ ψα
minus minusminus minus
minus minus
= minus minus + minus
++ minus
(3-3)
where
1 1(1 cos ) 1 1sintan tan
D Rb R Lααα α κ
+ minus = minus + + (3-4)
2 1(1 cos ) 1 1sintan tan 2
D Rb R Lααα α κ
+ minus = minus + + (3-5)
( )1 0 1 2 0 3 1 1ndash ndash1 ndash1 05 05L D R cos a R a R cos a a a aα κ κ α= + = = = + = + (3-6)
α and β are the geometrical angles of the spherical cap at the tip apex and the
conical tip respectively with α + β = 900 D is the separation distance from the tip end to
the substrate L is the distance between a differential surface section of the tip and the
75
substrate r is the radius of the tip at a given vertical position R is the radius of the
spherical cap at the tip apex ε is the dielectric constant of the solution in this system ε0 is
the permittivity of a vacuum κ-1 is the Debye length ψ is the surface potential A is
combined Hamaker constant of the tip-solution-substrate system and subscripts S and T
refer to substrate and tip respectively
With these equations (equations (3-2) and (3-3)) the DLVO model (constant
potential) was fitted to the experimental force curves obtained between a silicon nitride
tip and the substrates (the Glass-Substrate and the Fused Alumina-Substrate) or the two
faces of kaolinite particles (the silica tetrahedral face and the alumina octahedral face)
When AFM force data are analyzed DLVO theory requires the input of two diffuse layer
potentials ψsurface and ψsilicon nitride tip On the basis of the assumption that the measured ζ-
potentials are good approximations for these diffuse layer potentials in low electrolyte
conditions we can use them as a guide in theoretical fitting of the experimental force
data Experimental force profiles at each pH can be fitted by fixing ψsilicon nitride tip at ζ-
silicon nitride tip and adjust ψsurface until theoretical and experimental force profiles
overlap The surface potential of the silicon nitride tip at varying pH was taken from the
literature [128]
The surface potential of the substrates or each of the two faces of kaolinite was
estimated by matching the DLVO model to the experimental force curves The
parameters used for the DLVO model are R = 120 nm β = 3650 Asilicon-nitride = 162 x 10-
19 J [128] AKaolinite = 680 x 10-20 J [129] Aalumina = 152 x 10-19 J Aglass = 650 x 10-20 J
and Awater = 370 x 10-20 J [130] The surface potential was then converted to surface
charge density (σ) using the Grahame equation as follows
76
0 08 sinh2B
B
ec k Tk Tψσ ε ε
=
(3-7)
where c0 is the bulk ion-number concentration of the salt kB is the Boltzmann constant e
is the electronic charge and T is the absolute temperature
33
331
Results and Discussion
AFM images of the glass and fused alumina substrates are shown in
Interaction Forces at Reference Substrates
Figure 34
The root-mean-square surface roughness values for the glass and fused alumina
substrates were determined as 037 nm and 034 nm respectively The interaction forces
between the silicon nitride tip and the glass and the fused alumina substrates are shown in
Figure 35 The iso-electric point (pH at which the surface carries zero net electric
charge) of the silicon nitride tip as determined from the interaction between a silicon
nitride tip and a silicon nitride wafer was taken as pH 4 [128] Therefore silicon nitride is
expected to be negatively charged at pH gt 4 However a few studies have reported an
iso-electric point of silicon nitride in between pH 5-7 depending on the treatment of the
surface [131-133]
Five force curves are shown for each pH value of interest to establish the good
reproducibility between the experimental force curves (see Figure 35) A 10-20
variation in the magnitude of colloidal forces is commonly observed in AFM studies
[127] As expected repulsive interactions dominate between the silicon nitride tip and the
77
Figure 34- Topographic height images of Glass-Substrate (A1 and B1 above) and Fused Alumina-Substrate (A2 and B2) as obtained by AFM using a silicon nitride tip in contact mode The white cross-bars on the A1 and A2 images show the location where force measurements between the silicon nitride tip and the substrate were performed
4 6 8 10
22
46
810
00 nm30 nm
Fused Alumina-SubstrateGlass-SubstrateA2A1
B1 B210 μm
26 8
10
42
48
610
00 nm50 nm
010 μm0
78
Figure 35- Interaction forces measured between a silicon nitride tip and the Glass-Substrate (left) and the Fused Alumina-Substrate (right) in 1 mM KCl solution at increasing pH Five replicates (red-circle) of force curves at different locations on the substrate along with DLVO fit (black-line) are shown
Glass-Substrate Fused Alumina-Substrate
1 mM KCl 1 mM KClz ~
2
15
o 05 L1
i 1 pH 400
l __ _ -05L-~~1~~ __ ~~_-----
o
z j ~
2
15
o 05 L1
I I
j bull
- - pH 500
~--05L-L1~_~~_~~~-----J o
z ~
2
15
o 05 L1
z ~
o
2
15
o 05 L1
o
pH 600
pH 800
l - - - --05L-~_~~_~~_~~_
z ~
2
15
o 05 L1
o
1 t
pH 1000
~ - - - - -
2
15
05
o
2
15
05
o
2
15
05
o
2
15
05
o
2
15
05
o
bull i
pH 400
i()c= - --- - - -
pH 500
~ if -------
pH 600
I pH 800
~ ~ - ---_
pH 1000
I ~~--- ~~ ~~~ ~ --~
-05 -05~--_------------------ -10 0 10 20 30 40 50 60 70 -10 0 10 20 30 40 50 60 70
Separation Distance nm Separation Distance nm
79
Glass-Substrate at all pH gt 4 (see Figure 35 and Table 31) At least 50 force curves were
analyzed at any given pH of the system unless otherwise stated
The magnitude of repulsive forces (indicated by positive sign in forces) increased
by a factor of 5 (+024 to +122 nN) with increasing pH from 4 to 8 in good agreement
with the DLVO theory At pH 10 a slight reduction in the repulsive forces to +094 nN
was observed which may be related to the dissolution of glass at higher pH At distances
gt 2 nm the long-range electrostatic double layer repulsion dominates the interaction
between a silicon nitride tip and the Glass-Substrate which extend up to 20 to 30 nm with
increasing pH values At distances lt 2 nm the snap-in contact between the silicon nitride
tip and the Glass-Substrate was observed due to short-range van der Walls attraction The
van der Walls force being attractive and this dominant force causes the snap-in contact
between the silicon nitride tip and the Glass-Substrate At these distances electrostatic
repulsion is the dominant interaction compared to short-range interaction due to van der
Wall hydration and solvation forces which are negligible The interaction range between
a silicon nitride tip and the Glass-Substrate was nearly constant to 22-28 nm at all pH
values (Table 31) The colloidal interaction forces indicate that the iso-electric point of
the glass substrate is at a pH value lt 4 This is in good agreement with the iso-electric
point of pH 35 for glass as reported in the literature [134] Few researchers have also
determined the iso-electric point of silica surface using AFM surface force measurement
considering silica as the substrate or the probe attached to the cantilever Raiteri et al
[135] found the iso-electric point at pH 35 of SiO2 film (gt100 nm thick) as a substrate
from the surface force measurements under similar solution chemistry conditions
80
Table 31- Experimental interaction forces and the interaction range measured between silicon nitride tip and the substrates
Glass-Substrate Fused Alumina-Substrate pH Force Range Force Range nN nm nN nm 4 +0241 plusmn 0087 2230 plusmn 451 -0486 plusmn 0286 1181 plusmn 916 5 +0562 plusmn 0082 2808 plusmn 383 -0272 plusmn 0097 1749 plusmn 400 6 +0538 plusmn 0211 2709 plusmn 605 -0119 plusmn 0060 273 plusmn 108 8 +1226 plusmn 0347 2840 plusmn 558 +0303 plusmn 0057 2433 plusmn 394 10 +0943 plusmn 0195 2805 plusmn 386 +0281 plusmn 0036 1903 plusmn 371
Note that the average plusmn standard deviations were calculated from 50 experimental forces between a silicon nitride tip and the substrates at 10 different locations with 5 repetitions at any given location
Positive and negative sign in force indicate repulsion and attraction respectively
81
Sokolov et al [133] also determined the iso-electric point of silica at less than pH
40 from the surface force measurements between silica probe and polyurethane
substrate In contrast to the Glass-Substrate attractive interaction dominates between a
silicon nitride tip and the Fused Alumina-Substrate at pH lt 6 whereas repulsive
interactions were observed at pH 8 and 10 (see Figure 35 and Table 31) At pH lt 6 the
attractive forces (indicated by negative sign in forces) dominated by electrostatic
attraction between a silicon nitride tip and the Fused Alumina-Substrate decreased by a
factor of 4 (-049 nN to -012 nN) with increasing pH from 4 to 6 whereas electrostatic
repulsive forces of the order of 030 nN were observed at pH 8 and 10 Again a good fit
between experimental force curves and DLVO theory was observed at all pH values
There is no significant dependence on interaction range with pH observed (Table 31)
though short range attractive interaction was observed at pH 6 The force curves indicate
that the isoelectric-point of Fused Alumina-Substrate is between pH 6 and 8 in good
agreement with the isoelectric point of alumina at pH 7 to 9 as reported in the literature
[112 134] Similar to our finding Veeramasuneni et al [119] and Yalamanchili et al
[121] also observed such similar trends in surface force measurements between the silica
probe and the α-alumina substrate ie attractive interaction at pH 55 64 and 86 and
repulsive interaction at pH 102 and 108 in de-ionized water adjusted to different pH
values However they observed over one order of magnitude larger surface forces
between the silica probe and the α-alumina substrate which could be related to
differences in the probe size and composition (48 microm silica probe used in their work vs
120 nm silicon nitride tip used in this work) In research reported by Hupka [112] the
repulsive force between a silica sphere and a flat surface was found to increase by a
82
factor of about 5 when the silica sphere colloidal probe diameter was increased from 1
microm to 20 microm
332
The two faces of kaolinite are the silica face (001 basal plane) and the alumina
face (001 basal plane) as discussed in the introduction Therefore it is expected that the
001 face of kaolinite will behave like the Glass-Substrate and will be negatively charged
at pH gt 40 Also it is expected that the 001 face of kaolinite will behave like the Fused
Alumina-Substrate and will be positively charged at pH lt 60 and negatively charged at
pH 80 and 100 In this way kaolinite particles which attach to the glass substrate will
expose the 001 face (silica tetrahedral layer) and the kaolinite particles which attach to
the fused alumina substrate will expose the 001 face (alumina octahedral layer) to the
silicon nitride tip (see
Interaction Forces at Kaolinite Faces
Figure 31)
The topographic images of kaolinite particles on glass and fused alumina
substrates are shown in Figure 36 Both the images confirm the pseudo-hexagonal shape
and platy features of the kaolinite particles Kaolinite particles consist of several layers of
the silica-alumina bilayers though in some images a single layer of kaolinite (07 nm
thick) was also observed (images not shown) The interaction forces between the silicon
nitride tip and the two faces of kaolinite are shown in Figure 37 Again a good
reproducibility of force curves is shown by five replicates performed on different
particles Similar to Glass-Substrate when the silica tetrahedral layer of kaolinite is
exposed a repulsive interaction dominates between the silicon nitride tip and the 001 face
of kaolinite at all pH values which indicates an iso-electric point of pH lt 4 for the silica
83
Figure 36- Topographic height images of kaolinite particles deposited on glass (left) and fused alumina (right) substrates respectively as obtained by AFM using a silicon nitride tip in the contact mode The white cross-bars on A1 and A2 images show the locations where the forces between the silicon nitride tip and the kaolinite faces were measured
Alumina Face of KaoliniteA1 A2Silica Face of Kaolinite
0 10 μm 0 10 μmB1 B2
12
34 5
12
34 5
12
34
5
12
34
5
0 nm500 nm
0 nm500 nm
84
Figure 37- Interaction forces measured between silicon nitride tip and silica tetrahedral face (left) and alumina octahedral face (right) of kaolinite in 1 mM KCl solution at increasing pH Five replicates (red-circle) of force curves on different particles along with DLVO fit (black-line) curve are shown
Silica Face of Kaolinite Alumina Face of Kaolinite
1 mM KCl 1 mM KCl
85
face of kaolinite The long-range electrostatic repulsive forces between the silicon nitride
tip and the silica face of kaolinite fit well with the DLVO model The magnitude of
electrostatic repulsion increased nearly over a magnitude from 015 to 128 nN with
increasing pH This is an interesting result as an increase in over a magnitude of
repulsive force could not be explained solely by the increasing surface potential andor
surface charge density of the silicon nitride tip with increasing pH This suggests some
contribution from the pH dependent surface charge density sites on the silica tetrahedral
layer of kaolinite and contradicts the assumption that the silica tetrahedral face of
kaolinite carries a permanent negative charge and does not show a dependency on pH
Note that the traditional position accounts for the negative charge due to minor
substitution of Al3+ for Si3+ in the silica tetrahedral layer and does not account for the
possibility of broken bonds which may explain some surface charge dependency on pH
variation The interaction range between a silicon nitride tip and the silica face of
kaolinite does not change appreciably with increasing pH in agreement with the results
obtained on the Glass-Substrate (Table 32)
Similar to the pH dependency of our AFM measurement and our calculated
surface charge densities for the basal planes of kaolinite Zhou and Gunter [136] observed
that the surface charge of kaolinite particles determined from potentiometric titration are
over one order of magnitude greater than that predicted by varying the surface site
concentration on the edge faces of kaolinite
Even adding the structural charge of kaolinite particles determined from the
cationic exchange capacity in acidic solutions [28] the results do not match the surface
86
Table 32- Experimental interaction forces and the interaction range measured between silicon nitride tip and the two faces of kaolinite
Silica Face of Kaolinite Alumina Face of Kaolinite pH Force Range Force Range
nN nm nN nm 4 +0147 plusmn 0073 2085 plusmn 357 -0308 plusmn 0102 1247 plusmn 567 5 +0817 plusmn 0168 2524 plusmn 258 -0406 plusmn 0084 671 plusmn 242 6 +0667 plusmn 0183 3005 plusmn 599 -0217 plusmn 0049 491 plusmn 136 8 +1282 plusmn 0296 2080 plusmn 305 +0568 plusmn 0099 1215 plusmn 151 10 +0604 plusmn 0070 2363 plusmn 420 +0263 plusmn 0033 1705 plusmn 808
Note that the average plusmn standard deviations were calculated from 50 experimental forces on at least 10 different particles with
five measurements at one location on each particle
87
charge density determined from the potentiometric titration which led the authors to
conclude that ldquobasal faces of kaolinite are ionizable in aqueous solutionsrdquo
As expected the interaction forces obtained on the silica face of kaolinite are
comparable to these obtained on the Glass-Substrate with slightly decreased forces on the
silica face of kaolinite at pH 4 and 10 and slightly increased forces at pH 5 6 and 8
It should be noted that the Glass-Substrate is mainly composed of SiO2 beside
other alkali and alkaline earth oxides such as Na2O CaO MgO and K2O as well as
A12O3 Fe2O3FeO [137] whereas the silica face of kaolinite is composed of SiO2 only
These slight variations in the magnitude of repulsive forces are expected from the
difference in the composition of the Glass-Substrate and the silica face of kaolinite
In contrast to the silica tetrahedral face of kaolinite attractive interaction
dominates between a silicon nitride tip and the alumina octahedral face of kaolinite at pH
4 5 and 6 At higher pH of 8 and 10 repulsive interactions were observed The attractive
interaction forces only decreased by a factor of 15 (-031 to -022 nN) with increasing pH
from 4 to 6 and turned repulsive to +057 nN at pH 8 and +026 nN at pH 10 (Table 32)
The range of interaction also decreased from 10 nm to 45 nm with increasing pH from 4
to 6 and remains constant at 12 nm at higher pH of 8 and 10 The force curves seem to be
in accordance with the DLVO theory as shown in Figure 37 These results suggest that
the iso-electric point of the alumina face of kaolinite (001 basal plane) lies between pH 6
and 8 The force curves on the alumina face of kaolinite and the Fused Alumina-Substrate
are comparable and of the similar magnitude
Interestingly at pH 4 the attractive force field of the alumina face of kaolinite (-
030 nN) is greater than the repulsive force field of the silica face (+015 nN) whereas at
88
pH gt 5 the repulsive force field of the silica face dominates over the attractive force field
of the alumina face (the magnitude of the repulsive force on the silica face is greater than
the attractive force on the alumina face of kaolinite) Also the long range of electrostatic
repulsion on the silica face is significantly greater (by at least 10 nm) than the range of
electrostatic attraction for the alumina face of kaolinite This implies that the repulsive
force field on the silica face starts to have a significant influence at greater separation
distances and dominates over the attractive force field from the alumina face of kaolinite
at pH gt 5 Hypothetically if we ignore any contribution from the edge surfaces of the
kaolinite particles then it can be said from the combined interaction of the silica and the
alumina faces of kaolinite that kaolinite particles will be positively charged at pH 4 and
will be negatively charged at pH gt 5 It is commonly accepted that edge surfaces of
kaolinite contain pH-dependent surface charge due to broken silica and alumina bonds
with an iso-electric point at neutral pH of 7 In this way the iso-electric point of kaolinite
can be determined from the combined silica tetrahedral face and the alumina octahedral
face along with the edge contribution Such analysis is currently under investigation
Nevertheless the present work on the surface force measurements demonstrates that the
two faces of kaolinite ndash the silica face and the alumina face ndash differ significantly in their
surface chemistry characteristics
333
The surface potentials and surface charge densities determined from the DLVO
fits of the experimental force curves on the Glass-Substrate and the Fused Alumina-
Surface Potential and Surface Charge
89
Substrate are shown in Figure 38 Zeta-potential values of silica and alumina particles as
determined by electrophoresis are also shown in Figure 38 [134]
The surface potential of the silicon-nitride tip varied from -25 to -75 mV with
increasing pH from 4 to 10 The surface potential of the Glass-Substrate varied from -56
to -92 mV with increasing pH from 4 to 8 and slightly decreased to -77 mV at pH 10 In
contrast the surface potential of the Fused Alumina-Substrate varied from +60 to -39 mV
with increasing pH from 4 to 10
The surface potentials of the Glass-Substrate as estimated from surface force
measurements are in reasonably good agreement with the zeta-potential of silica particles
as determined by electrophoresis However the surface potential values of Fused
Alumina-Substrate estimated from surface force measurements are somewhat lower than
the zeta-potential of alumina particles determined by electrophoresis This difference may
be related to the purity of the Fused Alumina-Substrate vs that of the alumina particles
Figure 39 shows the surface potential and the surface charge density of the two faces of
kaolinite (the silica face and the alumina face) estimated from surface force measurement
via DLVO model fitting For the first time the surface potential andor surface charge of
the silica tetrahedral face and the alumina octahedral face of kaolinite particles have been
determined and are shown to be dependent on solution pH (see Figure 39) as opposed to
the existing belief that the two faces of kaolinite carry a fixed negative structural charge
Furthermore the alumina octahedral face of kaolinite shows an iso-electric point in
between pH 6 and 8 whereas the silica tetrahedral face of kaolinite shows an iso-electric
point at pH lt 4 The surface potential of the alumina octahedral face varied from +50 to -
37 mV with increasing pH from 4 to 10 whereas the silica tetrahedral face showed
90
Figure 38- (A) Surface potential and (B) surface charge of the Glass-Substrate and the Fused Alumina-Substrate as a function of pH The calculated surface potentials are compared to electrophoretic zeta potentials reported for silica and alumina by Kosmulski [134]
-120
-100
-80
-60
-40
-20
0
20
40
60
80
3 4 5 6 7 8 9 10 11
Su
rfa
ce
Po
ten
tia
l m
V
pH
Glass-Substrate
Fused Alumina-Substrate
Silica (Kosmulski 2001)
Alumina (Kosmulski 2001)
A
-20
-15
-10
-5
0
5
10
3 4 5 6 7 8 9 10 11
pH
B
Su
rfa
ce
Ch
arg
e D
en
sit
y m
Cm
2
91
Figure 39- Surface potential and surface charge density of the silica face (A) and the alumina face (B) of kaolinite particles as a function of pH
-100
-80
-60
-40
-20
0
20
40
60
2 3 4 5 6 7 8 9 10 11
Surfa
ce P
oten
tial m
V
pH
Silica Face of Kaolinite
Alumina Face of Kaolinite
A
-14-12-10-8-6-4-202468
3 4 5 6 7 8 9 10 11
pH
B
Surfa
ce C
harg
e D
ensi
ty m
Cm
2
92
negative surface potential over the entire pH range which varied from -36 to -67 mV
with increasing pH from 4 to 8 and a slight decrease at pH 10
This new information should be helpful to explain the electrokinetics of kaolinite
Further research is in progress to accommodate the surface charge of the edge surfaces
and the two basal plane surfaces to better understand the electrokinetic behavior of
kaolinite particles
34
The electrokinetic characteristics of kaolinite are typically considered based on
electrophoretic measurements It is evident that the electrophoretic measurements are
compromised by the shape and anisotropic character of kaolinite particles and do not
reveal too much surface chemistry detail The present work describes a procedure to
expose the two faces of kaolinite (silica tetrahedral face and alumina octahedral face) by
ordered deposition of the kaolinite particles on glass and alumina substrates respectively
In this way the 001 and 001 basal plane surfaces were interrogated using AFM for
surface force measurements The surface forces were explained using DLVO theory and
the magnitude of the surface forces and the interaction range were compared Clearly the
present work demonstrates the different behavior of the two faces of kaolinite ndash the silica
tetrahedral face and the alumina octahedral face On this basis the iso-electric point of
the silica tetrahedral face and the alumina octahedral face were determined and found to
be lt pH 4 for the silica face and between pH 6 and 8 for the alumina face
Summary
The electrokinetic properties of kaolinite will have a contribution from both faces
of kaolinite (silica tetrahedral face and alumina octahedral face) as well as from edge
93
surfaces AFM surface force results are significant and provide the basis to determine the
surface charge density and surface potential of kaolinite faces thus providing more
detailed information regarding the surface chemistry of kaolinite With this new
information it may be possible to further explain the electrokinetic behavior of kaolinite
particles and their interactions in aqueous suspensions
CHAPTER 4
ELECTROKINETICS AND TITRATION OF
KAOLINITE PARTICLES
The electrokinetic properties of kaolinite are complicated by anisotropic particle
features ndash nonuniform surface charge densities on the faces (the silica face the alumina
face and the edge surfaces) and its platy-shape Numerous works have been conducted
by researchers both experimentally and theoretically to predict the electrophoretic
mobilities of the kaolinite particle and to improve the Smoluchowskirsquos classical model in
order to get better understanding of the electrokinetic properties for kaolinite particles
This dissertation research provides a review of the earlier works to attempt to predict the
electrokinetic properties of kaolinite Using Smoluchowskirsquos classical model the
apparent iso-electric point for kaolinite was determined at less than pH 3 from
electrophoretic measurement
This chapter discussed the surface charge properties of kaolinite determined
experimentally using traditional titration techniques such as M-R titration and
potentiometric titration and using a new technique to determine surface potential and
surface charge density from surface force measurement using atomic force microscopy
95
The point of zero charge for kaolinite particles will be established by titration techniques
and by surface force measurements
41
The surface chemistry of kaolinite [Al2Si2O5(OH)4] particularly its electrokinetic
properties is very important in many applications such as flotation filtration and many
new applications such as clay-polymer nanocomposites and smart materials [1 5-7 53
63 67 138-141] The surface charge of kaolinite particles are manifested in their basal
planes surfaces (001 and 001) and edge surfaces (010 and 110) The basal plane surfaces
001 and 001 consist of silica tetrahedral and alumina octahedral layers respectively The
edge surfaces consist of broken covalent bonds of aluminol and silanol end-groups It is
believed that the basal planes of kaolinite carry a permanent negative charge due to
isomorphous substitution of Al3+ for Si4+ in the silica tetrahedral and Mg2+ for Al3+ in the
alumina octahedral layer whereas the edge surface carries a positive or negative charge
depending on the pH of the system [23 26 49 142] Therefore it is commonly assumed
that the basal planes do not show a surface charge dependency with varying pH
Introduction
The surface charge densities of kaolinite particles are determined more frequently
by electrophoretic technique to determine their iso-electric point Researchers have
reported the iso-electric point of kaolinite particle as pH of 2ndash4 by electrophoresis
depending on the source of kaolinite and sample preparation techniques [46 51 143
144] However we must bear in mind that the electrophoresis is based on four basic
assumptions (1) the particle is rigid and nonconducting (2) the local mean radius of
curvature is much larger than the Debye screening length (3) the surrounding fluid is
96
unbounded and (4) the zeta-potential is uniform over the particlersquos surface The kaolinite
particles are pseudo-hexagonal platy shaped and are of the order of less than a micron-
to-nano sized range Furthermore the kaolinite particles have anisotropic properties in
their basal planes surfaces and edge surfaces which complicates the electrophoretic
analysis Nevertheless we rely on these measurements in the absence of appropriate
theory
Few researchers have also conducted potentiometric titration to determine the
surface charge densities of kaolinite particles as a function of pH [34 38] These authors
determined a point of zero net proton charge (pznpc) for kaolinite particles at pH 45 by
titration study The pznpc is the pH value at which the net proton surface charge is equal
to zero [145 146]
The main objective of this chapter is two-fold (1) to highlight the limitation of
the current electrophoretic theory to describe the electrokinetic properties of kaolinite
particles and (2) to compare electrophoresis potentiometer titration to determine the
surface charge properties of kaolinite particles
42
421
Materials and Methods
A clean English Kaolin (Imerys Inc UK) was obtained from the St Austell area
in Cornwall UK The sample was cleaned with water only using elutriation to achieve
classification at a size of less than 2 microm No other chemical treatment was done Further
details about the kaolinite extraction and preparation are given in the literature [124] The
kaolinite was used as-received in this research The kaolinite suspension was prepared in
Sample Preparation
97
high purity Milli-Q water (Millipore Inc) The resistivity of the water was above 18 MΩ-
cm in all experiments Potassium chloride (1 mM 10 mm and 100 mM solution) was
used as background electrolyte The pH was adjusted to its desired value using 01 M
HCl or 01 M KOH solutions All chemicals used were of ACS grade
XRD analysis conducted on the kaolinite sample confirmed that the kaolinite is
the dominant mineral phase EDAX analysis of the kaolinite sample showed nearly 11
atomic distribution of aluminum (798) and silicon (795) with trace amounts of
potassium (035) calcium (008) and iron (015)
422
The zeta-potential measurements were carried out by electrophoresis (ZetaPALS
Brookhaven Instrument Corp and Malvern Nanosizer) The particles suspension
(005) was prepared at desired solution concentration and placed in between two
electrodes The particles mobilities were measured when the electric field is applied This
particle mobility is converted to zeta-potential (120577) using Smoluchowskirsquos equation as
follows
Zeta-Potential Measurements
4
U Eεςπη infin= (4-1)
Where Einfin is the applied electric field and U is the particle velocity in a fluid with
dielectric constant ε and viscosity η
98
423
M-R titration was named after two researchers Mular and Roberts who
developed this technique to determine the point of zero charge of colloidal particles
[147] In this method the pH of a suspension is measured at different ionic strengths of
the solution [147] The suspension is prepared at given solution chemistry ndash ionic
strength and pH of the system The ionic strength is then increased to yield a change in
pH of the suspension The change in the pH (pHi ndash pHf) when plotted with pHf gave
information about the iso-electric point of the particles
Mular-Roberts (M-R) Titration
At the iso-electric point
0i fpH pH pH∆ = minus = (4-2)
The particles suspension (1) was prepared in 10 mM KCl solution 20 ml of this
suspension was taken in a SC-1 cleaned beaker in a continuous ultra high purity N2
environment The solution pH was then adjusted to some initial pHi The ionic strength
was then increased to 100 mM using the appropriate amount of KCl and the final pH
(pHf) of the system is noted The results reported are the average of at least two full
repeat experiments
424
The particles suspension (5) was prepared in 10 mM KCl solution (50 ml) and
adjusted to initial acidic pH (pHi) in a continuous ultra high purity N2 environment A
small amount of base 10 microl (01M KOH) was added each time and pH of the suspension
Potentiometric Titration
99
was noted This was continued until the pH of the suspension reach pH 9 The surface
charge of the particle suspension is then calculated as
[ ]( )a bF C C H OHSA
σ + minus = minus minus + (4-3)
where σ is the proton surface charge density (Cm2) F is Faradayrsquos constant SA is
mineral surface area (m2liter) and Ca and Cb are the amounts of acid and base titrant
added (molliter) respectively
43
The electrokinetic theory deals with the charged surfaces in liquids generally in
water Because of its high dielectric constant water is a good solvent for ions For this
reason most surfaces in water are charged Different processes can lead to charging of
the slid surfaces such as protonation or deprotonation reactions from the solid surfaces
lattice substitution of different valency ions and specific adsorption The lattice
substitution is particularly important as the charging mechanism of the clay mineral
surface
Electrokinetic Theory
Surface charges cause an electric field This electric field attracts counter ions
The layer of surface charges and counter ions is called ldquoelectric double layerrdquo Helmholtz
first described the simplistic model of an electrical double layer the counter ions bind
directly to the surface and neutralize the surface charges much like in a plate capacitor
The electric field generated by the surface charges is accordingly limited to the thickness
100
of a molecular layer Helmholtzrsquos model was able to interpret some basic features of
charged surfaces but the model failed to explain the capacitance of an electric double
layer
Gouy and Chapman went a step further and took into account a thermal motion of
the ions Thermal fluctuations tend to drive the counterions away from the surface They
lead to the formulation of a diffuse layer which is more extended than a molecular layer
as shown in Figure 41 Gouy and Chapman applied their theory on the electric double
layer to the planar surfaces Later Debye and Huumlckel calculated the potential and ion
distribution around the spherical surfaces Both the Gouy-Chapman and Debye-Huumlckel
are continuum theories
Following the Gouy and Chapman model of ldquoelectrical diffuse double layerrdquo the
concentration of ions within the interface is assumed to follow the Boltzmann distribution
which can be expressed as
( ) ( ) exp i xi i
z en x nkTψminus = infin
(4-4)
where 120595x is electrostatic potential at the distance x from the surface of the clay platelet
with a surface potential 1205950 zi is the valency of ion i and e is the electron charge (1602 x
10-19 C) The symbol ni (x) represents the concentration of ion i in the electrolyte at the
distance x from the particle surface and ni (infin) is the concentration of ion i in the bulk
solution The product kT is the thermal energy (Brownian) with k being the Boltzmann
constant and T is the absolute temperature (K) In a 11 symmetrical and indifferent
101
Figure 41- Helmholtz and Gouy-Chapman model of the electric double layer
_ __ _ _ _ _ _ _+ + ++ ++
+
++ +_
_
_
_
Solid
Helmholtz
_ __ _ _ _ _ _ _++
+ +
++
++ +_
_
_
_
Solid
Gouy-Chapman
102
electrolyte solution the charge density ρx at a distance x from the particle surface is given
by the summation
( )x i iiz en xρ =sum (4-5)
Substituting ni (x) from equation (4-4)
( ) exp i xx i ii
z ez enkTψρ minus = infin
sum (4-6)
A fundamental theorem of electrostatics known as the Poisson equation
expresses the relationship between the charge density ρx at a point x and the change in the
electrostatic potential 120595 at that point in a medium with the dielectric constant ϵr
2 x
o r
ρψε ε
nabla = minus (4-7)
where nabla2 is the Laplacian operator and can be reduced to part2 120595partx2 for a one-dimensional
case which is appropriate for a double layer on a flat clay surface Replacing ρx by
equation (4-6)
2
2
1 ( ) exp i xi ii
o r
z ez enx kT
ψψε ε
minuspart = minus infin part sum (4-8)
103
This is the Poisson-Boltzmann equation which was considered to be the
mathematical essence of the diffuse double layer Unfortunately there is no explicit
solution for this equation but approximations for certain limiting cases exist among these
are Gouy-Chapmanrsquos approximation for moderate surface potentials and electrolyte
concentrations up to 100 mM and Debye-Huumlckel approximation for low surface
potentials and dilute solutions The Poison-Boltzmann model itself leads to imperfections
due to several assumptions made in the theory such as
i The finites size of the ions was neglected
ii Ions in solution were considered as a continuous charge distribution
iii All noncoulombic interactions were disregarded
iv The solvent is supposed to be continuous and the permittivity of the medium to be
constant
v Surfaces are assumed to be flat on the molecular scale
vi Image forces between the ions and the surface were ignored
Despite these strong assumptions the Poisson-Boltzmann theory describes
electric double layers surprising well The reason is that errors lead to opposite effects
and compensate each other For example including noncoulombic interactions lead to an
increase of the ion concentration at the surface and a reduced surface potential On the
other hand taking the finite size of the ions into account leads to a lower ion
concentration at the surface and thus an increased surface potential Likewise a reduction
of the dielectric permittivity due to the electric field increases its range but at the same
time reduces the surface potential because less ions dissociate or adsorb The readers are
104
also advised to review the literature for electrokinetic theory in greater details [24 148-
150]
The most rigorous approach to improve the Poison-Boltzmann theory is by
starting from first principles applying statistical thermodynamic equations for bulk
electrolytes and nonuniform fluids Excellent reviews about the statistical mechanics of
double layer have appeared [151 152] Also computer simulations increased our
understanding of electric double layer significantly [153] Despite these advancements
dealing with statistical mechanics and computer simulations simple analytical formulas
that can easily be applied are not available In addition for a complete description the
molecular nature of the solvent should be considered
Fortunately Stern proposed a relatively simple semi-empirical extension of the
Gouy-Chapman theory In Stern theory the electric double layer is divided into two
parts an inner part the Stern layer and an outer part the Gouy or diffuse layer The
Stern layer consists of a layer of ions (δ) which are directly adsorbed to the surface and
which is immobile The potential at the point where the bound Stern layer ends and the
mobile diffuse layer begins is the zeta potential (ς potential) A simplified version of the
Stern layer is shown in the Figure 42
Following the Stern model of electric double layer the surface potential of the
solid particles at the solid-liquid interface is frequently characterized by electrophoresis
Significant contributions have already been made regarding electrophoresis from
numerous researchers dealing with the field of electrokinetic phenomena These studies
range from the earliest works of Smoluchowski [149] and Henry [154] where the
attention was devoted to the motion of a single spherical colloidal particle under certain
105
Figure 42- Stern model of the electric double layer
+++
++
+
++
++
+
________
_
_
_
_
_
_
_
x
ψo
ψδ
δ
106
limiting conditions to modern theories detailing the motion of a swarm of particles in a
concentrated dispersion employing cell models
Here we will present an analysis of evaluating the electrophoretic velocity of a
charged particle when it is placed in an electric field First the motion of a single charged
spherical particle under the influence of an external field is presented After formulating
the appropriate mathematical equations for such condition two limiting cases of the
problem will be presented namely when the particle is very small or in an almost perfect
dielectric with few mobile charges ie in the limit κa ≪ 1 and when the particle is large
or in a highly concentrated electrolyte ie κa ≫ 1 All the above mentioned analyses
will be confined to particles having low surface potentials Following the analysis of
single charged spherical particle complexities of dealing with the electrokinetic motion
of platy shaped kaolinite particles will be presented In the entire analysis the particle
will be assumed to be rigid and electrically nonconducting
Let us first consider a spherical particle of radius a bearing a charge Qs suspended
in a pure dielectric fluid (containing no free charge or ions) When subjected to a uniform
external electric field Einfin the particle will translate under the influence of the electric
force acting on it Since there is no free charge in the dielectric fluid there will be no
flow of this fluid under the influence of the uniform external electric field as long as there
is no pressure gradient The net electrical force on the charged particle will simply be
E sF Q Einfin= (4-9)
107
The particle encounters an oppositely directed fluid drag force as soon as the
particle starts to move under the influence of this electrical force
6HF aUπmicro= (4-10)
where μ is the fluid viscosity and U is the particle velocity Equating the electrical and
drag forces for steady-state motion one obtains
6
sQ EUaπmicroinfin= (4-11)
The direction of the particle velocity will be governed by the sign of the particle
charge The electrophoretic mobility of the particle can be defined as velocity per unit
applied electric field and is given by
6
sQUE a
ηπmicroinfin
= = (4-12)
Now consider when a single charged spherical particle of radius a carrying a total
charge Qs is immersed in an electroneutral electrolyte solution (volumetric charge
density ρf is zero) The charged particle will polarize the electrolyte solution
surrounding it resulting in the formation of an electric double layer The electric double
layer will have a spatially varying volumetric charge density As soon as a charge density
108
is developed in the electrolyte solution it will experience an electric body force under the
influence of the overall electric field near the particle The overall electric field is
superposition of two fields
i the unidirectional external field
ii a spherically symmetric field in the double layer due to the charged particle in
absence of the external field
The electric body force will cause a motion in the fluid immediately surrounding
the particle and will be opposite to the direction of the particle movement In addition to
the fluid flow the concentration gradients of the ions as well as the electric potential
gradients will give rise to ionic fluxes which are usually described in terms of the
Nernst-Planck equations
Therefore a complete analysis of electrophoresis of a charged particle in an
electrolyte solution involves consideration of following three coupled physical processes
i Interaction of the charged particle with the external electric field giving rise to an
electrical force on the particle
ii Formation of the electric double layer surrounding the particle giving rise to a
spatially inhomogeneous charge distribution which results in an electrical body force
driven fluid flow and
iii Transport of ions relative to the charged particle under the combined influence of
convection diffusion and migration
The governing equations describing the three coupled processes mentioned above
apply to the steady state velocity of a single charged spherical particle under an imposed
electric field Einfin The geometry is shown in Figure 43 Note that the particle velocity U
109
Figure 43- A spherical particle of radius a held stationary in a uniform electric field Einfin
x
a
Einfin
U
ix
ir
n
θ
110
and the electric field are represented as vector quantities The fixed particle reference
frame was chosen here and the flow of an electrolyte solution around a stationary
charged particle was considered
In this case far from the particle the velocity of electrolyte solution is then given
as
xu Uiinfin = minus (4-13)
where U is the particle velocity along the x direction and ix is a unit vector Consequently
u Uinfin = minus represents the fluid velocity necessary to keep the particle stationary The
electrolyte solution contains N ionic species of valency zi with a bulk concentration niinfin
and diffusion coefficient Di
The electric potential ψ in the electrolyte solution surrounding the charged
particle is given by equation (4-7) For small Reynolds number and neglecting the effect
of gravity the electrolyte solution velocity field u is given by the modified momentum
equation as
2 0xu pmicro ρ ψnabla minusnabla minus nabla = (4-14)
where nablap is the pressure gradient and ρxnablaψ is the electrical body force on the electrolyte
solution caused by the overall potential gradient nablaψ The steady-state continuity equation
for the electrolyte solution under dilute conditions ie constant density provides
111
0unabla = (4-15)
The ionic fluxes are given by the Nernst-Planck equations which can be written
in terms of the number concentration ni of the ith ionic species as
i i ii i i i i i
z en Dj n v n u D nkT
ψ= = minus nabla minus nabla (4-16)
where vi and Di are the velocity and diffusivity of the ith ionic species respectively For a
steady state transport process the ion conservation equation then yields
0i i ii i i i i i
z en Dj n v n u D nkT
ψ nabla = = nabla minus nabla minus nabla = (4-17)
431
Using a spherical coordinate system and utilizing symmetry in the angular
directions the potential distribution around the sphere can be represented by the Poisson-
Boltzmann equation as
Electrophoresis in the Limit κa ≪ 1
2 22
1 rr dr dr
ψ κ ψpart part =
(4-18)
where κ is the inverse Debye length given by
112
122 22e z n
kTκ
εinfin
=
(4-19)
Let say
rξ ψ= (4-20)
which renders equation (4-18) as
2
22drξ κ ξpart= (4-21)
The general solution of the above equation is
r rAe Beκ κξ minus minus= + (4-22)
where A and B are constants which can be evaluated from the boundary conditions The
boundary conditions are
0 as rψ ψinfinrarr = rarrinfin (4-23)
and
113
as s r aψ ψ ζrarr = = (4-24)
Substituting the boundary conditions equations (4-23) and (4-24) in equation
(4-22) yields the potential distribution as
( )expa r ar
ψ ζ κ= minus minus (4-25)
Now to determine the charge on the particle surface Qs we will apply the
electroneutrality condition (total charge of a system comprised of a charged particle and
the surrounding electrolyte should be zero) as
( )24s faQ r rπ ρ
infin= minus partint (4-26)
Using Poissonrsquos equation
22
1 frr dr dr
ρψε
part part = minus
(4-27)
Substituting equation (4-27) into equation (4-26) gives
2 2 22
14 4s aa
Q r r r rr dr dr dr
ψ ψπε πεinfin
infin part part part = part = int (4-28)
114
Noting that
0drdrψ
rarrinfin rarr (4-29)
we obtain
24sr a
Q adrψπ ε
=
part= (4-30)
Using the derivative of equation (4-25) and substituting in equation (4-30) gives
( )2 14s
aQ a
aκ
π εζ+
= (4-31)
The electrical force acting on the particle in an external field Einfin is given by
( ) ( )2 14 4 1E s
aF Q E a E a E a
aκ
π εζ π εζ κinfin infin infin
+= = = + (4-32)
The particle will also encounter drag force as soon as it starts to translate under
the influence of the electrical force Oseen formulation [150] is used here to calculate the
velocity field due to a point force acting at a given location in the fluid and that the
overall velocity field due to disturbed point forces is obtained by integrating the singular
115
solutions of the Stokes equation Here the point force is given as the product of the
external field Einfin and the differential charge partQ = ρf partV of a small volume element partV
in the fluid The velocity component acting along the field direction is then given by
21 cos8
fR V
EU V
rρ
θπmicroinfin = + part int (4-33)
where UR is the velocity of the center of the spherically symmetric charge cloud V is the
volume of the charge cloud r is the radial position and 120579 is the polar angle After
integration over the entire volume of the charge cloud one obtains the velocity of the
center of the charge cloud as
( )23RU a Eεζ κmicro infin= minus (4-34)
This is the retardation velocity of the fluid surrounding the particle and it
approaches zero as 0aκ rarr
In an infinitely dilute colloidal dispersion the Stokes hydrodynamic drag force on
the spherical particle of radius a is given as
6 ( )H RF a U Uπmicro= minus (4-35)
116
where U ndash UR is the velocity of the particle relative to the electrolyte solution At steady
state balancing the electrical and drag forces ie FE = FH results in
23
EU εζmicro
infin= (4-36)
This is Huumlckelrsquos [150] solution for the electrophoretic velocity valid for small κa
Equation (4-36) is usually written as
23
UE
εζηmicroinfin
= = (4-37)
where η is referred to as the electrophoretic mobility The Huumlckel equation is valid for
large Debye length and in particular for nonelectrolyte systems eg organic liquids
where κ-1 is generally large relative to the particle radius a
432
When the particle radius is large or more specifically when the Debye screening
length κ-1 is small relative to the particle radius ie κa ≫ 1 the electric double layer
becomes extremely thin compared to the particle radius and we can neglect the curvature
effects of the particle In this limiting case one can consider the relative movement of the
ions with respect to a planar surface The analysis based on this assumption is generally
referred to as the Helmholtz-Smoluchowski analysis
Electrophoresis in the Limit κa ≫ 1
117
The governing Navier-Stokes equation for the fluid flow past a horizontal flat
surface with the surface moving at a velocity U is given as
2
2x
fu E
dymicro ρ infin
part= minus (4-38)
Here ux is the velocity of the fluid tangential to the plate Combining with the
Poisson equation equation (4-38) becomes
2 2
2 2x xu E
dy dyψmicro ε infin
part part= (4-39)
The boundary conditions for the problem are as follows
0 and as xu U yψ rarr rarrminus rarrinfin (4-40)
0 and as xu U yy yψ partpart
rarr rarr minus rarrinfinpart part
(4-41)
and 0 at 0xu yψ ζ= = = (4-42)
Integrating equation (4-39) from infinity to an arbitrary distance y from the
particle surface and employing the boundary conditions as in equations (4-40) and (4-41)
yields
118
( )( )xE yu y Uε ψmicro
infin= minus (4-43)
Substituting the boundary condition at the particle surface given by equation
(4-42) in equation (4-43) results in
EU ε ζmicroinfin= (4-44)
or expressed in terms of electrophoretic mobility as
UE
εζηmicroinfin
= = (4-45)
This is referred to as the Helmholtz-Smoluchowski electrophoretic mobility
equation and is valid in the limit κa ≫ 1 and zeζkT lt 1
It should be noted that both the Huumlckel and Helmholtz-Smoluchowski results
given by equations (4-37) and (4-45) respectively provide the two limiting values of the
electrophoretic velocity of a single colloidal particle as 0aκ rarr and aκ rarrinfin
respectively Note that both of these equations are independent of particle size
Notably the two classical analyses (Huumlckel and Helmholtz-Smoluchowski)
discussed above deal with the motion of a spherical particle with uniform surface charge
densities under the influence of electric field However the great challenge still remains
with determining the surface charge densities of most clay minerals by electrophoresis
119
From the double layer point of view the challenge is that most clay minerals are
heterogeneous the basal plane surface or ldquoplatesrdquo as well as the ldquoedgerdquo surface carry a
non-uniform surface charge which is dependent on pH and salt concentration [24] Other
challenges involve the shapes of the particles and the fact that some clay types swell by
lowering the electrolyte concentration The shape problem together with the
heterogeneous nature of the charge distribution makes the interpretation of
electrophoretic mobilities in terms of ζ-potential very difficult
A few researchers have gone beyond and considered nonuniform surface charge
densities of particles of different shape such as a sphere [155] spheroid [156] and disc
[157] and described the electrophoretic motion for such particles Due to the extreme
complexities of the mathematical equations analytical solutions for particles of different
shape and nonuniform charge densities do not exist This opens the option for more
traditional analyses to characterize the surface charge densities of clays and other
differently shaped particles using titration such as potentiometric titration and M-R
titration and one new analysis based on surface force measurements using atomic force
microscopy which will be discussed in subsequent sections
44
441
Results and Discussion
The zeta-potential of kaolinite particles as determined by electrophoresis is shown
in
Zeta-Potential of Kaolinite by Electrophoresis
Figure 44 The zeta-potential of pure silica and alumina particles are also plotted for
comparison purposes As shown the iso-electric point of kaolinite and pure silica
particles is less than pH 3 In fact the zeta-potential of kaolinite particles is very close to
120
Figure 44- Electrophoresis of kaolinite as a function of pH
-60
-40
-20
0
20
40
60
80
2 3 4 5 6 7 8 9 10 11
Surf
ace
Pote
ntia
l (ζ)
mV
pH
Gibbsite (Miller et al 2007)Silica (Miller et al 2007)kaolinite
1 mM-KCl
121
pure silica particles as a function of pH Similar results for the iso-electric point for
kaolinite particles at less than pH 3 were reported by several researchers [29 39-45] The
iso-electric point of gibbsite is at pH 92 also in close agreement with the literature [15]
Smith and Narimatsu [39] determined the iso-electric point for kaolinite at pH 22
by micro-electrophoresis and found no iso-electric point for kaolinite by streaming
potential Cases et al [40] reported an iso-electric point at pH 3 for kaolinite particles
and found the sample to spontaneously flocculate at pH lt 35 and stabilized at pH gt 5
Yuan and Pruet [45] also reported the iso-electric point in the range of pH 15-35 for five
commercial kaolinite deposits from Georgia A few studies have also shown higher iso-
electric points for kaolinite between pH 3 and 4 by electrophoretic measurements [7
158]
The iso-electric point of kaolinite as determined by electrophoresis is quite
intriguing as one would expect that the kaolinite particles should show the iso-electric
point at pH of 57 as an average of silica (iso-electric point at pH of 22) and gibbsite
(iso-electric point at pH of 92) since the composition of silica to alumina in kaolinite is
nearly 11 However the iso-electric point of kaolinite particles as measured by
electrophoresis is consistently less than pH 3 which is more closely related to silica (see
Figure 44) It appears from the electrophoresis results that the aluminum hydroxide
octahedral layer does not contribute to the surface charge properties of kaolinite particles
We must however understand that the zeta potential of kaolinite inferred from
the electrophoretic mobility using the Smoluchowski equation has been criticized because
of the heterogeneous nature of the surface charge and the hexagonal platy shape of the
particles [15 24 46] The calculation of zeta potential and surface charge densities for
122
nonspherical kaolinite assuming an equivaent sphere may result in quite misleading
values The zeta potentials calculated from such mobilities does not reflect the potential
at the shear plane because of the screening effect of positive charges on the edges relative
to those of negative charges at faces resulting in lower negative mobility [47] Therefore
other methods for characterizing the surface charge properties of kaolinite must be
considered in order to better understand its electrokinetic properties
442
The change in pH as a function of final pH of kaolinite suspension is shown in
Mular-Roberts (M-R) Titration
Figure 45 following the procedure of Mular and Roberts [147] The iso-electric point
(value of final pH where ΔpH = 0) of kaolinite suspension is determined as pH 451
Notably this iso-electric point is higher than that determined by electrophoresis further
supporting that the present electrokinetic theory does not appropriately address the
surface charge of anisotropic particles such as kaolinite
In M-R theory the ionic strength is increased (increasing concentration of
indifferent electrolyte) resulting in a decrease in the double layer thickness of a surface
Thus the rate of potential decay increases which causes more potential determining ions
to adsorb at the surface when the surface is not at its iso-electric point As a result when
H+ or OH- are dissociated they induce a change in pH Korpi [159] points out that an
oxide surface has a finite number of adsorption sites capable of reacting with hydrogen
andor hydroxyl ions When this point is reached any further addition of acid or base will
alter the pH of the suspensions strictly according to the amount added and no further
adsorption takes place
123
Figure 45- Change in pH of the kaolinite suspensions as a function of final pH for kaolinite suspension Supporting electrolyte (KCl) concentration changes were from 10 to 100 mM
-010
-005
000
005
010
015
020
025
030
0352 3 4 5 6 7 8
ΔpH
Final pH pHf
1Kaolinite
124
In view of the above there must be some (pH)i in strong acidic or basic
suspensions for which the addition of an indifferent electrolyte will result in very small
pH shifts ΔpH approaches zero at these extremes and represent the iso-electric point
Recently Alvarez-Silva [160] validated the M-R titration technique with alumina and
silica particles The point of zero charge for alumina and silica particles as determined by
the M-R titrations were found to be comparable with the iso-electric point determined by
electrophoresis
443
Figure 46
Potentiometric Titration
presents the surface charge densities of kaolinite as obtained by acid-
base potentiometric titrations The titration curves were corrected for the blank titration
conducted in the absence of kaolinite particles The common intersection point however
for the two curves at 1 mM and 10 mM was not obtained but the curves seem to be
superimposed well in the pH range of 5-7 The point of zero charge was determined as
pH 472 and pH 445 at 1 mM and 10 mM respectively These results are in good
agreement with the point of zero charge of kaolinite published in the literature as pH 43
[34] pH 45 [38] and pH 46 [161] as determined by potentiometric titrations Recently
Brady et al also looked into the dissolution of Si and Al species from kaolinite face
surfaces and found that even at a very low level (lt 3 ppm) the surface charge densities
of kaolinite particles are impacted significantly [34] The results are also in good
agreement with the point of zero charge of kaolinite of pH 451 as determined by M-R
titrations discussed in the previous section
125
Figure 46- Surface charge densities of kaolinite particles as determined by acid-base potentiometric titration
-02
-015
-01
-005
0
005
2 3 4 5 6 7 8 9
Su
rfa
ce
Ch
arg
e D
en
sit
y (δ
)C
m2
pH
1 mM
10 mM
5 Kaolinite
126
The potentiometric titrations were also conducted as a function of solid loading
and the results are shown in Figure 47 The results indicate that the two curves overlap
each other well in the pH region of 5-7 whereas a little deviation exists at low and high
pH The iso-electric point reduced to pH 403 for a more concentrated suspension of
10 This small difference in the iso-electric point of kaolinite could be due to improved
aggregation in a concentrated suspension which could reduce the exposed area of the
kaolinite particles
444
Surface force measurements by atomic force microscopy measure the interaction
forces between a silicon nitride tip or colloidal particle of known zeta potential attached
to cantilever and the particles of interest as a function of pH of the system The
interaction forces are then fitted to the DLVO model (sum of electrostatic and van der
Waal interactions) to predict the surface charge densities and surface potentials of the
particles of interest In this way the zeta potential or surface charge densities profile of
particles as a function of pH of the system can be obtained
Zeta-Potential of Kaolinite by Surface Force Measurements
It must be again emphasized here that the classical electrokinetic theory is based
on uniformly charged spherical particles which may not be applicable here as the
kaolinite particles are nonspherical platy shaped and carry nonuniform surface charge
densities on their faces In order to gain a better understanding of the surface charge
properties of kaolinite particles we must investigate the surface charge densities on the
two basal planes surfaces (the silica tetrahedral layer and the alumina octahedral layer)
and edge surfaces Only recently Gupta and Miller [72] reported the surface charge
127
Figure 47- Surface charge densities of kaolinite particles as determined by acid-base potentiometric titration applying equation (4-3)
-012
-01
-008
-006
-004
-002
0
002
2 3 4 5 6 7 8 9
pH
510
Surfa
ce C
harg
e D
ensi
ty (δ
) C
m2
10 mM KClKaolinite
128
densities of the two basal plane surfaces (the silica and alumina face surfaces) through the
surface force measurements of the two faces using atomic force microscopy They
reported that the silica face of kaolinite is negatively charge at pH gt 4 whereas the
alumina face of kaolinite is positively charged at pH lt 6 and negatively charged at pH gt
4 Williams and Williams [41] predicted the zeta-potential of edge surfaces of kaolinite
with an iso-electric point at pH 72 assuming a linear combination of quartz and alumina
It was realized that the zeta-potential does not define the surface potential of the edge
surface appropriately Instead potentiometric titration was used to determine the surface
potential and surface charge of the edge surface of kaolinite The surface charge density
of the edge surface of the kaolinite particles was calculated following the charge balance
as
kaolinite kaolinite silica face silica face alumina face alumina face edge face edge faceA A A Aσ σ σ σ= + + (4-46)
where σkaolinite is the surface charge density of kaolinite particles as determined by
potentiometric titration σsilica face and σalumina face are the surface charge densities of the
silica face and the alumina face of kaolinite as determined by surface force
measurements The symbols Akaolinite Asilica face Aalumina face and Aedge face represent the total
area of kaolinite particles area of silica face alumina face and edge surfaces
respectively The area of the silica face surface the alumina face surface and the edge
surface was determined from the kaolinite particle equivalent circle diameter and
thickness
129
Utilizing this new information ndash surface charge densities of the silica the alumina
and the edge surfaces ndash we can determine the surface charge densities of the kaolinite
particles by combining the surface charge densities of each surface with respect to its
interaction area as shown in Figure 48 As shown in Figure 48 the surface charge
density of the edge surface is significantly greater over one order of magnitude greater
when compared to the surface charge densities of the silica face and the alumina face of
the kaolinite particles at high pH At low pH the surface charge density of the edge face
of kaolinite is of a similar magnitude (within a factor of two) with that of the surface
charge densities of the silica face and the alumina face The median diameter and
thickness of kaolinite particles were determined as 600 nm and 112 nm respectively
from scanning electron microscopy and atomic force microscopy analysis of 150
kaolinite particles The composite surface charge of kaolinite particles was then
determined and showed an iso-electric point in between pH 4 and 5 This is an interesting
result as it showed a higher iso-electric point of less than pH 3 as determined by
electrophoresis This technique of determining the surface charge properties of kaolinite
particle is particularly useful as it also describes the surface charge properties of each
surface ndash the silica face surface the alumina face surface and the edge surface
445
The cation exchange capacity of the kaolinite particles is frequently determined to
characterize the surface charge properties of its faces ndash the silica face and the alumina
face whereas the surface charge densities of edges were determined by titration
technique (Lyklema 1995) The maximum number of exchangeable groups can be
Cation Exchange Capacity (CEC)
130
Figure 48- The surface charge densities of the kaolinite edge surface and the two face surfaces (silica and alumina face) as a function of pH in 1 mM KCl solution
-250
-200
-150
-100
-50
0
50
3 4 5 6 7 8 9 10 11
Su
rfac
e C
har
ge
Den
sity
m
Cm
2
pH
Edge Surface - Equation (49)
Silica Face Surface - Gupta and Miller 2010
Alumina Face Surface - Gupta and Miller 2010
131
established on the silica and the alumina faces of kaolinites by counter ion exchange
method
The cation exchange capacity involves converting the silica and the alumina faces
of kaolinite into a state with only one type of counterions (for example 4NH+ as in the
ammonium acetate method) and then desorbing these quantitatively measuring how
many came off (in the example by exchange with Na+ and determining the 4NH+ liberated
by a Kjeldahl distillation) The experiments are normally conducted in acidic condition
(where the edge surfaces are positively charged) to exclude adsorption of cations at the
edges Depending on the different counterions and source of kaolinite different values
for cation exchange capacity for kaolinite are suggested in the range of 36-100 micro-moleg
[29-32] Cation exchange capacities can be utilized to convert to maximum counterions
charge density as
f
FCECA
σ+ = (4-47)
where CEC is cation exchange capacity F is the faraday constant and Af is the specific
surface area of the basal planes of silica tetrahedral (001) and alumina octahedral (001)
layers The surface charge density of the faces (σ0) can be obtained from counterions
charge density (σ+) under the conditions where negative adsorption may be neglected
Alternatively the diffuse layer can be suppressed by working at high electrolyte
concentrations In this way σ0 for faces has been established at a value between -01 to -
02 Cm2 [24]
132
Gupta and Miller [72] however disagreed with the traditional emphasis of
permanent negative charge on the kaolinite faces (the silica face and the alumina face)
As discussed in the surface force section the silica face of kaolinite is negatively charged
at pH gt 4 whereas the alumina face of kaolinite is positively charged at pH lt 6 and
negatively charged at pH gt 4 Also the surface charge on the silica face and the alumina
face show dependency on the pH of the system In agreement of our analysis Ferris and
Jepson [29] also do not support the isomorphous substitution charge on the faces so often
assumed in the past Their data show no evidence for any definite cation exchange
capacity for well-crystallized kaolinite from the St Austell area of Cornwall and
assigned a value of zero for permanent structural charge Their findings showed that the
cation uptake however is not fixed and depends upon the cation chosen the electrolyte
concentration and pH and on whether the experiments were conducted from aqueous or
95 ethanol solvent
Different electrokinetic techniques were utilized by researchers obtaining a
different iso- electric point for kaolinite particles A review of the literature for the iso-
electric point for kaolinite particles is given in Table 41 The electrophoresis and
electroacoustic analysis gave a smaller value for the iso-electric point for kaolinite as pH
lt 3 with one exception at pH 38 obtained by Hu and Liu [3] It should be noted that the
electrokinetic measurements are questionable as it does not incorporate the platy nature
and the heterogeneous nature of differently charged basal plane surfaces and edge surface
of kaolinite Instead the potentiometric titrations are in general agreement of point of
zero charge for kaolinite in between pH 45 to 5 The potentiometric titration better
133
Table 41- Review of literature for iso-electric point of kaolinite by different electrokinetic techniques
Method Value References Electrophoresis Electroacoustic Potentiometric Titration
lt 2 lt 2 lt 3 lt 3 lt 3 38 lt 3 lt 2 lt 4 45 45 50 75 30 48 499
Chassagne et al [52] Sondi et al [51] Tombacz and Szekeres [143] Miller et al [15] Williams and Williams [41] Hu and Liu [3] Johnson et al [49] Galassi et al [144] Schindler et al [33] Motta and Miranda [38] Xie and Walther [162] Zhou and Gunter [136] Wieland and Stumm [14] Braggs et al [158] Ferris and Jepson [29] Schroth and Sposito[36]
134
represents the average surface charge properties of kaolinite as it includes the surface
charge on the diffuse layer of the particles and not its electrokinetic motion
45
The surface charge properties of kaolinite particles are manifested in their face
surfaces ndash the silica face the alumina face and the edge surfaces The current
electrokinetic analysis by electrophoresis does not provide the appropriate surface charge
information for kaolinite due to the heterogeneity of the surface charge on the three faces
and the platy nature of particles which are not accounted in the present theory
Summary
In the absence of an appropriate theory traditional titration experiments (M-R
titration and potentiometric titration) and new surface force measurements by AFM
provide more details about the surface charge densities on the three surfaces of kaolinite
ndash the silica face the alumina face and the edge surface Both titration experiments
estimated a point of zero charge close to pH 450 for kaolinite particles which is in
excellent agreement with iso-electric point in between pH 4 and 5 as determined by
surface force measurements The surface force measurement technique is unique in that it
provides specific surface charge densities of the silica and the alumina faces of kaolinite
as a function of pH The improvements in kaolinite sample preparation are however
needed for surface force measurements in order to analyze the surface charge properties
of the edge surfaces independently The electrokinetic properties of kaolinite particles are
important and will play a significant role in particle interactions in many different
applications such as flotation filtration paper making and clay-polymer composites
CHAPTER 5
PARTICLE INTERACTIONS IN KAOLINITE
SUSPENSIONS AND CORRESPONDING
AGGREGATE STRUCTURES
The surface charge densities of the silica face surface and the alumina face
surface of kaolinite particles recently determined from surface force measurements using
atomic force microscopy show a distinct dependence on the pH of the system The silica
face was found to be negatively charged at pH gt 4 whereas the alumina face surface was
found to be positively charged at pH lt 6 and negatively charged at pH gt 8 The surface
charge densities of the silica face and the alumina face were utilized in this study to
determine the interaction energies between different surfaces of kaolinite particles
Results indicate that the silica facendashalumina face interaction is dominant for
kaolinite particle aggregation at low pH This facendashface association increases the stacking
of kaolinite layers and thereby promotes the edgendashface (edgendashsilica face and edgendash
alumina face) and facendashface (silica facendashalumina face) associations with increasing pH
and hence the maximum shear yield stress at pH 5-55 With further increase in pH the
facendashface and edgendashface association decreases due to increasing surface charge density
on the silica face and the edge surfaces and decreasing surface charge density on the
136
alumina face At high pH all kaolinite surfaces become negatively charged kaolinite
particles are dispersed and the suspension is stabilized The facendashface association at low
pH has been confirmed from cryo-SEM images of kaolinite aggregates taken from
suspension which show that the particles are mostly organized in a facendashface and edgendash
face manner At higher pH conditions the cryo-SEM images of the kaolinite aggregates
reveal a lower degree of consolidation and the edgendashedge association is evident
51
The rheological properties of concentrated suspensions of clay minerals such as
kaolinite [Al2O32SiO22H2O] are very important in ceramics in paper and pulp in
drilling mud in filtration in dewatering and in many other new applications such as clay-
polymer nanocomposites etc [53 63 116] Kaolinite particles are naturally pseudo-
hexagonal platy shaped ranging from micron to nanosize particles The crystallographic
structure suggests that kaolinite particles consist of a silica tetrahedral surface
corresponding to the 001 basal plane and an aluminum hydroxide octahedral surface
corresponding to the 001 basal plane as shown in
Introduction
Figure 51 Of course the kaolinite
particles have 010 and 110 edge surfaces which are generated as a result of broken
covalent bonds The rheological properties of kaolinite are governed by its surface
chemistry in particular its electrokinetic features which generally determine the particle
interactions and hence the mechanical properties of the suspension
It is traditionally believed that the 001 and 001 basal plane surfaces of kaolinite
particles are negatively charged due to isomorphic substitution of Al3+ for Si4+ in the
silica tetrahedral layer and Mg2+ for Al3+ in the alumina octahedral layer whereas
137
Figure 51- The structure of kaolinite along 010 edge surface showing a silica tetrahedral layer and an alumina octahedral layer
Silicon
Aluminum
OxygenOxygen + HydroxylHydroxyl group
Octahedral
Tetrahedral
138
the edge surface (010 and 110 plane surfaces) carries a positive or negative charge
depending on the pH of the system [23 26 48-50 142] Following this assumption
several researchers have defined the rheological properties of kaolinite and have
explained the abnormal behavior of a maximum yield stress for kaolinite suspensions at
pH 5-55 [26 48-50] Such a maximum might be expected at kaolinitersquos iso-electric point
of pH lt 3 [51 52] Johnson et al [49 50] have gone further in their analysis and
explained this abnormal rheological behavior based on the aggregation behavior of
kaolinite particles which is described mainly by edgendashface attractions and some facendash
face attractions On this basis the maximum shear-yield stress at pH 55 shown in Figure
52 was explained
The assumption that both basal planes carry a fixed negative charge has only
recently been examined experimentally through surface force measurements using atomic
force microscopy (AFM) [72] These colloidal force measurements reveal that the silica
tetrahedral face of kaolinite is negatively charged at pH gt 4 whereas the alumina
octahedral face of kaolinite is positively charged at pH lt 6 and negatively charged at pH
gt 8 The results suggest that the iso-electric point of the silica tetrahedral face is at pH lt
4 and that the iso-electric point of the alumina octahedral face lies between pH 6 and 8
[72] Based on this new finding Gupta et al [163] determined the interaction energies
between different surfaces of kaolinite particles which showed that the silica facendash
alumina face association is likely to be dominant for kaolinite particle association at low
and intermediate pH conditions However the above conclusion of dominant silica facendash
alumina face association was reached by assuming that the zeta-potential of the edge was
a linear combination of the zeta-potentials on silica and alumina surfaces [41]
139
Figure 52- Shear yield stress of kaolinite suspensions as a function of pH for selected volume fractions (adapted from Johnson et al [49 50])
0
50
100
150
200
250
300
350
400
450
3 4 5 6 7 8 9 10 11
Sh
ea
r Y
ield
Str
es
s
Pa
pH
018
022
026
140
The assumption for edge surface zeta-potential will be discussed later in this
study It seems that the edge surface zeta-potential for kaolinite is under-estimated and
that an experimental technique such as potentiometric titration should be considered in
the analysis of kaolinite surface potentials
Several researchers have examined images of flocculated kaolinite suspensions
using electron microscopy to determine the aggregate structure and relate these
observations to rheological properties The earliest significant discussion of clay fabric
was given by Terzaghi in 1925 (see OrsquoBrien [164]) in which the structure of cohesive
soils was discussed with regards to adhesion between adjacent minerals Casagrande
[165] presented a theory for a honeycomb structure in soils Idealized drawings of clay
fabric forming a card-house or honeycomb structure have been proposed [16 23 166
167] Rosenqvist [168 169] published the first electron micrograph of freeze-dried
samples of undisturbed marine Oslo blue clay and supported the idea of card-house
arrangement in the undisturbed sediment OrsquoBrien [164] examined the fabric of kaolinite
in distilled and slightly saline water and found that the fabric is dominated by a 3-
dimensional network of twisted chains of facendashface oriented flakes having the appearance
of a stair-stepped cardhouse Recently Zbik et al [170] investigated the structure of
kaolinite aggregates at pH 8 during sedimentation experiments using cryogenic-scanning
electron microscopy (cryo-SEM) They found that the kaolinite aggregates initially show
edgendashface and edgendashedge association which rearranges from edgendashedge chains to more
compact facendashface associations during settling In another study Zbik and Frost [171]
observed differences in the physical behavior of a number of kaolinite clays from
Birdwood and Georgia For example SEM micrographs of the Birdwood kaolinite
141
aggregates show the predominance of stair step edgendashedge contacts forming a spacious
cell structure whereas Georgia kaolinite aggregates display edgendashface contacts building a
card-house structure From these studies it is suggested that kaolinite clays are very
complex and each kaolinite should be considered separately It is evident that each
kaolinite from different sources must be characterized and detailed examination may be
necessary to determine the aggregate structures at low medium and high pH values
It is the objective of this chapter to utilize the surface charge information on the
face surfaces and edge surfaces of kaolinite in order to understand the structure of
kaolinite suspensions and corresponding rheological behavior Furthermore the influence
of particle aspect ratio and electrical double layer thickness is investigated with regard to
the aggregation behavior of kaolinite particles Finally cryo-SEM images were used to
examine the modes of particle association (facendashface edgendashface and edgendashedge)
52
521
Materials and Methods
A clean English Kaolin (Imerys Inc UK) was obtained from the St Austell area
in Cornwall UK The sample was cleaned with water only using elutriation to achieve
classification at a size of less than 2 microm No other chemical treatment was used Further
details about the kaolinite extraction and preparation are given in the literature [124] The
kaolinite suspension was prepared in high purity Milli-Q water (Millipore Inc) The
resistivity of the water was 182 MΩ-cm in all experiments Potassium chloride (1 mM
solution) was used as background electrolyte for surface force measurements The pH
Sample Preparation
142
was adjusted to its desired value using 01 M HCl or 01 M KOH solutions All chemicals
used were of ACS reagent grade
X-ray diffraction (Bruker AXS Inc Madison WI USA) analysis conducted on
the kaolinite sample confirmed that kaolinite is the dominant mineral phase Energy
dispersive X-ray spectroscopy (FEI Hillsboro Oregon USA) analysis of the kaolinite
sample showed nearly 11 atomic distribution of aluminum (798) and silicon (795)
with trace amounts of potassium (035) calcium (008) and iron (015) Other
details about the purity of kaolinite are provided elsewhere [72]
The kaolinite particles with a median diameter of 600 nm and median thickness of
112 nm in 1 mM KCl solution were used in this study unless otherwise mentioned The
median diameter and thickness were determined from the imaging of at least 150
kaolinite particles using atomic force microscopy The kaolinite particles were air-dried
on a thin sheet of mica and an image of the particle was obtained using the contact mode
imaging technique Section analysis was then conducted to obtain information about the
diameter and thickness of the particle
522
The aggregate size of kaolinite particles in suspension at desired pH values was
determined using photon correlation spectroscopy (PCS) In a PCS experiment the
fluctuation of scattered light from the particles by their Brownian motion is collected at a
scattering angle of 90deg by an optical fiber and detected by a photo-electric detector The
amplified signal from the photo-electric detector is fed into an autocorrelator for
computing the intensity autocorrelation function This autocorrelation function is used to
Aggregate Size
143
determine the relaxation of intensity fluctuations which in turn is related to translational
diffusion coefficient of the particles Particle size (equivalent spherical diameter) is then
determined from the diffusion coefficient of the particles
Kaolinite suspensions (4) were prepared in 1mM KCl solution at pH 90
sonicated for 5 minutes and stirred for 1 hour for complete dispersion After conditioning
50 mL of the suspensions was taken in a volumetric flask and adjusted to the desired pH
of 3 5 7 and 9 A small amount of kaolinite suspensions (1 mL) was taken at each pH
into a cuvette for PCS analysis Each experiment was replicated three times and the
average aggregate size was determined
523
Kaolinite suspensions (1) were prepared in 1 mM KCl solution (100 mL)
About 15 ml of the sample was taken in a vial and adjusted to pH 3 5 7 and 9 using 01
M HCl or 01 M KOH solutions The suspension was left overnight for conditioning The
sample was hand-shaken and then a few microliters of the suspension were taken in a
small metal rivet sealed with glue at one end The sample was immediately plunged into a
liquid N2 slush using the Oxford LN2 slush freezing apparatus for freezing the water
without allowing crystallization ie vitrifying Vitrified samples were placed onto the
liquid nitrogen-cooled specimen stage of the field emission scanning electron microscope
Philips XL30 FESEM with Oxford CT 1500 Cryo stage The sample was fractured under
vacuum and a small amount of vitrified H2O was sublimed off by raising the stage
temperature to minus90 ordmC for 10 minutes to expose the aggregate structure then lowering
back to minus180 ordmC Finally the sample was coated with platinum before SEM imaging
Cryo-SEM
144
524
Interactions between kaolinite particles were characterized by the (Derjaguin-
Landau-Vervey-Overbeek) DLVO model which considers the sum of electrostatic and
van der Waals forces An appropriate form for the van der Waals interaction energy per
unit area (EvdW) between two planar surfaces of thickness δ1 and δ2 is given as [150]
DLVO Model
( ) ( ) ( )2 2 2 2
1 2 1 2
1 1 1 1 12
vdW HAh h h
Ehπ δ δ δ δ
=minus + minus minus
+ + + + (5-1)
where AH is the combined Hamaker constant of the two surfaces interacting in the
suspending medium and h is the shortest separation distance between two interacting
particles At the closest approach h was taken as 20 Ǻ in all calculations for comparison
with existing literature [49] In the case of kaolinite we have to consider six different
surfaces for particle interaction edgendashedge edgendashsilica face edgendashalumina face silicandash
silica face aluminandashalumina face and silica facendashalumina face interactions Therefore
the nonretarded Hamaker constants for each of the six cases were determined from the
Hamaker constant of silica and alumina as given in Table 51 Hamaker constants in the
Table 51 were calculated from the following equation
( )( )123 11 33 22 33A A A A A= minus minus (5-2)
where A11 is the Hamaker constant for the first interacting surface for example the silica
face alumina face or edge surface A22 is the Hamaker constant for the second
145
Table 51- Hamaker constant for different interactions between kaolinite particles
Interaction Interaction Type Hamaker Constant J
1 EdgendashEdge 237 times 10-20
2 EdgendashSilica Face 163 times 10-20
3 EdgendashAlumina Face 305 times 10-20
4 Silica FacendashSilica Face 111 times 10-20
5 Alumina FacendashAlumina Face 390 times 10-20
6 Silica FacendashAlumina Face 208 times 10-20
146
interacting surface for example the silica face alumina face or edge surface and A33 =
the Hamaker constant for the suspending medium which in our study is water The
Hamaker constants for silica and alumina were taken as 886 times 10-20 J and 152 times 10-19 J
respectively [130] The Hamaker constant for the edge surface was determined as 120 times
10-19 J from the average of the Hamaker constants for silica and alumina The Hamaker
constant for water was taken as 370 times 10-20 J [130]
The electrical double layer interaction energy per unit area (EEdl) between two
planar surfaces with surface potentials 1ψ and 2ψ is given by the Hogg-Healy-Fuerstenau
(HHF) expression for dissimilarly charged surfaces as [172]
( )( )
2 21 2 1 2
0
22 1
Edl exp hex h
Ep
ψ ψ κ ψ ψε κ
κ minus minus
= minus (5-3)
where εo is is the permittivity of free space ε is the dielectric constant and κ-1 is the
Debye screening length of the electrical double layer
For cases when the surface potential of the two planar surface are similar ie
1 2ψ ψ ψ= = the electrical double layer interaction energy reduces to
( )
202
1EdlE
exp hψ ε κκ
=+
(5-4)
Similarly the electrical double layer interaction energy under the condition of
constant surface charge first established by Langmuir28 can be used In this case
147
revising equation (3) by replacing the two minus signs in the numerator by plus signs
gives the Langmuir equation In particular the double layer interaction energy at constant
surface potential andor constant surface charge presents the lower and upper limits of the
interaction energy The actual double layer interaction energy with a mixed boundary
condition or a surface charge regulation is between the two limits The calculation shows
that the trend of the total interaction energy for the cases is similar Therefore only the
interaction energy described by equation (5-3) is used hereafter The resulting DLVO
interaction energy is given as
vdW EdlE E E= + (5-5)
The total interaction energy was multiplied by the measured interaction area ratio
of basal plane surface to edge surface of 13391 as determined by atomic force
microscopy In calculating the edge and face surface areas the kaolinite particle was
assumed to be a circular disc The energies are scaled against the maximum predicted
silica face-alumina face interaction energy Emax
53
The rheological behavior of a suspension is essentially determined by the forces
that control the spatial arrangement and dynamics of the suspended particles In a
suspension under the predominant influence of repulsive electrostatic energies the
particles tend to take up positions as far from each other as possible This may lead to a
regular arrangement of the particles ie to the development of the spatial order in the
Results and Discussion
148
suspension Clusters of particles or aggregate structures form in a suspension when the
particle interactions are dominated by attractive energies The aggregate structure or flocs
will immobilize the suspending medium and give rise to increasing viscosity and yield
strength of the suspension The particle characteristics such as morphology size surface
area etc will also greatly affect the suspension viscosity and the strength of the
aggregate structure The aggregate structure plays a major part in the flow behavior of
clay suspensions The rate and mechanism of formation of such aggregate structures and
the characteristics of the aggregate structures are therefore important parameters to
describe the rheological characteristics of such suspensions In this study we will discuss
the formation of aggregate structures of kaolinite and their validation by cryo-SEM in the
following and subsequent sections
531
As mentioned previously the surface chemistry and rheology of kaolinite
particles is complicated greatly by the nonuniform surface charge densities on edge and
face surfaces It was realized that electrophoretic measurements of kaolinite particles do
not give detailed information about surface charge characteristics and therefore
information on electrophoretic mobility is not used in this analysis [15] Instead surface
charge densities of the two faces of kaolinite particles (silica face and alumina face)
determined from surface force measurements are used in this analysis [72] Recently
Gupta et al [163] used the zeta-potential for the edge surfaces as a linear combination of
the zeta-potential of silica and alumina particles It was realized that the zeta-potential
does not define the surface potential of the edge surface appropriately Instead
Particle Interactions
149
potentiometric titration was used to determine the surface potential and surface charge of
the edge surface of kaolinite The surface charge density of the edge surface of the
kaolinite particles was calculated following the charge balance as
kaolinite kaolinite silica face silica face alumina face alumina face edge face edge faceA A A Aσ σ σ σ= + + (5-6)
where σkaolinite is the surface charge density of kaolinite particles as determined by
potentiometric titration σsilica face and σalumina face are the surface charge densities of the
silica face and the alumina face of kaolinite as determined by surface force
measurements With this information the surface charge densities of the edge surface of
kaolinite was determined and the results are presented in Figure 48 As shown in Figure
48 the surface charge density of the edge surface is significantly greater over one order
of magnitude greater when compared to the surface charge densities of the silica face and
the alumina face of the kaolinite particles at high pH At low pH the surface charge
density of the edge face of kaolinite is of a similar magnitude (within a factor of two)
with that of the surface charge densities of the silica face and the alumina face
Considering the surface charge data provided for the different faces of kaolinite
the net interaction energy between different surfaces of kaolinite was determined and is
shown in Figure 53 The interaction energies were scaled to maximum attractive
interaction energy determined for silica facendashalumina face and multiplied by the average
interaction area ratio of 13391 [163] Figure 54 shows the scaled interaction energies
calculated for a separation distance h = 20 Aring when there is no energy barrier consistent
with previous studies [49] When there is an energy barrier between surface interactions
150
Figure 53- Interaction energy profiles for different surface interactions of kaolinite particles
-15E-04
-10E-04
-50E-05
-10E-18
50E-05
10E-04
15E-04
0 10 20 30 40 50 60
Inte
rac
tion
En
erg
y J
m2
Separation Distance nm
pH =10
pH = 8
pH = 6
pH = 5
pH = 4
Silica Face-Silica Face
-15E-04
-10E-04
-50E-05
-10E-18
50E-05
10E-04
15E-04
0 10 20 30 40 50 60
Inte
ract
ion
En
erg
y J
m2
Separation Distance nm
pH = 10
pH = 8
pH = 6
pH = 5
pH = 4
Alumina Face-Alumina Face
-15E-04
-10E-04
-50E-05
-10E-18
50E-05
10E-04
15E-04
0 10 20 30 40 50 60
Inte
ract
ion
En
erg
y J
m2
Separation Distance nm
pH = 10
pH = 8
pH = 6
pH = 5
pH = 4
Silica Face-Alumina Face
-15E-04
-10E-04
-50E-05
-10E-18
50E-05
10E-04
15E-04
0 10 20 30 40 50 60
Separation Distance nm
pH = 10
pH = 8
pH = 6
pH = 5
pH = 4
Edge-Edge
-15E-04
-10E-04
-50E-05
-10E-18
50E-05
10E-04
15E-04
0 10 20 30 40 50 60
Separation Distance nm
pH = 10
pH = 8
pH = 6
pH = 5
pH = 4
Edge-Silica Face
-15E-04
-10E-04
-50E-05
-10E-18
50E-05
10E-04
15E-04
0 10 20 30 40 50 60Separation Distance nm
pH = 10
pH = 8
pH = 6
pH = 5
pH = 4
Edge-Alumina Face
151
Figure 54- The predicted kaolinite edgendashedge edgendashsilica face (E-F(Si)) edgendashalumina face (E-Al(Si)) silica facendashsilica face (F(Si)-F(Si)) alumina facendashalumina face (F(Al)-F(Al)) and silica facendashalumina face (F(Si)-F(Al)) interaction energies scaled to maximum attractive energy for the silica facendashalumina face interaction Kaolinite particles with diameter 600 nm and thickness 112 nm in 1 mM KCl solution
-04
-02
0
02
04
06
08
1
12
3 4 5 6 7 8 9 10 11
EEm
ax
pH
E-E
E-F(Si)
E-F(Al)
F(Si)-F(Si)
F(Al)-F(Al)
F(Si)-F(Al)
152
the interaction energies were calculated at the separation distance for the maximum
energy barrier
It is evident that the silica facendashsilica face interaction is repulsive in the pH range
of 4ndash10 due to the strong electrostatic repulsion between negatively charged silica faces
(see Figure 53 and Figure 54) The alumina facendashalumina face interactions showed a
slight repulsion with a small energy barrier at pH 6 due to weak electrostatic repulsion
and stronger van der Waals attraction Below pH 75 the silica facendashalumina face
interaction is attractive with a maximum at pH 5 whereas a slight repulsion was observed
at higher pH (pH gt 75) This is due to the opposite sign of the surface charge densities
for the silica face and alumina face at pH le 6 (silica face is negatively charged and
alumina face is positively charged) causing stronger attraction both electrostatic and van
der Waals attraction (see Figure 53 and Figure 54) At higher pH (pH gt 8) both the
silica face and alumina face carry the same surface charge sign (both silica and alumina
face carry negative charge) and hence a slight repulsive electrostatic interaction was
found The edgendashedge surfaces showed repulsive interaction for the entire pH range due
to the similar nature of surface charge ie edge surfaces carry a positive surface charge
at pH 4 which becomes increasingly negative at pH values greater than 5 (see Figure
48) The edgendashalumina face showed repulsive interactions at low pH (pH of 4) and at
high pH (pH ge 8) due to strong electrostatic repulsive interactions whereas an attractive
interaction was found at an intermediate pH of 5-6 In contrast the edgendashsilica face
showed attractive interaction only at low pH 4 and repulsion at a higher pH (pH ge 5) due
to the similar nature of the surface charge on the edge surface and the silica face of
kaolinite at higher pH The edgendashsilica face and edgendashalumina face interactions indicate
153
that the edgendashface interactions are favorable at pH lt 8 Though the magnitude of edgendash
silica face and edgendashalumina face interactions suggest an insignificant interaction on an
interaction area basis the interaction cannot be ignored as the edge effect could become
significant in concentrated suspensions when the kaolinite particles are stacked due to the
silica facendashalumina face interaction
On the basis of these different interactions shown in Figure 53 and Figure 54 it
is expected that the overall interaction of kaolinite particles will be dominated by silica
facendashalumina face in acidic solutions (pH lt 75) However the alumina facendashalumina
face interactions are unfavorable over the entire pH range of the system Although lower
in magnitude the edgendashsilica face showed favorable interaction at low pH of 4 and
therefore some edgendashface associations will also be expected at low pH It is therefore
anticipated that the kaolinite particles will aggregate initially in a silica facendashalumina face
manner forming a lamellar tactoid structure in kaolin suspensions at low pH values [23]
This results in a lower suspension shear yield stress As the pH rises the facendashface
association will grow causing the formation of tactoids with thicker edge surfaces
thereby promoting the edgendashface association This is supported by Secor and Radke [173]
who found by numerical simulation that the electrostatic field from the basal plane may
ldquospill-overrdquo to dominate the positive edge surface Chang and Sposito [174] also showed
that the negative electric field from the basal plane of a disc-shaped clay mineral particle
near the edge surface is mainly controlled by particle thickness This facendashface
association is found to be dominant at pH 5 and edgendashface associations dominant at pH
6 which corresponds to the maximum shear yield stress at pH 5-55 As the pH is
increased further the facendashface and edgendashface association decreases due to lower
154
magnitude of surface charge density on edge surfaces and face surfaces resulting in
lower shear yield stress At high pH the edgendashface and facendashface interaction forces
become repulsive and the system becomes completely dispersed and a negligible shear
yield stress is measured In this way the maximum shear yield stress at pH 55 can be
explained based on particle aggregation and its variation with system pH Even if the
edge surface charge density and corresponding interactions are based on zeta potential
measurements as dismissed at the beginning of this section on particle interactions the
relative significance of some interactions changes but in general the same conclusion is
found regarding the variation of interactions with pH
OrsquoBrien [164] observed the dominant face-face and some face-edge aggregation
behavior of kaolinite both in distilled water and in electrolyte solutions using scanning
electron microscopy of freeze-dried kaolinite samples However concern was raised that
the freeze-drying technique can alter the structure of these aggregates during drying
Recently Zbik et al [170] observed stacks of kaolinite aggregated dominantly in face-
face manner at pH 8 using cryo-vitrified technique with scanning electron microscopy
The authors could not explain the facendashface type interaction based on the assumption that
001 and 001 faces of kaolinite are negatively charged Instead it follows from our new
results that the kaolinite particles are aggregating according to silica facendashalumina face
and alumina facendashalumina face interactions
In contrast to our results Johnson et al [49 50] predicted that the kaolinite
particles will mostly interact in an edgendashface manner at lower pH However their studies
were based on the assumption that both faces of kaolinite are negatively charged which
analysis must be reconsidered in view of the AFM surface force results reported by Gupta
155
and Miller [72] These different surface interactions are of importance in order to control
the aggregation behavior of kaolinite particles and the mechanical properties of such
suspensions
532
The influence of aspect ratio (ratio of particle diameter to thickness) on the
different surface interactions is shown in
Influence of Aspect Ratio
Figure 55 The aspect ratio was determined
from the atomic force microscopy images of kaolinite particles About 150 particles were
imaged and analyzed using Nanoscope V72 software for the atomic force microscope
(Veeco Instruments Inc Santa Barbara CA) As shown the edgendashsilica face and edgendash
alumina face interactions are significant for particles with a low aspect ratio (9) as
compared to particles with a high aspect ratio (165) Notably the edgendashalumina face
interactions are dominant at pH 6 whereas silica facendashalumina face interactions are
dominant at pH 5 for kaolinite particles with low aspect ratio This is particularly
interesting as significant edgendashface interaction for particles with a low aspect ratio
indicates that particles will orient themselves in both edgendashface and facendashface (silica
facendashalumina face) organizations The particles with high aspect ratio will orient
themselves dominantly in a facendashface manner (silica facendashalumina face) It is shown that
the aggregate structures can be expected to depend on the aspect ratio of kaolinite
particles and thereby the mechanical properties of the kaolinite suspensions will be
affected by the aspect ratio
156
Figure 55- Effect of aspect ratio on different face type interaction of kaolinite particles (a) low aspect ratio = 9 and (b) high aspect ratio = 165 in 1 mM KCl solution The symbols E F(Si) and F(Al) represent edge silica face and alumina face respectively
-08
-06
-04
-02
0
02
04
06
08
1
12
3 4 5 6 7 8 9 10 11
EEm
ax
pH
E-E
E-F(Si)
E-F(Al)
F(Si)-F(Si)
F(Al)-F(Al)
F(Si)-F(Al)
(a) Low Aspect Ratio
-08
-06
-04
-02
0
02
04
06
08
1
12
3 4 5 6 7 8 9 10 11
EEm
ax
pH
E-E
E-F(Si)
E-F(Al)
F(Si)-F(Si)
F(Al)-F(Al)
F(Si)-F(Al)
(b) High Aspect Ratio
157
533
Figure 56
Influence of Electrical Double Layer Thickness
shows the effect of electric double layer thickness on the different
surface interactions Particles suspended at high ionic strength will experience a small
double layer thickness (304 nm) (see Figure 56b) Under these circumstances there is a
greater alumina facendashalumina face attraction and greater repulsion of silica faces and
edge faces when compared to particles suspended in a solution with a larger double layer
thickness (96 nm) (see Figure 56a) Also at high ionic strength there is a greater
increase in the edgendashalumina face interactions which promote edgendashface associations as
compared to low ionic strength It is evident that at high ionic strength ie at small
values of the reciprocal of the Debye constant (the thickness of the double layer) κ-1 =
304 nm the silica facendashalumina face interactions will be increased at pH 5 with
improved aggregation At the same time the increased alumina facendashalumina face
interactions will expose the silica faces on the kaolinite particles which may also further
promote aggregation with alumina faces forming a larger aggregate structure Olphen
[16] observed decreasing viscosity and yield stress of dilute and concentrated clay
suspensions at lower NaCl concentration With further addition of NaCl both the
viscosity and the yield stress increase slowly at first and rather sharply when the
flocculating concentration of NaCl for the clay was approached
534
In a suspension of clay particles three different modes of particle association or
aggregate structure may occur facendashface edgendashface and edgendashedge [16] The DLVO
Aggregate Structure
158
Figure 56- Effect of electric double layer thickness (κ-1) on different surface interactions for kaolinite particles with particle diameter 600 nm and thickness 112 nm at (a) κ-1 = 96 nm (1 mM KCl solution) and (b) κ-1 = 304 nm (10 mM KCl solution) The zeta-potentials of the silica face and the alumina face are assumed to be reduced by 30 with increasing ionic strength from 1 mM to 10 mM KCl solution The edge surface potential data for 10 mM KCl solution were taken from literature[41] The symbols E F(Si) and F(Al) represent edge silica face and alumina face surfaces respectively
-1-08-06-04-02
002040608
112
3 4 5 6 7 8 9 10 11
EEm
ax
pH
E-EE-F(Si)E-F(Al)F(Si)-F(Si)F(Al)-F(Al)F(Si)-F(Al)
(a) κ-1 = 96 nm
-1-08-06-04-02
002040608
112
3 4 5 6 7 8 9 10 11
EEm
ax
pH
E-EE-F(Si)E-F(Al)F(Si)-F(Si)F(Al)-F(Al)F(Si)-F(Al)
(b) κ-1 = 304 nm
159
interaction energies (electrostatic energy and the van der Waals interaction energy) for
the three types of association are governed by six different combinations of the three
surfaces interactions ndash the silica face the alumina face and the edge surface as explained
previously Consequently the three types of association will not necessarily occur
simultaneously or to the same extent when a kaolinite suspension is aggregated
Facendashface associations will lead to thicker and possibly larger aggregates
whereas edgendashface and edgendashedge associations will form three-dimensional voluminous
card-house structures [16] The various modes of particle association are shown in Figure
57
The SEM micrographs of kaolinite aggregates under cryogenic conditions at pH
3 5 7 and 9 are shown in Figure 58 It can be seen that the kaolinite particles are mostly
associated in a facendashface manner (silica facendashalumina face andor alumina facendashalumina
face) and some face-edge organization (edgendashsilica face) at pH 3 and pH 5 (see Figure
58) This is in good agreement with the theoretical predictions that at low pH the
attraction between the silica face and the alumina face dominates and thereby accounts
for the face-face association This face-face association also promotes edge-face
aggregation of kaolinite particles with an increase in pH-to-pH 5
At pH 7 the particles are mostly associated in edgendashedge manner and edgendashface
manner (edgendashsilica face) (Figure 58) At higher pH (pH = 9) the particles are mostly
associated in edge-edge manner creating a porous structure Also due to repulsion
between the silica face and alumina face facendashface association was not observed at pH 9
in agreement with theoretical considerations The edgendashedge interaction at pH 90 should
also be unfavorable due to similar surface charge density at the edge surfaces which
160
Figure 57- The formation of aggregate structures in kaolinite suspensions as (a) dispersed (b) facendashface (c) edgendashface (d) edgendashedge and (e) a combination of (b) (c) and (d) depending on the solution chemistry of the suspension
(a) (b) (c)
(d) (e)
161
Figure 58- Cryo-SEM micrographs of kaolinite aggregates at pH 3 5 7 and 9 at low (left) and high (right) magnification
5 μm 2 μm
5 μm 2 μm
2 μm
5 μm 2 μm
5 μm
162
causes repulsion The edgendashedge associations at high pH 9 were contrary to DLVO
expectation since all the surfaces of kaolinite particles are negatively charged and the
suspension is stable In agreement with our observation Zbik and Horn [175] also
observed similar structures involving edgendashedge association for kaolinite particles and
they proposed that hydrophobic interaction between edge surfaces could contribute to
such structures Such a proposition needs further consideration Alternatively the edgendash
edge association observed at pH 90 may be due to the experimental conditions associated
with freezing the sample under cryogenic conditions
The cryogenic-SEM images showed the kaolinite aggregate structure for a 4
kaolinite suspension This concentration may well be above the gelation point [171] but
the general trends of the aggregate structure showing dominant face-face association was
also observed in dilute (001) and semidilute (01) kaolinite suspensions (SEM graphs
not shown) Our results are also supported by Zbik and Frost [171] who observed similar
facendashface and edgendashface contacts in kaolinite from Georgia Other modes of particle
associations such as stair step edgendashedge contacts were also revealed in Birdwood
kaolinite aggregates [171]
535
The aggregate structure of kaolinite suspensions at different pH values as revealed
by cryo-SEM are also supported by further experiments conducted using photon
correlation spectroscopy (PCS) to estimate the particle size of such aggregates In our
analysis we estimated the equivalent sphere diameter of aggregate-structures for
kaolinite suspensions These aggregate structures for kaolinite suspensions are three-
Aggregate Size
163
dimensional networks of particles forming an arbitrary shape or so-called ldquocard-houserdquo
structure [16] The precise information for the size of aggregate structures in kaolinite
suspensions could not be revealed with present instrumentation and only qualitative
trends are realized Figure 59 shows the average particle size of kaolinite aggregates in
suspension as a function of pH As shown the average aggregate size of kaolinite is
about 163plusmn03 nm at pH 7 and 9 The average aggregate size of kaolinite remains
unchanged when measured as a function of time at pH 9 which represents a more
dispersed state for the kaolinite particles The aggregate size grows to 389plusmn03 nm at pH
7 in 40 minutes which could be indicative of a loose aggregate structure formed mainly
by edgendashedge associations The initial aggregate size for kaolinite suspensions at pH 35
and 5 were 2668plusmn120 nm and 1271plusmn79 nm respectively The aggregates of kaolinite
grow over an order of magnitude in size in just a few minutes at pH 3 and 5 and then
remain constant These results suggest that kaolinite particles are associated with all three
modes of interactions ndash facendashface edgendashface and edge-edge ndash forming a three-
dimensional network In our analysis we estimated the equivalent sphere diameter of
aggregate-structures for kaolinite suspensions These aggregate structures for kaolinite
suspensions are three-dimensional networks of particles forming an arbitrary shape or so
called ldquocard-houserdquo structure [16] The precise information for the size of aggregate
structures in kaolinite suspensions could not be revealed with present instrumentation
and only qualitative trends are realized Of course as stated previously the aggregate
structure as revealed by cryo-SEM and PCS will influence the mechanical properties of
kaolinite suspensions and thereby affect the rheological properties of such suspensions
164
Figure 59- Average aggregate size for a suspension of kaolinite particles as a function of pH
0
500
1000
1500
2000
2500
35 5 7 9
Aggr
egat
e Si
ze n
m
pH
t = 0 mint = 40 min
165
54
The mechanical properties of kaolinite suspensions particularly the shear yield
stress is explained based on the aggregate structure of the kaolinite particles A new
analysis based on the surface charge densities of the silica face alumina face and edge
surfaces demonstrate the role of pair-wise interactions in controlling the rheology of
kaolinite particulate suspensions The maximum shear yield stress of kaolinite
suspensions is indicative of the significant role played by particle organization in the
formation of aggregates as governed by edgendashedge edgendashsilica face edgendashalumina face
silica facendashalumina face silica facendashsilica face and alumina facendashalumina face
interaction energies
Summary
The results indicate that the facendashface (silica facendashalumina face) is the dominant
particle interaction at low pH values which promotes edgendashface (edgendashsilica face and
edgendashalumina face) and facendashface (silica facendashalumina face) interaction at intermediate
pH values justifying the maximum shear yield stress at pH 5-55 This conclusion is also
confirmed by cryo-SEM analysis of kaolinite aggregate structure and photon correlation
spectroscopy At a higher pH (pH = 7) the kaolinite aggregates show edgendashedge and
edgendashface interactions whereas a more porous structure of aggregates was observed at
high pH (pH = 9)
The influences of particle aspect ratio and electrical double layer thickness were
also examined to determine their effect on interaction energies The findings show that
the edge surfacendashsilica face interactions become favorable at a low aspect ratio whereas
the silica facendashalumina face and alumina facendashalumina face interactions are increased at
high ionic strength conditions These different interactions and their relative significance
166
provide the basis for a more detailed explanation of the rheological behavior of kaolinite
suspensions as well as an improved foundation for the modification of kaolinite
interactions and control of rheological properties
CHAPTER 6
CRYSTAL LATTICE IMAGING OF THE SILICA
AND ALUMINA FACES OF KAOLINITE USING
ATOMIC FORCE MICROSCOPY
The crystal lattice images of the two faces of kaolinite (the silica face and the
alumina face) have been obtained using contact-mode atomic force microscopy (AFM)
under ambient conditions Lattice resolution images reveal the hexagonal surface lattice
of these two faces of kaolinite Analysis of the silica face of kaolinite showed that the
hexagonal surface lattice ring of oxygen atoms had a periodicity of 050 plusmn 004 nm
between neighboring oxygen atoms which is in good agreement with the surface lattice
structure of the mica basal plane The center of the hexagonal ring of oxygen atoms is
vacant
Analysis of the alumina face of kaolinite showed that the hexagonal surface lattice
ring of hydroxyls surround a hydroxyl in the center of the ring The atomic spacing
between neighboring hydroxyls was determined as 036 plusmn 004 nm Ordering of the
kaolinite particles for examination of the silica and alumina surfaces was accomplished
using different substrates a procedure previously established Crystal lattice imaging
168
supports previous results and independently confirms that the two faces of kaolinite have
been properly identified
61
Kaolinite [Al2O32SiO22H2O] is an industrial mineral and its surface properties
are of particular importance in widespread applications eg in ceramics in the
manufacture of paper (as a coating pigment and filler) in inks and paints (as an
extender) and as an additive in the production of rubber and polymers [53 63 116] In
other situations kaolinite is a nuisance when present as a gangue mineral in flotation
separations and during the thickening of plant tailings
Introduction
Kaolinite naturally exists as pseudo-hexagonal platy-shaped thin particles
generally having a size of less than one micron extending down to 100 nm The behavior
of these nanosized kaolinite particles in suspensions pastes and composite materials is
controlled by its surface chemistry features Analysis of the surface chemistry features
such as electrokinetic phenomena is complicated by the anisotropic platy structure of the
particles which manifests itself in edge surfaces and face surfaces Additionally the
bilayer mineral structure suggests that there should be two types of surface faces defined
by the 001 and the 001 basal planes In this way one face should be described by a silica
tetrahedral surface and the other face should be described by an aluminum hydroxide
(alumina) octahedral surface as shown in Figure 11
Limited research has been reported on the experimental characterization of these
face surfaces [15] A few studies have reported the average FTIR spectra of both faces of
kaolinite [53-55] Recent development of advanced analytical techniques (XPS - X-ray
169
photoelectron spectroscopy LEISS - Low energy ion scattering spectroscopy and ToF-
SIMS - Time of flight-secondary ions mass spectroscopy) seem promising to facilitate
investigation of the two faces of kaolinite provided that the particles can be oriented and
that the instrumentation is sufficiently surface sensitive to collect signals from just the
very first layer For example a recent study attempted to use ToF-SIMS to study the talc
surface [56] However these results were averaged over a few layers of talc Recently
many researchers have used scanning electron microscopy (SEM) [58 59] transmission
electron microscopy (TEM) [60] and atomic force microscopy (AFM) [59 61 62] as
imaging tools to characterize particle shape and morphology
It is now well established with some success that AFM can also be used to
investigate the crystal lattice structure of mineral surfaces Atomic resolution has been
successfully obtained on graphite [176 177] molybdenum sulfide [176] boron nitride
[178] germanium [179] sapphire [180] albite [181] calcite [182] and sodium chloride
[183] The AFM has also been used to investigate the crystal lattice structure of the
tetrahedral layer of clay minerals in 21 layer structures such as muscovite [184] illite
[185] and montmorillonite [185] Atomic-scale resolution has also been obtained for the
basal oxygen atoms of a mixed-layered illitesmectite [186] zeolite clinoptilolite [187]
and hematite [188] The details of obtaining atomic and subnanometer resolution imaging
in ambient conditions by AFM is given in the literature [189]
Wicks et al [190] were probably the first to simultaneously report the surface
images of both the tetrahedral and octahedral sheets of lizardite (11 layer structure) using
AFM and they identified the surface hydroxyl groups and magnesium atoms in the
octahedral sheet In this way they identified the two sides of the lizardite clay mineral
170
The surface images of chlorite (211-type structure) were also investigated by AFM and
both the tetrahedral sheet and the brucite-like interlayer sheet was observed [191]
Recently Kumai et al [192] examined the kaolinite surface using AFM They
used the ldquopressedrdquo powder sample preparation technique and obtained the surface
images of both the silica tetrahedral surface and alumina octahedral surface of kaolinite
particles However this technique is compromised as the particles are randomly oriented
and poses difficulty in identifying the appropriate face surface (silica face or alumina
face) of kaolinite
A recent study by Gupta and Miller [72] demonstrates an appropriate technique to
orient the kaolinite particles which selectively exposes the silica face and alumina face of
kaolinite by depositing the particles on glass and alumina substrates respectively These
researchers have indirectly confirmed the silica face and alumina face of kaolinite by
surface force measurements on the two faces of kaolinite The objective of this paper is to
distinguish the silica face and alumina face of kaolinite by direct surface imaging at the
atomic level using AFM thus providing independent confirmation of the procedure
developed previously [72]
62
621
Materials and Methods
A clean English kaolin (Imerys Inc UK) was obtained from the St Austell area
in Cornwall UK The sample was cleaned with water and elutriation was used to achieve
classification at a size of less than 2 microm No other chemical treatment was done Further
details about the kaolinite extraction and preparation are given in the literature [124] The
Sample Preparation
171
kaolinite suspension (1000 ppm) was prepared in high purity Milli-Q water (Millipore
Inc) with a resistivity of 182 MΩ-cm The pH was adjusted to 55 using 01 M HCl or
01 M KOH solutions All chemicals used were of ACS grade The kaolinite was the
dominant mineral phase as characterized using X-ray diffraction and energy dispersive
spectroscopy Further details of kaolinite characterization are reported in the literature
[72]
622
Two substrates ndash a mica disc (ProSciTech Queensland Australia) and a fused
alumina substrate (Red Optronics Mountain View CA) were used to order the kaolinite
particles [72] The kaolinite particle suspension (1000 ppm) was sonicated for 2 minutes
and about 10 microl of the suspension was air-dried overnight on a freshly cleaved mica
substrate under a petri-dish cover in a laminar-flow fume hood In this way the kaolinite
particles attach to the mica substrate with the alumina face down exposing the silica face
of kaolinite as shown from previous surface force measurements [72] ie the positively
charged alumina face of kaolinite is attached to the negatively charged mica substrate
Substrate Preparation
The fused alumina substrate was cleaned using piranha solution (a mixture of
sulfuric acid and hydrogen peroxide in a ratio of 31) at 1200C for 15 minutes followed
by rinsing with copious amounts of Milli-Q water and finally blown dry with ultra high
purity N2 gas A 10 microl kaolinite suspension was applied to the alumina substrate and
dried in the same manner as the mica It was found that the alumina face of kaolinite was
exposed on the fused alumina substrate based on previous surface force measurements
172
[72] ie the negatively charged silica face of kaolinite is attached to the positively
charged fused-alumina substrate
The samples were prepared the night before AFM analysis and stored in a
desiccator until their use Just prior to the AFM experiments the substrates were
sonicated for a minute in Milli-Q water to remove loosely adhered kaolinite particles
washed with Milli-Q water and gently blown with N2 gas before AFM investigation All
substrates were attached to a standard sample puck using double-sided tape
623
A Nanoscope AFM with Nanoscope IV controller (Veeco Instruments Inc Santa
Barbara CA) was used with an E-type scanner Triangular beam silicon nitride (Si3N4)
cantilevers (Veeco Instruments Inc Santa Barbara CA) having pyramid-shaped tips
with spring constants of about 058 Nm were used The cantilevers were cleaned using
acetone ethanol water in that order and gently dried with ultra high purity N2 gas The
cantilevers were subsequently cleaned in a UV chamber for 30 minutes prior to use The
substrates were loaded on AFM equipped with a fluid cell The contact mode imaging
was done in Milli-Q water The AFM instrument was kept in an acoustic and vibration
isolation chamber The imaging was commenced 30 minutes after sample loading to
allow the thermal vibration of the cantilever to equilibrate in the fluid cell First an image
of the particles was obtained at a scan rate of 1 Hz and scan area of 1 microm Subsequently
the atomic resolution imaging was completed using the zoom-in and offset feature of the
Nanoscope vs 531R1 software (Veeco Instruments Inc Santa Barbara CA) to scan an
area of 12 nm on the particle surface The atomic imaging was obtained at a scan rate of
Atomic Force Microscopy
173
30 Hz at scan angle of 800ndash900 with very low integral and proportional gain (006) The
online filters (low pass and high pass) were turned off during the online crystal lattice
imaging
During offline image processing flattening and low pass filtering were applied to
obtain clear images using Nanoscope vs 531R1 software The images were further
Fourier-filtered (2D FFT) to obtain the crystal lattice images using SPIP software (Image
Metrology AS Denmark)
63
In order to obtain the crystal lattice imaging of the silica face and alumina face of
kaolinite the scanner was first calibrated using a mica substrate
Results and Discussion
Figure 61 presents the
crystal lattice imaging of mica which shows the height image fast-Fourier transform
(FFT) spectra and the FFT transformed height image In order to make sure that the
image is real the imaging was done at other locations on the mica substrate and also with
varying scan size and scan angle The repeated pattern of dark and light spots was
reproducible and the dark spots observed were scaled appropriately with the scan size and
angle The images showed some drift in both x and y direction during imaging The dark
spots in Figure 61C and 2D correspond to a hole surrounded by the hexagonal lattice of
oxygen atoms The light spots are attributed to the three-surface oxygen atoms forming a
SiO4 tetrahedron or pairs of SiO4 tetrahedra forming a hexagonal ring-like network
Similar images were reported for the 11 type clay mineral lizardite [190] and other 21
type clay minerals [184 185 193] from AFM observations on a single crystal The fast-
Fourier transform showed the intensity peaks of oxygen atoms arranged in a hexagonal
174
Figure 61- Crystal lattice imaging of mica substrate showing (A) Flattened height image (B) FFT spectra (C) FFT transformed flattened height image and (D) Zoomed-in image of (C) of scan area of 36 nm2 The six light spots in (D) shows the hexagonal ring of oxygen atoms around the dark spots representing a hole
A B
C D
175
ring network (see Figure 61B) The crystal lattice spacing between neighboring oxygen
atoms was calculated as 051 plusmn 008 nm from the average of 10 neighboring atoms This
is in very good agreement with the literature value of 0519 nm [194]
Figure 62 shows an image of a kaolinite particle on a mica substrate The image
shows the platy nature and the pseudo-hexagonal shape of the kaolinite particle The
scanning was sequentially zoomed on the particle Figure 63 shows the crystal lattice
imaging of the silica face of a kaolinite particle on the mica substrate The flattening and
low pass filtering was applied to the height image in an offline mode (see Figure 63B)
The FFT spectra showed the similar intensity of peaks of oxygen atoms arranged in a
hexagonal ring network as observed for the mica substrate As expected the silica face of
kaolinite showed the similar hexagonal ring-like network of oxygen atoms as observed on
the mica substrate (compare Figure 61D and Figure 63D) Note that the scan scale for
the image of the silica face of kaolinite was twice that used for the mica substrate (12 nm
vs 6 nm) which shows the reproducibility of the crystal lattice images obtained on
different substrates The crystal lattice spacing between neighboring oxygen atoms was
calculated as 050 plusmn 004 nm from the average of 10 neighboring atoms This lattice
spacing is in good agreement with 053 nm as reported in the literature [192]
The crystal lattice imaging of the alumina face of kaolinite on a fused alumina
substrate is shown in Figure 64 The FFT spectra shows the intensity peaks of the
hydroxyl atoms forming a hexagonal ring network similar to that obtained on the silica
face of kaolinite (see Figure 64c) Notice that the hexagonal ring of hydroxyls shows the
inner hydroxyl in the center of the ring instead of a hole as observed for the silica face of
kaolinite and mica substrates (compare Figure 61D Figure 63D and Figure 64D) The
176
41
Figure 62- (A) Topography and (B) Deflection images of kaolinite particle on the mica substrate
A
B
E c
m
177
Figure 63- Crystal lattice imaging of the silica face of kaolinite showing (A) Theoretical atomic lattice structure (B) Flattened-low pass filtered height image (C) FFT spectra and (D) FFT transformed flattened-low pass filtered height image of scan size 36 nm2 The six black circles in (D) shows the hexagonal ring of oxygen atoms around the dark spots representing a hole
B
C
A
D
178
Figure 64- Crystal lattice imaging of alumina face of kaolinite showing (A) Theoretical atomic lattice structure (B) Flattened-low pass filtered height image (C) FFT spectra and (D) FFT transformed flattened-low pass filtered height image of (B) The seven black circles in (D) shows the hexagonal ring of hydroxyl atoms with a central inner hydroxyl atom
BA
C D
B
179
image shown in Figure 64D is similar to the octahedral sheet of lizardite [190] the
internal octahedral sheets of micas and chlorite [194] and the brucite-like layers of
hydrotalcite [195] The octahedral sheet of kaolinite consists of a plane of hydroxyls on
the surface The average hydroxyl-hydroxyl distance of the octahedral sheet is 036 plusmn
004 nm which is in reasonable agreement with the literature value of 029 nm [196] For
a kaolinite pellet Kumai et al [192] observed the distance between the hydroxyl atoms
as 033 nm
Recently Gupta and Miller [72] indirectly identified the two kaolinite faces ndash
silica face and alumina face ndash through surface force measurements between each of these
two faces and a silicon nitride cantilever These authors demonstrated that the silica face
of kaolinite is negatively charged at pH gt 4 whereas the alumina face is positively
charged at pH lt 6 and negatively charged at pH gt 8 These results are in excellent
agreement with the lattice images of the silica face and the alumina face of kaolinite
showing the distinct feature of these faces (the hexagonal ring of oxygen atoms on the
silica face and the hexagonal ring of hydroxyls surrounding a central hydroxyl on the
alumina face)
More importantly the experimental technique developed by Gupta and Miller
[72] to order kaolinite particles with the desired face exposed is validated This procedure
using two different appropriate substrates is unique and could be applied for AFM
interrogation of any bilayer system with different characteristics to better understand their
surface properties and crystal structure
180
64
Crystal lattice images were obtained on the silica tetrahedral and alumina
octahedral faces of kaolinite using atomic force microscopy The images showed the
repeated tetrahedral oxygen atoms on the silica face forming a closed hexagonal ring-like
network with a hole in the center On the other hand as expected the alumina face of
kaolinite showed the hexagonal ring of hydroxyls surrounding a central hydroxyl These
results validate the procedure to order kaolinite particles with the desired face exposed
[72] It is clear that atomic force microscopy can be used effectively in the investigation
of mineral surfaces even for particles of nanometer size
Summary
CHAPTER 7
HIGH RESOLUTION TRANSMISSION ELECTRON
MICROSCOPY OF KAOLINITE
Results from a high resolution transmission electron microscopy investigation of
kaolinite has indicated that kaolinite (11 type of clay) is indeed composed of bilayers of
a silica tetrahedral sheet bonded to an alumina octahedral sheet with a c-spacing between
the bilayers of 72 Aring Occasionally defects in the form of bended bilayers was observed
in selected kaolinite particles HRTEM has also indicated that a trilayer structure (21
type clay) with increased c-spacing of 10 Aring was occasionally present in the kaolinite
structure lying between the kaolinite bilayers In addition occasionally a single trilayer
particle was found in the kaolinite population but this was a rare occasion Of course the
presence of such defects in the kaolinite particles and the presence of trace amounts of
21 layer clay minerals particles will influence the surface chemistry including the
surface charge properties of kaolinite
71
The understanding of the structure of the kaolinite is important as it influences its
surface chemistry particularly the electrokinetics properties The existence of defects in
Introduction
182
the bilayer of a kaolinite particle and the presence of other 21 clay mineral particles in
the kaolinite population will affect its surface charge properties Frequently X-ray
diffraction (XRD) is used to characterize the defects and other clay minerals in a kaolinite
sample The existence of layer defects andor a small amount of other clay mineral
particles does not always correlate with the XRD results In some instances high
crystallinity as estimated by XRD corresponds to fewer defects and dislocations in
kaolinite [197] XRD powder patterns are not sensitive enough to identify the small
amount of mixed clay minerals that may be present in the kaolinite samples
High resolution transmission electron microscopy (HRTEM) has been a powerful
tool in studying the layering structure of kaolinite and other clay minerals [60 197-202]
HRTEM has contributed to the investigation of stacking structures in phyllosilicates as
established in the literature [203] HRTEM imaging with the electron beam parallel to
layers enables direct determination of the stacking sequence for individual layers which
is necessary to analyze nonperiodic structures ie stacking disorders or faults as well as
other mixed-layer silicates Yada [204 205] first studied the structure of chrysotile and
antigorite using HRTEM They reported that the chrysotile has a fibrous structure with a
c-spacing of 73 Aring whereas antigorite consist of a wavy structure where the tetrahedral
sheet exchanges polarity with the octahedral sheet every few tetrahedra Amouric and
Olives [199] used HRTEM to investigate the transformation of smectite into kaolinite and
kaolinite-smectite interstratifications Mixed-layer silicates such as illite and smectite
have also been studied with HRTEM [206]
Despite the good success with HRTEM few studies have analyzed the stacking
and crystal organization of kaolin minerals [197 200] Ma and Eggleton [197] examine
183
the kaolinite surface using HRTEM and indicated that three types of face surfaces may
exist in natural kaolinite crystals Type 1 kaolinite structure is the ideal structure and has
the expected 7 Aring surface layer as the terminal layer exposed (ie TOTOTOTOhellipwhere T
stands for silica tetrahedral layer and O stands for alumina octahedral layer) Type 2
kaolinite structure has one 10 Aring pyrophyllite-like layer as the surface layer on one side of
the kaolinite particle (TOTOTOTOhellipTOTO(TOT)) Type 3 kaolinite structure has one
or several 10 Aring collapsed smectite-like layers at one or both sides of a stack
((TOT)TOTOTOTOhellipTOTO(TOT)) Kogure and Inoue [200] investigated the stacking
defects in kaolinite and dickite The authors observed a high density of stacking defects
in kaolinite which are formed by a mixture of two kinds of lateral interlayer shifts
between adjacent layers With this information Kogure and Inoue [200] also explained
the kaolinite-to-dickite transformation mechanism Different stacking sequence andor
defects may exist in kaolinite of particular origin
Therefore the objective of the research reported in this chapter is to investigate
whether the 11 bilayer structure of kaolinite is consistent with the ideal crystal structure
(Type 1) or is the Cornwall kaolinite used in this dissertation research described by
termination with a 21 structure which defines the face surfaces The surface chemistry
particularly the electrokinetic considerations of kaolinite particles and their face surfaces
would be affected by these terminations of 11 (kaolinite) or 21 (smectite) type layers
72
Kaolinite powder was ground for 10 minutes using an agate pestle mortar and
then embedded into a molded resin block Thin sections with a thickness from 50 nm to
Sample Preparation
184
100nm were cut from an intact resin block using a Leica UltraCut microtome (Leica
Microsystems) and collected onto formvar-coated copper mesh grids After being
transferred onto the grids the thin sections were also lightly coated with carbon to
minimize the charging effect during the TEM imaging
73
Tecnai F20 (FEI Co Oregon USA) a twin-lens system operated at 200kV was
used for the investigation of the thin sections of kaolinite particles The images
(4096times4096) were digitally acquired by an UltraScanTM 4000 (USC4000 Model 895
Gatan Inc) using a charge-coupled device (CCD) imaging The images were processed
and analyzed using DigitalMicrograph (version 391 powered by the Gatan Software
Team)
Electron Microscopy
74
The layered structure of kaolinite is shown in
Results and Discussion
Figure 71 at low magnification
showing the stacking of kaolinite particles viewed along their edge surface Single
particles of kaolinite were found to be 100-150 nm thick A bilayer in a kaolinite particle
is about 072 nm thick These results indicate that a kaolinite particle structure consists of
138-208 bilayers
The lattice fringe pattern of the kaolinite particles with the electron beam parallel
to 001 basal plane was obtained as shown in Figure 72 The dark and light fringe pattern
shows a c-spacing of 72 Aring This c-spacing is very consistent as reported in the literature
185
Figure 71- Low magnification TEM image showing the edges of kaolinite particles
Edge Surface of Kaolinite Particle
150 nm
186
Figure 72- Lattice fringe images of kaolinite showing c-spacing of 072 nm
Defect72 Aring
187
indicating that the kaolinite is indeed 11 bilayer structure consisting of the silica
tetrahedral and the alumina octahedral sheets [22 197 199 207] Figure 72 also shows
the stacking defect (bending of several layers) in the kaolinite particle Out of fourteen
particles examined only one showed this stacking fault Plancon et al [208] also
observed similar defects during their investigation of kaolinite samples Ma and Eggleton
[197] also observed defects in lattice fringes of kaolinite stacks such as dislocations and
layer terminations in primary kaolinites and deformations at the nanoscale (ie bending
of several layers) are common in transported kaolinites These defect structures are not
only important to crystal chemistry but also suggestive of the stability relationships
between the kaolinite layers
Figure 73 shows the lattice fringe image of another kaolinite particle showing
two different c-spacings of 72 Aring and 10 Aring The c-spacing of 72 Aring for the kaolinite
particle was consistent with the previous image of kaolinite particle as shown in Figure
72 The increased c-spacing of 10 Aring in stacks of kaolinite particles was also reported in
the literature [197 199] and has been attributed to 21 type layer structures such as
smectite These mixed layer silicates ndash kaolinite (11) and smectite (21) affect the
electrokinetic properties of these particles when suspended in water Not only is the
surface charge of the kaolinite particles influenced by the presence of these 21 layer
particles these 21 layer structures may also correspond to a weak zone where the
particles will cleave and expose a 21 type layer structure at both faces of the kaolinite
particle as explained in Figure 74 This defect may have a significant effect on the
electrokinetic properties of kaolinite particles dominated by the silica tetrahedral sheet at
188
Figure 73- Lattice fringe pattern of kaolinite along 001 basal plane
72 Aring
10 Aring
189
Figure 74- Schematic diagram of kaolinite with mixed-layer silicate showing that after cleavage the kaolinite particle may consist of silica a tetrahedral sheet at both faces
21 clay mineral(Smectite)
11 clay mineral (Kaolinite)
After Breakage
190
both faces Out of 14 particles examined with HRTEM two particles showed this mixed
layer silicates of 21 type intercalated between the stacks of kaolinite bilayers
A third type of stacking was also observed with HRTEM imaging which shows a
c-spacing of 10 Aring as shown in Figure 75 This increased c-spacing of 10 Aring corresponds
to 21 type clay minerals such as smectite [197 199] There was another lattice fringe
observed at 37 Aring which may arise from the octahedral sheet of 21 type clay minerals
The co-existence of single smectite-type clay minerals with kaolinite particles will affect
its surface properties particularly its electrokinetic and rheological properties when the
particles are prepared in suspension Examination of the literature has revealed different
values of cation exchange capacity (CEC) for kaolinite from 36 to100 micro-moleg
depending on the source of kaolinite and type of counterions [30-32] This wide variation
in CEC among different samples of kaolinite may exist when the 21 type clay minerals
such as pyrophyllite with low CEC or smectite with high CEC are intermixed with
kaolinite particles [197] Ferris and Jepson [29] analyzed the same kaolinite sample as
was used in this dissertation research and found a very low or no definite cation exchange
capacity The implication is that the kaolinite used in this research may be intermixed
with traces of 21 pyrophyllite-like clay minerals with low CEC Despite the variation in
CEC for kaolinite there is a common consensus among researchers that kaolinite has
very small cation exchange capacity in contrast to some other clay minerals such as
smectite
The electrokinetic characterization of silica and gibbsite particles has revealed a
point of zero charge (PZC) at pH 2-3 and 8-9 respectively [15 209] It is expected that
191
Figure 75- HRTEM image showing a smectite layer
37 Aring
10 Aring
192
particles composed of bilayers of one silica sheet (silica tetrahedral sheet) and another
alumina sheet (alumina octahedral sheet) such as ideal particles having one silica face
and one alumina face kaolinite will have a PZC which would be the average of pure
silica particles and pure alumina particles ie about pH 5-6 However many researchers
have reported a lower PZC at pH lt 3 for kaolinite as determined by electrophoresis [29
39-45 52] It is evident that the electrophoresis technique for surface charge
characterization is compromised by the heterogeneous charge character and platy shape
of kaolinite particles and does not reveal the true surface charge characteristics of
kaolinite In addition to the above the surface charge properties of kaolinite particles will
also be compromised by the presence of 21 clay layer defects which may be present in
the kaolinite structure (Figure 73) or by 21 clay particles (Figure 75) present as trace
impurities as revealed from the HRTEM results Ma and Eggleton [197] have observed
kaolinite stacks ended on one side or both sides by a 21 type structure The presence of
these 21 structures in the kaolinite sample will increase the silica dominance in kaolinite
and thereby may shift the PZC towards a lower pH value The surface charge properties
of kaolinite will therefore be affected by the presence of these 21 layer clay minerals
The potentiometric titration is another technique to measure surface charge of
particles which gave relatively higher PZC for kaolinite as pH 472 These results are in
good agreement with the PZC values reported in the literature as pH 43 [34] pH 45 [38]
and pH 46 [161] Though a bit higher PZC is obtained by potentiometric titration this
value is still lower than the expected PZC of pH 5-6 These results indicate the presence
of other 21 layer clay minerals which may be present with kaolinite affecting its surface
charge properties and lowering its PZC
193
It is clear from this study and other published studies that the surface charge
properties of kaolinite might be complicated by the presence of small amounts of 21
layer clay minerals HRTEM seems to be a reliable method to identify the surface layer
types of kaolinite In order to better understand the surface chemistry of kaolinite it is
highly important to quantify the presence of 21 layer clay minerals using HRTEM
75
HRTEM is an appropriate and reliable technique to describe defect structures and
impurities in kaolinite samples The lattice fringe images of Cornwall kaolinite from
HRTEM always showed that the kaolinite occurs as a bilayer structure with c-spacing of
72 Aring Occasionally there were defects such as bending of layers observed in the stacks
of kaolinite The 21 type clay minerals were also revealed in this study with increased c-
spacing of 10 Aring These 21 type clay minerals trilayer structure seem to exist in between
bilayers of kaolinite or as single particles The surface chemistry of kaolinite particularly
may be affected by the presence of even a small amount of 21 type clay minerals and
may shift the PZC of kaolinite towards lower pH Further investigation should be
conducted in order to quantify the effect of trilayer clay minerals in primary kaolinite
particles
Summary
CHAPTER 8
CONCLUSIONS AND FUTURE RESEARCH
The major objective of this dissertation research was to investigate the surface
chemistry of kaolinite particles in regards to composition morphology surface charge
properties of its faces rheological properties and particle interactions Last but not least
was the identification of the silica face the alumina face and the edge surface of kaolinite
particles In this regard all objectives have been achieved using a high purity kaolinite
sample from Cornwall UK In particular the following summaries describe the
accomplishments and contributions
A pool of advanced analytical techniques utilized in this dissertation research
such as XRF XRD SEM AFM FTIR and ISS has explored the detailed morphological
and surface chemistry features of kaolinite X-ray fluorescence (XRF) spectrometry
determined the chemical composition of kaolinite and thereby predict the structural
formula as (Si394Al006)IV(Al399Fe001)VIO10(OH)8Fe001Ca001Mg001K002Na0005 X-ray
diffraction study (XRD) showed that kaolinite was the dominant mineral phase with some
minor impurities of quartz and anatase Scanning electron microscopy (SEM) and atomic
force microscopy (AFM) confirmed the platy nature and hexagonal to subhedral shape of
kaolinite The median diameter and thickness of kaolinite from Cornwall UK were
195
determined as 600 nm and 11 nm respectively The surface chemistry features as
revealed by Fourier transform infrared spectroscopy (FTIR) determined the OH group
vibrations of the kaolinite surface from the inner OH group stretching vibrations at 3620
cm-1 and inner-surface OH group vibrations at 3691 cm-1 3668 cm-1 and 3651 cm-1 Low
energy ion scanning spectroscopy (ISS) revealed an overlapping band of SiAl elements
detected from both the silica and alumina faces of kaolinite
AFM surface force measurements revealed that the silica tetrahedral face of
kaolinite is negatively charged at pH gt 4 whereas the alumina octahedral face of
kaolinite is positively charged at pH lt 6 and negatively charged at pH gt 8 The results
suggest that the iso-electric point of the silica tetrahedral face is at pH lt 4 and that the
iso-electric point of the alumina octahedral face lies between pH 6 and 8 These results
contradict the generally accepted view that basal plane surfaces of kaolinite carry a
permanent negative charge due to minor substitution of Al3+ for Si4+ in the silica
tetrahedral layer and suggest some surface charge dependency of the two faces with
respect to solution pH
The electrokinetic properties of kaolinite are complicated by its anisotropic
features ndash nonuniform surface charge densities on the faces (the silica face the alumina
face and the edge surfaces) and its platy-shaped Using Smoluchowskirsquos classical model
the iso-electric point for kaolinite was determined at less than pH 3 The surface charge
properties of kaolinite were also determined experimentally using traditional titration
techniques such as M-R titration and potentiometric titration and using a new technique
by surface force measurements with atomic force microscopy The point of zero charge
was determined as pH 45 by titration techniques which is in good agreement with the
196
iso-electric point in between pH 4 and 5 determined by surface force measurements It
was found that the surface charge densities of kaolinite particles are better characterized
by titration and surface force measurements
Results from kaolinite particle interactions indicate that the silica facendashalumina
face interaction is dominant for kaolinite particle aggregation at low pH pH4 This facendash
face association increases the stacking of kaolinite layers and thereby promotes the
edgendashface (edgendashsilica face and edgendashalumina face) and facendashface (silica facendashalumina
face) associations with increasing pH and hence the maximum shear yield stress at pH 5-
55 The facendashface association at low pH has been confirmed from cryo-SEM images of
kaolinite aggregates taken from suspension which show that the particles are mostly
organized in a facendashface and edgendashface manner At higher pH conditions the cryo-SEM
images of the kaolinite aggregates reveal a lower degree of consolidation and the edgendash
edge association is evident
Crystal lattice resolution images reveal the hexagonal surface lattice for both the
silica and alumina faces of kaolinite Analysis of the silica face of kaolinite showed that
the hexagonal surface lattice ring of oxygen atoms had a periodicity of 050 plusmn 004 nm
between neighboring oxygen atoms which is in good agreement with the surface lattice
structure of the mica basal plane The center of the hexagonal ring of oxygen atoms is
vacant Analysis of the alumina face of kaolinite showed that the hexagonal surface
lattice ring of hydroxyls surround a hydroxyl in the center of the ring The atomic spacing
between neighboring hydroxyls was determined as 036 plusmn 004 nm
High resolution transmission electron microscopy investigation of kaolinite has
indicated that kaolinite is indeed composed of bilayers of silica tetrahedral sheet
197
covalently bonded to an alumina octahedral sheet The stacked bilayers have a c-spacing
of 72 Aring Occasionally defects in the form of bending of bilayers was observed in the
stack of bilayers composing a kaolinite particle HRTEM has also indicated that some
particles have a 21 type clay mineral in the stack of bilayers with an increased c-spacing
of 10 Aring under these circumstances
As noted in previous paragraphs a number of important contributions have been
made but perhaps most important has been the protocol of surface force measurements
for kaolinite particles It is expected that this protocol can be used to good advantage for
the surface clay study of other clay minerals in future research
During this dissertation research we have found that direct measurement of the
surface charge densities of the edge surface though highly desired is difficult at the
moment due to their nanosize exposure Preparation of such edge surface is difficult It is
our hope that future research will focus in this direction to develop new techniques for
preparing edge surfaces of kaolinite with no contamination from basal plane surfaces
This would help researchers to better understand the surface chemistry of kaolinite and
to better control their surface properties
Another aspect of this dissertation research was to investigate the electrophoretic
motion of kaolinite particles This objective was met with the design of appropriate
experimental techniques such as potentiometric titration and surface force measurements
An appropriate theoretical model to describe the electrophoretic mobilities of such
anisotropic particles is highly desired and a good review of ongoing work is already
discussed in this dissertation The review should provide a framework for the
198
development of such a procedure to study the electrokinetic properties of kaolinite and
other clay minerals in the future
Finally with regard to future research in addition to the surface charge
characteristics of clay surfaces the hydrophobic properties of clay faces should be
considered For many engineered systems such as flotation the surface wetting
characteristics along with surface charge properties will be equally important in order to
understand and control the behavior of these particles in a flotation system The
fundamental wetting characteristics of different clay faces minus the silica face the alumina
face and the edge surface would help us understand and better control the behavior of
clay particles in flotation separations as well as in other applications where suspensions
and pastes of clay particles are used
REFERENCES
[1] HH Murray Applied Clay Science 5 (1991) 379
[2] LE Taylor JA Hillier AJ Benham AC MacKenzie S British Geological World Mineral Production 1999-2003 British Geological Survey Nottingham 2005
[3] Y Hu X Liu Minerals Engineering 16 (2003) 1279
[4] Y-h Hu W Sun X-w Liu D-z Wang Transactions of Nonferrous Metals Society of China 13 (2003) 1430
[5] Y Hu H Jiang D Wang Minerals Engineering 16 (2003) 1221
[6] Y Hu X Liu Z Xu Minerals Engineering 16 (2003) 219
[7] Y Hu S Wei J Hao JD Miller K Fa International Journal of Mineral Processing 76 (2005) 163
[8] W-q Qin G-z Qiu Y-h Hu Transactions of Nonferrous Metals Society of China 13 (2003) 679
[9] L-y Xia H Zhong G-y Liu Z-q Huang Q-w Chang X-g Li Transactions of Nonferrous Metals Society of China 19 (2009) 446
[10] RJ Chalaturnyk JD Scott B Ozum Pet Sci Technol 20 (2002) 1025
[11] Fine Tailings Fundamentals Consortium Advances in Oil Sands Tailings Research Alberta Dept of Energy Oil Sands and Research Division Alberta Canada 1995
[12] ME Schrader GI Loeb Editors Modern Approaches to Wettability Theory and Applications Plenum 1992
[13] K Ma AC Pierre Clays and Clay Minerals 47 (1999) 522
[14] E Wieland W Stumm Geochim Cosmochim Acta 56 (1992) 3339
200
[15] JD Miller J Nalaskowski B Abdul H Du Canadian Journal of Chemical Engineering 85 (2007) 617
[16] HV Olphen An Introduction to Clay Colloid Chemistry For Clay Technologists Geologists and Soil Scientists Interscience New York 1963
[17] WA Deer RA Howie J Zussman An Introduction to the Rock-Forming Minerals Wiley New York 1966
[18] GH Bolt MGM Bruggenwert Editors Developments in Soil Science Vol 5A Soil Chemistry Pt A Basic Elements Elsevier 1976
[19] GH Bolt Editor Developments in Soil Science Vol 5B Soil Chemistry B Physicochemical Models Elsevier Scientific Publishing Company 1979
[20] JB Dixon SB Weed Editors Minerals in Soil Environments Soil Sci Soc Am 1977
[21] DJ Greenland MHB Hayes Editors The Chemistry of Soil Constituents Wiley 1978
[22] GW Brindley G Brown Editors Mineralogical Society Monograph No 5 Crystal Structures of Clay Minerals and Their X-ray Identification Mineralogical Society 1980
[23] RK Schofield HR Samson Discussions of the Faraday Society 18 (1954) 135
[24] J Lyklema Fundamentals of Interface and Colloid Science Volume II Solid-Liquid Interfaces Academic Press 1995
[25] JA Kittrick Am Mineral 51 (1966) 1457
[26] B Rand IE Melton Journal of Colloid and Interface Science 60 (1977) 308
[27] RK Schofield Br Clayworker 47 (1938) 208
[28] AW Flegmann JW Goodwin RH Ottewill Proceedings of the British Ceramic Society (1969) 31
[29] AP Ferris WB Jepson Journal of Colloid and Interface Science 51 (1975) 245
[30] NC Brady The Nature and Properties of Soils 9th Ed Macmillan 1984
[31] F Adams Editor Agronomy No 12 Soil Acidity and Liming 2nd Ed American Society of Agronomy Inc Crop Science Society of America Inc Soil Science Society of America Inc 1984
201
[32] RK Schofield J Soil Sci 1 (1949) 1
[33] PW Schindler P Liechti JC Westall Neth J Agric Sci 35 (1987) 219
[34] PV Brady RT Cygan KL Nagy Journal of Colloid and Interface Science 183 (1996) 356
[35] PV Brady RT Cygan KL Nagy in AJ Everett (Ed) Adsorption of Metals by Geomedia Academic Press San Diego 1998 p 371
[36] BK Schroth G Sposito Clays and Clay Minerals 45 (1997) 85
[37] F Huertas L Chou R Wollast Geochimica et Cosmochimica Acta (1999) 3261
[38] MM Motta CF Miranda Soil Science Society of America Journal 53 (1989) 380
[39] RW Smith Y Narimatsu Miner Eng 6 (1993) 753
[40] JM Cases C Touret-Poinsignon D Vestier C R Acad Sci Ser C 272 (1971) 728
[41] DJA Williams KP Williams Journal of Colloid and Interface Science 65 (1978) 79
[42] SB Johnson DR Dixon PJ Scales Colloids and Surfaces A Physicochemical and Engineering Aspects 146 (1999) 281
[43] SK Nicol RJ Hunter Australian Journal of Chemistry 23 (1970) 2177
[44] AC Pierre K Ma J Mater Sci 32 (1997) 2937
[45] J Yuan RJ Pruett Minerals and Metallurgical Processing 15 (1998) 50
[46] MS Ccedilelik in S Fernando Wypych and Kestur Gundappa (Eds) Interface Science and Technology Elsevier 2004 p 57
[47] PF Luckham S Rossi Advances in Colloid and Interface Science 82 (1999) 43
[48] N Street Australian Journal of Chemistry 9 (1956) 467
[49] SB Johnson AS Russell PJ Scales Colloids and Surfaces A Physicochemical and Engineering Aspects 141 (1998) 119
[50] SB Johnson GV Franks PJ Scales DV Boger TW Healy International Journal of Mineral Processing 58 (2000) 267
202
[51] I Sondi O Milat V Pravdic Journal of Colloid and Interface Science 189 (1997) 66
[52] C Chassagne F Mietta JC Winterwerp Journal of Colloid and Interface Science 336 (2009) 352
[53] F Franco LA Perez-Maqueda JL Perez-Rodriguez Journal of Colloid and Interface Science 274 (2004) 107
[54] J Cuadros T Dudek Clays and Clay Minerals 54 (2006) 1
[55] E Balan AM Saitta F Mauri G Calas American Mineralogist 86 (2001) 1321
[56] E Burdukova GC Van Leerdam FE Prins RG Smeink DJ Bradshaw JS Laskowski Miner Eng 21 (2008) 1020
[57] CT Johnston Clay Miner 45 (2010) 245
[58] M Zbik RSC Smart Minerals Engineering 15 (2002) 277
[59] M Zbik RSC Smart Clays Clay Miner 46 (1998) 153
[60] DW Thompson JJ MacMillan DA Wyatt Journal of Colloid and Interface Science 82 (1981) 362
[61] M Zbik RSC Smart Clays for Our Future Proceedings of the International Clay Conference 11th Ottawa Ont June 15-21 1997 (1997) 361
[62] BR Bickmore KL Nagy PE Sandlin TS Crater American Mineralogist 87 (2002) 780
[63] CC Harvey HH Murray Appl Clay Sci 11 (1997) 285
[64] CB Maxwell Z Zhang HH Murray Thiele Kaolin Company USA Patent Application 6379452 US 2002 p 5
[65] HH Murray Clays Clay Minerals 10 (1963) 291
[66] HH Murray International Journal of Mineral Processing 7 (1980) 263
[67] HH Murray Kirk-Othmer Encyclopedia of Chemical Technology 5th Ed 6 (2004) 685
[68] MS Prasad KJ Reid HH Murray Applied Clay Science 6 (1991) 87
[69] TM Herrington AQ Clarke JC Watts Colloids and Surfaces 68 (1992) 161
203
[70] B Rand IE Melton Nature (London United Kingdom) 257 (1975) 214
[71] AE James DJA Williams Advances in Colloid and Interface Science 17 (1982) 219
[72] V Gupta JD Miller Journal of Colloid and Interface Science 344 (2010) 362
[73] VC Farmer Science (Washington DC U S) 145 (1964) 1189
[74] JM Cases P Cunin Y Grillet C Poinsignon J Yvon Clay Miner 21 (1986) 55
[75] MS Zbik RL Frost Y-F Song Journal of Colloid and Interface Science 319 (2008) 169
[76] C Liu X Li F Xu PM Huang Soil Science and Plant Nutrition (Tokyo Japan) 49 (2003) 17
[77] JI Bidwell WB Jepson GL Toms Clay Minerals 8 (1970) 445
[78] LS Birks X-Ray Spectrochemical Analysis (Chemical Analysis Vol 11) 2nd Ed Wiley-Interscience 1969
[79] R Jenkins Introduction to X-Ray Spectrometry Heyden 1977
[80] R Jenkins X-Ray Fluorescence Spectrometry ACS 1978
[81] R Jenkins Chemical Analysis Vol 99 X-Ray Fluorescence Spectrometry John Wiley and Sons 1988
[82] R Jenkins X-Ray Fluorescence Spectrometry 2nd Ed In Chem Anal (N Y) 1999 152 Wiley 1999
[83] R Tertian F Claisse Principles of Quantitative X-Ray Fluorescence Analysis Heyden 1982
[84] HP Klug LE Alexander X-Ray Diffraction Procedures for Polycrystalline and Amorphous Materials 2nd Ed Wiley-Interscience 1974
[85] BD Cullity SR Stock Elements of X-Ray Diffraction 3rd Ed Prentice Hall 2001
[86] DL Bish JE Post Am Mineral 78 (1993) 932
[87] DL Bish Soil Sci Soc Am Proc 1994 p 267
204
[88] DM Moore RC Reynolds X-ray Diffraction and the Identification and Analysis of Clay Minerals 2nd Ed Oxford Univ Press 1997
[89] OC Wells A Boyde E Lifshin A Rezanowich Scanning Electron Microscopy McGraw-Hill 1974
[90] G Binnig CF Quate C Gerber Physical Review Letters 56 (1986) 930
[91] MF Hochella Jr Reviews in Mineralogy 23 (1990) 87
[92] SM Clark JD Baldeschwieler Rev Sci Instrum 64 (1993) 904
[93] PK Hansma B Drake D Grigg CB Prater F Yashar G Gurley V Elings S Feinstein R Lal Journal of Applied Physics 76 (1994) 796
[94] N Kato I Suzuki H Kikuta K Iwata Rev Sci Instrum 66 (1995) 5532
[95] GM Bancroft JR Brown WS Fyfe Anal Chem 49 (1977) 1044
[96] AR Gonzalez-Elipe JP Espinos G Munuera J Sanz JM Serratosa J Phys Chem 92 (1988) 3471
[97] H Seyama M Soma Kokuritsu Kogai Kenkyusho Kenkyu Hokoku 111 (1988) p 125
[98] JW Stucki CB Roth WE Baitinger Clays Clay Miner 24 (1976) 289
[99] MF Hochella Jr Rev Mineral 18 (1988) 573
[100] WP Inskeep EA Nater PR Bloom DS Vandervoort MS Erich Geochim Cosmochim Acta 55 (1991) 787
[101] RB Borade A Adnot S Kaliaguine J Catal 126 (1990) 26
[102] MH Koppelman AB Emerson JG Dillard Clays Clay Miner 28 (1980) 119
[103] RK Vempati RH Loeppert DL Cocke Solid State Ionics 38 (1990) 53
[104] RK Vempati RH Loeppert DC Dufner DL Cocke Soil Sci Soc Am J 54 (1990) 695
[105] AW Czanderna Editor Methods and Phenomena Their Applications in Science and Technology Vol 1 Methods of Surface Analysis Elsevier 1975
[106] EG Brame Jr JG Grasselli Editors Practical Spectroscopy Series Vol 1 Pt A Infrared and Raman Spectroscopy Marcel Dekker 1977
205
[107] RG Messerschmidt MA Harthcock Editors Practical Spectroscopy Series Vol 6 Infrared Microspectroscopy Theory and Applications Marcel Dekker Inc 1988
[108] NJ Everall JM Chalmers A Local S Allen Vib Spectrosc 10 (1996) 253
[109] EG Brame Jr JG Grasselli Editors Practical Spectroscopy Series Vol 1 Pt B Infrared and Raman Spectroscopy Dekker 1977
[110] EG Brame Jr JG Grasselli Editors Practical Spectroscopy Series Vol 1 Pt C Infrared and Raman Spectroscopy Dekker 1977
[111] NJ Harrick Am Lab (Fairfield Conn) 20 (1988) 98
[112] L Hupka Particle-Surface Interactions in Post-Lap Cleaning of AluminaTitanium Carbide Wafers The University of Utah Salt Lake City 2006
[113] AD Karathanasis Soil Science Society of America Book Series 5 (2008) 465
[114] C Ma RA Eggleton Clays and Clay Minerals 47 (1999) 174
[115] VC Farmer Clay Miner 33 (1998) 601
[116] HH Murray Appl Clay Sci 17 (2000) 207
[117] KL Konan C Peyratout J-P Bonnet A Smith A Jacquet P Magnoux P Ayrault Journal of Colloid and Interface Science 307 (2007) 101
[118] J Drelich J Long Z Xu J Masliyah CL White J Colloid Interface Sci 303 (2006) 627
[119] S Veeramasuneni MR Yalamanchili JD Miller J Colloid Interface Sci 184 (1996) 594
[120] I Larson CJ Drummond DYC Chan F Grieser Langmuir 13 (1997) 2109
[121] MR Yalamanchili S Veeramasuneni MAD Azevedo JD Miller Colloids Surf A 133 (1998) 77
[122] GV Franks L Meagher Colloids Surf A 214 (2003) 99
[123] S Assemi J Nalaskowski JD Miller WP Johnson Langmuir 22 (2006) 1403
[124] JI Bidwell WB Jepson GL Toms Clay Minerals 8 (1970) 445
[125] J Nalaskowski J Drelich J Hupka JD Miller Langmuir 19 (2003) 5311
206
[126] WA Ducker TJ Senden RM Pashley Nature (London) 353 (1991) 239
[127] J Drelich J Long A Yeung Can J Chem Eng 85 (2007) 625
[128] X Yin J Drelich Langmuir 24 (2008) 8013
[129] V Meacutedout-Maregravere Journal of Colloid and Interface Science 228 (2000) 434
[130] L Bergstrom Advances in Colloid and Interface Science 70 (1997) 125
[131] T Arai D Aoki Y Okabe M Fujihira Thin Solid Films 273 (1996) 322
[132] BV Zhmud J Sonnefeld L Bergstrom Colloids Surf A 158 (1999) 327
[133] I Sokolov QK Ong H Shodiev N Chechik D James M Oliver J Colloid Interface Sci 300 (2006) 475
[134] M Kosmulski Chemical Properties of Material Surfaces In Surfactant Sci Ser 2001 102 Marcel Dekker Inc 2001
[135] R Raiteri B Margesin M Grattarola Sensors and Actuators B Chemical 46 (1998) 126
[136] Z Zhou WD Gunter Clays and Clay Minerals 40 (1992) 365
[137] Z Fu MM Santore Langmuir 14 (1998) 4300
[138] CC Harvey G Lagaly in BKG Theng Faiumlza Bergaya L Gerhard (Eds) Developments in Clay Science Elsevier 2006 p 501
[139] H H Murray JE Kogel Applied Clay Science 29 (2005) 199
[140] HH Murray Applied Clay Science (1977) 29
[141] HH Murray JE Kogel Applied Clay Science 29 (2005) 199
[142] N Street AS Buchanan Australian Journal of Chemistry 9 (1956) 450
[143] E Tombaacutecz M Szekeres Applied Clay Science 34 (2006) 105
[144] C Galassi AL Costa P Pozzi Clays and Clay Minerals 49 (2001) 263
[145] G Sposito Environ Sci Technol 32 (1998) 2815
[146] W Stumm Chemistry of the Solid-Water Interface Processes at the Mineral-Water and Particle-Water Interface in Natural Systems Wiley New York 1992
207
[147] AL Mular RB Roberts Transactions of the Canadian Institute of Mining and Metallurgy 69 (1966) 438
[148] RJ Hunter Editor Colloid Science Zeta Potential in Colloid Science Principles and Applications Academic Press 1981
[149] HJ Butt K Graf M Kappl Physics and Chemistry of Interfaces Wiley-VCH 2003
[150] JH Masliyah S Bhattacharjee Electrokinetic and Colloid Transport Phenomena John Wiley amp Sons Inc 2006
[151] SL Carnie GM Torrie in SA Rice I Prigogine (Eds) Advances in Chemical Physics 2007 p 141
[152] L Blum in SA Rice I Prigogine (Eds) Advances in Chemical Physics 2007 p 171
[153] M Quesada-Peacuterez E Gonzaacutelez-Tovar A Martiacuten-Molina M Lozada-Cassou R Hidalgo-Aacutelvarez ChemPhysChem 4 (2003) 234
[154] DC Henry Proc R Soc London Ser A 133 (1931) 106
[155] JL Anderson Journal of Colloid and Interface Science 105 (1985) 45
[156] MC Fair JL Anderson Journal of Colloid and Interface Science 127 (1989) 388
[157] JD Sherwood HA Stone Phys Fluids 7 (1995) 697
[158] B Braggs D Fornasiero J Ralston R St Smart Clays and Clay Minerals 42 (1994) 123
[159] GK Korpi Electrokinetic and Ion Exchange Properties of Aluminum Oxide and Hydroxides 1965
[160] M Alvarez-Silva A Uribe-Salas M Mirnezami JA Finch Minerals Engineering 23 (2010) 383
[161] AC Riese Adsorption of Radium and Thorium onto Quartz and Kaolinite A Comparison of SolutionSurface Equilibria Models Colorado School of Mines Golden 1982
[162] Z Xie JV Walther Geochim Cosmochim Acta 56 (1992) 3357
208
[163] V Gupta JD Miller AV Nguyen Conference of Metallurgists Proceedings MetSoc Vancouver BC 2010
[164] NR OBrien Clays and Clay Minerals Proceedings of the Conference 19 (1971) 353
[165] A Casagrande Boston Society of Civil Engineers Proceedings 1940 p 72
[166] TW Lambe American Society of Civil Engineers Proceedings 1953 p 1
[167] TK Tan 4th International Conference on Soil Mechanics and Foundation Engineering Proceedings 1958 p 87
[168] IT Rosenqvist Norwegian Geotechnical Institute Proceedings 1963 p 1
[169] IT Rosenqvist American Society of Civil Engineers Proceedings 1959 p 31
[170] MS Zbik RSC Smart GE Morris Journal of Colloid and Interface Science 328 (2008) 73
[171] MS Zbik RL Frost Journal of Colloid and Interface Science 339 (2009) 110
[172] AV Nguyen HJ Schulze Colloidal Science of Flotation Marcel Dekker Inc 2004
[173] RB Secor CJ Radke Journal of Colloid and Interface Science 103 (1985) 237
[174] FRC Chang G Sposito Journal of Colloid and Interface Science 163 (1994) 19
[175] M Zbik RG Horn Colloids and Surfaces A Physicochemical and Engineering Aspects 222 (2003) 323
[176] TR Albrecht CF Quate Journal of Vacuum Science amp Technology A Vacuum Surfaces and Films 6 (1988) 271
[177] Y Sugawara T Ishizaka S Morita Journal of Vacuum Science amp Technology B Microelectronics and Nanometer Structures 9 (1991) 1092
[178] TR Albrecht CF Quate Journal of Applied Physics 62 (1987) 2599
[179] SAC Gould B Drake CB Prater AL Weisenhorn S Manne HG Hansma PK Hansma J Massie M Longmire et al Journal of Vacuum Science amp Technology A Vacuum Surfaces and Films 8 (1990) 369
[180] Y Gan EJ Wanless GV Franks Surface Science 601 (2007) 1064
209
[181] B Drake R Hellmann American Mineralogist 76 (1991) 1773
[182] F Ohnesorge G Binnig Science (Washington DC United States) 260 (1993) 1451
[183] G Meyer NM Amer Applied Physics Letters 56 (1990) 2100
[184] B Drake CB Prater AL Weisenhorn SA Gould TR Albrecht CF Quate DS Cannell HG Hansma PK Hansma Science (New York NY) 243 (1989) 1586
[185] H Hartman G Sposito A Yang S Manne SAC Gould PK Hansma Clays Clay Miner 38 (1990) 337
[186] H Lindgreen J Garnaes F Besenbacher E Laegsgaard I Stensgaard Clay Minerals 27 (1992) 331
[187] AL Weisenhorn JE Mac Dougall SAC Gould SD Cox WS Wise J Massie P Maivald VB Elings GD Stucky PK Hansma Science (Washington DC United States) 247 (1990) 1330
[188] PA Johnsson CM Eggleston MF Hochella American Mineralogist 76 (1991) 1442
[189] Y Gan Surface Science Reports 64 (2009) 99
[190] FJ Wicks K Kjoller GS Henderson Canadian Mineralogist 30 (1992) 83
[191] GA Vrdoljak GS Henderson JJ Fawcett FJ Wicks American Mineralogist 79 (1994) 107
[192] K Kumai K Tsuchiya T Nakato Y Sugahara K Kuroda Clay Sci 9 (1995) 311
[193] TG Sharp PI Oden PR Buseck Surf Sci 284 (1993) L405
[194] FJ Wicks K Kjoller RK Eby FC Hawthorne GS Henderson GA Vrdoljak Can Mineral 31 (1993) 541
[195] H Cai AC Hillier KR Franklin CC Nunn MD Ward Science (Washington D C) 266 (1994) 1551
[196] RWG Wyckoff Crystal Structures John Wiley amp Sons New York 1968
[197] C Ma RA Eggleton Clays and Clay Minerals 47 (1999) 181
[198] TF Bates Electron-Opt Invest Clays (1971) 109
210
[199] M Amouric J Olives Clays and Clay Minerals 46 (1998) 521
[200] T Kogure A Inoue Am Mineral 90 (2005) 85
[201] GD Guthrie Jr DR Veblen ACS Symposium Series 415 (1989) 75
[202] JG Thompson RL Withers Clays and Clay Minerals 35 (1987) 237
[203] M Amouric C Parron L Casalini Electron Microsc 1994 Proc Int Congr Electron Microsc 13th 2B (1994) 1285
[204] K Yada K Iishi Resumes Commun - Conf Int Phys Chim Miner Amiante 3rd (1975) 3 9
[205] K Yada Can Mineral 17 (1979) 679
[206] J Olives M Amouric R Perbost Clays and Clay Minerals 48 (2000) 282
[207] JH Anh DR Peacor Am Mineral 72 (1987) 353
[208] A Plancon Clay Miner 36 (2001) 1
[209] M Kosmulski Journal of Colloid and Interface Science 337 (2009) 439

Copyright Vishal Gupta 2011
All Rights Reserved
T h e U n i v e r s i t y o f U t a h G r a d u a t e S c h o o l
STATEMENT OF DISSERTATION APPROVAL
The dissertation of Vishal Gupta
has been approved by the following supervisory committee members
Jan D Miller Chair 11232010
Date Approved
Vladimir Hlady Member 11232010
Date Approved
Sivaraman Guruswamy Member 11232010
Date Approved
Michael L Free Member 11232010
Date Approved
Xuming Wang Member 11232010
Date Approved
and by Jan D Miller Chair of
the Department of Metallurgical Engineering
and by Charles A Wight Dean of The Graduate School
ABSTRACT
Kaolinite is both a blessing and a curse As an important industrial mineral
commodity kaolinite clays are extensively used in the paper ceramic paint plastic and
rubber industries In all these applications the wettability aggregation dispersion
flotation and thickening of kaolinite particles are affected by its crystal structure and
surface properties It is therefore the objective of this research to investigate selected
physical and surface chemical properties of kaolinite specifically the surface charge of
kaolinite particles
A pool of advanced analytical techniques such as XRD XRF SEM AFM FTIR
and ISS were utilized to investigate the morphological and surface chemistry features of
kaolinite Surface force measurements revealed that the silica tetrahedral face of kaolinite
is negatively charged at pH gt 4 whereas the alumina octahedral face of kaolinite is
positively charged at pH lt 6 and negatively charged at pH gt 8
Based on electrophoresis measurements the apparent iso-electric point for
kaolinite particles was determined to be less than pH 3 In contrast the point of zero
charge was determined to be pH 45 by titration techniques which corresponds to the iso-
electric point of between pH 4 and 5 as determined by surface force measurements
Results from kaolinite particle interactions indicate that the silica facendashalumina
face interaction is dominant for kaolinite particle aggregation at low and intermediate pH
values which explains the maximum shear yield stress at pH 5-55
iv
Lattice resolution images reveal the hexagonal lattice structure of these two face
surfaces of kaolinite Analysis of the silica face of kaolinite showed that the center of the
hexagonal ring of oxygen atoms is vacant whereas the alumina face showed that the
hexagonal surface lattice ring of hydroxyls surround another hydroxyl in the center of the
ring
High resolution transmission electron microscopy investigation of kaolinite has
indicated that kaolinite is indeed composed of silicaalumina bilayers with a c-spacing of
72 Aring
The surface charge densities of the silica face the alumina face and the edge
surface of kaolinite all influence particle interactions and thereby affect the mechanical
properties of kaolinite suspensions The improved knowledge of kaolinite surface
chemistry from this dissertation research provides a foundation for the development of
improved process strategies for both the use and disposal of clay particles such as
kaolinite
To my family and my wife Priyanka
CONTENTS
ABSTRACT iii
LIST OF TABLES ix
LIST OF FIGURES x
ACKNOWLEDGMENTS xv
CHAPTER
1 INTRODUCTION 1
11 Review of Literature 8 12 Clay Mineralogy 9
121 Bilayer Clay Minerals (11) 9 122 Triple Layer Clay Minerals (21) 12
13 Kaolinite Structure 14 14 Kaolinite Chemistry 14 15 Kaolinite Optical and Physical Properties 16 16 Kaolinite Genesis 16 17 Surface Chemistry of Kaolinite 17 18 Overall Objective 20 19 Research Organization 21
2 CHARACTERIZATION OF KAOLINITE PARTICLES 24
21 Introduction 25 22 Materials and Methods 28
221 Sample Preparation 28 222 Surface Area 28 223 Chemical Composition 29
2231 Energy Dispersive Spectrometry (EDS) 29 2232 X-ray Fluorescence Spectroscopy (XRF) 30
224 Mineralogy 31 225 Kaolinite Particle Size and Thickness 33
2251 Scanning Electron Microscopy (SEM) 33 2252 Atomic Force Microscopy (AFM) 34
226 Surface Spectroscopy of Kaolinite 38
vii
2261 X-ray Photoelectron Spectroscopy (XPS) 39 2262 Ion Scattering Spectroscopy (ISS) 41 2263 Chemical Bonding ndash FTIR Spectroscopy 44
23 Results and Discussion 47 231 Mineralogy and Elemental Analysis 47 232 Structural Formula 47 233 Shape Size and Aspect Ratio 53 234 Surface Spectroscopy of Kaolinite 56
24 Summary 61
3 SURFACE FORCE MEASUREMENTS AT THE BASAL PLANES OF ORDERED KAOLINITE PARTICLES 63
31 Introduction 64 32 Materials and Methods 68
321 Sample Preparation 68 322 Substrate Preparation 68 323 Atomic Force Microscopy 69 324 DLVO (Derjaguin-Landau-Verwey-Overbeek) Model 72
33 Results and Discussion 76 331 Interaction Forces at Reference Substrates 76 332 Interaction Forces at Kaolinite Faces 82 333 Surface Potential and Surface Charge 88
34 Summary 92
4 ELECTROKINETICS AND TITRATION OF KAOLINITE PARTICLES 94
41 Introduction 95 42 Materials and Methods 96
421 Sample Preparation 96 422 Zeta-Potential Measurements 97 423 Mular-Roberts (M-R) Titration 98 424 Potentiometric Titration 98
43 Electrokinetic Theory 99 431 Electrophoresis in the Limit κa ≪ 1 111 432 Electrophoresis in the Limit κa ≫ 1 116
44 Results and Discussion 119 441 Zeta-Potential of Kaolinite by Electrophoresis 119 442 Mular-Roberts (M-R) Titration 122 443 Potentiometric Titration 124 444 Zeta-Potential of Kaolinite by Surface Force Measurements 126 445 Cation Exchange Capacity (CEC) 129
45 Summary 134
5 PARTICLE INTERACTIONS IN KAOLINITE SUSPENSIONS AND CORRESPONDING AGGREGATE STRUCTURES 135
viii
51 Introduction 136 52 Materials and Methods 141
521 Sample Preparation 141 522 Aggregate Size 142 523 Cryo-SEM 143 524 DLVO Model 144
53 Results and Discussion 147 531 Particle Interactions 148 532 Influence of Aspect Ratio 155 533 Influence of Electrical Double Layer Thickness 157 534 Aggregate Structure 157 535 Aggregate Size 162
54 Summary 165
6 CRYSTAL LATTICE IMAGING OF THE SILICA AND ALUMINA FACES OF KAOLINITE USING ATOMIC FORCE MICROSCOPY 167
61 Introduction 168 62 Materials and Methods 170
621 Sample Preparation 170 622 Substrate Preparation 171 623 Atomic Force Microscopy 172
63 Results and Discussion 173 64 Summary 180
7 HIGH RESOLUTION TRANSMISSION ELECTRON MICROSCOPY OF KAOLINITE 181
71 Introduction 181 72 Sample Preparation 183 73 Electron Microscopy 184 74 Results and Discussion 184 75 Summary 193
8 CONCLUSIONS AND FUTURE RESEARCH 194
REFERENCES 199
LIST OF TABLES
Table
11- World kaolin production [2]
Page
2
12- Classification of layered silicate minerals [22] 13
21- Chemical composition of kaolinite 50
22- Charge calculation of kaolinite based on a total of 28 negative charge in the crystal structure 52
31- Experimental interaction forces and the interaction range measured between silicon nitride tip and the substrates 80
32- Experimental interaction forces and the interaction range measured between silicon nitride tip and the two faces of kaolinite 86
41- Review of literature for iso-electric point of kaolinite by different electrokinetic techniques 133
51- Hamaker constant for different interactions between kaolinite particles 145
LIST OF FIGURES
Figure Page
11-Side view (A) and top view (B) of kaolinite (001) surface structure The silica tetrahedra (red oxygen blue silicon) and the alumina octahedra (yellow aluminum green hydroxyl) bilayers thought to be bound together via hydrogen bonding are illustrated in (A)
6
12- Structure of the tetrahedral sheet showing (A) tetrahedral arrangement of Si and O (B) projection of tetrahedron on plane of sheet and (C) top view of tetrahedral sheet (dotted line unit cell area) Large grey circles represent oxygen atoms and the small red circles represent silicon atoms 10
13- Structure of the octahedral sheet showing (A) octahedral arrangement of Al or Mg with O or OH (B) projection of octahedron in two dimension and (C) top view of octahedral sheet (dotted line unit cell area) Large grey circles represent oxygen atoms large blue circles represent hydroxyl groups and small blue circles represent aluminum atoms 11
14- The structure of kaolinite clays 15
21- Structure of kaolinite showing the relative spacing between the layers 26
22- Schematic representation of AFM A mineral sample is positioned on a piezoelectric scanner which moves the sample in three-dimensions relative to the sensor (cantilever) The cantilever deflects due to attractive or repulsive forces between the tip and the sample Deflection of cantilever is monitored by a laser reflecting off the top and into a photodiode array 36
23- Sketch showing production of photoelectrons and auger electrons induced by X-ray bombardment (1) Incident X-ray Photon (2) Absorption of X-ray photon by core electron (3) Ejection of core-level photoelectron (4) Relaxation of higher shell electron into hole (5) Internally recombined energy of relaxation and (6) Ejection of Auger electron 40
24- Schematic diagram of ion scattering experiment 42
25- XRD spectra of kaolinite showing the mineralogy of kaolinite 48
xi
26- EDS spectra of kaolinite showing the elemental composition of kaolinite 49
27- (A) SEM (B) AFM images of kaolinite particles showing the pseudo-hexagonal shaped plate like particles 54
28- (a) Size distribution and (b) aspect ratio of St Austell Cornwall kaolinite particles using equivalent circle diameter based on SEM and AFM image analysis 55
29- ISS spectra on (a) silica face and (b) alumina face of kaolinite particles for various bombarding times 57
210- Ratio of aluminum to silicon peak areas from both silica and alumina face of kaolinite as a function of bombarding time 58
211- The experimental infra red spectrum of kaolinite obtained from (a) silica face and (b) alumina face 60
31- Schematic representation for the organization and ordering of kaolinite particles 67
32- SEM images of silicon nitride tip (A) oblique view at low magnification (B) plan view of pyramidal tip at high magnification (indicated by arrow) 71
33- Diagram showing the conical end portion of the silicon nitride tip with a spherical cap Angles α and β are the geometrical angle of the spherical cap at the tip apex and conical tip respectively with α + β = 900 D is the separation distance from the tip end to the substrate L is the distance between a differential surface section of the tip and the substrate r is the radius of the tip at a given vertical position R is the radius of the spherical cap at the tip apex 73
34- Topographic height images of Glass-Substrate (A1 and B1 above) and Fused Alumina-Substrate (A2 and B2) as obtained by AFM using a silicon nitride tip in contact mode The white cross-bars on the A1 and A2 images show the location where force measurements between the silicon nitride tip and the substrate were performed 77
35- Interaction forces measured between a silicon nitride tip and the Glass-Substrate (left) and the Fused Alumina-Substrate (right) in 1 mM KCl solution at increasing pH Five replicates (red-circle) of force curves at different locations on the substrate along with DLVO fit (black-line) are shown 78
36- Topographic height images of kaolinite particles deposited on glass (left) and fused alumina (right) substrates respectively as obtained by AFM using a silicon nitride tip in the contact mode The white cross-bars on A1 and A2 images show the locations where the forces between the silicon nitride tip and the kaolinite faces were measured 83
37- Interaction forces measured between silicon nitride tip and silica tetrahedral face (left) and alumina octahedral face (right) of kaolinite in 1 mM KCl solution at
xii
increasing pH Five replicates (red-circle) of force curves on different particles along with DLVO fit (black-line) curve are shown 84
38- (A) Surface potential and (B) surface charge of the Glass-Substrate and the Fused Alumina-Substrate as a function of pH The calculated surface potentials are compared to electrophoretic zeta potentials reported for silica and alumina by Kosmulski [134] 90
39- Surface potential and surface charge density of the silica face (A) and the alumina face (B) of kaolinite particles as a function of pH 91
41- Helmholtz and Gouy-Chapman model of the electric double layer 101
42- Stern model of the electric double layer 105
43- A spherical particle of radius a held stationary in a uniform electric field Einfin 109
44- Electrophoresis of kaolinite as a function of pH 120
45- Change in pH of the kaolinite suspensions as a function of final pH for kaolinite suspension Supporting electrolyte (KCl) concentration changes were from 10 to 100 mM 123
46- Surface charge densities of kaolinite particles as determined by acid-base potentiometric titration 125
47- Surface charge densities of kaolinite particles as determined by acid-base potentiometric titration applying equation (4-3) 127
48- The surface charge densities of the kaolinite edge surface and the two face surfaces (silica and alumina face) as a function of pH in 1 mM KCl solution 130
51- The structure of kaolinite along 010 edge surface showing a silica tetrahedral layer and an alumina octahedral layer 137
52- Shear yield stress of kaolinite suspensions as a function of pH for selected volume fractions (adapted from Johnson et al [49 50]) 139
53- Interaction energy profiles for different surface interactions of kaolinite particles 150
54- The predicted kaolinite edgendashedge edgendashsilica face (E-F(Si)) edgendashalumina face (E-Al(Si)) silica facendashsilica face (F(Si)-F(Si)) alumina facendashalumina face (F(Al)-F(Al)) and silica facendashalumina face (F(Si)-F(Al)) interaction energies scaled to maximum attractive energy for the silica facendashalumina face interaction Kaolinite particles with diameter 600 nm and thickness 112 nm in 1 mM KCl solution 151
xiii
55- Effect of aspect ratio on different face type interaction of kaolinite particles (a) low aspect ratio = 9 and (b) high aspect ratio = 165 in 1 mM KCl solution The symbols E F(Si) and F(Al) represent edge silica face and alumina face respectively 156
56- Effect of electric double layer thickness (κ-1) on different surface interactions for kaolinite particles with particle diameter 600 nm and thickness 112 nm at (a) κ-1 = 96 nm (1 mM KCl solution) and (b) κ-1 = 304 nm (10 mM KCl solution) The zeta-potentials of the silica face and the alumina face are assumed to be reduced by 30 with increasing ionic strength from 1 mM to 10 mM KCl solution The edge surface potential data for 10 mM KCl solution were taken from literature[41] The symbols E F(Si) and F(Al) represent edge silica face and alumina face surfaces respectively 158
57- The formation of aggregate structures in kaolinite suspensions as (a) dispersed (b) facendashface (c) edgendashface (d) edgendashedge and (e) a combination of (b) (c) and (d) depending on the solution chemistry of the suspension 160
58- Cryo-SEM micrographs of kaolinite aggregates at pH 3 5 7 and 9 at low (left) and high (right) magnification 161
59- Average aggregate size for a suspension of kaolinite particles as a function of pH 164
61- Crystal lattice imaging of mica substrate showing (A) Flattened height image (B) FFT spectra (C) FFT transformed flattened height image and (D) Zoomed-in image of (C) of scan area of 36 nm2 The six light spots in (D) shows the hexagonal ring of oxygen atoms around the dark spots representing a hole 174
62- (A) Topography and (B) Deflection images of kaolinite particle on the mica substrate 176
63- Crystal lattice imaging of the silica face of kaolinite showing (A) Theoretical atomic lattice structure (B) Flattened-low pass filtered height image (C) FFT spectra and (D) FFT transformed flattened-low pass filtered height image of scan size 36 nm2 The six black circles in (D) shows the hexagonal ring of oxygen atoms around the dark spots representing a hole 177
64- Crystal lattice imaging of alumina face of kaolinite showing (A) Theoretical atomic lattice structure (B) Flattened-low pass filtered height image (C) FFT spectra and (D) FFT transformed flattened-low pass filtered height image of (B) The seven black circles in (D) shows the hexagonal ring of hydroxyl atoms with a central inner hydroxyl atom 178
71- Low magnification TEM image showing the edges of kaolinite particles 185
72- Lattice fringe images of kaolinite showing c-spacing of 072 nm 186
73- Lattice fringe pattern of kaolinite along 001 basal plane 188
xiv
74- Schematic diagram of kaolinite with mixed-layer silicate showing that after cleavage the kaolinite particle may consist of silica a tetrahedral sheet at both faces 189
75- HRTEM image showing a smectite layer 191
ACKNOWLEDGMENTS
I would like to express my sincere appreciation to Professor Jan D Miller advisor
and chair of my supervisory committee for all his help support guidance and
encouragement during the course of this dissertation research Professor Miller has been a
great mentor with a beautiful vision for the research I have always learned from him
enjoyed discussion with him and I salute him for his endless knowledge in mineral
processing and surface chemistry I am always touched by his beautiful quotations
written on his office wall ldquoFear Godrdquo and ldquoWork Hardrdquo to mention a few It is my hope
to mimic Professor Miller all my life carry on his teachings and apply them in the real
world
Thanks are also extended to Dr V Hlady Dr S Guruswamy Dr M Free and
Dr X Wang for their positive disposition to be members of the supervisory committee
and their valuable advice and comments on some aspects of this work I have especially
learned a great deal in surface chemistry from Prof Hladyrsquos course in ldquoPhysical Nature
of Surfacesrdquo
Thanks are also extended to Dr Anh V Nguyen at University of Queensland
Brisbane Australia for giving me a chance to work on different areas of surface
chemistry A great deal of work in this dissertation was completed under his guidance
and support from his research group particularly from Drs J Stokes M Hampton and
O Ozdemir was wonderful in completing different tasks
xvi
Thanks are also due to Dr S K Biswal Scientist Institute of Minerals and
Materials Technology Bhubaneswar India for motivating me towards a PhD in the area
of mineral processing and surface chemistry Without his encouragement it would have
been impossible for me to come to Utah and relish this beautiful sea of minerals surface
chemistry
I would also like to thank Dr Jakub Nalaskowski Dr Shoeleh Assemi and all my
colleagues and friends for their continuous support particularly in the bad times and for
providing motivation to finish this dissertation
Finally I would thank the Department of Metallurgical Engineering at the
University of Utah for providing me this wonderful opportunity to work with researchers
all around the world I have learned so much from them whether about research or
everyday discussions which I will treasure for my life
Last but not least the successful completion of this dissertation research would
have not been possible without the major contribution of my wife for bringing good luck
in my life I would like to express my deep love and appreciation to my family for their
support all these years
CHAPTER 1
INTRODUCTION
Clays and clay minerals and their properties are important in geology geo-
technology agriculture and the production of engineered materials Of particular
importance are kaolins Kaolin is a rock term a clay mineral group and also an industrial
mineral commodity [1] The kaolin group of minerals includes kaolinite halloysite
dickite and nacrite The most important kaolin mineral is kaolinite of which physical and
chemical properties will be discussed in this research Kaolinite is white or near white
soft fine in particle size platy in shape low in surface area and chemically inert All of
these properties distinguish the kaolinite mineral as an important industrial commodity
In fact the significance of the kaolin industry is revealed from production statistics
presented in Table 11 which shows the continued demand for this important industrial
mineral
Kaolinite is primarily used in the paper industry where it is used both as filler and
as a coating for paper sheet Another larger user of kaolinite is the ceramic industry
particularly in whiteware sanitaryware insulators and refractories Kaolinite is also
calcined to produce special grades One such grade is produced by thermal treatment of
kaolinite to 6500C (just above the dehydroxylation temperature) to produce metakaolin
2
Table 11- World kaolin production [2]
Country 2005 2006 2007Albania 310 000 300 000 300 000Belgium 300 000 300 000 300 000Bulgaria 200 000 240 000 240 000Czech Republic 649 000 673 000 682 000France 319 464 300 000 307 253Germany 750 000 750 000 750 000Italy 183 804 180 000 180 000Spain 463 398 476 327 475 000Turkey 615 271 600 000 600 000Ukraine 216 600 251 000 244 000United Kingdom 1 910 874 1 762 328 1 671 426Egypt 415 400 400 000 300 000Mexico 877 147 961 800 970 598USA 7 800 000 7 470 000 7 330 000Brazil 2 410 000 2 455 000 2 527 000Australia 231 611 182 304 213 905World Total 25 500 000 25 400 000 25 500 000
3
This metakaolin product is bulky and has an excellent dielectric property being
used as filler in electrical wire coatings A second grade is produced by further heating
kaolinite to about 1050oC at which point the metakaolin is reorganized to form mullite
and cristobalite These mullite needles have a very high brightness and good opacity
which makes them suitable to be used as an extender for titanium dioxide in many
applications in order to reduce formulation costs particularly in paper coating and filling
and in paints Kaolinites are also chemically modified using ionic andor nonionic
surfactants to make them hydrophobic or organophilic Such surface-modified kaolinites
are used in paper paint plastics rubber ink and other more specialized applications
Other applications of kaolinite include use in cracking catalysts fiberglass cement
adhesives pharmaceuticals insecticides food additives fertilizers plaster filter aids
cosmetics polishing compounds etc
Kaolinite is also found as gangue minerals in ores treated in mineral processing
plants In this case kaolinite creates problems in making efficient particle separations
(concentration) and in sedimentation for waste disposal (tailings) for example during the
flotation separation of valuable minerals such as diaspore from gangue minerals such as
kaolinite The Al2O3-to-SiO2 ratio of most diasporic bauxite deposits in China is between
5 and 8 Thus it is desired to treat such materials in order to increase the Al2O3-to-SiO2
mass ratio by physical separation such as flotation so that the Bayer process can be
applied In this regard reverse flotation to remove silicate ore such as kaolinite from
diasporic bauxite is very important for the economic utilization of these resources [3-9]
In another situation kaolinite poses a problem during recovery of bitumen from
oil sand and sedimentation of oil sand tailing ponds Oil sands from the Athabasca region
4
of northern Alberta Canada are composed of bitumen (~12) sand silts clays (mineral
content ~85) and water (3-6) The clay component is comprised of kaolinite (50-
60) and illite (30-50) with some montmorillonite [10 11] Typical bitumen
recoveries range from 88 to 95 depending on oil sands grade and origin Tailings
include a mixture of water sand silt clay and residual bitumen This tailings slurry is
approximately 55 solids (82 sand and 18 fines lt 44 μm) Historically the tailings
were pumped into large settling basins where the sand fraction settled out rapidly to form
beaches Some fines were trapped within the sand matrix of the beaches However the
remaining thin slurry of fines and water (8 solids) flowed into the settling basin where
the solids settled gradually to form a densified zone of fine tailings at depth Released
water was recycled back to the extraction plant After a few years the fines settle to 30 to
35 by weight and are referred to as mature fine tailings (MFT) Further consolidation of
the MFT is expected to take centuries [10 11] The wettability aggregation dispersion
flotation and thickening of kaolinite are affected by its crystal structure and surface
properties [7 12-15] It is therefore desired to understand the physical and surface
chemical properties of kaolinite
The physical and chemical properties account for the use of kaolinite in all of the
above stated applications The physical properties such as shape size and the aspect ratio
of kaolinite particles are important in their use in papermaking as a dispersing agent in
paints and inks and in almost all applications Analysis of the surface chemistry features
such as electrokinetic phenomena is complicated by the anisotropic platy structure of the
particles which manifests itself in the presence of both edge surfaces and face surfaces
Even more so the mineral structure suggests that there should be two types of surface
5
faces defined by the 001 and the 001 basal planes In this way ideally one face should be
described as a silica tetrahedral layer and the other face should be described by an
aluminum hydroxide (alumina) octahedral layer as shown in Figure 11
It is believed that the basal planes of kaolinite carry a permanent negative charge
due to isomorphous substitution of Al3+ for Si4+ in the silica tetrahedral and Mg2+ for
Al3+ in the alumina octahedral layer whereas the edge surface carries a positive or
negative charge depending on the pH of the system Therefore it is commonly assumed
that the basal planes do not show a surface charge dependency with variation in pH
However this assumption has never been verified due to the difficulty in isolating the
two faces of kaolinite (silica tetrahedral and alumina octahedral faces) and the lack of
instrumentation to investigate the two faces when dealing with nanosized particles
Electrokinetic measurements of kaolinite particles are particularly important in
order to describe its surface charge properties and hence its behavior in suspension The
electrophoresis technique is commonly followed to estimate the surface potentialzeta
potential of particles as a function of solution pH Generally it has been found that
kaolinite particles exhibit a negative zeta potential at all pH values greater than pH 3
This negative surface charge of kaolinite particles is similar to the surface charge of
quartz particles which also have a negative zeta potential at pH values greater than pH 3
Although electrophoretic mobility measurements describe the overall electrokinetic
characteristics of the anisotropic kaolinite particles these measurements do not provide
details of the charge at various kaolinite surfaces The surface potential of the kaolinite
particle should be defined by the surface charge of its 001 and 001 basal planes and edge
faces The basal plane 001 consists of a silica tetrahedral layer whereas the basal plane
6
Figure 11-Side view (A) and top view (B) of kaolinite (001) surface structure The silica tetrahedra (red oxygen blue silicon) and the alumina octahedra (yellow aluminum green hydroxyl) bilayers thought to be bound together via hydrogen bonding are illustrated in (A)
A B
7
001 consists of an alumina octahedral layer The edge faces of broken covalent bonds
become hydrated and form silanol and aluminol groups It is expected therefore that the
zeta-potential of kaolinite should exhibit the average zeta-potential behavior for pure
silica and pure alumina particles Nevertheless electrophoresis measurements repeatedly
show a negative zeta potential for kaolinite which reflects the dominance of the silica
tetrahedral layer The reason for this behavior requires clarification It is realized that the
electrophoresis measurements for kaolinite reflect a composite picture of the anisotropic
platy shape and the heterogeneous nature of the charge distribution A complete theory
covering arbitrary shape and charge of the particles describing the electrokinetic behavior
of the particles is still lacking due to the complexities of particle surface charge and
particle shape as well as the motion of such particles in an electric field
Interactions between particles are important in order to explain the rheology of
kaolinite suspensions The particle interactions are frequently governed by the surface
charge properties of kaolinite particles Traditionally the basal plane faces (the silica
tetrahedral layer and the alumina octahedral layer) were considered similar and thereby
the only interactions considered were those between the face-face the face-edge and the
edge-edge surfaces It is again emphasized here that in all previous studies distinction
between the basal plane face surfaces (the silica tetrahedral layer and the alumina
octahedral layer) had not been made and these face surfaces were assumed to be the
same These different particles interactions are important for they define the aggregation
state of the kaolinite particles and the rheology of kaolinite suspensions The aggregation
state will define the network structure of kaolinite particles in suspension whether they
form loose aggregates or compact three-dimensional card-house structures The strength
8
of these kaolinite aggregates structures is usually characterized by measuring their yield
strength andor viscosity of suspensions Generally the yield strength of a particle
suspension follows a bell-shaped curve with maximum yield strength at the iso-electric
point of the particle Such behavior has been established for spherical particles with
uniform surface charge density For anisotropic heterogeneously charged platy-shaped
kaolinite particles the maximum yield strength does not occur at the apparent iso-electric
point This characteristic for maximum yield strength of kaolinite suspensions is not
completely understood and needs to be studied further in order to control suspension
properties in many applications such as paper making composites etc
11
Clay minerals are abundant in the top soil of the earthrsquos crust From a practical
point of view they determine the physical and chemical properties of topsoil farmland
and the effectiveness of fertilizers other chemicals used in agriculture Technical
applications are encountered in the paper industry in ceramics in brick production and in
the chemical industry In addition clays are used for cleaning purposes (ldquofullerrsquos earthrdquo)
Invariably these applications involve clay minerals as the adsorbent for polymers
monomers andor ions The surface chemistry of clay minerals has been studied
extensively by colloid scientists and chemists yet many details have not been established
Review of Literature
The electrical double layers associated with clay particles enter the picture in
connection with adsorption phenomenon and in connection with the interaction of clay
particles with each other or with other colloidal or suspended materials Before
9
discussing the surface properties of clays we will describe some relevant aspects of clay
mineralogy The readers are advised to refer to the textbooks for detailed study [16-22]
12
The basic structural elements of the clay minerals are silica tetrahedrons in which
silicon atoms occupy the center and are in tetrahedral coordination with oxygen atoms
Such tetrahedrons are linked by sharing three corners (the basal oxygens) each to form a
sheet structure with a hexagonal mesh pattern as shown in
Clay Mineralogy
Figure 12 The fourth
tetrahedral corner (the apical oxygen) points in a direction normal to the sheet and at the
same time forms part of an immediately adjacent and parallel octahedral sheet in which
each octahedron is linked laterally by sharing octahedral edges (see Figure 13) The
stacking of this bilayer of tetrahedral and octahedral sheets on top of each other forms a
kind of ldquobasis kitrdquo from which a variety of clay minerals can be described The octahedral
cations normally are Al Mg Fe2+ and Fe3+ but other medium sized-cations such as Li
Ti V Cr Mn Co Ni Cu and Zn also occur in some cases [22] The smallest structure
unit contains three octahedra If all three octahedron are occupied ie have octahedral
cations at their centers the sheet is classified as trioctahedral If only two octahedra are
occupied and the third octahedron is vacant the sheet is classified as dioctahedral
121
The assemblage formed by linking one tetrahedral sheet with one octahedral sheet
is known as bilayer or 11 layer In such layers the uppermost unshared plane of anions
in the octahedral sheet consists entirely of OH groups For example kaolinite is a clay
Bilayer Clay Minerals (11)
10
Figure 12- Structure of the tetrahedral sheet showing (A) tetrahedral arrangement of Si and O (B) projection of tetrahedron on plane of sheet and (C) top view of tetrahedral sheet (dotted line unit cell area) Large grey circles represent oxygen atoms and the small red circles represent silicon atoms
Oxygen
Silicon
(A) (C)(B)
11
Figure 13- Structure of the octahedral sheet showing (A) octahedral arrangement of Al or Mg with O or OH (B) projection of octahedron in two dimension and (C) top view of octahedral sheet (dotted line unit cell area) Large grey circles represent oxygen atoms large blue circles represent hydroxyl groups and small blue circles represent aluminum atoms
Oxygen
Silicon
(A) (C)(B)
Hydroxyl
12
mineral consisting of a repetition of this bilayer double sheet The repeating unit has a
dimension of 072 nm The double sheets are bonded to each other by hydrogen bonds
(involving OH of the octahedral sheet and oxygens of the adjacent silica sheet) and van
der Waal forces The kaolinite has a rigid crystal structure that cannot be swollen by
changing pH or solution ionic strength It is a nonswelling clay mineral In this research
work kaolinite clays will be discussed in greater detail
122
The other category called 21 clay minerals has a triple layer as the repeating
unit It consists of an alumina or magnesium oxide layer sandwiched on both sides by
silica tetrahedral sheets The dimension of this trilayer is 10 nm thick The
physicochemical behavior of 21 clay minerals depends strongly on the degree of
substitution of Si4+ by Al3+ in the tetrahedral layers and the substitution of Al3+ by Mg2+
or Fe2+ in the octahedral layers These substitution cause charge imbalance for both 21
and also 11 clay minerals The excess layer charge is compensated by various interlayer
materials including individual cations (as in the mica group) hydrated cations (as in
smectites) and hydroxide octahedral groups and sheets (as in chlorite minerals) With
these basic units a variety of clay minerals have been identified depending on the
variations in the sequence of the basic building kits or variations in chemical
compositions (Mg or Al octahedrons substitutions of Si4+ by Al3+ in the tetrahedral layer
and Al3+ by Mg2+ in the octahedral layer etc) Clay minerals are classified into eight
major groups on the basis of layer type (11 or 21) layer charge and type of interlayer
as presented in
Triple Layer Clay Minerals (21)
Table 12
13
Table 12- Classification of layered silicate minerals [22]
Layer Type Group Sub-group Species11 Sepentine ndash Kaolin Serpentines Lizardite Antigorite Chrysotile
Kaolins Kaolinite Dickite Nacrite
21 Talc-Pyrophillite Talcs Talc WillemseitePyrophyllites Pyrophyllite
Smectite Saponites Saponite HectoriteMontmorillonites Montmorillonite Beidellite
Vermicullite Trioctahedral Vermicullite Trioctahedral VermiculliteDioctahedral Vermicullite Dioctahedral Vermicullite
Mica Trioctahedral Mica Phlogopite Biotite LepidoliteDioctahedral Mica Muscovite
Brittle Mica Trioctahedral Brittle Mica ClintoniteDioctahedral Brittle Mica Margarite
Chlorite Trioctahedral Chlorites ClinochloreDioctahedral Chlorites DonbassiteDitrioctahedral Chlorites Cookeite
21 Sepiolite-Palygorskite Sepiolites SepioliteInverted Ribbons Palygorskites Palygorskites
14
13
The kaolinite structure as described above consists of a sheet of (Si4O10)4- formed
by the linkage of SiO4 tetrahedra in a hexagonal array the vertices all pointing in one
direction The apical oxygens together with some additional (OH)- ions located over the
center of hexagons form the base of a gibbsite-type layer or alumina octahedral layer
The structure of kaolinite is shown in
Kaolinite Structure
Figure 14 Kaolinite has triclinic unit cell crystal
structure with a = 515 Å b= 895 Å c= 739 Å α = 918deg β = 1048deg and γ = 90deg
14
The chemical formula of kaolinite can be written in terms of oxides as
Al2O32SiO22H2O The chemical analysis indicates that various ions may substitute in
the structure for example Al3+ for Si4+ in the silica tetrahedral layer and Mg2+ or Fe2+ for
Al3+ in the alumina octahedral layer [23]
Kaolinite Chemistry
Kaolinite has a low cation exchange capacity of about 5 meq100 g compared
with other 21 type clay minerals such as montmorillonite (100 meq100g) [16 24] The
anion exchange capacity of kaolinite on the other hand is higher than its cation exchange
capacity and may be attributed to the replaceable (OH)- ions of the exposed alumina
octahedral layer
Kaolinite contains little or no surface adsorbed water in its structural unit
therefore most of the dehydration (loss of constitutional OH) takes place between 400
and 525 When the kaolinite minerals are heated so that all water molecules and (OH)-
ions are driven off at about 800 the product is called metakaolinite When kaolinite
minerals are heated beyond 800 the layered structure is further disrupted and cannot
15
Figure 14- The structure of kaolinite clays
O
OH-
Si+4
Al+3
16
be reconstituted by rehydration The final products of thermal decomposition are mullite
and cristobalite
15
The kaolinite may occur in compact massive blocks in vermin-form or granular
aggregates as radiating platelets or as piles of platelets or lsquobooksrsquo Kaolinite shows a
perfect cleavage along the 001 plane The particles are white in color sometimes with
reddish brownish or bluish tints and colorless in thin sections The refractive index
values for kaolinite are
Kaolinite Optical and Physical Properties
nα = 1553 - 1563 nβ = 1559 - 1569 and nγ = 1560 - 1570
16
Kaolinite occurs in hydrothermal residual and sedimentary deposits The
hydrothermal and residual occurrences are called primary and the sedimentary
occurrences are referred to as secondary deposits Primary kaolins are those that have
formed in situ by the alteration of crystalline rocks such as granites and rhyolites The
alteration results from surface weathering groundwater movement below the surface or
hydrothermal action Secondary kaolins are sedimentary and were eroded transported
and deposited as beds or lenses associated with sedimentary rocks
Kaolinite Genesis
Kaolin minerals form at relatively low temperatures and pressures The most
common parent minerals are feldspar and muscovite both of which contain desired
alumina and silica from which the kaolin minerals are formed The transformation of
17
potassium feldspar into kaolinite occurs by intense weathering of the feldspar and
leaching of K and SiO2 according to the equation
Potassium Feldspar Kaolinite Silica Potash
2KAlSi3O8 + 3H2O rarr Al2Si2O5(OH)4 + 4SiO2 + 2KOH
All of the potassium must be lost in solution because small amounts of unleached
potassium favor illite formation rather than kaolinite Dissolution is essential to chemical
weathering and to the formation of kaolinite A few researchers [14 25] studied the
dissolution reaction of kaolinite and determined the free energy of formation of kaolinite
ranged from -9025 to -9038 kcalmol [25] Kittrick concluded from the solubility
experiments that the ion activities during kaolinite dissolution appears to be controlled by
soluble small particles which may be present as impurities [25]
17
The surface chemistry features of kaolinite reside in its bilayer structure which is
composed of one sheet of silica and a sheet of alumina The basal planes of kaolinite are
thus half siloxane and half hydroxylated alumina When these anisotropic structural
features are considered together with chemical features further understanding of the
electrokinetic behavior can be obtained
Surface Chemistry of Kaolinite
It is well known that kaolinite has a heterogeneous surface charge The basal
planes of kaolinite (silica tetrahedral layer and alumina octahedral layer) are commonly
assumed to carry a constant structural charge due to isomorphous substitution of Al3+ for
18
Si4+ in the silica tetrahedral layer and Fe2+ or Mg2+ for Al3+ in the alumina octahedral
layer The charge on the edge surfaces is due to the protonation deprotonation of surface
hydroxyl groups and therefore depends on the solution pH [16 23 26-28] However this
assumption has never been verified due to the difficulty in isolating the two faces of
kaolinite (silica tetrahedral and alumina octahedral faces) and the lack of instrumentation
to investigate the two faces when dealing with nanosized particles
The earlier studies were concentrated to determine the cation exchange capacity
of kaolinite Depending on the different counterions and source of kaolinite different
values for cation exchange capacity for kaolinite are reported in the literature in the range
of 36-100 micro-moleg [29-32] Ferris and Jepson [29] do not agree that kaolinite has
definite cation exchange capacity They concluded that a structural charge does not exist
on the basal surface of their kaolinite samples
The surface charge density for kaolinite particles was also determined by titration
[14 33-37] Despite these numerous studies experimental results are still disparate The
pHPZNPC (point of zero net proton charge) for kaolinite varies from pH 4 [33] to pH 75
[14] One reason for these discrepancies could be linked to contrasting experimental
methods some researchers used continuous potentiometric titrations with short
equilibration times [14 37] while others used potentiometric measurements in batch
experiments over long equilibration times [33 34 38]
The iso-electric point of kaolinite as determined by electrophoresis is quite
intriguing as one would expect that the kaolinite particles should show the iso-electric
point at pH of 57 as an average of silica (iso-electric point at pH of 22) and gibbsite
(iso-electric point at pH of 92) since the composition of silica to alumina in kaolinite is
19
nearly 11 However the iso-electric point of kaolinite particles as measured by
electrophoresis is consistently less than pH 3 which is more closely related to the iso-
electric point of silica [29 39-45] However it was pointed out that the zeta potential of
kaolinite inferred from the electrophoretic mobility using the Smoluchowski equation has
been criticized because of the heterogeneous nature of the surface charge and the
hexagonal shape of the particles [15 24 46] The calculation of zeta potential and surface
charge densities for nonspherical kaolinite assuming an equivaent sphere may result in
quite misleading values The zeta potentials calculated from such mobilities do not reflect
the potential at the shear plane because of the screening effect of positive charges on the
edges relatives to those of negative charges at faces resulting in lower negative mobility
[47]
The surface charge properties of kaolinite will have an influence on the particle
interactions in a suspension and thereby affecting its rheological properties Several
researchers have defined the rheological properties of kaolinite and have explained the
abnormal behavior of a maximum yield stress for kaolinite suspensions at pH 5-55 [26
48-50] Such a maximum might be expected at kaolinitersquos iso-electric point of pH lt 3
[51 52] Johnson et al [49 50] followed the common assumption the basal planes of
kaolinite are permanently negative charged and explained this abnormal rheological
behavior based on the aggregation behavior of kaolinite particles which is described
mainly by favorable interactions between negatively charged faces and positively charged
edges On this basis the maximum shear-yield stress at pH 55 was explained However
the kaolinite particle interactions theory should be considered carefully due to the
20
underlying assumption of negatively charged faces (silica face and alumina face) of
kaolinite
Limited research has been reported on the experimental characterization of the
face surfaces and edge surface of kaolinite [15] A few studies have reported the average
FTIR spectra of both faces of kaolinite [53-55] Recent development of advanced
analytical techniques (XPS - X-ray photoelectron spectroscopy LEISS - Low energy ion
scattering spectroscopy and ToF-SIMS - Time of flight-secondary ions mass
spectroscopy) seem promising to facilitate investigation of the two faces of kaolinite
provided that the particles can be oriented and that the instrumentation is sufficiently
surface sensitive to collect signals from just the very first layer For example a recent
study attempted to use ToF-SIMS to study the talc surface [56] However these results
were averaged over a few layers of talc Johnston [57] examined the hydrogen bonding
for kaolinite particles using vibrational spectroscopy and concluded that the type and
strength of interlayer hydrogen bonds of the structural OH groups govern their size shape
and their surface chemistry In addition they also revealed an additional set of lsquodisorder-
indicatorrsquo bands of disordered kaolinite using FTIR spectroscopy Recently many
researchers have used scanning electron microscopy (SEM) [58 59] transmission
electron microscopy (TEM) [60] and atomic force microscopy (AFM) [59 61 62] as
imaging tools to characterize particle shape and morphology
18
The overall objective of this dissertation research is to investigate the physical
characteristics structure and surface chemistry features of kaolinite in order to further
Overall Objective
21
explain the electrokinetic behavior of kaolinite particles their interactions and the
rheology of their aqueous suspensions
19
Chapter 2 discusses the literature review of the physical and chemical properties
of kaolinite Different instrumentation techniques are discussed in order to characterize
these properties of kaolinite
Research Organization
Chapter 3 discusses the physical properties (shape and size) and chemical
composition of kaolinite This study focuses on the surface properties of a very high
purity kaolinite sample from St Austell area in Cornwall UK A pool of advanced
analytical techniques were utilized to investigate the morphological and surface
properties of kaolinite including Brunauer-Emmett-Teller (BET) surface area
measurements X-ray diffraction (XRD) X-ray fluorescence (XRF) scanning electron
microscopy (SEM) atomic force microscopy (AFM) Fourier-transform infrared
spectroscopy (FTIR) and ion scattering spectroscopy (ISS)
Chapter 4 discusses surface force measurements made by AFM using a silicon
nitride tip in order to interrogate the surface charge characteristics of the silica and the
alumina faces of 500 nm size kaolinite particles and their dependence on solution pH A
protocol for surface force measurements was developed To order kaolinite particles with
the silica face exposed a negatively charged glass-substrate was used so that the alumina
face of kaolinite was attracted to the glass-substrate In contrast to expose the alumina
face of kaolinite particles a positively charged fused alumina-substrate was used so that
the silica face attached to the fused alumina-substrate The surface force measurements
22
were analyzed using DLVO theory and on this basis the surface charge characteristics of
the silica and the alumina faces of kaolinite are established
Chapter 5 discusses the electrokinetic features of kaolinite particles as
investigated using electrophoresis potentiometric titration techniques (M-R titration and
acid-base titration) and surface force measurements The differences in the results
between electrophoresis and potentiometric titration are explained with the limitation of
the current electrokinetic theory for the anisotropic and platy nature of the kaolinite
particles
Chapter 6 discusses rheological measurements conducted to study particle
interactions in kaolinite suspensions and to further explain the anomalous behavior of
concentrated kaolinite suspensions showing maximum yield strength at pH 5-55 The
surface charge data of the silica face surface the alumina face surface and the edge
surface were used to describe particle interactions and the rheological behavior of
kaolinite suspensions The interactions between different faces of kaolinite particles ndash the
silica face surface the alumina face surface and the edge surface are considered and the
aggregation state of kaolinite particle suspensions is discussed
Chapter 7 discusses the identification of the silica face and alumina face of
kaolinite by atomic force microscopy The edge surface is examined by high resolution
transmission electron microscopy The basal plane surfaces and the edge surfaces of
kaolinite were further investigated using atomic force microscopy and high resolution
transmission electron microscopy respectively in order to verify whether the faces can
be distinguished from one another For example the mineral structure suggests that there
should be two types of surface faces defined by the 001 and the 001 basal planes In this
23
way one face should be described as a silica tetrahedral layer and the other face should
be described as an aluminum hydroxide (alumina) octahedral layer For confirmation the
crystal lattice structure of the silica face surface and the alumina face surface were
investigated using atomic force microscopy whereas the lattice fringe pattern of the
kaolinite edge faces was investigated using high resolution transmission electron
microscopy
Finally Chapter 8 discusses the milestones achieved in this dissertation and
suggests some new directions for future research on other clay minerals in general and
kaolinite in particular
CHAPTER 2
CHARACTERIZATION OF KAOLINITE PARTICLES
This chapter discusses a pool of advanced analytical techniques utilized to
investigate the morphological and surface chemistry features of kaolinite X-ray
fluorescence (XRF) spectrometry was used to determine the chemical composition of
kaolinite and thereby predict the structural formula as (Si394Al006)IV(Al399Fe001)VIO10
(OH)8Fe001Ca001Mg001K002Na0005 X-ray diffraction analysis (XRD) showed that
kaolinite was the dominant mineral phase with some minor impurities of quartz and
anatase Scanning electron microscopy (SEM) and atomic force microscopy (AFM)
confirmed the platy nature and hexagonal to subhedral shape of kaolinite The median
diameter and thickness of kaolinite was determined as 600 nm and 11 nm respectively
The surface chemistry features as revealed by Fourier transform infrared
spectroscopy (FTIR) determined the OH group vibrations of the kaolinite surface from
the inner OH group stretching vibrations at 3620 cm-1 and inner-surface OH group
vibrations at 3691 cm-1 3668 cm-1 and 3651 cm-1 Low energy ion scanning spectroscopy
(ISS) revealed an overlapping band of SiAl elements detected from the silica and
alumina faces of kaolinite These surface analytical techniques offer better understanding
of the surface chemistry and bonding details of kaolinite and other clay mineral surfaces
25
21
Kaolinite clays are extensively used in the paper ceramic paint plastic rubber
and cracking catalyst industries yet their surface properties are not completely
understood [1 63-68] A complete understanding of the surface chemistry features and
morphological properties of kaolinite crystallites is desired in order to better control its
properties in the above said applications and many new applications such as smart
materials and clay-polymer nanocomposites
Introduction
The chemical structure of kaolinite is Al2Si2O5(OH)4 which represents two-layer
silicates and are known to consist of a silica tetrahedral layer covalently bonded to
alumina octahedral layer through an apical oxygen atom as shown in Figure 21
Kaolinite is found as pseudo-hexagonal triclinic crystals These particles have a
maximum dimension less than 2 microm a thickness of 072 nm and a density of 26 gcm3
The lattice parameters of kaolinite are a = 0515 nm b = 0895 nm c = 0740 nm α =
9168deg β = 10487deg γ = 899deg [17]
The surface chemistry features particularly the charge properties of kaolinite
have been investigated by many researchers [14 23 26 34 35 41 50 69-71] However
the surface charge properties have been explained based on the commonly followed
assumption that the basal planes of kaolinite carry a permanent negative charge due to
isomorphous substitution of Al3+ for Si4+ in the silica tetrahedral and Mg2+ for Al3+ in the
alumina octahedral layer whereas the edge surface carries a positive or negative charge
depending on the pH of the system This assumption was only recently examined by
surface force measurements on the two faces of kaolinite using atomic force microscopy
[72]
26
Figure 21- Structure of kaolinite showing the relative spacing between the layers
72
AringOxygen
Hydroxyl
Silicon
Aluminum
27
It was demonstrated that the silica tetrahedral face of kaolinite is negatively
charged at pH gt 4 whereas the alumina octahedral face of kaolinite is positively charged
at pH lt 6 and negatively charged at pH gt 8
A few studies have reported the Fourier transform infrared (FTIR) spectra of
kaolinite [53-55 73] Recent development of advanced analytical techniques such as XPS
- X-ray photoelectron spectroscopy LEISS - Low energy ion scattering spectroscopy
and ToF-SIMS - Time of flight-secondary ions mass spectroscopy seem promising to
facilitate investigation of the basal plane surfaces of kaolinite provided the particles can
be oriented and that the instrumentation is sufficiently surface sensitive to collect signals
from just the very first surface layer For example a recent study attempted ToF-SIMS
analysis to study the talc surface [56] However these results were averaged over a few
layers at the talc surface
Cases et al [74] used low-temperature adsorption calorimetry shadowed
transmission electron microscopy adsorption isotherms of alkyldodecylammonium ions
and particle size distribution curves to obtain morphological information Recently many
researchers have used scanning electron microscopy (SEM) [58 59] transmission
electron microscopy (TEM) [60 75] and atomic force microscopy (AFM) [60 62 76] as
imaging tools to characterize particle shape and morphology However none of the
studies to the knowledge of the author have used a pool of surface analytical instruments
to characterize the surface chemistry features and the morphological properties of
kaolinite crystals
28
The objective of this chapter is to characterize the morphological and surface
chemistry features of the kaolinite surface through a pool of advanced analytical
techniques in order to better understand its surface properties
22
221
Materials and Methods
A clean English kaolin (Imerys Inc UK) was obtained from the St Austell area
in Cornwall UK The sample was cleaned with water only using elutriation to achieve
classification at a size of less than 2 microm No other chemical treatment was done Further
details about the kaolinite extraction and preparation are given in the literature [77] The
kaolinite was used as received in this research All liquid suspensions were prepared in
high purity Milli-Q water (Millipore Inc) The resistivity of the water was above 18 MΩ-
cm in all experiments
Sample Preparation
222
The surface area of the particles was determined using the BET method following
the monolayer adsorption of N2 gas on the particle surface A solid sample is pretreated
(degassed) in a special container by applying heat and vacuum to remove adsorbed
contaminants acquired from the atmospheric exposure The container with the sample is
then transferred to the analysis port where it is cooled to cryogenic temperatures then is
exposed to N2 gas at a series of precisely controlled pressures With each incremental
pressure increase the number of gas molecules adsorbed on the surface increases The
pressure at which adsorption equilibrium occurs is measured and the universal gas law is
Surface Area
29
applied to determine the quantity of the gas adsorbed and subsequently the sample
surface area
223
The kaolinite chemical composition was determined using X-ray fluorescence
(XRF) spectrometry The elemental composition was determined using energy dispersive
spectrometry (EDS) The kaolinite powder was sprayed on dual side sticky carbon tape
which in turn is glued to the standard metal stub for EDS analysis A brief introduction of
both techniques is presented in the following subsections
Chemical Composition
2231 Energy Dispersive Spectrometry (EDS)
When the electron beam strikes the sample X-rays are produced from interactions
of the beam with the sample The X-ray produced can be placed into two broad
categories white X-rays and characteristic X-rays When an electron beam is in-
elastically scattered by the nucleus the electrons lose energy resulting in the formation
of white X-rays These X-rays do not have energies characteristics of the sample
composition but instead have a variety of energies ranging up to that of the incident
beam However when the beam electron strikes an inner shell electron the primary
electron beam loses energy equivalent to the binding energies of the K L or M shells and
the electrons are ejected The difference in energy results in either the production of
characteristic X-rays or the ejection of the Auger electron Characteristic X-rays are
called such because the energy of the X-rays produced can be used to identify the
elements present in the sample
30
An X-ray spectrum is collected for an area of specimen using an energy
dispersive X-ray analyzer (EDS) or multiple X-ray goniometers These spectra can be
used to obtain an estimate of the chemical composition of the selected area The chemical
composition of the area impacted by the electron beam can be estimated using EDS by
viewing a graph with the energy of the X-rays produced on the x-axis and the number of
X-rays counted at that energy on the y-axis The regions appearing as peaks are the result
of characteristic X-rays production while the intensity in the regions between peaks in
the result of white X-rays In general the relative intensity of the EDS peaks is
proportional to the relative composition on the molar basis
2232 X-ray Fluorescence Spectroscopy (XRF)
X-ray fluorescence spectroscopy (XRF) is a method of elemental analysis which
assesses the presence and concentration of various elements in the powder sample by
measuring the characteristic secondary radiation emitted from a sample that has been
excited with an X-ray source A good review of XRF treatment could be found elsewhere
[78-83] and only a brief description is provided here
When a primary X-ray excitation source from an X-ray tube or a radioactive
source strikes a sample the X-ray can either be absorbed by the atom or scattered through
the material The process in which an X-ray is absorbed by the atom by transferring all of
its energy to an innermost electron is called the photoelectric effect During this
process if the primary X-ray had sufficient energy electrons are ejected from the inner
shells creating vacancies These vacancies present an unstable condition for the atom As
the atom returns to its stable condition electrons from the outer shells are transferred to
31
the inner shells and in the process give off a characteristic X-ray whose energy is the
difference between the two binding energies of the corresponding shells Because each
element has a unique set of energy levels each element produces X-rays at a unique set
of energies allowing one to nondestructively measure the elemental composition of a
sample The process of emissions of characteristic X-rays is called X-ray fluorescence or
XRF In most cases the innermost K and L shells are involved in XRF detection
The difference between EDS and XRF is the type of radiation hitting the sample
EDS uses an electron beam while XRF uses an X-ray beam Due to the small beam size
possible with electrons elemental analysis can be obtained for volumes as small as 1 microm
in diameter
224
X-ray diffraction (XRD) is a technique that provides detailed information about
the atomic structure of crystalline substances It is a powerful tool in the identification of
minerals in rocks and soils XRD has long been a mainstay in the identification of clay-
sized minerals in soils
Mineralogy
Many references are available which describe XRD principles in detail [84 85]
Other useful sources of information about XRD theory and interpretation applied
specifically to powder methods are also available [86-88] The following section provides
a brief introduction to some fundamental aspects of XRD
X-ray diffraction analysis uses monochromatic radiation Intense X-radiation at a
specific wavelength can be produced when electrons from a source (eg tube filament)
dislodge inner shell electrons from the atoms of a metal target Instantaneous replacement
32
of the dislodged electron by an electron from a specific energy shell results in the
quantum release of a packet of energy corresponding to a specific wavelength and termed
characteristic radiation The characteristic radiation used in XRD termed Kα is produced
by replacement of K shell electrons by L shell electrons
X-ray diffraction occurs when X-rays are scattered by atoms arranged in an
orderly array in crystals The atoms serve as scattering centers reemitting X-rays at the
same wavelength as the incident radiation in all directions (coherent scattering) [88] The
orderly arrangement of atoms results in the scattered X-rays within the crystal being (i) in
phase in specific directions dictated by symmetry and atomic spacing and (ii) out of
phase in all direction The X-rays that are in phase constructively interface and emerge as
intense beams (diffracted beams) from the crystal while those that are out of phase
destructively interface and hence have minimal emergence The systematic combination
of constructive and destructive interference arising from the periodicity of atoms in
crystals is X-ray diffraction
The diffractometer records the intensity of the diffracted beam electronically at
precise angles as the specimen is scanned over an angular range These intensity patterns
at specific angles are matched with the intensity of standard samples at precise angular
locations The mineralogical information from the sample is thus obtained
In this dissertation research the kaolinite powder was characterized for the
identification of different mineral phases using a Siemens D5000 X-ray powder
diffractometer (Bruker AXS Inc Madison WI USA) in the range of 100le 2θ le 1000
with Cu-Kα radiation monochromated with a curved-graphite monochromators placed
after the sample at 40 KV and 30 mAmps The kaolinite powder was packed in a
33
standard flat sample holder without any special treatment The step scan technique was
employed at an interval of 002008 seconds X-ray diffraction (XRD) data thus obtained
was analyzed using Diffrac Plus v 3 software (Bruker AXS Inc Madison WI USA)
225
The kaolinite particles shape and thickness was characterized using environmental
scanning electron microscopy (ESEM) and atomic force microscopy (AFM) The
description of SEM and AFM imaging procedures is discussed below
Kaolinite Particle Size and Thickness
2251 Scanning Electron Microscopy (SEM)
Scanning electron microscopy (SEM) has diverse uses for the study of clay
minerals The SEM has a large magnification range allowing examination of solids with
almost no magnification to imaging at well over 100000 times Another important
feature is the large depth of field of SEM images which have a three-dimensional
perspective In this way an SEM image provides much more information about a
specimenrsquos topography and surface structures than light microscopy at the same
magnification
The first prototype SEM was constructed by Knoll and von Ardenne in Germany
Following several refinements made by Zworykin as well as improvements made by
Mcullan and Oatley the first commercial SEM became available in 1963 The
environmental scanning electron microscope (ESEM) is a recent modification of the
traditional SEM The major difference between ESEM and traditional SEM is the much
higher specimen chamber pressures that are allowed in the ESEM A differential
34
pumping system allows pressures of several hundred Pa in the specimen chamber while
maintaining a pressure of 13 times 10-11 MPa near the electron gun The high vacuum near
the electron gun makes it possible to use high intensity filaments such as a LaB6 filament
and get a significant signal despite the higher pressure in the sample chamber
The SEM can be subdivided into a number of components such as the electron
optical system specimen stage secondary electron detector and vacuum system An
electron optical system is involved in the focusing and control of the electron beam A
specimen stage is needed so that the specimen may be inserted and situated relative to the
beam A secondary electron detector is used to collect the electrons and to generate a
signal that is processed and ultimately displayed on viewing and recording monitors A
vacuum system is necessary to remove air molecules that might impede the passage of
the high energy electrons down the column as well as to permit the low energy secondary
electrons to travel to the detector Greater details about SEM principles and operation are
available in the literature [89]
2252 Atomic Force Microscopy (AFM)
Atomic force microscopy (AFM) was invented in 1986 by Binnig et al [90] and
has since become an important instrument for high resolution imaging of the micro-to-
nano-morphology of surfaces a technique to probe fundamental intermolecular forces
between substances and a tool to manipulate atoms and molecules The technique is
particularly important to various aspects of soil science and biogeochemistry because it
allows for high resolution imaging of organic microbial and mineral surfaces and
35
characterization of surface chemical properties under environments relevant to extreme
conditions
The basic operating principles of AFM have been described previously in the
literature [90 91] and are reviewed in brief here For most commonly used AFMs a
sample is mounted atop a piezoelectric scanner composed of materials such as lead-
zirconium-titanite that permit movement with Angstrom-level precision (see Figure 22)
The sample is scanned continuously in two dimensions (x-y) beneath a force sensing
probe consisting of a tip that is attached to or part of a cantilever Z-direction (height)
movements are also made by the scanner as required to compensate for changes in
sample height or forces between the tip and the sample Attractive and repulsive forces
between the tip and the sample cause the cantilever to bend or defect This deflection can
be monitored in a number of ways Most commonly laser light reflects off the back of
the cantilever into a photodiode detector This so-called optical-lever detection system is
sensitive to Angstrom-level movements of the cantilever [92-94] For soil microbiologic
purposes some AFMs keep the sample stationary while the scanner rasters the cantilever
above it so that the AFM can be used concurrently with an inverted optical microscope
The most common mode of AFM imaging is the so-called contact mode Contact-
mode imaging can be conducted in air or immersed in a liquid such as an electrolyte
solution In contact-mode AFM the tip is brought directly into contact with the sample
surface which is scanned beneath it The tip-sample interaction is primarily repulsive in
nature (eg due to the short-range forces associated with the Pauli Exclusion Principle)
The interaction force can be as low as 10-9 N which is approximately the interaction
force between atoms in solids Once the tip is brought in contact with the sample surface
36
Figure 22- Schematic representation of AFM A mineral sample is positioned on a piezoelectric scanner which moves the sample in three-dimensions relative to the sensor (cantilever) The cantilever deflects due to attractive or repulsive forces between the tip and the sample Deflection of cantilever is monitored by a laser reflecting off the top and into a photodiode array
PiezoelectricScanner
Mineral
Photodiode
Laser
Sensor
37
the piezoelectric scanner drives the sample upward in the z-direction a predefined
distance This causes the cantilever deflect The predefined cantilever deflection is
present by the system software and is known as the ldquoset pointrdquo A feedback loop
maintains a constant set-point level throughout the imaging process When the tip goes
over a feature on the sample surface the computer feedback loop adjusts the z-piezo to
keep the cantilever deflection at the set-point value The imaging is conducted at a
constant force so that this mode of imaging is often called ldquoconstant forcerdquo imaging The
greater the cantilever deflection the higher the imaging force exerted by the tip on the
sample A three-dimensional AFM image is generated as the computer plots the
correction to the z-piezo as a function of x-y position throughout the scan
The kaolinite particles images were obtained with an FEI Quanta 600 FEG
environmental SEM (FEI Oregon USA) under low voltage of 5 KV to avoid charging A
drop of kaolinite suspension (1000 ppm) in Milli-Q water at pH 9 was placed on a freshly
cleaved mica sheet The mica sheet was heated on a hot plate to immediately dry the
suspension In this way the kaolinite particles were dispersed on the mica substrate and
separated by several microns [62] The mica sheet was then attached to a sample holder
using dual sided sticky tape for ESEM analysis The images were obtained as received
without any conductive coating After the images were captured 150 kaolinite particles
were analyzed using Image-J software for area distribution Only those particles which lie
flat on the substrate and which were not aggregated were analyzed A mask was created
on the particle following its profile and then the area was determined by the pixels area
fitted in that mask The particle diameters were determined from the ESEM images based
on the equivalent circular disc area
38
The kaolinite particle thickness and diameter (longest dimension) was also
determined using AFM A picoforce AFM with Nanoscope V controller (Veeco
Instruments Inc Santa Barbara CA) was used with a PF-type scanner designed for
picoforce measurements Triangular beam silicon nitride (Si3N4) cantilevers (Veeco
Instruments Inc Santa Barbara CA) having pyramid-shaped tips with spring constants
of about 012 Nm were used The kaolinite samples were prepared in a similar fashion
on mica substrate as for the ESEM study The topography (height) images were obtained
with the contact mode in air The images were analyzed using Nanoscope v 72 software
(Veeco Instruments Inc Santa Barbara CA) The section analysis feature of the software
was used to obtain the particle thickness and the longest dimension from the height
images
226
Surface properties of kaolinite play an important role in the adsorption
dissolution and precipitation of ions in the solution In recent years the development of
surface sensitive analytical techniques eg X-ray photoelectron spectroscopy (XPS) ion
scattering spectroscopy (ISS) auger electron spectroscopy (AES) secondary ion mass
spectroscopy (SIMS) Fourier transform infrared spectroscopy (FTIR) etc have allowed
direct probing of surface phenomenon Of these surface techniques XPS is widely used
to obtain elemental chemical state and semiquantitative compositional information from
clay such as kaolinite and other minerals ISS has recently gained significant attention to
obtain the elemental information from the very first atomic layer of crystalline minerals
Surface Spectroscopy of Kaolinite
39
XPS ISS and FTIR are used in this study for obtaining elemental information from the
kaolinite surface and will be discussed in the subsequent sections
2261 X-ray Photoelectron Spectroscopy (XPS)
X-ray photoelectron spectroscopy (XPS) technique is popular among soil- and
geo-chemists because it provides elemental chemical state and semiquantitative
compositional information XPS is particularly useful in the determination of surface
elemental composition [95-97] site occupancy [97] oxidation and reduction chemistry
[98] chemical weathering [99 100] Lewis and Brǿnsted acid sites [101] adsorption of
cations and anions chemical bonding and surface reactivity [102-104] and differentiation
of exchangeable and nonexchangeable clay components [97] These reviews discuss
elegant applications of XPS to geo- and soil-chemistry research The principles of XPS
are briefly reviewed below
When a solid material is bombarded by a photon the photonrsquos energy is
transmitted to an electron The electron can be ejected from the atom provided the photon
is of sufficient energy This process is called photoemission and is shown in Figure 23
When the excitation occurs sufficiently close to the surface the photoelectron can escape
from the material The photoelectron leaves the atom in an excited state which then must
lose the energy gained The excess energy can be lost through various de-excitation
processes including the ejection of a second electron called an Auger electron (see Figure
23) All elements have a unique set of core level electrons whose binding energies are
spread out over a thousand electron volts (eV) or more These are the electrons that are of
interest for XPS analysis By determining the binding energies of the photoelectrons the
40
Figure 23- Sketch showing production of photoelectrons and auger electrons induced by X-ray bombardment (1) Incident X-ray Photon (2) Absorption of X-ray photon by core electron (3) Ejection of core-level photoelectron (4) Relaxation of higher shell electron into hole (5) Internally recombined energy of relaxation and (6) Ejection of Auger electron
41
element of origin can be determined In fact small changes (a few eV) in the binding
energy reflect differences in the chemical state (such as oxidation state) of the atom of
origin and the number of photoelectrons produced reflects the quantity of the originating
atoms in the excitation region
The most commonly used X-ray lines for XPS analysis are the AlKα (14866 eV)
and the MgKα (12536 eV) These X-rays have sufficient energy to excite the core level
electrons and to penetrate deep into the bulk sample Once the photoelectron has escaped
from the surface without collision or energy loss it has certain kinetic energy (KE) that
can be related to the binding energy for the electron (EB) which is characteristic for the
electronic energy level of origin By measuring the kinetic energy of the photoelectron
its binding energy can be determined as
B SE hz KE φ= minus minus (2-1)
where hz is the energy of the incident X-ray photon and ΦSP is the work function of the
sample (the additional amount of energy required to move an electron from the Fermi
level to the vacuum level)
2262 Ion Scattering Spectroscopy (ISS)
In Ion Scattering Spectroscopy (ISS) a surface is bombarded with a beam of
noble gas ions and the energies of the ions scattered under a fixed scattering angle are
analyzed [105] The masses of the collision partners determined the energy of the
scattered ions As shown in Figure 24 a monoenergetic well-collimated beam of ions
42
Figure 24- Schematic diagram of ion scattering experiment
Ratemeter
X-Y Recorder
ElectrostaticAnalyzer
AnanlyzerVoltage Sweep
TargetCollimators Ion Beam
Φ Azimuthal Rotation
θL
Ψ
Scattered ions and neutrals
+L -
Amplifier
Preamp
43
with energy of 01-10 keV strikes the target surface and the energy distribution of ions
scattered off at some particular angle is measured The energy spectrum obtained
provides information on the mass or chemical identity and the number of surface atoms
through the energy position and magnitude respectively of peaks in the spectrum
These various kinds of information are obtained with varying degrees of accuracy and
effort Mass identification is quite straightforward peaks for higher masses occur at
higher energy in a predictable manner Quantitative determination of the number of
surface atoms is not so simple since the scattered ion yield depends on scattering cross-
sections and neutralization efficiencies neither of which are very well known at present
[105] However quantitative analysis of foreign atoms at a surface can be achieved by
calibration of the system against standards Structure information for example about
atom locations and defects is derived from ldquoshadowingrdquo effects and multiple scattering
An outstanding feature of low-energy ion scattering is its fine degree of surface
selectivity the detected ions have scattered from only the first layer or two of atoms at
the surface
Low energy ion scattering spectroscopy (LEIS) (Kratos Analytical Inc New
York USA) in conjunction with an X-ray photoelectron spectroscopy (XPS) Kratos
AxisUltraDLD (Kratos Analytical Inc New York USA) was used to investigate the
silica tetrahedral face and alumina octahedral face of kaolinite LEIS involves directing a
stream of charged particles known as ions (4He+) on a surface and making observations of
the positions velocities and energies of the ions that have interacted with the surface The
data thus collected could be used to deduce information about the material such as the
relative positions of the atoms in a surface lattice and the elemental identity of those
44
atoms LEIS spectrum of the silica face and alumina face of kaolinite particles was
obtained with 4He+ at 1000 Volts XPS involves probing the sample surface with Al-Kα
photon energy source The X-ray photon interacts with the sample surface and ejects the
photoelectron from the top few surface layers The energy of the photoelectrons leaving
the sample was determined using a concentric hemispherical analyzer and this gives a
spectrum with a series of photoelectron peaks The binding energy of the peak areas are
analyzed to determine the surface composition
2263 Chemical Bonding ndash FTIR Spectroscopy
Fourier transform infrared spectroscopy (FTIR) is a technique used to obtain an
infrared spectrum of absorption emission photoconductivity or Raman scattering and
chemical bonding information of a solid liquid or gas [106] Infrared radiation covers the
segment of the electromagnetic spectrum that lies between the visible light (about 08
μm) and microwave radiation (about 1000 μm)
There are several techniques available for infrared spectroscopic investigations
such as diffuse reflectance internal reflectance and attenuated total reflectance methods
etc bulk properties can be studied as well as the properties of surfaces and with the use
of infrared microscopy even spectra of microscopic objects or details thereof can be
recorded [106-111]
Infrared radiation can be described as electromagnetic wave of the length λ the
frequency ν or as commonly called within the infrared spectroscopy as the wavenumber
ν These quantities are related as follows
45
1cνν
λ= = (2-2)
where c is the velocity of light in a vacuum The energy of infrared electromagnetic
waves is directly proportional to the frequency (or wavenumber) as
hcE h hcν νλ
= = = (2-3)
where h is Planckrsquos constant Most applications of vibrational spectroscopy are in the
mid-IR spectral range (400-4000 cm-1) however soil related applications in the far-IR
(10-400 cm-1) and near-IR (4000-10000 cm-1) regions are being reported more frequently
Molecular vibrations occur at discrete energies in the IR region of the
electromagnetic spectrum and are referred to as vibrational modes or as normal modes of
vibration These modes can be divided into two categories internal vibration modes and
phonon modes Internal vibrational modes correspond to the periodic motion of atoms
within a crystal or molecule They are described by three types of motion
i Bond stretching
ii Bending
iii Torsional motions
Internal vibrational modes are usually found in the 400 to 4000 cm-1 range
Crystalline materials also have vibrational transitions in the 10 to 400 cm-1 region termed
phonon modes resulting from the movement of one unit-cell or functional unit relative to
another
46
Fourier transforms infrared spectroscopy (FTIR) (Varian Inc Palo Alto CA
USA) was used to investigate the surface hydroxyl group on the alumina face and the
inner-hydroxyl group between the silica tetrahedral sheet and alumina octahedral sheet of
the kaolinite bilayer The silica tetrahedral layer of kaolinite is composed of a hexagonal
ring network of oxygen atoms on the 001 basal plane whereas the alumina octahedral
layer consist of a hexagonal ring network of hydroxyl atoms (OH) on the 001 basal plane
These hydroxyl atoms on the alumina octahedral face will be termed as inner surface
hydroxyl atoms which are hydrogen-bonded with the basal plane of oxygen atoms of the
next layer Other OH groups are located inside the bilayer between the dioctahedral
alumina sheet and tetrahedral silica sheet pointing horizontally toward the center of the
ditrigonal cavity These OH groups will be called the inner hydroxyl group
A similar technique as demonstrated by Gupta and Miller [72] was followed
[72]to order kaolinite particles exposing the silica tetrahedral face and alumina octahedral
face of kaolinite on a glass substrate and a fused alumina substrate respectively Briefly
20 microl of kaolinite suspension (5) at pH 50 prepared in high purity Milli-Q water
(Millipore Inc) was air-dried overnight on two cleaned glass substrates (SC1 cleaned) in
a petri-dish cover In order to achieve good coverage of kaolinite particles on the glass
substrate kaolinite suspension was redeposited two times (20 microl each times) on the
previously deposited kaolinite particles on the glass substrate In this way a very good
film of kaolinite particles was obtained on the glass substrate (visual observation) AFM
imaging conducted on one such ordered kaolinite particle substrate showed a root-mean-
square roughness of about 5 nm It should be expected that the kaolinite particles
deposited on the glass substrate should expose their silica face In the second experiment
47
a suspension of the kaolinite particles (5 by weight at pH 50) was deposited on two
cleaned fused alumina substrates (Piranha cleaned) The details of alumina substrate
cleaning are described elsewhere [112] It should be expected that the kaolinite particles
deposited on the fused alumina substrate should expose their alumina face
23
231
Results and Discussion
Kaolinite was determined as the primary mineral in the powder sample using
XRD (see
Mineralogy and Elemental Analysis
Figure 25) Other minerals present in minor amounts are quartz and anatase
The main intensity peak showed c-spacing of 715 Aring which is indicative of the 001 basal
plane of kaolinite A small peak at 2θ of 2550 with c-spacing of 349 Aring is indicative of
anatase mineral
As expected the elemental analysis of the kaolinite particles using EDS showed
that silicon aluminum and oxygen are the main elements of the crystal structure whereas
potassium calcium and iron are present as interlayer cations (see Figure 26) The ratio of
silicon to aluminum is nearly 1 which matches well with the theoretical ratio of silicon to
aluminum (see Table 21) The carbon peak in the EDS spectra originates from the
background carbon tape
232
The chemical composition of kaolinite as determined using XRF is shown in
Structural Formula
Table 21 As shown the experimental and theoretical compositions are in reasonable
48
Figure 25- XRD spectra of kaolinite showing the mineralogy of kaolinite
49
Figure 26- EDS spectra of kaolinite showing the elemental composition of kaolinite
05 10 15 20 25 30 35
50
Table 21- Chemical composition of kaolinite
Elemental Weight () Oxides Experimental Theoretical SiO2 4700 4630 Al2O3 4100 3980 Fe2O3 026
TiO2 014 CaO 006 MgO 008 K2O 018 Na2O 003 H2O 1160 1390
10035
51
agreement The kaolinite also contains minor amounts of Fe Ca Mg K and Na in its
crystal structure as well as small inclusions of TiO2 [113] The water is present as
structural water [113]
Utilizing the chemical composition of kaolinite the structural formula of kaolinite
was calculated based on the ideal hydroxyl composition and a total of 28 negative
charges in the crystal structure [113] as shown in Table 22 It is restated here that the
water is present as structural water whereas TiO2 is present as impurities This amount
should be deducted from the total amount as shown in column 3 of Table 22 The
structural formula of the kaolinite is then given as
(Si394Al006)IV(Al399Fe001)VIO10(OH)8Fe001Ca001Mg001K002Na0005
Only 006 equivalents of the aluminum from the octahedral layer contribute to the
isomorphic substitution of Si4+ for Al3+ in the silica tetrahedral layer This is in excellent
agreement for kaolinite from Nigata Japan which also showed 006 equivalents of
substitution of Si4+ for Al3+ in the silica tetrahedral layer [17] The kaolinite from
Georgia USA also showed good agreement which showed 005 equivalents of
substitution of Si4+ by Al3+ in the silica tetrahedral layer [113] The deficiency of charge
in the alumina octahedral layer was neutralized using Fe2+Fe3+ ions All other ions such
as Fe Ca Mg K and Na exist as interlayer cations in between kaolinite layers
This minor amount of substitution of Si4+ for Al3+ also corresponds well with the
experimental cation exchange capacity (CEC) which showed a low CEC of well ordered
kaolinite from Pittong ranges (Victoria Australia) from 0028 to 0050 molkg whereas
52
Table 22- Charge calculation of kaolinite based on a total of 28 negative charge in the crystal structure
Column 3 ndash Normalize the elemental oxide composition of the kaolinite to 100 after deduction the TiO2 and H2O amount
Column 7 ndash Divide the percentage concentration of each oxide by its molecular weight and multiply by the total number of metal atoms and the normal
charge of the metal in the oxide to obtain the charge equivalent Column 8 ndash Calculate the proportionality factor (R) by dividing the number
of assumed fixed negative charges in the structure of the mineral with the sum of charge equivalents
Column 9 ndash Calculate the occupancy of atoms per unit cell by multiplying each charge equivalent with the proportionality factor (R) and dividing
by the valency of the cation
Elemental Weight Normalized Molecular No of Cations Cation Charge Proportionality Atoms perOxides Wt Wt in Oxide Valence equivalents Factor R Unit Cell
SiO2 47 5304 6009 1 4 35308 44608 394Al2O3 41 4627 10196 2 3 27228 44608 405Fe2O3 026 029 1597 2 3 00110 44608 002TiO2 014CaO 006 007 5608 1 2 00024 44608 001MgO 008 009 4031 1 2 00045 44608 001K2O 018 020 942 2 1 00043 44608 002
Na2O 003 003 6198 2 1 00011 44608 0005H2O 116
10035 10000 62770
53
the CEC of poorly ordered kaolinite of secondary origin from Swan Bay ranges (New
South Wales Australia) from 016 to 034 molkg [114]
BET specific surface area of kaolinite was determined as 88 m2g using N2 gas
adsorption isotherm Cases et al [74] obtained similar results for the specific surface area
of kaolinites from St Austell Cornwall UK and Georgia as 114 and 109 m2g
respectively Huertas et al [37] also reported a similar specific surface area of 816 m2g
for well crystallized Georgia kaolinite
233
The SEM and AFM image of kaolinite particles on a mica substrate are shown in
Shape Size and Aspect Ratio
Figure 27 confirming the pseudo-hexagonal shaped plate like particles The size
distribution of the kaolinite particles as obtained from SEM image analysis is shown in
Figure 28 The aspect ratio (diameter to thickness ratio) obtained from AFM image
analysis is also shown in Figure 28 The circular diameter of the kaolinite particles lies
between 003 and 354 microm Only 35 (by number) of the particles are greater than 10
microm The median diameter of the kaolinite particles was determined to be 600 nm This is
in good agreement from both SEM and AFM image analysis for at least 150 particles
The kaolinite particles thickness varied from 175ndash215 nm as determined from the AFM
image analysis The median thickness of the particle population was determined to be
112 nm Each bilayer of kaolinite particles is about 072 nm and therefore it is estimated
that the average kaolinite particle consist of 15 bilayers The aspect ratio of the kaolinite
particles varied from 9ndash165 with median value of 45
54
Figure 27- (A) SEM (B) AFM images of kaolinite particles showing the pseudo-hexagonal shaped plate-like particles
A
B
I 00 2 Height
I 50 11m
55
Figure 28- (a) Size distribution and (b) aspect ratio of St Austell Cornwall kaolinite particles using equivalent circle diameter based on SEM and AFM image analysis
0
5
10
15
20
25
30
35
40
Freq
uenc
y
Circular Diameter microm
(A) Size Distribution
0
20
40
60
80
100
120
140
160
180
00 05 10 15 20 25 30
Aspe
ct R
atio
Particle Maximum Length microm
(B) Aspect Ratio
56
In contrast to these results Zbik and Smart [61] determined median aspect ratio
for Georgia kaolinite of 34 and 53 using SEM and AFM techniques respectively For a
kaolinite from North Queensland the median aspect ratio was determined as 39 and 68
using SEM and AFM techniques respectively [61] It should be noted that the Georgia
kaolinite is found in naturally thicker booklets and therefore a lower aspect ratio when
compared to the Cornwall kaolinite used in this dissertation research
234
Figure 29
Surface Spectroscopy of Kaolinite
shows the ISS spectra of the silica face and alumina face of kaolinite
The ISS spectra showed a sharp peak for oxygen a broad peak for silicon and aluminum
a small peak for potassium and a copper peak The copper peak originates from the
background copper strip used to attach the sample It should be noted that due to poor
signal-to-noise ratio the spot size of the ions on the substrate was increased Therefore
some signal was collected from the background copper strip
The broad peak consists of both aluminum and silicon elements as the broad peak
coincided with the calculated silicon and aluminum atomic peak positions at kinetic
energies of 578 eV and 597 eV respectively These peak positions are close to each other
due to the similar mass of silicon atoms (2808 amu) and the aluminum atoms (2698
amu) A deconvolution algorithm was applied to separate the two peaks at kinetic
energies of 578 eV and 597 eV representing the aluminum and silicon elements
respectively The area under the two peaks was integrated following Gaussian
distribution and the ratio of areas representing aluminum and silicon peaks are plotted as
function of time as shown in Figure 210
57
Figure 29- ISS spectra on (a) silica face and (b) alumina face of kaolinite particles for various bombarding times
0
200
400
600
800
1000
1200
1400
1600
1800
2000
200 400 600 800 1000
Inte
nsity
cps
Kinetic Energy eV
(a) ISS on Silica face of Kaolinite
0 min1 min6 min27 min
O
Si Al
K Cu
0
1000
2000
3000
4000
5000
6000
7000
200 300 400 500 600 700 800 900 1000
Inte
nsity
cps
Kinetic Energy eV
(b) ISS on Alumina face of Kaolinite
0 min1 min5 min21 min
O
K Cu
Si Al
58
Figure 210- Ratio of aluminum to silicon peak areas from both silica and alumina face of kaolinite as a function of bombarding time
02
04
06
08
10
12
14
0 5 10 15 20 25
Rat
io o
f Al(5
78)S
i(597
)
Time min
Silica face of Kaolinite
Alumina Face of Kaolinite
59
It is expected that the ratio of aluminum to silicon should increase with
bombarding of ions with time on the silica face and decrease on the alumina face of
kaolinite This may be due to the removal of silicon and aluminum atoms from the silica
face and the alumina face of kaolinite respectively by the continuous bombarding of ISS
beam (4He+ ions) on the respective faces of kaolinite In contrast to our expectations the
ratio of AlSi decreased on the silica face and increased on the alumina face of kaolinite
with time as shown in the Figure 210 The reason for such behavior of decreasing the
aluminum to silicon ratio from the silica face and increasing the aluminum to silicon ratio
from the alumina face is not clear although some concerns were raised whether the peak
positions for the silicon and aluminum atoms were correctly estimated The issue of
silicon and aluminum atoms peak position could not be resolved at this moment and
further study is warranted in order to identify the silica face and alumina face of kaolinite
using LEIS
The FTIR spectra obtained from the silica face and alumina face of kaolinite are
shown in Figure 211 The OH-vibration peaks were identified on both the silica face and
alumina face of kaolinite The band observed at 3620 cm-1 corresponds to inner OH
stretching vibrations as shown in Figure 211 The band observed at 3691 cm-1
corresponds to the in-phase motion of the three inner-surface OH group whereas the
band at 3668 cm-1 and 3651 cm-1 correspond to the out-of-phase motion of the inner-
surface OH groups These results are in excellent agreement with the band positions of
inner-surface OH groups and inner OH groups published in the literature [53-55 73
115] Interestingly FTIR spectra for the silica face showed greater surface sensitivity
(inner OH and inner-surface OH peaks are sharper and longer) when compared to the
60
Figure 211- The experimental infra red spectrum of kaolinite obtained from (a) silica face and (b) alumina face
1
11
12
13
14
15
16
17
18
19
2
21
22
3500 3550 3600 3650 3700 3750 3800
Abs
orba
nce
au
Wavenumber cm-1
(a) Silica Face of Kaolinite
1
11
12
13
14
15
16
17
18
19
2
21
22
3500 3550 3600 3650 3700 3750 3800
Abs
orba
nce
au
Wavenumber cm-1
(b) Alumina Face of Kaolinite
61
alumina face of kaolinite This high surface sensitivity from the silica face of kaolinite
was not reported before and should be further investigated with highly surface sensitive
techniques such as vibrational frequency spectrometry
FTIR was compromised by greater penetration depth (~ 100 nm) and signals
were collected from both the silica and alumina faces of kaolinite particles However it
would have been ideal to gather information from the first layer of the surface only
Recently Burdukova [56] used time-of-flight secondary ions mass spectroscopy
(ToF SIMS) to analyze the talc surface However these results were averaged over a few
trilayers of the talc surface The advancement of surface analysis technique seems
promising to gather information about the kaolinite faces as well as other clay surfaces
Further research is warranted to improve our understanding and establish the surface
chemistry features of clay surfaces particularly kaolinite
24
A pool of advanced analytical instruments such as BET XRF XRD EDS SEM
AFM LEIS and FTIR was used for kaolinite particle characterization The surface area
of the particles was estimated using BET whereas XRD and EDS were used to identify
the mineralogy and elemental composition of kaolinite Based on the elemental
composition the structural formula of kaolinite was determined Only 005 equivalents of
aluminum from the octahedral layer contributed to the silica tetrahedral layer SEM and
AFM confirmed the pseudo-hexagonal shape of the platy shaped kaolinite particles The
mean diameter and thickness of kaolinite were determined as 600 nm and 112 nm LEIS
and FTIR was used to obtain the spectra from the silica and alumina faces of kaolinite in
Summary
62
order to distinguish them from each other The ISS spectra showed a combined broad
peak for silicon and aluminum atoms which could not be resolved in the present analysis
and further research is warranted to better understand the surface properties of the
kaolinite faces
CHAPTER 3
SURFACE FORCE MEASUREMENTS AT THE BASAL
PLANES OF ORDERED KAOLINITE PARTICLES
An experimental procedure is presented to order kaolinite particles on substrates
for interrogation of the two basal plane surfaces by atomic force microscopy Surface
force measurements were performed between a silicon nitride tip and each of the two
kaolinite faces (silica tetrahedral face and alumina octahedral face) in 1 mM KCl solution
at pH 4 5 6 8 and 10 using atomic force microscopy The colloidal force measurements
reveal that the silica tetrahedral face of kaolinite is negatively charged at pH gt 4 whereas
the alumina octahedral face of kaolinite is positively charged at pH lt 6 and negatively
charged at pH gt 8 Such measurements have not been reported previously and the results
suggest that the iso-electric point of the silica tetrahedral face is at pH lt 4 and that the
iso-electric point of the alumina octahedral face lies between pH 6 and 8 These results
contradict the generally accepted view that basal plane surfaces of kaolinite carry a
permanent negative charge due to minor substitution of Al3+ for Si4+ in the silica
tetrahedral layer and suggest some surface charge dependency of the two faces with
respect to solution pH With this new information it may be possible to further explain
64
the electrokinetic behavior of kaolinite particles and their interactions in aqueous
suspensions
31
The interaction of kaolinite [Al2Si2O5(OH)4] particles is of particular importance
in widespread applications eg in ceramics in the manufacture of paper (as a coating
pigment and filler) in inks and paints (as an extender) and as an additive in the
production of rubber and polymers [53 63 116] Newer applications of kaolinite include
its use as a raw material in the production of fiberglass calcined kaolins cosmetics and
pharmaceuticals [116] Kaolinite naturally exists as micron-to-nanosized pseudo-
hexagonal platy-shaped thin particles The behavior of these nanosized kaolinite
particles in suspensions pastes and composite materials is controlled by surface
chemistry features Analysis of the surface chemistry features such as electrokinetic
phenomena is complicated by the anisotropic platy structure of the particles which
manifests itself in edge surfaces and face surfaces Even more so the mineral structure
suggests that there should be two types of surface faces defined by the 001 and the 001
basal planes In this way one face should be described as a silica tetrahedral layer and the
other face should be described as an aluminum hydroxide (alumina) octahedral layer as
shown in
Introduction
Figure 11
It is believed that the basal planes of kaolinite carry a permanent negative charge
due to isomorphous substitution of Al3+ for Si4+ in the silica tetrahedral and Mg2+ for
Al3+ in the alumina octahedral layer whereas the edge surface carries a positive or
negative charge depending on the pH of the system Therefore it is commonly assumed
65
that the basal planes do not show a surface charge dependency with varying pH
However this assumption has never been verified due to the difficulty in isolating the
two faces of kaolinite (silica tetrahedral and alumina octahedral faces) and the lack of
instrumentation to investigate the two faces when dealing with nanosized particles
Limited research has been reported on the experimental characterization of these
face surfaces if the faces can even be distinguished from one another for that matter [15]
Frequently the surface potential andor surface charge of the kaolinite particles as
measured by electrophoresis are reported in the literature [3 4 15 52 117] It is evident
however that the electrophoretic measurement does not take into consideration the
particle shape and the structural anisotropic characteristics In fact it is not exactly clear
what the measured electrophoretic mobility of kaolinite represents
A few studies have reported the averaged FTIR spectra of both faces of kaolinite
[53-55 115] Recent development of advanced analytical techniques (XPS - X-ray
photoelectron spectroscopy LEISS - Low energy ion scattering spectroscopy and ToF-
SIMS - Time of flight-secondary ions mass spectroscopy) seem promising to facilitate
investigation of the two faces of kaolinite provided the particles can be oriented and that
the instrumentation is sufficiently surface sensitive to collect signals from just the very
first layer of a face surface For example a recent study attempted ToF-SIMS analysis to
study the talc surface [56] However these results were averaged over a few layers of
talc Recently many researchers have used scanning electron microscopy (SEM) [58
59] transmission electron microscopy (TEM) [60 75] and atomic force microscopy
(AFM) [59 62 76] as imaging tools to characterize particle shape and morphology
66
It is now well established that AFM instrumentation can also be used to measure
surface forces between the cantilever probetip and a selected substrate In this regard an
experimental procedure has been developed to organize a set of well ordered nanosized
kaolinite particles for in-situ AFM surface force measurements following the approach
of Drelich et al [118] where they have preferentially deposited silica nanoparticles on an
alumina substrate and alumina nanoparticles on a silica substrate for AFM investigation
The significance of these AFM surface force measurements is that the electrokinetic
characteristics of the face surfaces of nanosized kaolinite particles can be described
following earlier research in which the cantilever probetip is used as a reference to
establish the electrokinetic features of a flat surface Such measurements have been
reported for alumina [119-122] and for fluorite [123]
The objective of this chapter is two folds (1) to describe an experimental
procedure to order kaolinite particles so that a selected face is exposed for in-situ
examination and (2) to characterize the two faces of kaolinite (the silica face and the
alumina face) by surface force measurements using AFM To order kaolinite particles
with the silica face exposed a negatively charged glass substrate is used so that the
alumina face might attach to the glass substrate as shown in Figure 31 In contrast to
expose the alumina face of the kaolinite particles a positively charged fused alumina
substrate is used so that the silica face will attach to the fused alumina substrate as
shown in Figure 31
67
Figure 31- Schematic representation for the organization and ordering of kaolinite particles
_ _ _ _ _ _ _ _ _ _ _ + + + + + + + + + + + +
Silica Face Exposed
Silica FaceAlumina Face
Alumina Face Exposed
Glass Fused Alumina
Silica Face
Alumina Face
_ _ _ _ _ _ _ _ _ _ _ + + + + + + + + + + + +
Silica Face Exposed
Silica FaceAlumina FaceSilica FaceAlumina Face
Alumina Face Exposed
GlassGlass Fused AluminaFused Alumina
Silica Face
Alumina Face
68
32
321
Materials and Methods
A clean English kaolin (Imerys Inc UK) was obtained from the St Austell area
in Cornwall UK The sample was cleaned with water only using elutriation to achieve
classification at a size of less than 2 microm No other chemical treatment was done Further
details about the kaolinite extraction and preparation are given in the literature [124] The
kaolinite was used as-received in this research The kaolinite suspension (1000 ppm) was
prepared in high purity Milli-Q water (Millipore Inc) The resistivity of the water was
above 18 MΩ-cm in all experiments Potassium chloride (1 mM solution) was used as
background electrolyte for surface force measurements The pH was adjusted to its
desired value using 01 M HCl or 01 M KOH solutions All chemicals used were of ACS
grade
Sample Preparation
XRD analysis conducted on the kaolinite sample confirmed that the kaolinite is
the dominant mineral phase EDAX analysis of the kaolinite sample showed nearly 11
atomic distribution of aluminum (798) and silicon (795) with trace amounts of
potassium (035) calcium (008) and iron (015)
322
Two substrates ndash a microscopic glass slide (Fisher Scientific Inc) and a fused
alumina substrate (Red Optronics Mountain View CA) were used to order the kaolinite
particles Two cut pieces of microscopic glass slide (10 x 10 x 05 mm) were cleaned
following SC1 procedure [125] Briefly the glass piece was cleaned in 511 mix of
H2ONH4OHH2O2 solution at 80oC for 20 minutes followed by rinsing with a copious
Substrate Preparation
69
amount of high purity Milli-Q water and dried with ultra high purity N2 gas On one
glass substrate a drop of kaolinite suspension at pH of 750 was air-dried overnight in a
petri-dish cover A second glass substrate was prepared in the same way without kaolinite
and used as reference (referred to as Glass-Substrate) for surface force measurements
Two fused alumina substrates were prepared by cleaning in 10 micro-90 solution at
850C for 3 hours followed by rinsing with a copious amount of high purity Milli-Q
water The alumina substrates were sonicated in 1 NaOH solution for 10 minutes to
remove excess surfactant rinsed with a copious amount of Milli-Q water and finally
blown dry with ultra high purity N2 gas A few drops of kaolinite suspension (1000 ppm)
at pH of 5 were air-dried overnight on the one alumina substrate in a petri dish cover
whereas the second alumina substrate was used as reference (referred to as Fused
Alumina-Substrate) for the surface force measurements All substrates were attached to a
standard sample puck for the surface force measurement using double-sided tape The
Fused Alumina-Substrate was cleaned in ultra-violet light cleaner (Bioforce Nanoscience
Inc IA) for 10 minutes just before surface force measurements Kaolinite particles
attached to glass and alumina substrates were each sonicated for 1 minute in Milli-Q
water to remove loosely adhered kaolinite particles washed with Mill-Q water and
gently blown with N2 gas before AFM surface force measurements
323
A picoforce AFM with Nanoscope V controller (Veeco Instruments Inc Santa
Barbara CA) was used with a PF-type scanner designed for picoforce measurements
Triangular beam silicon nitride (Si3N4) cantilevers (Veeco Instruments Inc Santa
Atomic Force Microscopy
70
Barbara CA) having pyramid-shaped tips with spring constants of about 015 Nm were
used The spring constant was determined using the thermal tuning method provided in
Nanoscope v 720 software The spring constants were determined after all the force
measurements were made Prior to force measurements the tip curvature and the conical
angle of the pyramid-shaped tip (Figure 32) were determined from the images captured
with a field emission scanning electron microscope (FEI Hillsboro Oregon) SEM
images were taken after the cantilever was glued with a carbon tape on the tilted
specimen stage to capture the side view of the top-portion of the tip as shown in Figure
32 The tip apex curvature was determined by fitting two circles to the curvature of the
tip The radii of the two circles were determined and an average value of the two radii
representing the tip curvature was calculated
The force measurements were made in 1 mM KCl solution at pH 4 5 6 8 and 10
using the picoforce AFM equipped with a fluid cell First an image of the substrate with
or without particles was obtained and then using the point and shoot feature of the
Nanoscope software the surface forces of particles and substrates were measured The
contact mode of operation was used to obtain images of the surface The raw data
(deflection in volts versus distance in nanometers) were then corrected for the baseline
(zero force ie when the silicon nitride tip is far away from the substrate) and constant
compliance to convert into force versus separation distance curves [126] At least 50
force measurements were made on glass and alumina substrates at 10 random locations
with 5 repetitions at any given location More than 75 surface force measurements were
made on 15 different kaolinite particles attached to each glass and alumina substrates
The force measurements were made on kaolinite particles which are at least 2-3 times
71
Figure 32- SEM images of silicon nitride tip (A) oblique view at low magnification (B) plan view of pyramidal tip at high magnification (indicated by arrow)
90-150 nm
1 μm1 μm1 μm
B
730
A
Silicon Nitride Tip
50 μm
72
larger than the cantilever tip to minimize the influence of the substrate All the force
measurements were performed at a scan rate of 1 Hz and captured at a resolution of 512
pointsmeasurement Approach force curves (when the cantilever is approaching the
substrate or the particles) were analyzed to determine the colloidal interaction forces
between the silicon nitride tip and the substrate Maximum repulsive forces were
recorded just before the silicon nitride tip jumps-in contact to the substrate The
interaction range between the silicon nitride tip and the substrate were determined when
the repulsive or attractive forces (from their maximum value) were within the 10 of the
zero force Zero force was determined from the average of 100 force data points when the
cantilever is far from the substrate
324
The cantilevers used for the surface force measurements have pyramidal shaped
silicon nitride tips The shape of the tips can be reasonably approximated as conical with
a spherical cap at its apex (see
DLVO (Derjaguin-Landau-Verwey-Overbeek) Model
Figure 33) DLVO theory accounts for electrostatic and
van der Walls (vdW) forces that may be of significance between the silicon nitride tip
and the substrate or kaolinite particle faces The derivation of DLVO theory for a
pyramidal-shaped tip and a flat substrate is given in the literature [127] and only the final
equations are listed below
DLVO Electrostatic vdWF F F= + (3-1)
73
Figure 33- Diagram showing the conical end portion of the silicon nitride tip with a spherical cap Angles α and β are the geometrical angle of the spherical cap at the tip apex and conical tip respectively with α + β = 900 D is the separation distance from the tip end to the substrate L is the distance between a differential surface section of the tip and the substrate r is the radius of the tip at a given vertical position R is the radius of the spherical cap at the tip apex
R
D
L
r
αβ
Substrate
Tip
R
D
L
r
αβ
R
D
L
r
αβ
Substrate
Tip
74
van der Waals force
12 21
2 21 1
( ) 26
10 ( sin tan ) (1 cos )3 tan
vdW R D LA R DFL D
A R D RL L
α α αα
+ minus minus= minus minus
minus minus minus
+
(3-2)
Electrostatic force (constant surface potential case)
( ) ( )( )1 1
1 1
22 2 20 0 1 0 2 3
2 220
1 2
4 2
( )4tan 2
T S
T S
L LElectrostatic D DT S
L LT S
F a e a e a e a e
b e b e
κ κκ κ
κ κ
πε εψ ψ πε ε ψ ψ
ψ ψπε εκ ψ ψα
minus minusminus minus
minus minus
= minus minus + minus
++ minus
(3-3)
where
1 1(1 cos ) 1 1sintan tan
D Rb R Lααα α κ
+ minus = minus + + (3-4)
2 1(1 cos ) 1 1sintan tan 2
D Rb R Lααα α κ
+ minus = minus + + (3-5)
( )1 0 1 2 0 3 1 1ndash ndash1 ndash1 05 05L D R cos a R a R cos a a a aα κ κ α= + = = = + = + (3-6)
α and β are the geometrical angles of the spherical cap at the tip apex and the
conical tip respectively with α + β = 900 D is the separation distance from the tip end to
the substrate L is the distance between a differential surface section of the tip and the
75
substrate r is the radius of the tip at a given vertical position R is the radius of the
spherical cap at the tip apex ε is the dielectric constant of the solution in this system ε0 is
the permittivity of a vacuum κ-1 is the Debye length ψ is the surface potential A is
combined Hamaker constant of the tip-solution-substrate system and subscripts S and T
refer to substrate and tip respectively
With these equations (equations (3-2) and (3-3)) the DLVO model (constant
potential) was fitted to the experimental force curves obtained between a silicon nitride
tip and the substrates (the Glass-Substrate and the Fused Alumina-Substrate) or the two
faces of kaolinite particles (the silica tetrahedral face and the alumina octahedral face)
When AFM force data are analyzed DLVO theory requires the input of two diffuse layer
potentials ψsurface and ψsilicon nitride tip On the basis of the assumption that the measured ζ-
potentials are good approximations for these diffuse layer potentials in low electrolyte
conditions we can use them as a guide in theoretical fitting of the experimental force
data Experimental force profiles at each pH can be fitted by fixing ψsilicon nitride tip at ζ-
silicon nitride tip and adjust ψsurface until theoretical and experimental force profiles
overlap The surface potential of the silicon nitride tip at varying pH was taken from the
literature [128]
The surface potential of the substrates or each of the two faces of kaolinite was
estimated by matching the DLVO model to the experimental force curves The
parameters used for the DLVO model are R = 120 nm β = 3650 Asilicon-nitride = 162 x 10-
19 J [128] AKaolinite = 680 x 10-20 J [129] Aalumina = 152 x 10-19 J Aglass = 650 x 10-20 J
and Awater = 370 x 10-20 J [130] The surface potential was then converted to surface
charge density (σ) using the Grahame equation as follows
76
0 08 sinh2B
B
ec k Tk Tψσ ε ε
=
(3-7)
where c0 is the bulk ion-number concentration of the salt kB is the Boltzmann constant e
is the electronic charge and T is the absolute temperature
33
331
Results and Discussion
AFM images of the glass and fused alumina substrates are shown in
Interaction Forces at Reference Substrates
Figure 34
The root-mean-square surface roughness values for the glass and fused alumina
substrates were determined as 037 nm and 034 nm respectively The interaction forces
between the silicon nitride tip and the glass and the fused alumina substrates are shown in
Figure 35 The iso-electric point (pH at which the surface carries zero net electric
charge) of the silicon nitride tip as determined from the interaction between a silicon
nitride tip and a silicon nitride wafer was taken as pH 4 [128] Therefore silicon nitride is
expected to be negatively charged at pH gt 4 However a few studies have reported an
iso-electric point of silicon nitride in between pH 5-7 depending on the treatment of the
surface [131-133]
Five force curves are shown for each pH value of interest to establish the good
reproducibility between the experimental force curves (see Figure 35) A 10-20
variation in the magnitude of colloidal forces is commonly observed in AFM studies
[127] As expected repulsive interactions dominate between the silicon nitride tip and the
77
Figure 34- Topographic height images of Glass-Substrate (A1 and B1 above) and Fused Alumina-Substrate (A2 and B2) as obtained by AFM using a silicon nitride tip in contact mode The white cross-bars on the A1 and A2 images show the location where force measurements between the silicon nitride tip and the substrate were performed
4 6 8 10
22
46
810
00 nm30 nm
Fused Alumina-SubstrateGlass-SubstrateA2A1
B1 B210 μm
26 8
10
42
48
610
00 nm50 nm
010 μm0
78
Figure 35- Interaction forces measured between a silicon nitride tip and the Glass-Substrate (left) and the Fused Alumina-Substrate (right) in 1 mM KCl solution at increasing pH Five replicates (red-circle) of force curves at different locations on the substrate along with DLVO fit (black-line) are shown
Glass-Substrate Fused Alumina-Substrate
1 mM KCl 1 mM KClz ~
2
15
o 05 L1
i 1 pH 400
l __ _ -05L-~~1~~ __ ~~_-----
o
z j ~
2
15
o 05 L1
I I
j bull
- - pH 500
~--05L-L1~_~~_~~~-----J o
z ~
2
15
o 05 L1
z ~
o
2
15
o 05 L1
o
pH 600
pH 800
l - - - --05L-~_~~_~~_~~_
z ~
2
15
o 05 L1
o
1 t
pH 1000
~ - - - - -
2
15
05
o
2
15
05
o
2
15
05
o
2
15
05
o
2
15
05
o
bull i
pH 400
i()c= - --- - - -
pH 500
~ if -------
pH 600
I pH 800
~ ~ - ---_
pH 1000
I ~~--- ~~ ~~~ ~ --~
-05 -05~--_------------------ -10 0 10 20 30 40 50 60 70 -10 0 10 20 30 40 50 60 70
Separation Distance nm Separation Distance nm
79
Glass-Substrate at all pH gt 4 (see Figure 35 and Table 31) At least 50 force curves were
analyzed at any given pH of the system unless otherwise stated
The magnitude of repulsive forces (indicated by positive sign in forces) increased
by a factor of 5 (+024 to +122 nN) with increasing pH from 4 to 8 in good agreement
with the DLVO theory At pH 10 a slight reduction in the repulsive forces to +094 nN
was observed which may be related to the dissolution of glass at higher pH At distances
gt 2 nm the long-range electrostatic double layer repulsion dominates the interaction
between a silicon nitride tip and the Glass-Substrate which extend up to 20 to 30 nm with
increasing pH values At distances lt 2 nm the snap-in contact between the silicon nitride
tip and the Glass-Substrate was observed due to short-range van der Walls attraction The
van der Walls force being attractive and this dominant force causes the snap-in contact
between the silicon nitride tip and the Glass-Substrate At these distances electrostatic
repulsion is the dominant interaction compared to short-range interaction due to van der
Wall hydration and solvation forces which are negligible The interaction range between
a silicon nitride tip and the Glass-Substrate was nearly constant to 22-28 nm at all pH
values (Table 31) The colloidal interaction forces indicate that the iso-electric point of
the glass substrate is at a pH value lt 4 This is in good agreement with the iso-electric
point of pH 35 for glass as reported in the literature [134] Few researchers have also
determined the iso-electric point of silica surface using AFM surface force measurement
considering silica as the substrate or the probe attached to the cantilever Raiteri et al
[135] found the iso-electric point at pH 35 of SiO2 film (gt100 nm thick) as a substrate
from the surface force measurements under similar solution chemistry conditions
80
Table 31- Experimental interaction forces and the interaction range measured between silicon nitride tip and the substrates
Glass-Substrate Fused Alumina-Substrate pH Force Range Force Range nN nm nN nm 4 +0241 plusmn 0087 2230 plusmn 451 -0486 plusmn 0286 1181 plusmn 916 5 +0562 plusmn 0082 2808 plusmn 383 -0272 plusmn 0097 1749 plusmn 400 6 +0538 plusmn 0211 2709 plusmn 605 -0119 plusmn 0060 273 plusmn 108 8 +1226 plusmn 0347 2840 plusmn 558 +0303 plusmn 0057 2433 plusmn 394 10 +0943 plusmn 0195 2805 plusmn 386 +0281 plusmn 0036 1903 plusmn 371
Note that the average plusmn standard deviations were calculated from 50 experimental forces between a silicon nitride tip and the substrates at 10 different locations with 5 repetitions at any given location
Positive and negative sign in force indicate repulsion and attraction respectively
81
Sokolov et al [133] also determined the iso-electric point of silica at less than pH
40 from the surface force measurements between silica probe and polyurethane
substrate In contrast to the Glass-Substrate attractive interaction dominates between a
silicon nitride tip and the Fused Alumina-Substrate at pH lt 6 whereas repulsive
interactions were observed at pH 8 and 10 (see Figure 35 and Table 31) At pH lt 6 the
attractive forces (indicated by negative sign in forces) dominated by electrostatic
attraction between a silicon nitride tip and the Fused Alumina-Substrate decreased by a
factor of 4 (-049 nN to -012 nN) with increasing pH from 4 to 6 whereas electrostatic
repulsive forces of the order of 030 nN were observed at pH 8 and 10 Again a good fit
between experimental force curves and DLVO theory was observed at all pH values
There is no significant dependence on interaction range with pH observed (Table 31)
though short range attractive interaction was observed at pH 6 The force curves indicate
that the isoelectric-point of Fused Alumina-Substrate is between pH 6 and 8 in good
agreement with the isoelectric point of alumina at pH 7 to 9 as reported in the literature
[112 134] Similar to our finding Veeramasuneni et al [119] and Yalamanchili et al
[121] also observed such similar trends in surface force measurements between the silica
probe and the α-alumina substrate ie attractive interaction at pH 55 64 and 86 and
repulsive interaction at pH 102 and 108 in de-ionized water adjusted to different pH
values However they observed over one order of magnitude larger surface forces
between the silica probe and the α-alumina substrate which could be related to
differences in the probe size and composition (48 microm silica probe used in their work vs
120 nm silicon nitride tip used in this work) In research reported by Hupka [112] the
repulsive force between a silica sphere and a flat surface was found to increase by a
82
factor of about 5 when the silica sphere colloidal probe diameter was increased from 1
microm to 20 microm
332
The two faces of kaolinite are the silica face (001 basal plane) and the alumina
face (001 basal plane) as discussed in the introduction Therefore it is expected that the
001 face of kaolinite will behave like the Glass-Substrate and will be negatively charged
at pH gt 40 Also it is expected that the 001 face of kaolinite will behave like the Fused
Alumina-Substrate and will be positively charged at pH lt 60 and negatively charged at
pH 80 and 100 In this way kaolinite particles which attach to the glass substrate will
expose the 001 face (silica tetrahedral layer) and the kaolinite particles which attach to
the fused alumina substrate will expose the 001 face (alumina octahedral layer) to the
silicon nitride tip (see
Interaction Forces at Kaolinite Faces
Figure 31)
The topographic images of kaolinite particles on glass and fused alumina
substrates are shown in Figure 36 Both the images confirm the pseudo-hexagonal shape
and platy features of the kaolinite particles Kaolinite particles consist of several layers of
the silica-alumina bilayers though in some images a single layer of kaolinite (07 nm
thick) was also observed (images not shown) The interaction forces between the silicon
nitride tip and the two faces of kaolinite are shown in Figure 37 Again a good
reproducibility of force curves is shown by five replicates performed on different
particles Similar to Glass-Substrate when the silica tetrahedral layer of kaolinite is
exposed a repulsive interaction dominates between the silicon nitride tip and the 001 face
of kaolinite at all pH values which indicates an iso-electric point of pH lt 4 for the silica
83
Figure 36- Topographic height images of kaolinite particles deposited on glass (left) and fused alumina (right) substrates respectively as obtained by AFM using a silicon nitride tip in the contact mode The white cross-bars on A1 and A2 images show the locations where the forces between the silicon nitride tip and the kaolinite faces were measured
Alumina Face of KaoliniteA1 A2Silica Face of Kaolinite
0 10 μm 0 10 μmB1 B2
12
34 5
12
34 5
12
34
5
12
34
5
0 nm500 nm
0 nm500 nm
84
Figure 37- Interaction forces measured between silicon nitride tip and silica tetrahedral face (left) and alumina octahedral face (right) of kaolinite in 1 mM KCl solution at increasing pH Five replicates (red-circle) of force curves on different particles along with DLVO fit (black-line) curve are shown
Silica Face of Kaolinite Alumina Face of Kaolinite
1 mM KCl 1 mM KCl
85
face of kaolinite The long-range electrostatic repulsive forces between the silicon nitride
tip and the silica face of kaolinite fit well with the DLVO model The magnitude of
electrostatic repulsion increased nearly over a magnitude from 015 to 128 nN with
increasing pH This is an interesting result as an increase in over a magnitude of
repulsive force could not be explained solely by the increasing surface potential andor
surface charge density of the silicon nitride tip with increasing pH This suggests some
contribution from the pH dependent surface charge density sites on the silica tetrahedral
layer of kaolinite and contradicts the assumption that the silica tetrahedral face of
kaolinite carries a permanent negative charge and does not show a dependency on pH
Note that the traditional position accounts for the negative charge due to minor
substitution of Al3+ for Si3+ in the silica tetrahedral layer and does not account for the
possibility of broken bonds which may explain some surface charge dependency on pH
variation The interaction range between a silicon nitride tip and the silica face of
kaolinite does not change appreciably with increasing pH in agreement with the results
obtained on the Glass-Substrate (Table 32)
Similar to the pH dependency of our AFM measurement and our calculated
surface charge densities for the basal planes of kaolinite Zhou and Gunter [136] observed
that the surface charge of kaolinite particles determined from potentiometric titration are
over one order of magnitude greater than that predicted by varying the surface site
concentration on the edge faces of kaolinite
Even adding the structural charge of kaolinite particles determined from the
cationic exchange capacity in acidic solutions [28] the results do not match the surface
86
Table 32- Experimental interaction forces and the interaction range measured between silicon nitride tip and the two faces of kaolinite
Silica Face of Kaolinite Alumina Face of Kaolinite pH Force Range Force Range
nN nm nN nm 4 +0147 plusmn 0073 2085 plusmn 357 -0308 plusmn 0102 1247 plusmn 567 5 +0817 plusmn 0168 2524 plusmn 258 -0406 plusmn 0084 671 plusmn 242 6 +0667 plusmn 0183 3005 plusmn 599 -0217 plusmn 0049 491 plusmn 136 8 +1282 plusmn 0296 2080 plusmn 305 +0568 plusmn 0099 1215 plusmn 151 10 +0604 plusmn 0070 2363 plusmn 420 +0263 plusmn 0033 1705 plusmn 808
Note that the average plusmn standard deviations were calculated from 50 experimental forces on at least 10 different particles with
five measurements at one location on each particle
87
charge density determined from the potentiometric titration which led the authors to
conclude that ldquobasal faces of kaolinite are ionizable in aqueous solutionsrdquo
As expected the interaction forces obtained on the silica face of kaolinite are
comparable to these obtained on the Glass-Substrate with slightly decreased forces on the
silica face of kaolinite at pH 4 and 10 and slightly increased forces at pH 5 6 and 8
It should be noted that the Glass-Substrate is mainly composed of SiO2 beside
other alkali and alkaline earth oxides such as Na2O CaO MgO and K2O as well as
A12O3 Fe2O3FeO [137] whereas the silica face of kaolinite is composed of SiO2 only
These slight variations in the magnitude of repulsive forces are expected from the
difference in the composition of the Glass-Substrate and the silica face of kaolinite
In contrast to the silica tetrahedral face of kaolinite attractive interaction
dominates between a silicon nitride tip and the alumina octahedral face of kaolinite at pH
4 5 and 6 At higher pH of 8 and 10 repulsive interactions were observed The attractive
interaction forces only decreased by a factor of 15 (-031 to -022 nN) with increasing pH
from 4 to 6 and turned repulsive to +057 nN at pH 8 and +026 nN at pH 10 (Table 32)
The range of interaction also decreased from 10 nm to 45 nm with increasing pH from 4
to 6 and remains constant at 12 nm at higher pH of 8 and 10 The force curves seem to be
in accordance with the DLVO theory as shown in Figure 37 These results suggest that
the iso-electric point of the alumina face of kaolinite (001 basal plane) lies between pH 6
and 8 The force curves on the alumina face of kaolinite and the Fused Alumina-Substrate
are comparable and of the similar magnitude
Interestingly at pH 4 the attractive force field of the alumina face of kaolinite (-
030 nN) is greater than the repulsive force field of the silica face (+015 nN) whereas at
88
pH gt 5 the repulsive force field of the silica face dominates over the attractive force field
of the alumina face (the magnitude of the repulsive force on the silica face is greater than
the attractive force on the alumina face of kaolinite) Also the long range of electrostatic
repulsion on the silica face is significantly greater (by at least 10 nm) than the range of
electrostatic attraction for the alumina face of kaolinite This implies that the repulsive
force field on the silica face starts to have a significant influence at greater separation
distances and dominates over the attractive force field from the alumina face of kaolinite
at pH gt 5 Hypothetically if we ignore any contribution from the edge surfaces of the
kaolinite particles then it can be said from the combined interaction of the silica and the
alumina faces of kaolinite that kaolinite particles will be positively charged at pH 4 and
will be negatively charged at pH gt 5 It is commonly accepted that edge surfaces of
kaolinite contain pH-dependent surface charge due to broken silica and alumina bonds
with an iso-electric point at neutral pH of 7 In this way the iso-electric point of kaolinite
can be determined from the combined silica tetrahedral face and the alumina octahedral
face along with the edge contribution Such analysis is currently under investigation
Nevertheless the present work on the surface force measurements demonstrates that the
two faces of kaolinite ndash the silica face and the alumina face ndash differ significantly in their
surface chemistry characteristics
333
The surface potentials and surface charge densities determined from the DLVO
fits of the experimental force curves on the Glass-Substrate and the Fused Alumina-
Surface Potential and Surface Charge
89
Substrate are shown in Figure 38 Zeta-potential values of silica and alumina particles as
determined by electrophoresis are also shown in Figure 38 [134]
The surface potential of the silicon-nitride tip varied from -25 to -75 mV with
increasing pH from 4 to 10 The surface potential of the Glass-Substrate varied from -56
to -92 mV with increasing pH from 4 to 8 and slightly decreased to -77 mV at pH 10 In
contrast the surface potential of the Fused Alumina-Substrate varied from +60 to -39 mV
with increasing pH from 4 to 10
The surface potentials of the Glass-Substrate as estimated from surface force
measurements are in reasonably good agreement with the zeta-potential of silica particles
as determined by electrophoresis However the surface potential values of Fused
Alumina-Substrate estimated from surface force measurements are somewhat lower than
the zeta-potential of alumina particles determined by electrophoresis This difference may
be related to the purity of the Fused Alumina-Substrate vs that of the alumina particles
Figure 39 shows the surface potential and the surface charge density of the two faces of
kaolinite (the silica face and the alumina face) estimated from surface force measurement
via DLVO model fitting For the first time the surface potential andor surface charge of
the silica tetrahedral face and the alumina octahedral face of kaolinite particles have been
determined and are shown to be dependent on solution pH (see Figure 39) as opposed to
the existing belief that the two faces of kaolinite carry a fixed negative structural charge
Furthermore the alumina octahedral face of kaolinite shows an iso-electric point in
between pH 6 and 8 whereas the silica tetrahedral face of kaolinite shows an iso-electric
point at pH lt 4 The surface potential of the alumina octahedral face varied from +50 to -
37 mV with increasing pH from 4 to 10 whereas the silica tetrahedral face showed
90
Figure 38- (A) Surface potential and (B) surface charge of the Glass-Substrate and the Fused Alumina-Substrate as a function of pH The calculated surface potentials are compared to electrophoretic zeta potentials reported for silica and alumina by Kosmulski [134]
-120
-100
-80
-60
-40
-20
0
20
40
60
80
3 4 5 6 7 8 9 10 11
Su
rfa
ce
Po
ten
tia
l m
V
pH
Glass-Substrate
Fused Alumina-Substrate
Silica (Kosmulski 2001)
Alumina (Kosmulski 2001)
A
-20
-15
-10
-5
0
5
10
3 4 5 6 7 8 9 10 11
pH
B
Su
rfa
ce
Ch
arg
e D
en
sit
y m
Cm
2
91
Figure 39- Surface potential and surface charge density of the silica face (A) and the alumina face (B) of kaolinite particles as a function of pH
-100
-80
-60
-40
-20
0
20
40
60
2 3 4 5 6 7 8 9 10 11
Surfa
ce P
oten
tial m
V
pH
Silica Face of Kaolinite
Alumina Face of Kaolinite
A
-14-12-10-8-6-4-202468
3 4 5 6 7 8 9 10 11
pH
B
Surfa
ce C
harg
e D
ensi
ty m
Cm
2
92
negative surface potential over the entire pH range which varied from -36 to -67 mV
with increasing pH from 4 to 8 and a slight decrease at pH 10
This new information should be helpful to explain the electrokinetics of kaolinite
Further research is in progress to accommodate the surface charge of the edge surfaces
and the two basal plane surfaces to better understand the electrokinetic behavior of
kaolinite particles
34
The electrokinetic characteristics of kaolinite are typically considered based on
electrophoretic measurements It is evident that the electrophoretic measurements are
compromised by the shape and anisotropic character of kaolinite particles and do not
reveal too much surface chemistry detail The present work describes a procedure to
expose the two faces of kaolinite (silica tetrahedral face and alumina octahedral face) by
ordered deposition of the kaolinite particles on glass and alumina substrates respectively
In this way the 001 and 001 basal plane surfaces were interrogated using AFM for
surface force measurements The surface forces were explained using DLVO theory and
the magnitude of the surface forces and the interaction range were compared Clearly the
present work demonstrates the different behavior of the two faces of kaolinite ndash the silica
tetrahedral face and the alumina octahedral face On this basis the iso-electric point of
the silica tetrahedral face and the alumina octahedral face were determined and found to
be lt pH 4 for the silica face and between pH 6 and 8 for the alumina face
Summary
The electrokinetic properties of kaolinite will have a contribution from both faces
of kaolinite (silica tetrahedral face and alumina octahedral face) as well as from edge
93
surfaces AFM surface force results are significant and provide the basis to determine the
surface charge density and surface potential of kaolinite faces thus providing more
detailed information regarding the surface chemistry of kaolinite With this new
information it may be possible to further explain the electrokinetic behavior of kaolinite
particles and their interactions in aqueous suspensions
CHAPTER 4
ELECTROKINETICS AND TITRATION OF
KAOLINITE PARTICLES
The electrokinetic properties of kaolinite are complicated by anisotropic particle
features ndash nonuniform surface charge densities on the faces (the silica face the alumina
face and the edge surfaces) and its platy-shape Numerous works have been conducted
by researchers both experimentally and theoretically to predict the electrophoretic
mobilities of the kaolinite particle and to improve the Smoluchowskirsquos classical model in
order to get better understanding of the electrokinetic properties for kaolinite particles
This dissertation research provides a review of the earlier works to attempt to predict the
electrokinetic properties of kaolinite Using Smoluchowskirsquos classical model the
apparent iso-electric point for kaolinite was determined at less than pH 3 from
electrophoretic measurement
This chapter discussed the surface charge properties of kaolinite determined
experimentally using traditional titration techniques such as M-R titration and
potentiometric titration and using a new technique to determine surface potential and
surface charge density from surface force measurement using atomic force microscopy
95
The point of zero charge for kaolinite particles will be established by titration techniques
and by surface force measurements
41
The surface chemistry of kaolinite [Al2Si2O5(OH)4] particularly its electrokinetic
properties is very important in many applications such as flotation filtration and many
new applications such as clay-polymer nanocomposites and smart materials [1 5-7 53
63 67 138-141] The surface charge of kaolinite particles are manifested in their basal
planes surfaces (001 and 001) and edge surfaces (010 and 110) The basal plane surfaces
001 and 001 consist of silica tetrahedral and alumina octahedral layers respectively The
edge surfaces consist of broken covalent bonds of aluminol and silanol end-groups It is
believed that the basal planes of kaolinite carry a permanent negative charge due to
isomorphous substitution of Al3+ for Si4+ in the silica tetrahedral and Mg2+ for Al3+ in the
alumina octahedral layer whereas the edge surface carries a positive or negative charge
depending on the pH of the system [23 26 49 142] Therefore it is commonly assumed
that the basal planes do not show a surface charge dependency with varying pH
Introduction
The surface charge densities of kaolinite particles are determined more frequently
by electrophoretic technique to determine their iso-electric point Researchers have
reported the iso-electric point of kaolinite particle as pH of 2ndash4 by electrophoresis
depending on the source of kaolinite and sample preparation techniques [46 51 143
144] However we must bear in mind that the electrophoresis is based on four basic
assumptions (1) the particle is rigid and nonconducting (2) the local mean radius of
curvature is much larger than the Debye screening length (3) the surrounding fluid is
96
unbounded and (4) the zeta-potential is uniform over the particlersquos surface The kaolinite
particles are pseudo-hexagonal platy shaped and are of the order of less than a micron-
to-nano sized range Furthermore the kaolinite particles have anisotropic properties in
their basal planes surfaces and edge surfaces which complicates the electrophoretic
analysis Nevertheless we rely on these measurements in the absence of appropriate
theory
Few researchers have also conducted potentiometric titration to determine the
surface charge densities of kaolinite particles as a function of pH [34 38] These authors
determined a point of zero net proton charge (pznpc) for kaolinite particles at pH 45 by
titration study The pznpc is the pH value at which the net proton surface charge is equal
to zero [145 146]
The main objective of this chapter is two-fold (1) to highlight the limitation of
the current electrophoretic theory to describe the electrokinetic properties of kaolinite
particles and (2) to compare electrophoresis potentiometer titration to determine the
surface charge properties of kaolinite particles
42
421
Materials and Methods
A clean English Kaolin (Imerys Inc UK) was obtained from the St Austell area
in Cornwall UK The sample was cleaned with water only using elutriation to achieve
classification at a size of less than 2 microm No other chemical treatment was done Further
details about the kaolinite extraction and preparation are given in the literature [124] The
kaolinite was used as-received in this research The kaolinite suspension was prepared in
Sample Preparation
97
high purity Milli-Q water (Millipore Inc) The resistivity of the water was above 18 MΩ-
cm in all experiments Potassium chloride (1 mM 10 mm and 100 mM solution) was
used as background electrolyte The pH was adjusted to its desired value using 01 M
HCl or 01 M KOH solutions All chemicals used were of ACS grade
XRD analysis conducted on the kaolinite sample confirmed that the kaolinite is
the dominant mineral phase EDAX analysis of the kaolinite sample showed nearly 11
atomic distribution of aluminum (798) and silicon (795) with trace amounts of
potassium (035) calcium (008) and iron (015)
422
The zeta-potential measurements were carried out by electrophoresis (ZetaPALS
Brookhaven Instrument Corp and Malvern Nanosizer) The particles suspension
(005) was prepared at desired solution concentration and placed in between two
electrodes The particles mobilities were measured when the electric field is applied This
particle mobility is converted to zeta-potential (120577) using Smoluchowskirsquos equation as
follows
Zeta-Potential Measurements
4
U Eεςπη infin= (4-1)
Where Einfin is the applied electric field and U is the particle velocity in a fluid with
dielectric constant ε and viscosity η
98
423
M-R titration was named after two researchers Mular and Roberts who
developed this technique to determine the point of zero charge of colloidal particles
[147] In this method the pH of a suspension is measured at different ionic strengths of
the solution [147] The suspension is prepared at given solution chemistry ndash ionic
strength and pH of the system The ionic strength is then increased to yield a change in
pH of the suspension The change in the pH (pHi ndash pHf) when plotted with pHf gave
information about the iso-electric point of the particles
Mular-Roberts (M-R) Titration
At the iso-electric point
0i fpH pH pH∆ = minus = (4-2)
The particles suspension (1) was prepared in 10 mM KCl solution 20 ml of this
suspension was taken in a SC-1 cleaned beaker in a continuous ultra high purity N2
environment The solution pH was then adjusted to some initial pHi The ionic strength
was then increased to 100 mM using the appropriate amount of KCl and the final pH
(pHf) of the system is noted The results reported are the average of at least two full
repeat experiments
424
The particles suspension (5) was prepared in 10 mM KCl solution (50 ml) and
adjusted to initial acidic pH (pHi) in a continuous ultra high purity N2 environment A
small amount of base 10 microl (01M KOH) was added each time and pH of the suspension
Potentiometric Titration
99
was noted This was continued until the pH of the suspension reach pH 9 The surface
charge of the particle suspension is then calculated as
[ ]( )a bF C C H OHSA
σ + minus = minus minus + (4-3)
where σ is the proton surface charge density (Cm2) F is Faradayrsquos constant SA is
mineral surface area (m2liter) and Ca and Cb are the amounts of acid and base titrant
added (molliter) respectively
43
The electrokinetic theory deals with the charged surfaces in liquids generally in
water Because of its high dielectric constant water is a good solvent for ions For this
reason most surfaces in water are charged Different processes can lead to charging of
the slid surfaces such as protonation or deprotonation reactions from the solid surfaces
lattice substitution of different valency ions and specific adsorption The lattice
substitution is particularly important as the charging mechanism of the clay mineral
surface
Electrokinetic Theory
Surface charges cause an electric field This electric field attracts counter ions
The layer of surface charges and counter ions is called ldquoelectric double layerrdquo Helmholtz
first described the simplistic model of an electrical double layer the counter ions bind
directly to the surface and neutralize the surface charges much like in a plate capacitor
The electric field generated by the surface charges is accordingly limited to the thickness
100
of a molecular layer Helmholtzrsquos model was able to interpret some basic features of
charged surfaces but the model failed to explain the capacitance of an electric double
layer
Gouy and Chapman went a step further and took into account a thermal motion of
the ions Thermal fluctuations tend to drive the counterions away from the surface They
lead to the formulation of a diffuse layer which is more extended than a molecular layer
as shown in Figure 41 Gouy and Chapman applied their theory on the electric double
layer to the planar surfaces Later Debye and Huumlckel calculated the potential and ion
distribution around the spherical surfaces Both the Gouy-Chapman and Debye-Huumlckel
are continuum theories
Following the Gouy and Chapman model of ldquoelectrical diffuse double layerrdquo the
concentration of ions within the interface is assumed to follow the Boltzmann distribution
which can be expressed as
( ) ( ) exp i xi i
z en x nkTψminus = infin
(4-4)
where 120595x is electrostatic potential at the distance x from the surface of the clay platelet
with a surface potential 1205950 zi is the valency of ion i and e is the electron charge (1602 x
10-19 C) The symbol ni (x) represents the concentration of ion i in the electrolyte at the
distance x from the particle surface and ni (infin) is the concentration of ion i in the bulk
solution The product kT is the thermal energy (Brownian) with k being the Boltzmann
constant and T is the absolute temperature (K) In a 11 symmetrical and indifferent
101
Figure 41- Helmholtz and Gouy-Chapman model of the electric double layer
_ __ _ _ _ _ _ _+ + ++ ++
+
++ +_
_
_
_
Solid
Helmholtz
_ __ _ _ _ _ _ _++
+ +
++
++ +_
_
_
_
Solid
Gouy-Chapman
102
electrolyte solution the charge density ρx at a distance x from the particle surface is given
by the summation
( )x i iiz en xρ =sum (4-5)
Substituting ni (x) from equation (4-4)
( ) exp i xx i ii
z ez enkTψρ minus = infin
sum (4-6)
A fundamental theorem of electrostatics known as the Poisson equation
expresses the relationship between the charge density ρx at a point x and the change in the
electrostatic potential 120595 at that point in a medium with the dielectric constant ϵr
2 x
o r
ρψε ε
nabla = minus (4-7)
where nabla2 is the Laplacian operator and can be reduced to part2 120595partx2 for a one-dimensional
case which is appropriate for a double layer on a flat clay surface Replacing ρx by
equation (4-6)
2
2
1 ( ) exp i xi ii
o r
z ez enx kT
ψψε ε
minuspart = minus infin part sum (4-8)
103
This is the Poisson-Boltzmann equation which was considered to be the
mathematical essence of the diffuse double layer Unfortunately there is no explicit
solution for this equation but approximations for certain limiting cases exist among these
are Gouy-Chapmanrsquos approximation for moderate surface potentials and electrolyte
concentrations up to 100 mM and Debye-Huumlckel approximation for low surface
potentials and dilute solutions The Poison-Boltzmann model itself leads to imperfections
due to several assumptions made in the theory such as
i The finites size of the ions was neglected
ii Ions in solution were considered as a continuous charge distribution
iii All noncoulombic interactions were disregarded
iv The solvent is supposed to be continuous and the permittivity of the medium to be
constant
v Surfaces are assumed to be flat on the molecular scale
vi Image forces between the ions and the surface were ignored
Despite these strong assumptions the Poisson-Boltzmann theory describes
electric double layers surprising well The reason is that errors lead to opposite effects
and compensate each other For example including noncoulombic interactions lead to an
increase of the ion concentration at the surface and a reduced surface potential On the
other hand taking the finite size of the ions into account leads to a lower ion
concentration at the surface and thus an increased surface potential Likewise a reduction
of the dielectric permittivity due to the electric field increases its range but at the same
time reduces the surface potential because less ions dissociate or adsorb The readers are
104
also advised to review the literature for electrokinetic theory in greater details [24 148-
150]
The most rigorous approach to improve the Poison-Boltzmann theory is by
starting from first principles applying statistical thermodynamic equations for bulk
electrolytes and nonuniform fluids Excellent reviews about the statistical mechanics of
double layer have appeared [151 152] Also computer simulations increased our
understanding of electric double layer significantly [153] Despite these advancements
dealing with statistical mechanics and computer simulations simple analytical formulas
that can easily be applied are not available In addition for a complete description the
molecular nature of the solvent should be considered
Fortunately Stern proposed a relatively simple semi-empirical extension of the
Gouy-Chapman theory In Stern theory the electric double layer is divided into two
parts an inner part the Stern layer and an outer part the Gouy or diffuse layer The
Stern layer consists of a layer of ions (δ) which are directly adsorbed to the surface and
which is immobile The potential at the point where the bound Stern layer ends and the
mobile diffuse layer begins is the zeta potential (ς potential) A simplified version of the
Stern layer is shown in the Figure 42
Following the Stern model of electric double layer the surface potential of the
solid particles at the solid-liquid interface is frequently characterized by electrophoresis
Significant contributions have already been made regarding electrophoresis from
numerous researchers dealing with the field of electrokinetic phenomena These studies
range from the earliest works of Smoluchowski [149] and Henry [154] where the
attention was devoted to the motion of a single spherical colloidal particle under certain
105
Figure 42- Stern model of the electric double layer
+++
++
+
++
++
+
________
_
_
_
_
_
_
_
x
ψo
ψδ
δ
106
limiting conditions to modern theories detailing the motion of a swarm of particles in a
concentrated dispersion employing cell models
Here we will present an analysis of evaluating the electrophoretic velocity of a
charged particle when it is placed in an electric field First the motion of a single charged
spherical particle under the influence of an external field is presented After formulating
the appropriate mathematical equations for such condition two limiting cases of the
problem will be presented namely when the particle is very small or in an almost perfect
dielectric with few mobile charges ie in the limit κa ≪ 1 and when the particle is large
or in a highly concentrated electrolyte ie κa ≫ 1 All the above mentioned analyses
will be confined to particles having low surface potentials Following the analysis of
single charged spherical particle complexities of dealing with the electrokinetic motion
of platy shaped kaolinite particles will be presented In the entire analysis the particle
will be assumed to be rigid and electrically nonconducting
Let us first consider a spherical particle of radius a bearing a charge Qs suspended
in a pure dielectric fluid (containing no free charge or ions) When subjected to a uniform
external electric field Einfin the particle will translate under the influence of the electric
force acting on it Since there is no free charge in the dielectric fluid there will be no
flow of this fluid under the influence of the uniform external electric field as long as there
is no pressure gradient The net electrical force on the charged particle will simply be
E sF Q Einfin= (4-9)
107
The particle encounters an oppositely directed fluid drag force as soon as the
particle starts to move under the influence of this electrical force
6HF aUπmicro= (4-10)
where μ is the fluid viscosity and U is the particle velocity Equating the electrical and
drag forces for steady-state motion one obtains
6
sQ EUaπmicroinfin= (4-11)
The direction of the particle velocity will be governed by the sign of the particle
charge The electrophoretic mobility of the particle can be defined as velocity per unit
applied electric field and is given by
6
sQUE a
ηπmicroinfin
= = (4-12)
Now consider when a single charged spherical particle of radius a carrying a total
charge Qs is immersed in an electroneutral electrolyte solution (volumetric charge
density ρf is zero) The charged particle will polarize the electrolyte solution
surrounding it resulting in the formation of an electric double layer The electric double
layer will have a spatially varying volumetric charge density As soon as a charge density
108
is developed in the electrolyte solution it will experience an electric body force under the
influence of the overall electric field near the particle The overall electric field is
superposition of two fields
i the unidirectional external field
ii a spherically symmetric field in the double layer due to the charged particle in
absence of the external field
The electric body force will cause a motion in the fluid immediately surrounding
the particle and will be opposite to the direction of the particle movement In addition to
the fluid flow the concentration gradients of the ions as well as the electric potential
gradients will give rise to ionic fluxes which are usually described in terms of the
Nernst-Planck equations
Therefore a complete analysis of electrophoresis of a charged particle in an
electrolyte solution involves consideration of following three coupled physical processes
i Interaction of the charged particle with the external electric field giving rise to an
electrical force on the particle
ii Formation of the electric double layer surrounding the particle giving rise to a
spatially inhomogeneous charge distribution which results in an electrical body force
driven fluid flow and
iii Transport of ions relative to the charged particle under the combined influence of
convection diffusion and migration
The governing equations describing the three coupled processes mentioned above
apply to the steady state velocity of a single charged spherical particle under an imposed
electric field Einfin The geometry is shown in Figure 43 Note that the particle velocity U
109
Figure 43- A spherical particle of radius a held stationary in a uniform electric field Einfin
x
a
Einfin
U
ix
ir
n
θ
110
and the electric field are represented as vector quantities The fixed particle reference
frame was chosen here and the flow of an electrolyte solution around a stationary
charged particle was considered
In this case far from the particle the velocity of electrolyte solution is then given
as
xu Uiinfin = minus (4-13)
where U is the particle velocity along the x direction and ix is a unit vector Consequently
u Uinfin = minus represents the fluid velocity necessary to keep the particle stationary The
electrolyte solution contains N ionic species of valency zi with a bulk concentration niinfin
and diffusion coefficient Di
The electric potential ψ in the electrolyte solution surrounding the charged
particle is given by equation (4-7) For small Reynolds number and neglecting the effect
of gravity the electrolyte solution velocity field u is given by the modified momentum
equation as
2 0xu pmicro ρ ψnabla minusnabla minus nabla = (4-14)
where nablap is the pressure gradient and ρxnablaψ is the electrical body force on the electrolyte
solution caused by the overall potential gradient nablaψ The steady-state continuity equation
for the electrolyte solution under dilute conditions ie constant density provides
111
0unabla = (4-15)
The ionic fluxes are given by the Nernst-Planck equations which can be written
in terms of the number concentration ni of the ith ionic species as
i i ii i i i i i
z en Dj n v n u D nkT
ψ= = minus nabla minus nabla (4-16)
where vi and Di are the velocity and diffusivity of the ith ionic species respectively For a
steady state transport process the ion conservation equation then yields
0i i ii i i i i i
z en Dj n v n u D nkT
ψ nabla = = nabla minus nabla minus nabla = (4-17)
431
Using a spherical coordinate system and utilizing symmetry in the angular
directions the potential distribution around the sphere can be represented by the Poisson-
Boltzmann equation as
Electrophoresis in the Limit κa ≪ 1
2 22
1 rr dr dr
ψ κ ψpart part =
(4-18)
where κ is the inverse Debye length given by
112
122 22e z n
kTκ
εinfin
=
(4-19)
Let say
rξ ψ= (4-20)
which renders equation (4-18) as
2
22drξ κ ξpart= (4-21)
The general solution of the above equation is
r rAe Beκ κξ minus minus= + (4-22)
where A and B are constants which can be evaluated from the boundary conditions The
boundary conditions are
0 as rψ ψinfinrarr = rarrinfin (4-23)
and
113
as s r aψ ψ ζrarr = = (4-24)
Substituting the boundary conditions equations (4-23) and (4-24) in equation
(4-22) yields the potential distribution as
( )expa r ar
ψ ζ κ= minus minus (4-25)
Now to determine the charge on the particle surface Qs we will apply the
electroneutrality condition (total charge of a system comprised of a charged particle and
the surrounding electrolyte should be zero) as
( )24s faQ r rπ ρ
infin= minus partint (4-26)
Using Poissonrsquos equation
22
1 frr dr dr
ρψε
part part = minus
(4-27)
Substituting equation (4-27) into equation (4-26) gives
2 2 22
14 4s aa
Q r r r rr dr dr dr
ψ ψπε πεinfin
infin part part part = part = int (4-28)
114
Noting that
0drdrψ
rarrinfin rarr (4-29)
we obtain
24sr a
Q adrψπ ε
=
part= (4-30)
Using the derivative of equation (4-25) and substituting in equation (4-30) gives
( )2 14s
aQ a
aκ
π εζ+
= (4-31)
The electrical force acting on the particle in an external field Einfin is given by
( ) ( )2 14 4 1E s
aF Q E a E a E a
aκ
π εζ π εζ κinfin infin infin
+= = = + (4-32)
The particle will also encounter drag force as soon as it starts to translate under
the influence of the electrical force Oseen formulation [150] is used here to calculate the
velocity field due to a point force acting at a given location in the fluid and that the
overall velocity field due to disturbed point forces is obtained by integrating the singular
115
solutions of the Stokes equation Here the point force is given as the product of the
external field Einfin and the differential charge partQ = ρf partV of a small volume element partV
in the fluid The velocity component acting along the field direction is then given by
21 cos8
fR V
EU V
rρ
θπmicroinfin = + part int (4-33)
where UR is the velocity of the center of the spherically symmetric charge cloud V is the
volume of the charge cloud r is the radial position and 120579 is the polar angle After
integration over the entire volume of the charge cloud one obtains the velocity of the
center of the charge cloud as
( )23RU a Eεζ κmicro infin= minus (4-34)
This is the retardation velocity of the fluid surrounding the particle and it
approaches zero as 0aκ rarr
In an infinitely dilute colloidal dispersion the Stokes hydrodynamic drag force on
the spherical particle of radius a is given as
6 ( )H RF a U Uπmicro= minus (4-35)
116
where U ndash UR is the velocity of the particle relative to the electrolyte solution At steady
state balancing the electrical and drag forces ie FE = FH results in
23
EU εζmicro
infin= (4-36)
This is Huumlckelrsquos [150] solution for the electrophoretic velocity valid for small κa
Equation (4-36) is usually written as
23
UE
εζηmicroinfin
= = (4-37)
where η is referred to as the electrophoretic mobility The Huumlckel equation is valid for
large Debye length and in particular for nonelectrolyte systems eg organic liquids
where κ-1 is generally large relative to the particle radius a
432
When the particle radius is large or more specifically when the Debye screening
length κ-1 is small relative to the particle radius ie κa ≫ 1 the electric double layer
becomes extremely thin compared to the particle radius and we can neglect the curvature
effects of the particle In this limiting case one can consider the relative movement of the
ions with respect to a planar surface The analysis based on this assumption is generally
referred to as the Helmholtz-Smoluchowski analysis
Electrophoresis in the Limit κa ≫ 1
117
The governing Navier-Stokes equation for the fluid flow past a horizontal flat
surface with the surface moving at a velocity U is given as
2
2x
fu E
dymicro ρ infin
part= minus (4-38)
Here ux is the velocity of the fluid tangential to the plate Combining with the
Poisson equation equation (4-38) becomes
2 2
2 2x xu E
dy dyψmicro ε infin
part part= (4-39)
The boundary conditions for the problem are as follows
0 and as xu U yψ rarr rarrminus rarrinfin (4-40)
0 and as xu U yy yψ partpart
rarr rarr minus rarrinfinpart part
(4-41)
and 0 at 0xu yψ ζ= = = (4-42)
Integrating equation (4-39) from infinity to an arbitrary distance y from the
particle surface and employing the boundary conditions as in equations (4-40) and (4-41)
yields
118
( )( )xE yu y Uε ψmicro
infin= minus (4-43)
Substituting the boundary condition at the particle surface given by equation
(4-42) in equation (4-43) results in
EU ε ζmicroinfin= (4-44)
or expressed in terms of electrophoretic mobility as
UE
εζηmicroinfin
= = (4-45)
This is referred to as the Helmholtz-Smoluchowski electrophoretic mobility
equation and is valid in the limit κa ≫ 1 and zeζkT lt 1
It should be noted that both the Huumlckel and Helmholtz-Smoluchowski results
given by equations (4-37) and (4-45) respectively provide the two limiting values of the
electrophoretic velocity of a single colloidal particle as 0aκ rarr and aκ rarrinfin
respectively Note that both of these equations are independent of particle size
Notably the two classical analyses (Huumlckel and Helmholtz-Smoluchowski)
discussed above deal with the motion of a spherical particle with uniform surface charge
densities under the influence of electric field However the great challenge still remains
with determining the surface charge densities of most clay minerals by electrophoresis
119
From the double layer point of view the challenge is that most clay minerals are
heterogeneous the basal plane surface or ldquoplatesrdquo as well as the ldquoedgerdquo surface carry a
non-uniform surface charge which is dependent on pH and salt concentration [24] Other
challenges involve the shapes of the particles and the fact that some clay types swell by
lowering the electrolyte concentration The shape problem together with the
heterogeneous nature of the charge distribution makes the interpretation of
electrophoretic mobilities in terms of ζ-potential very difficult
A few researchers have gone beyond and considered nonuniform surface charge
densities of particles of different shape such as a sphere [155] spheroid [156] and disc
[157] and described the electrophoretic motion for such particles Due to the extreme
complexities of the mathematical equations analytical solutions for particles of different
shape and nonuniform charge densities do not exist This opens the option for more
traditional analyses to characterize the surface charge densities of clays and other
differently shaped particles using titration such as potentiometric titration and M-R
titration and one new analysis based on surface force measurements using atomic force
microscopy which will be discussed in subsequent sections
44
441
Results and Discussion
The zeta-potential of kaolinite particles as determined by electrophoresis is shown
in
Zeta-Potential of Kaolinite by Electrophoresis
Figure 44 The zeta-potential of pure silica and alumina particles are also plotted for
comparison purposes As shown the iso-electric point of kaolinite and pure silica
particles is less than pH 3 In fact the zeta-potential of kaolinite particles is very close to
120
Figure 44- Electrophoresis of kaolinite as a function of pH
-60
-40
-20
0
20
40
60
80
2 3 4 5 6 7 8 9 10 11
Surf
ace
Pote
ntia
l (ζ)
mV
pH
Gibbsite (Miller et al 2007)Silica (Miller et al 2007)kaolinite
1 mM-KCl
121
pure silica particles as a function of pH Similar results for the iso-electric point for
kaolinite particles at less than pH 3 were reported by several researchers [29 39-45] The
iso-electric point of gibbsite is at pH 92 also in close agreement with the literature [15]
Smith and Narimatsu [39] determined the iso-electric point for kaolinite at pH 22
by micro-electrophoresis and found no iso-electric point for kaolinite by streaming
potential Cases et al [40] reported an iso-electric point at pH 3 for kaolinite particles
and found the sample to spontaneously flocculate at pH lt 35 and stabilized at pH gt 5
Yuan and Pruet [45] also reported the iso-electric point in the range of pH 15-35 for five
commercial kaolinite deposits from Georgia A few studies have also shown higher iso-
electric points for kaolinite between pH 3 and 4 by electrophoretic measurements [7
158]
The iso-electric point of kaolinite as determined by electrophoresis is quite
intriguing as one would expect that the kaolinite particles should show the iso-electric
point at pH of 57 as an average of silica (iso-electric point at pH of 22) and gibbsite
(iso-electric point at pH of 92) since the composition of silica to alumina in kaolinite is
nearly 11 However the iso-electric point of kaolinite particles as measured by
electrophoresis is consistently less than pH 3 which is more closely related to silica (see
Figure 44) It appears from the electrophoresis results that the aluminum hydroxide
octahedral layer does not contribute to the surface charge properties of kaolinite particles
We must however understand that the zeta potential of kaolinite inferred from
the electrophoretic mobility using the Smoluchowski equation has been criticized because
of the heterogeneous nature of the surface charge and the hexagonal platy shape of the
particles [15 24 46] The calculation of zeta potential and surface charge densities for
122
nonspherical kaolinite assuming an equivaent sphere may result in quite misleading
values The zeta potentials calculated from such mobilities does not reflect the potential
at the shear plane because of the screening effect of positive charges on the edges relative
to those of negative charges at faces resulting in lower negative mobility [47] Therefore
other methods for characterizing the surface charge properties of kaolinite must be
considered in order to better understand its electrokinetic properties
442
The change in pH as a function of final pH of kaolinite suspension is shown in
Mular-Roberts (M-R) Titration
Figure 45 following the procedure of Mular and Roberts [147] The iso-electric point
(value of final pH where ΔpH = 0) of kaolinite suspension is determined as pH 451
Notably this iso-electric point is higher than that determined by electrophoresis further
supporting that the present electrokinetic theory does not appropriately address the
surface charge of anisotropic particles such as kaolinite
In M-R theory the ionic strength is increased (increasing concentration of
indifferent electrolyte) resulting in a decrease in the double layer thickness of a surface
Thus the rate of potential decay increases which causes more potential determining ions
to adsorb at the surface when the surface is not at its iso-electric point As a result when
H+ or OH- are dissociated they induce a change in pH Korpi [159] points out that an
oxide surface has a finite number of adsorption sites capable of reacting with hydrogen
andor hydroxyl ions When this point is reached any further addition of acid or base will
alter the pH of the suspensions strictly according to the amount added and no further
adsorption takes place
123
Figure 45- Change in pH of the kaolinite suspensions as a function of final pH for kaolinite suspension Supporting electrolyte (KCl) concentration changes were from 10 to 100 mM
-010
-005
000
005
010
015
020
025
030
0352 3 4 5 6 7 8
ΔpH
Final pH pHf
1Kaolinite
124
In view of the above there must be some (pH)i in strong acidic or basic
suspensions for which the addition of an indifferent electrolyte will result in very small
pH shifts ΔpH approaches zero at these extremes and represent the iso-electric point
Recently Alvarez-Silva [160] validated the M-R titration technique with alumina and
silica particles The point of zero charge for alumina and silica particles as determined by
the M-R titrations were found to be comparable with the iso-electric point determined by
electrophoresis
443
Figure 46
Potentiometric Titration
presents the surface charge densities of kaolinite as obtained by acid-
base potentiometric titrations The titration curves were corrected for the blank titration
conducted in the absence of kaolinite particles The common intersection point however
for the two curves at 1 mM and 10 mM was not obtained but the curves seem to be
superimposed well in the pH range of 5-7 The point of zero charge was determined as
pH 472 and pH 445 at 1 mM and 10 mM respectively These results are in good
agreement with the point of zero charge of kaolinite published in the literature as pH 43
[34] pH 45 [38] and pH 46 [161] as determined by potentiometric titrations Recently
Brady et al also looked into the dissolution of Si and Al species from kaolinite face
surfaces and found that even at a very low level (lt 3 ppm) the surface charge densities
of kaolinite particles are impacted significantly [34] The results are also in good
agreement with the point of zero charge of kaolinite of pH 451 as determined by M-R
titrations discussed in the previous section
125
Figure 46- Surface charge densities of kaolinite particles as determined by acid-base potentiometric titration
-02
-015
-01
-005
0
005
2 3 4 5 6 7 8 9
Su
rfa
ce
Ch
arg
e D
en
sit
y (δ
)C
m2
pH
1 mM
10 mM
5 Kaolinite
126
The potentiometric titrations were also conducted as a function of solid loading
and the results are shown in Figure 47 The results indicate that the two curves overlap
each other well in the pH region of 5-7 whereas a little deviation exists at low and high
pH The iso-electric point reduced to pH 403 for a more concentrated suspension of
10 This small difference in the iso-electric point of kaolinite could be due to improved
aggregation in a concentrated suspension which could reduce the exposed area of the
kaolinite particles
444
Surface force measurements by atomic force microscopy measure the interaction
forces between a silicon nitride tip or colloidal particle of known zeta potential attached
to cantilever and the particles of interest as a function of pH of the system The
interaction forces are then fitted to the DLVO model (sum of electrostatic and van der
Waal interactions) to predict the surface charge densities and surface potentials of the
particles of interest In this way the zeta potential or surface charge densities profile of
particles as a function of pH of the system can be obtained
Zeta-Potential of Kaolinite by Surface Force Measurements
It must be again emphasized here that the classical electrokinetic theory is based
on uniformly charged spherical particles which may not be applicable here as the
kaolinite particles are nonspherical platy shaped and carry nonuniform surface charge
densities on their faces In order to gain a better understanding of the surface charge
properties of kaolinite particles we must investigate the surface charge densities on the
two basal planes surfaces (the silica tetrahedral layer and the alumina octahedral layer)
and edge surfaces Only recently Gupta and Miller [72] reported the surface charge
127
Figure 47- Surface charge densities of kaolinite particles as determined by acid-base potentiometric titration applying equation (4-3)
-012
-01
-008
-006
-004
-002
0
002
2 3 4 5 6 7 8 9
pH
510
Surfa
ce C
harg
e D
ensi
ty (δ
) C
m2
10 mM KClKaolinite
128
densities of the two basal plane surfaces (the silica and alumina face surfaces) through the
surface force measurements of the two faces using atomic force microscopy They
reported that the silica face of kaolinite is negatively charge at pH gt 4 whereas the
alumina face of kaolinite is positively charged at pH lt 6 and negatively charged at pH gt
4 Williams and Williams [41] predicted the zeta-potential of edge surfaces of kaolinite
with an iso-electric point at pH 72 assuming a linear combination of quartz and alumina
It was realized that the zeta-potential does not define the surface potential of the edge
surface appropriately Instead potentiometric titration was used to determine the surface
potential and surface charge of the edge surface of kaolinite The surface charge density
of the edge surface of the kaolinite particles was calculated following the charge balance
as
kaolinite kaolinite silica face silica face alumina face alumina face edge face edge faceA A A Aσ σ σ σ= + + (4-46)
where σkaolinite is the surface charge density of kaolinite particles as determined by
potentiometric titration σsilica face and σalumina face are the surface charge densities of the
silica face and the alumina face of kaolinite as determined by surface force
measurements The symbols Akaolinite Asilica face Aalumina face and Aedge face represent the total
area of kaolinite particles area of silica face alumina face and edge surfaces
respectively The area of the silica face surface the alumina face surface and the edge
surface was determined from the kaolinite particle equivalent circle diameter and
thickness
129
Utilizing this new information ndash surface charge densities of the silica the alumina
and the edge surfaces ndash we can determine the surface charge densities of the kaolinite
particles by combining the surface charge densities of each surface with respect to its
interaction area as shown in Figure 48 As shown in Figure 48 the surface charge
density of the edge surface is significantly greater over one order of magnitude greater
when compared to the surface charge densities of the silica face and the alumina face of
the kaolinite particles at high pH At low pH the surface charge density of the edge face
of kaolinite is of a similar magnitude (within a factor of two) with that of the surface
charge densities of the silica face and the alumina face The median diameter and
thickness of kaolinite particles were determined as 600 nm and 112 nm respectively
from scanning electron microscopy and atomic force microscopy analysis of 150
kaolinite particles The composite surface charge of kaolinite particles was then
determined and showed an iso-electric point in between pH 4 and 5 This is an interesting
result as it showed a higher iso-electric point of less than pH 3 as determined by
electrophoresis This technique of determining the surface charge properties of kaolinite
particle is particularly useful as it also describes the surface charge properties of each
surface ndash the silica face surface the alumina face surface and the edge surface
445
The cation exchange capacity of the kaolinite particles is frequently determined to
characterize the surface charge properties of its faces ndash the silica face and the alumina
face whereas the surface charge densities of edges were determined by titration
technique (Lyklema 1995) The maximum number of exchangeable groups can be
Cation Exchange Capacity (CEC)
130
Figure 48- The surface charge densities of the kaolinite edge surface and the two face surfaces (silica and alumina face) as a function of pH in 1 mM KCl solution
-250
-200
-150
-100
-50
0
50
3 4 5 6 7 8 9 10 11
Su
rfac
e C
har
ge
Den
sity
m
Cm
2
pH
Edge Surface - Equation (49)
Silica Face Surface - Gupta and Miller 2010
Alumina Face Surface - Gupta and Miller 2010
131
established on the silica and the alumina faces of kaolinites by counter ion exchange
method
The cation exchange capacity involves converting the silica and the alumina faces
of kaolinite into a state with only one type of counterions (for example 4NH+ as in the
ammonium acetate method) and then desorbing these quantitatively measuring how
many came off (in the example by exchange with Na+ and determining the 4NH+ liberated
by a Kjeldahl distillation) The experiments are normally conducted in acidic condition
(where the edge surfaces are positively charged) to exclude adsorption of cations at the
edges Depending on the different counterions and source of kaolinite different values
for cation exchange capacity for kaolinite are suggested in the range of 36-100 micro-moleg
[29-32] Cation exchange capacities can be utilized to convert to maximum counterions
charge density as
f
FCECA
σ+ = (4-47)
where CEC is cation exchange capacity F is the faraday constant and Af is the specific
surface area of the basal planes of silica tetrahedral (001) and alumina octahedral (001)
layers The surface charge density of the faces (σ0) can be obtained from counterions
charge density (σ+) under the conditions where negative adsorption may be neglected
Alternatively the diffuse layer can be suppressed by working at high electrolyte
concentrations In this way σ0 for faces has been established at a value between -01 to -
02 Cm2 [24]
132
Gupta and Miller [72] however disagreed with the traditional emphasis of
permanent negative charge on the kaolinite faces (the silica face and the alumina face)
As discussed in the surface force section the silica face of kaolinite is negatively charged
at pH gt 4 whereas the alumina face of kaolinite is positively charged at pH lt 6 and
negatively charged at pH gt 4 Also the surface charge on the silica face and the alumina
face show dependency on the pH of the system In agreement of our analysis Ferris and
Jepson [29] also do not support the isomorphous substitution charge on the faces so often
assumed in the past Their data show no evidence for any definite cation exchange
capacity for well-crystallized kaolinite from the St Austell area of Cornwall and
assigned a value of zero for permanent structural charge Their findings showed that the
cation uptake however is not fixed and depends upon the cation chosen the electrolyte
concentration and pH and on whether the experiments were conducted from aqueous or
95 ethanol solvent
Different electrokinetic techniques were utilized by researchers obtaining a
different iso- electric point for kaolinite particles A review of the literature for the iso-
electric point for kaolinite particles is given in Table 41 The electrophoresis and
electroacoustic analysis gave a smaller value for the iso-electric point for kaolinite as pH
lt 3 with one exception at pH 38 obtained by Hu and Liu [3] It should be noted that the
electrokinetic measurements are questionable as it does not incorporate the platy nature
and the heterogeneous nature of differently charged basal plane surfaces and edge surface
of kaolinite Instead the potentiometric titrations are in general agreement of point of
zero charge for kaolinite in between pH 45 to 5 The potentiometric titration better
133
Table 41- Review of literature for iso-electric point of kaolinite by different electrokinetic techniques
Method Value References Electrophoresis Electroacoustic Potentiometric Titration
lt 2 lt 2 lt 3 lt 3 lt 3 38 lt 3 lt 2 lt 4 45 45 50 75 30 48 499
Chassagne et al [52] Sondi et al [51] Tombacz and Szekeres [143] Miller et al [15] Williams and Williams [41] Hu and Liu [3] Johnson et al [49] Galassi et al [144] Schindler et al [33] Motta and Miranda [38] Xie and Walther [162] Zhou and Gunter [136] Wieland and Stumm [14] Braggs et al [158] Ferris and Jepson [29] Schroth and Sposito[36]
134
represents the average surface charge properties of kaolinite as it includes the surface
charge on the diffuse layer of the particles and not its electrokinetic motion
45
The surface charge properties of kaolinite particles are manifested in their face
surfaces ndash the silica face the alumina face and the edge surfaces The current
electrokinetic analysis by electrophoresis does not provide the appropriate surface charge
information for kaolinite due to the heterogeneity of the surface charge on the three faces
and the platy nature of particles which are not accounted in the present theory
Summary
In the absence of an appropriate theory traditional titration experiments (M-R
titration and potentiometric titration) and new surface force measurements by AFM
provide more details about the surface charge densities on the three surfaces of kaolinite
ndash the silica face the alumina face and the edge surface Both titration experiments
estimated a point of zero charge close to pH 450 for kaolinite particles which is in
excellent agreement with iso-electric point in between pH 4 and 5 as determined by
surface force measurements The surface force measurement technique is unique in that it
provides specific surface charge densities of the silica and the alumina faces of kaolinite
as a function of pH The improvements in kaolinite sample preparation are however
needed for surface force measurements in order to analyze the surface charge properties
of the edge surfaces independently The electrokinetic properties of kaolinite particles are
important and will play a significant role in particle interactions in many different
applications such as flotation filtration paper making and clay-polymer composites
CHAPTER 5
PARTICLE INTERACTIONS IN KAOLINITE
SUSPENSIONS AND CORRESPONDING
AGGREGATE STRUCTURES
The surface charge densities of the silica face surface and the alumina face
surface of kaolinite particles recently determined from surface force measurements using
atomic force microscopy show a distinct dependence on the pH of the system The silica
face was found to be negatively charged at pH gt 4 whereas the alumina face surface was
found to be positively charged at pH lt 6 and negatively charged at pH gt 8 The surface
charge densities of the silica face and the alumina face were utilized in this study to
determine the interaction energies between different surfaces of kaolinite particles
Results indicate that the silica facendashalumina face interaction is dominant for
kaolinite particle aggregation at low pH This facendashface association increases the stacking
of kaolinite layers and thereby promotes the edgendashface (edgendashsilica face and edgendash
alumina face) and facendashface (silica facendashalumina face) associations with increasing pH
and hence the maximum shear yield stress at pH 5-55 With further increase in pH the
facendashface and edgendashface association decreases due to increasing surface charge density
on the silica face and the edge surfaces and decreasing surface charge density on the
136
alumina face At high pH all kaolinite surfaces become negatively charged kaolinite
particles are dispersed and the suspension is stabilized The facendashface association at low
pH has been confirmed from cryo-SEM images of kaolinite aggregates taken from
suspension which show that the particles are mostly organized in a facendashface and edgendash
face manner At higher pH conditions the cryo-SEM images of the kaolinite aggregates
reveal a lower degree of consolidation and the edgendashedge association is evident
51
The rheological properties of concentrated suspensions of clay minerals such as
kaolinite [Al2O32SiO22H2O] are very important in ceramics in paper and pulp in
drilling mud in filtration in dewatering and in many other new applications such as clay-
polymer nanocomposites etc [53 63 116] Kaolinite particles are naturally pseudo-
hexagonal platy shaped ranging from micron to nanosize particles The crystallographic
structure suggests that kaolinite particles consist of a silica tetrahedral surface
corresponding to the 001 basal plane and an aluminum hydroxide octahedral surface
corresponding to the 001 basal plane as shown in
Introduction
Figure 51 Of course the kaolinite
particles have 010 and 110 edge surfaces which are generated as a result of broken
covalent bonds The rheological properties of kaolinite are governed by its surface
chemistry in particular its electrokinetic features which generally determine the particle
interactions and hence the mechanical properties of the suspension
It is traditionally believed that the 001 and 001 basal plane surfaces of kaolinite
particles are negatively charged due to isomorphic substitution of Al3+ for Si4+ in the
silica tetrahedral layer and Mg2+ for Al3+ in the alumina octahedral layer whereas
137
Figure 51- The structure of kaolinite along 010 edge surface showing a silica tetrahedral layer and an alumina octahedral layer
Silicon
Aluminum
OxygenOxygen + HydroxylHydroxyl group
Octahedral
Tetrahedral
138
the edge surface (010 and 110 plane surfaces) carries a positive or negative charge
depending on the pH of the system [23 26 48-50 142] Following this assumption
several researchers have defined the rheological properties of kaolinite and have
explained the abnormal behavior of a maximum yield stress for kaolinite suspensions at
pH 5-55 [26 48-50] Such a maximum might be expected at kaolinitersquos iso-electric point
of pH lt 3 [51 52] Johnson et al [49 50] have gone further in their analysis and
explained this abnormal rheological behavior based on the aggregation behavior of
kaolinite particles which is described mainly by edgendashface attractions and some facendash
face attractions On this basis the maximum shear-yield stress at pH 55 shown in Figure
52 was explained
The assumption that both basal planes carry a fixed negative charge has only
recently been examined experimentally through surface force measurements using atomic
force microscopy (AFM) [72] These colloidal force measurements reveal that the silica
tetrahedral face of kaolinite is negatively charged at pH gt 4 whereas the alumina
octahedral face of kaolinite is positively charged at pH lt 6 and negatively charged at pH
gt 8 The results suggest that the iso-electric point of the silica tetrahedral face is at pH lt
4 and that the iso-electric point of the alumina octahedral face lies between pH 6 and 8
[72] Based on this new finding Gupta et al [163] determined the interaction energies
between different surfaces of kaolinite particles which showed that the silica facendash
alumina face association is likely to be dominant for kaolinite particle association at low
and intermediate pH conditions However the above conclusion of dominant silica facendash
alumina face association was reached by assuming that the zeta-potential of the edge was
a linear combination of the zeta-potentials on silica and alumina surfaces [41]
139
Figure 52- Shear yield stress of kaolinite suspensions as a function of pH for selected volume fractions (adapted from Johnson et al [49 50])
0
50
100
150
200
250
300
350
400
450
3 4 5 6 7 8 9 10 11
Sh
ea
r Y
ield
Str
es
s
Pa
pH
018
022
026
140
The assumption for edge surface zeta-potential will be discussed later in this
study It seems that the edge surface zeta-potential for kaolinite is under-estimated and
that an experimental technique such as potentiometric titration should be considered in
the analysis of kaolinite surface potentials
Several researchers have examined images of flocculated kaolinite suspensions
using electron microscopy to determine the aggregate structure and relate these
observations to rheological properties The earliest significant discussion of clay fabric
was given by Terzaghi in 1925 (see OrsquoBrien [164]) in which the structure of cohesive
soils was discussed with regards to adhesion between adjacent minerals Casagrande
[165] presented a theory for a honeycomb structure in soils Idealized drawings of clay
fabric forming a card-house or honeycomb structure have been proposed [16 23 166
167] Rosenqvist [168 169] published the first electron micrograph of freeze-dried
samples of undisturbed marine Oslo blue clay and supported the idea of card-house
arrangement in the undisturbed sediment OrsquoBrien [164] examined the fabric of kaolinite
in distilled and slightly saline water and found that the fabric is dominated by a 3-
dimensional network of twisted chains of facendashface oriented flakes having the appearance
of a stair-stepped cardhouse Recently Zbik et al [170] investigated the structure of
kaolinite aggregates at pH 8 during sedimentation experiments using cryogenic-scanning
electron microscopy (cryo-SEM) They found that the kaolinite aggregates initially show
edgendashface and edgendashedge association which rearranges from edgendashedge chains to more
compact facendashface associations during settling In another study Zbik and Frost [171]
observed differences in the physical behavior of a number of kaolinite clays from
Birdwood and Georgia For example SEM micrographs of the Birdwood kaolinite
141
aggregates show the predominance of stair step edgendashedge contacts forming a spacious
cell structure whereas Georgia kaolinite aggregates display edgendashface contacts building a
card-house structure From these studies it is suggested that kaolinite clays are very
complex and each kaolinite should be considered separately It is evident that each
kaolinite from different sources must be characterized and detailed examination may be
necessary to determine the aggregate structures at low medium and high pH values
It is the objective of this chapter to utilize the surface charge information on the
face surfaces and edge surfaces of kaolinite in order to understand the structure of
kaolinite suspensions and corresponding rheological behavior Furthermore the influence
of particle aspect ratio and electrical double layer thickness is investigated with regard to
the aggregation behavior of kaolinite particles Finally cryo-SEM images were used to
examine the modes of particle association (facendashface edgendashface and edgendashedge)
52
521
Materials and Methods
A clean English Kaolin (Imerys Inc UK) was obtained from the St Austell area
in Cornwall UK The sample was cleaned with water only using elutriation to achieve
classification at a size of less than 2 microm No other chemical treatment was used Further
details about the kaolinite extraction and preparation are given in the literature [124] The
kaolinite suspension was prepared in high purity Milli-Q water (Millipore Inc) The
resistivity of the water was 182 MΩ-cm in all experiments Potassium chloride (1 mM
solution) was used as background electrolyte for surface force measurements The pH
Sample Preparation
142
was adjusted to its desired value using 01 M HCl or 01 M KOH solutions All chemicals
used were of ACS reagent grade
X-ray diffraction (Bruker AXS Inc Madison WI USA) analysis conducted on
the kaolinite sample confirmed that kaolinite is the dominant mineral phase Energy
dispersive X-ray spectroscopy (FEI Hillsboro Oregon USA) analysis of the kaolinite
sample showed nearly 11 atomic distribution of aluminum (798) and silicon (795)
with trace amounts of potassium (035) calcium (008) and iron (015) Other
details about the purity of kaolinite are provided elsewhere [72]
The kaolinite particles with a median diameter of 600 nm and median thickness of
112 nm in 1 mM KCl solution were used in this study unless otherwise mentioned The
median diameter and thickness were determined from the imaging of at least 150
kaolinite particles using atomic force microscopy The kaolinite particles were air-dried
on a thin sheet of mica and an image of the particle was obtained using the contact mode
imaging technique Section analysis was then conducted to obtain information about the
diameter and thickness of the particle
522
The aggregate size of kaolinite particles in suspension at desired pH values was
determined using photon correlation spectroscopy (PCS) In a PCS experiment the
fluctuation of scattered light from the particles by their Brownian motion is collected at a
scattering angle of 90deg by an optical fiber and detected by a photo-electric detector The
amplified signal from the photo-electric detector is fed into an autocorrelator for
computing the intensity autocorrelation function This autocorrelation function is used to
Aggregate Size
143
determine the relaxation of intensity fluctuations which in turn is related to translational
diffusion coefficient of the particles Particle size (equivalent spherical diameter) is then
determined from the diffusion coefficient of the particles
Kaolinite suspensions (4) were prepared in 1mM KCl solution at pH 90
sonicated for 5 minutes and stirred for 1 hour for complete dispersion After conditioning
50 mL of the suspensions was taken in a volumetric flask and adjusted to the desired pH
of 3 5 7 and 9 A small amount of kaolinite suspensions (1 mL) was taken at each pH
into a cuvette for PCS analysis Each experiment was replicated three times and the
average aggregate size was determined
523
Kaolinite suspensions (1) were prepared in 1 mM KCl solution (100 mL)
About 15 ml of the sample was taken in a vial and adjusted to pH 3 5 7 and 9 using 01
M HCl or 01 M KOH solutions The suspension was left overnight for conditioning The
sample was hand-shaken and then a few microliters of the suspension were taken in a
small metal rivet sealed with glue at one end The sample was immediately plunged into a
liquid N2 slush using the Oxford LN2 slush freezing apparatus for freezing the water
without allowing crystallization ie vitrifying Vitrified samples were placed onto the
liquid nitrogen-cooled specimen stage of the field emission scanning electron microscope
Philips XL30 FESEM with Oxford CT 1500 Cryo stage The sample was fractured under
vacuum and a small amount of vitrified H2O was sublimed off by raising the stage
temperature to minus90 ordmC for 10 minutes to expose the aggregate structure then lowering
back to minus180 ordmC Finally the sample was coated with platinum before SEM imaging
Cryo-SEM
144
524
Interactions between kaolinite particles were characterized by the (Derjaguin-
Landau-Vervey-Overbeek) DLVO model which considers the sum of electrostatic and
van der Waals forces An appropriate form for the van der Waals interaction energy per
unit area (EvdW) between two planar surfaces of thickness δ1 and δ2 is given as [150]
DLVO Model
( ) ( ) ( )2 2 2 2
1 2 1 2
1 1 1 1 12
vdW HAh h h
Ehπ δ δ δ δ
=minus + minus minus
+ + + + (5-1)
where AH is the combined Hamaker constant of the two surfaces interacting in the
suspending medium and h is the shortest separation distance between two interacting
particles At the closest approach h was taken as 20 Ǻ in all calculations for comparison
with existing literature [49] In the case of kaolinite we have to consider six different
surfaces for particle interaction edgendashedge edgendashsilica face edgendashalumina face silicandash
silica face aluminandashalumina face and silica facendashalumina face interactions Therefore
the nonretarded Hamaker constants for each of the six cases were determined from the
Hamaker constant of silica and alumina as given in Table 51 Hamaker constants in the
Table 51 were calculated from the following equation
( )( )123 11 33 22 33A A A A A= minus minus (5-2)
where A11 is the Hamaker constant for the first interacting surface for example the silica
face alumina face or edge surface A22 is the Hamaker constant for the second
145
Table 51- Hamaker constant for different interactions between kaolinite particles
Interaction Interaction Type Hamaker Constant J
1 EdgendashEdge 237 times 10-20
2 EdgendashSilica Face 163 times 10-20
3 EdgendashAlumina Face 305 times 10-20
4 Silica FacendashSilica Face 111 times 10-20
5 Alumina FacendashAlumina Face 390 times 10-20
6 Silica FacendashAlumina Face 208 times 10-20
146
interacting surface for example the silica face alumina face or edge surface and A33 =
the Hamaker constant for the suspending medium which in our study is water The
Hamaker constants for silica and alumina were taken as 886 times 10-20 J and 152 times 10-19 J
respectively [130] The Hamaker constant for the edge surface was determined as 120 times
10-19 J from the average of the Hamaker constants for silica and alumina The Hamaker
constant for water was taken as 370 times 10-20 J [130]
The electrical double layer interaction energy per unit area (EEdl) between two
planar surfaces with surface potentials 1ψ and 2ψ is given by the Hogg-Healy-Fuerstenau
(HHF) expression for dissimilarly charged surfaces as [172]
( )( )
2 21 2 1 2
0
22 1
Edl exp hex h
Ep
ψ ψ κ ψ ψε κ
κ minus minus
= minus (5-3)
where εo is is the permittivity of free space ε is the dielectric constant and κ-1 is the
Debye screening length of the electrical double layer
For cases when the surface potential of the two planar surface are similar ie
1 2ψ ψ ψ= = the electrical double layer interaction energy reduces to
( )
202
1EdlE
exp hψ ε κκ
=+
(5-4)
Similarly the electrical double layer interaction energy under the condition of
constant surface charge first established by Langmuir28 can be used In this case
147
revising equation (3) by replacing the two minus signs in the numerator by plus signs
gives the Langmuir equation In particular the double layer interaction energy at constant
surface potential andor constant surface charge presents the lower and upper limits of the
interaction energy The actual double layer interaction energy with a mixed boundary
condition or a surface charge regulation is between the two limits The calculation shows
that the trend of the total interaction energy for the cases is similar Therefore only the
interaction energy described by equation (5-3) is used hereafter The resulting DLVO
interaction energy is given as
vdW EdlE E E= + (5-5)
The total interaction energy was multiplied by the measured interaction area ratio
of basal plane surface to edge surface of 13391 as determined by atomic force
microscopy In calculating the edge and face surface areas the kaolinite particle was
assumed to be a circular disc The energies are scaled against the maximum predicted
silica face-alumina face interaction energy Emax
53
The rheological behavior of a suspension is essentially determined by the forces
that control the spatial arrangement and dynamics of the suspended particles In a
suspension under the predominant influence of repulsive electrostatic energies the
particles tend to take up positions as far from each other as possible This may lead to a
regular arrangement of the particles ie to the development of the spatial order in the
Results and Discussion
148
suspension Clusters of particles or aggregate structures form in a suspension when the
particle interactions are dominated by attractive energies The aggregate structure or flocs
will immobilize the suspending medium and give rise to increasing viscosity and yield
strength of the suspension The particle characteristics such as morphology size surface
area etc will also greatly affect the suspension viscosity and the strength of the
aggregate structure The aggregate structure plays a major part in the flow behavior of
clay suspensions The rate and mechanism of formation of such aggregate structures and
the characteristics of the aggregate structures are therefore important parameters to
describe the rheological characteristics of such suspensions In this study we will discuss
the formation of aggregate structures of kaolinite and their validation by cryo-SEM in the
following and subsequent sections
531
As mentioned previously the surface chemistry and rheology of kaolinite
particles is complicated greatly by the nonuniform surface charge densities on edge and
face surfaces It was realized that electrophoretic measurements of kaolinite particles do
not give detailed information about surface charge characteristics and therefore
information on electrophoretic mobility is not used in this analysis [15] Instead surface
charge densities of the two faces of kaolinite particles (silica face and alumina face)
determined from surface force measurements are used in this analysis [72] Recently
Gupta et al [163] used the zeta-potential for the edge surfaces as a linear combination of
the zeta-potential of silica and alumina particles It was realized that the zeta-potential
does not define the surface potential of the edge surface appropriately Instead
Particle Interactions
149
potentiometric titration was used to determine the surface potential and surface charge of
the edge surface of kaolinite The surface charge density of the edge surface of the
kaolinite particles was calculated following the charge balance as
kaolinite kaolinite silica face silica face alumina face alumina face edge face edge faceA A A Aσ σ σ σ= + + (5-6)
where σkaolinite is the surface charge density of kaolinite particles as determined by
potentiometric titration σsilica face and σalumina face are the surface charge densities of the
silica face and the alumina face of kaolinite as determined by surface force
measurements With this information the surface charge densities of the edge surface of
kaolinite was determined and the results are presented in Figure 48 As shown in Figure
48 the surface charge density of the edge surface is significantly greater over one order
of magnitude greater when compared to the surface charge densities of the silica face and
the alumina face of the kaolinite particles at high pH At low pH the surface charge
density of the edge face of kaolinite is of a similar magnitude (within a factor of two)
with that of the surface charge densities of the silica face and the alumina face
Considering the surface charge data provided for the different faces of kaolinite
the net interaction energy between different surfaces of kaolinite was determined and is
shown in Figure 53 The interaction energies were scaled to maximum attractive
interaction energy determined for silica facendashalumina face and multiplied by the average
interaction area ratio of 13391 [163] Figure 54 shows the scaled interaction energies
calculated for a separation distance h = 20 Aring when there is no energy barrier consistent
with previous studies [49] When there is an energy barrier between surface interactions
150
Figure 53- Interaction energy profiles for different surface interactions of kaolinite particles
-15E-04
-10E-04
-50E-05
-10E-18
50E-05
10E-04
15E-04
0 10 20 30 40 50 60
Inte
rac
tion
En
erg
y J
m2
Separation Distance nm
pH =10
pH = 8
pH = 6
pH = 5
pH = 4
Silica Face-Silica Face
-15E-04
-10E-04
-50E-05
-10E-18
50E-05
10E-04
15E-04
0 10 20 30 40 50 60
Inte
ract
ion
En
erg
y J
m2
Separation Distance nm
pH = 10
pH = 8
pH = 6
pH = 5
pH = 4
Alumina Face-Alumina Face
-15E-04
-10E-04
-50E-05
-10E-18
50E-05
10E-04
15E-04
0 10 20 30 40 50 60
Inte
ract
ion
En
erg
y J
m2
Separation Distance nm
pH = 10
pH = 8
pH = 6
pH = 5
pH = 4
Silica Face-Alumina Face
-15E-04
-10E-04
-50E-05
-10E-18
50E-05
10E-04
15E-04
0 10 20 30 40 50 60
Separation Distance nm
pH = 10
pH = 8
pH = 6
pH = 5
pH = 4
Edge-Edge
-15E-04
-10E-04
-50E-05
-10E-18
50E-05
10E-04
15E-04
0 10 20 30 40 50 60
Separation Distance nm
pH = 10
pH = 8
pH = 6
pH = 5
pH = 4
Edge-Silica Face
-15E-04
-10E-04
-50E-05
-10E-18
50E-05
10E-04
15E-04
0 10 20 30 40 50 60Separation Distance nm
pH = 10
pH = 8
pH = 6
pH = 5
pH = 4
Edge-Alumina Face
151
Figure 54- The predicted kaolinite edgendashedge edgendashsilica face (E-F(Si)) edgendashalumina face (E-Al(Si)) silica facendashsilica face (F(Si)-F(Si)) alumina facendashalumina face (F(Al)-F(Al)) and silica facendashalumina face (F(Si)-F(Al)) interaction energies scaled to maximum attractive energy for the silica facendashalumina face interaction Kaolinite particles with diameter 600 nm and thickness 112 nm in 1 mM KCl solution
-04
-02
0
02
04
06
08
1
12
3 4 5 6 7 8 9 10 11
EEm
ax
pH
E-E
E-F(Si)
E-F(Al)
F(Si)-F(Si)
F(Al)-F(Al)
F(Si)-F(Al)
152
the interaction energies were calculated at the separation distance for the maximum
energy barrier
It is evident that the silica facendashsilica face interaction is repulsive in the pH range
of 4ndash10 due to the strong electrostatic repulsion between negatively charged silica faces
(see Figure 53 and Figure 54) The alumina facendashalumina face interactions showed a
slight repulsion with a small energy barrier at pH 6 due to weak electrostatic repulsion
and stronger van der Waals attraction Below pH 75 the silica facendashalumina face
interaction is attractive with a maximum at pH 5 whereas a slight repulsion was observed
at higher pH (pH gt 75) This is due to the opposite sign of the surface charge densities
for the silica face and alumina face at pH le 6 (silica face is negatively charged and
alumina face is positively charged) causing stronger attraction both electrostatic and van
der Waals attraction (see Figure 53 and Figure 54) At higher pH (pH gt 8) both the
silica face and alumina face carry the same surface charge sign (both silica and alumina
face carry negative charge) and hence a slight repulsive electrostatic interaction was
found The edgendashedge surfaces showed repulsive interaction for the entire pH range due
to the similar nature of surface charge ie edge surfaces carry a positive surface charge
at pH 4 which becomes increasingly negative at pH values greater than 5 (see Figure
48) The edgendashalumina face showed repulsive interactions at low pH (pH of 4) and at
high pH (pH ge 8) due to strong electrostatic repulsive interactions whereas an attractive
interaction was found at an intermediate pH of 5-6 In contrast the edgendashsilica face
showed attractive interaction only at low pH 4 and repulsion at a higher pH (pH ge 5) due
to the similar nature of the surface charge on the edge surface and the silica face of
kaolinite at higher pH The edgendashsilica face and edgendashalumina face interactions indicate
153
that the edgendashface interactions are favorable at pH lt 8 Though the magnitude of edgendash
silica face and edgendashalumina face interactions suggest an insignificant interaction on an
interaction area basis the interaction cannot be ignored as the edge effect could become
significant in concentrated suspensions when the kaolinite particles are stacked due to the
silica facendashalumina face interaction
On the basis of these different interactions shown in Figure 53 and Figure 54 it
is expected that the overall interaction of kaolinite particles will be dominated by silica
facendashalumina face in acidic solutions (pH lt 75) However the alumina facendashalumina
face interactions are unfavorable over the entire pH range of the system Although lower
in magnitude the edgendashsilica face showed favorable interaction at low pH of 4 and
therefore some edgendashface associations will also be expected at low pH It is therefore
anticipated that the kaolinite particles will aggregate initially in a silica facendashalumina face
manner forming a lamellar tactoid structure in kaolin suspensions at low pH values [23]
This results in a lower suspension shear yield stress As the pH rises the facendashface
association will grow causing the formation of tactoids with thicker edge surfaces
thereby promoting the edgendashface association This is supported by Secor and Radke [173]
who found by numerical simulation that the electrostatic field from the basal plane may
ldquospill-overrdquo to dominate the positive edge surface Chang and Sposito [174] also showed
that the negative electric field from the basal plane of a disc-shaped clay mineral particle
near the edge surface is mainly controlled by particle thickness This facendashface
association is found to be dominant at pH 5 and edgendashface associations dominant at pH
6 which corresponds to the maximum shear yield stress at pH 5-55 As the pH is
increased further the facendashface and edgendashface association decreases due to lower
154
magnitude of surface charge density on edge surfaces and face surfaces resulting in
lower shear yield stress At high pH the edgendashface and facendashface interaction forces
become repulsive and the system becomes completely dispersed and a negligible shear
yield stress is measured In this way the maximum shear yield stress at pH 55 can be
explained based on particle aggregation and its variation with system pH Even if the
edge surface charge density and corresponding interactions are based on zeta potential
measurements as dismissed at the beginning of this section on particle interactions the
relative significance of some interactions changes but in general the same conclusion is
found regarding the variation of interactions with pH
OrsquoBrien [164] observed the dominant face-face and some face-edge aggregation
behavior of kaolinite both in distilled water and in electrolyte solutions using scanning
electron microscopy of freeze-dried kaolinite samples However concern was raised that
the freeze-drying technique can alter the structure of these aggregates during drying
Recently Zbik et al [170] observed stacks of kaolinite aggregated dominantly in face-
face manner at pH 8 using cryo-vitrified technique with scanning electron microscopy
The authors could not explain the facendashface type interaction based on the assumption that
001 and 001 faces of kaolinite are negatively charged Instead it follows from our new
results that the kaolinite particles are aggregating according to silica facendashalumina face
and alumina facendashalumina face interactions
In contrast to our results Johnson et al [49 50] predicted that the kaolinite
particles will mostly interact in an edgendashface manner at lower pH However their studies
were based on the assumption that both faces of kaolinite are negatively charged which
analysis must be reconsidered in view of the AFM surface force results reported by Gupta
155
and Miller [72] These different surface interactions are of importance in order to control
the aggregation behavior of kaolinite particles and the mechanical properties of such
suspensions
532
The influence of aspect ratio (ratio of particle diameter to thickness) on the
different surface interactions is shown in
Influence of Aspect Ratio
Figure 55 The aspect ratio was determined
from the atomic force microscopy images of kaolinite particles About 150 particles were
imaged and analyzed using Nanoscope V72 software for the atomic force microscope
(Veeco Instruments Inc Santa Barbara CA) As shown the edgendashsilica face and edgendash
alumina face interactions are significant for particles with a low aspect ratio (9) as
compared to particles with a high aspect ratio (165) Notably the edgendashalumina face
interactions are dominant at pH 6 whereas silica facendashalumina face interactions are
dominant at pH 5 for kaolinite particles with low aspect ratio This is particularly
interesting as significant edgendashface interaction for particles with a low aspect ratio
indicates that particles will orient themselves in both edgendashface and facendashface (silica
facendashalumina face) organizations The particles with high aspect ratio will orient
themselves dominantly in a facendashface manner (silica facendashalumina face) It is shown that
the aggregate structures can be expected to depend on the aspect ratio of kaolinite
particles and thereby the mechanical properties of the kaolinite suspensions will be
affected by the aspect ratio
156
Figure 55- Effect of aspect ratio on different face type interaction of kaolinite particles (a) low aspect ratio = 9 and (b) high aspect ratio = 165 in 1 mM KCl solution The symbols E F(Si) and F(Al) represent edge silica face and alumina face respectively
-08
-06
-04
-02
0
02
04
06
08
1
12
3 4 5 6 7 8 9 10 11
EEm
ax
pH
E-E
E-F(Si)
E-F(Al)
F(Si)-F(Si)
F(Al)-F(Al)
F(Si)-F(Al)
(a) Low Aspect Ratio
-08
-06
-04
-02
0
02
04
06
08
1
12
3 4 5 6 7 8 9 10 11
EEm
ax
pH
E-E
E-F(Si)
E-F(Al)
F(Si)-F(Si)
F(Al)-F(Al)
F(Si)-F(Al)
(b) High Aspect Ratio
157
533
Figure 56
Influence of Electrical Double Layer Thickness
shows the effect of electric double layer thickness on the different
surface interactions Particles suspended at high ionic strength will experience a small
double layer thickness (304 nm) (see Figure 56b) Under these circumstances there is a
greater alumina facendashalumina face attraction and greater repulsion of silica faces and
edge faces when compared to particles suspended in a solution with a larger double layer
thickness (96 nm) (see Figure 56a) Also at high ionic strength there is a greater
increase in the edgendashalumina face interactions which promote edgendashface associations as
compared to low ionic strength It is evident that at high ionic strength ie at small
values of the reciprocal of the Debye constant (the thickness of the double layer) κ-1 =
304 nm the silica facendashalumina face interactions will be increased at pH 5 with
improved aggregation At the same time the increased alumina facendashalumina face
interactions will expose the silica faces on the kaolinite particles which may also further
promote aggregation with alumina faces forming a larger aggregate structure Olphen
[16] observed decreasing viscosity and yield stress of dilute and concentrated clay
suspensions at lower NaCl concentration With further addition of NaCl both the
viscosity and the yield stress increase slowly at first and rather sharply when the
flocculating concentration of NaCl for the clay was approached
534
In a suspension of clay particles three different modes of particle association or
aggregate structure may occur facendashface edgendashface and edgendashedge [16] The DLVO
Aggregate Structure
158
Figure 56- Effect of electric double layer thickness (κ-1) on different surface interactions for kaolinite particles with particle diameter 600 nm and thickness 112 nm at (a) κ-1 = 96 nm (1 mM KCl solution) and (b) κ-1 = 304 nm (10 mM KCl solution) The zeta-potentials of the silica face and the alumina face are assumed to be reduced by 30 with increasing ionic strength from 1 mM to 10 mM KCl solution The edge surface potential data for 10 mM KCl solution were taken from literature[41] The symbols E F(Si) and F(Al) represent edge silica face and alumina face surfaces respectively
-1-08-06-04-02
002040608
112
3 4 5 6 7 8 9 10 11
EEm
ax
pH
E-EE-F(Si)E-F(Al)F(Si)-F(Si)F(Al)-F(Al)F(Si)-F(Al)
(a) κ-1 = 96 nm
-1-08-06-04-02
002040608
112
3 4 5 6 7 8 9 10 11
EEm
ax
pH
E-EE-F(Si)E-F(Al)F(Si)-F(Si)F(Al)-F(Al)F(Si)-F(Al)
(b) κ-1 = 304 nm
159
interaction energies (electrostatic energy and the van der Waals interaction energy) for
the three types of association are governed by six different combinations of the three
surfaces interactions ndash the silica face the alumina face and the edge surface as explained
previously Consequently the three types of association will not necessarily occur
simultaneously or to the same extent when a kaolinite suspension is aggregated
Facendashface associations will lead to thicker and possibly larger aggregates
whereas edgendashface and edgendashedge associations will form three-dimensional voluminous
card-house structures [16] The various modes of particle association are shown in Figure
57
The SEM micrographs of kaolinite aggregates under cryogenic conditions at pH
3 5 7 and 9 are shown in Figure 58 It can be seen that the kaolinite particles are mostly
associated in a facendashface manner (silica facendashalumina face andor alumina facendashalumina
face) and some face-edge organization (edgendashsilica face) at pH 3 and pH 5 (see Figure
58) This is in good agreement with the theoretical predictions that at low pH the
attraction between the silica face and the alumina face dominates and thereby accounts
for the face-face association This face-face association also promotes edge-face
aggregation of kaolinite particles with an increase in pH-to-pH 5
At pH 7 the particles are mostly associated in edgendashedge manner and edgendashface
manner (edgendashsilica face) (Figure 58) At higher pH (pH = 9) the particles are mostly
associated in edge-edge manner creating a porous structure Also due to repulsion
between the silica face and alumina face facendashface association was not observed at pH 9
in agreement with theoretical considerations The edgendashedge interaction at pH 90 should
also be unfavorable due to similar surface charge density at the edge surfaces which
160
Figure 57- The formation of aggregate structures in kaolinite suspensions as (a) dispersed (b) facendashface (c) edgendashface (d) edgendashedge and (e) a combination of (b) (c) and (d) depending on the solution chemistry of the suspension
(a) (b) (c)
(d) (e)
161
Figure 58- Cryo-SEM micrographs of kaolinite aggregates at pH 3 5 7 and 9 at low (left) and high (right) magnification
5 μm 2 μm
5 μm 2 μm
2 μm
5 μm 2 μm
5 μm
162
causes repulsion The edgendashedge associations at high pH 9 were contrary to DLVO
expectation since all the surfaces of kaolinite particles are negatively charged and the
suspension is stable In agreement with our observation Zbik and Horn [175] also
observed similar structures involving edgendashedge association for kaolinite particles and
they proposed that hydrophobic interaction between edge surfaces could contribute to
such structures Such a proposition needs further consideration Alternatively the edgendash
edge association observed at pH 90 may be due to the experimental conditions associated
with freezing the sample under cryogenic conditions
The cryogenic-SEM images showed the kaolinite aggregate structure for a 4
kaolinite suspension This concentration may well be above the gelation point [171] but
the general trends of the aggregate structure showing dominant face-face association was
also observed in dilute (001) and semidilute (01) kaolinite suspensions (SEM graphs
not shown) Our results are also supported by Zbik and Frost [171] who observed similar
facendashface and edgendashface contacts in kaolinite from Georgia Other modes of particle
associations such as stair step edgendashedge contacts were also revealed in Birdwood
kaolinite aggregates [171]
535
The aggregate structure of kaolinite suspensions at different pH values as revealed
by cryo-SEM are also supported by further experiments conducted using photon
correlation spectroscopy (PCS) to estimate the particle size of such aggregates In our
analysis we estimated the equivalent sphere diameter of aggregate-structures for
kaolinite suspensions These aggregate structures for kaolinite suspensions are three-
Aggregate Size
163
dimensional networks of particles forming an arbitrary shape or so-called ldquocard-houserdquo
structure [16] The precise information for the size of aggregate structures in kaolinite
suspensions could not be revealed with present instrumentation and only qualitative
trends are realized Figure 59 shows the average particle size of kaolinite aggregates in
suspension as a function of pH As shown the average aggregate size of kaolinite is
about 163plusmn03 nm at pH 7 and 9 The average aggregate size of kaolinite remains
unchanged when measured as a function of time at pH 9 which represents a more
dispersed state for the kaolinite particles The aggregate size grows to 389plusmn03 nm at pH
7 in 40 minutes which could be indicative of a loose aggregate structure formed mainly
by edgendashedge associations The initial aggregate size for kaolinite suspensions at pH 35
and 5 were 2668plusmn120 nm and 1271plusmn79 nm respectively The aggregates of kaolinite
grow over an order of magnitude in size in just a few minutes at pH 3 and 5 and then
remain constant These results suggest that kaolinite particles are associated with all three
modes of interactions ndash facendashface edgendashface and edge-edge ndash forming a three-
dimensional network In our analysis we estimated the equivalent sphere diameter of
aggregate-structures for kaolinite suspensions These aggregate structures for kaolinite
suspensions are three-dimensional networks of particles forming an arbitrary shape or so
called ldquocard-houserdquo structure [16] The precise information for the size of aggregate
structures in kaolinite suspensions could not be revealed with present instrumentation
and only qualitative trends are realized Of course as stated previously the aggregate
structure as revealed by cryo-SEM and PCS will influence the mechanical properties of
kaolinite suspensions and thereby affect the rheological properties of such suspensions
164
Figure 59- Average aggregate size for a suspension of kaolinite particles as a function of pH
0
500
1000
1500
2000
2500
35 5 7 9
Aggr
egat
e Si
ze n
m
pH
t = 0 mint = 40 min
165
54
The mechanical properties of kaolinite suspensions particularly the shear yield
stress is explained based on the aggregate structure of the kaolinite particles A new
analysis based on the surface charge densities of the silica face alumina face and edge
surfaces demonstrate the role of pair-wise interactions in controlling the rheology of
kaolinite particulate suspensions The maximum shear yield stress of kaolinite
suspensions is indicative of the significant role played by particle organization in the
formation of aggregates as governed by edgendashedge edgendashsilica face edgendashalumina face
silica facendashalumina face silica facendashsilica face and alumina facendashalumina face
interaction energies
Summary
The results indicate that the facendashface (silica facendashalumina face) is the dominant
particle interaction at low pH values which promotes edgendashface (edgendashsilica face and
edgendashalumina face) and facendashface (silica facendashalumina face) interaction at intermediate
pH values justifying the maximum shear yield stress at pH 5-55 This conclusion is also
confirmed by cryo-SEM analysis of kaolinite aggregate structure and photon correlation
spectroscopy At a higher pH (pH = 7) the kaolinite aggregates show edgendashedge and
edgendashface interactions whereas a more porous structure of aggregates was observed at
high pH (pH = 9)
The influences of particle aspect ratio and electrical double layer thickness were
also examined to determine their effect on interaction energies The findings show that
the edge surfacendashsilica face interactions become favorable at a low aspect ratio whereas
the silica facendashalumina face and alumina facendashalumina face interactions are increased at
high ionic strength conditions These different interactions and their relative significance
166
provide the basis for a more detailed explanation of the rheological behavior of kaolinite
suspensions as well as an improved foundation for the modification of kaolinite
interactions and control of rheological properties
CHAPTER 6
CRYSTAL LATTICE IMAGING OF THE SILICA
AND ALUMINA FACES OF KAOLINITE USING
ATOMIC FORCE MICROSCOPY
The crystal lattice images of the two faces of kaolinite (the silica face and the
alumina face) have been obtained using contact-mode atomic force microscopy (AFM)
under ambient conditions Lattice resolution images reveal the hexagonal surface lattice
of these two faces of kaolinite Analysis of the silica face of kaolinite showed that the
hexagonal surface lattice ring of oxygen atoms had a periodicity of 050 plusmn 004 nm
between neighboring oxygen atoms which is in good agreement with the surface lattice
structure of the mica basal plane The center of the hexagonal ring of oxygen atoms is
vacant
Analysis of the alumina face of kaolinite showed that the hexagonal surface lattice
ring of hydroxyls surround a hydroxyl in the center of the ring The atomic spacing
between neighboring hydroxyls was determined as 036 plusmn 004 nm Ordering of the
kaolinite particles for examination of the silica and alumina surfaces was accomplished
using different substrates a procedure previously established Crystal lattice imaging
168
supports previous results and independently confirms that the two faces of kaolinite have
been properly identified
61
Kaolinite [Al2O32SiO22H2O] is an industrial mineral and its surface properties
are of particular importance in widespread applications eg in ceramics in the
manufacture of paper (as a coating pigment and filler) in inks and paints (as an
extender) and as an additive in the production of rubber and polymers [53 63 116] In
other situations kaolinite is a nuisance when present as a gangue mineral in flotation
separations and during the thickening of plant tailings
Introduction
Kaolinite naturally exists as pseudo-hexagonal platy-shaped thin particles
generally having a size of less than one micron extending down to 100 nm The behavior
of these nanosized kaolinite particles in suspensions pastes and composite materials is
controlled by its surface chemistry features Analysis of the surface chemistry features
such as electrokinetic phenomena is complicated by the anisotropic platy structure of the
particles which manifests itself in edge surfaces and face surfaces Additionally the
bilayer mineral structure suggests that there should be two types of surface faces defined
by the 001 and the 001 basal planes In this way one face should be described by a silica
tetrahedral surface and the other face should be described by an aluminum hydroxide
(alumina) octahedral surface as shown in Figure 11
Limited research has been reported on the experimental characterization of these
face surfaces [15] A few studies have reported the average FTIR spectra of both faces of
kaolinite [53-55] Recent development of advanced analytical techniques (XPS - X-ray
169
photoelectron spectroscopy LEISS - Low energy ion scattering spectroscopy and ToF-
SIMS - Time of flight-secondary ions mass spectroscopy) seem promising to facilitate
investigation of the two faces of kaolinite provided that the particles can be oriented and
that the instrumentation is sufficiently surface sensitive to collect signals from just the
very first layer For example a recent study attempted to use ToF-SIMS to study the talc
surface [56] However these results were averaged over a few layers of talc Recently
many researchers have used scanning electron microscopy (SEM) [58 59] transmission
electron microscopy (TEM) [60] and atomic force microscopy (AFM) [59 61 62] as
imaging tools to characterize particle shape and morphology
It is now well established with some success that AFM can also be used to
investigate the crystal lattice structure of mineral surfaces Atomic resolution has been
successfully obtained on graphite [176 177] molybdenum sulfide [176] boron nitride
[178] germanium [179] sapphire [180] albite [181] calcite [182] and sodium chloride
[183] The AFM has also been used to investigate the crystal lattice structure of the
tetrahedral layer of clay minerals in 21 layer structures such as muscovite [184] illite
[185] and montmorillonite [185] Atomic-scale resolution has also been obtained for the
basal oxygen atoms of a mixed-layered illitesmectite [186] zeolite clinoptilolite [187]
and hematite [188] The details of obtaining atomic and subnanometer resolution imaging
in ambient conditions by AFM is given in the literature [189]
Wicks et al [190] were probably the first to simultaneously report the surface
images of both the tetrahedral and octahedral sheets of lizardite (11 layer structure) using
AFM and they identified the surface hydroxyl groups and magnesium atoms in the
octahedral sheet In this way they identified the two sides of the lizardite clay mineral
170
The surface images of chlorite (211-type structure) were also investigated by AFM and
both the tetrahedral sheet and the brucite-like interlayer sheet was observed [191]
Recently Kumai et al [192] examined the kaolinite surface using AFM They
used the ldquopressedrdquo powder sample preparation technique and obtained the surface
images of both the silica tetrahedral surface and alumina octahedral surface of kaolinite
particles However this technique is compromised as the particles are randomly oriented
and poses difficulty in identifying the appropriate face surface (silica face or alumina
face) of kaolinite
A recent study by Gupta and Miller [72] demonstrates an appropriate technique to
orient the kaolinite particles which selectively exposes the silica face and alumina face of
kaolinite by depositing the particles on glass and alumina substrates respectively These
researchers have indirectly confirmed the silica face and alumina face of kaolinite by
surface force measurements on the two faces of kaolinite The objective of this paper is to
distinguish the silica face and alumina face of kaolinite by direct surface imaging at the
atomic level using AFM thus providing independent confirmation of the procedure
developed previously [72]
62
621
Materials and Methods
A clean English kaolin (Imerys Inc UK) was obtained from the St Austell area
in Cornwall UK The sample was cleaned with water and elutriation was used to achieve
classification at a size of less than 2 microm No other chemical treatment was done Further
details about the kaolinite extraction and preparation are given in the literature [124] The
Sample Preparation
171
kaolinite suspension (1000 ppm) was prepared in high purity Milli-Q water (Millipore
Inc) with a resistivity of 182 MΩ-cm The pH was adjusted to 55 using 01 M HCl or
01 M KOH solutions All chemicals used were of ACS grade The kaolinite was the
dominant mineral phase as characterized using X-ray diffraction and energy dispersive
spectroscopy Further details of kaolinite characterization are reported in the literature
[72]
622
Two substrates ndash a mica disc (ProSciTech Queensland Australia) and a fused
alumina substrate (Red Optronics Mountain View CA) were used to order the kaolinite
particles [72] The kaolinite particle suspension (1000 ppm) was sonicated for 2 minutes
and about 10 microl of the suspension was air-dried overnight on a freshly cleaved mica
substrate under a petri-dish cover in a laminar-flow fume hood In this way the kaolinite
particles attach to the mica substrate with the alumina face down exposing the silica face
of kaolinite as shown from previous surface force measurements [72] ie the positively
charged alumina face of kaolinite is attached to the negatively charged mica substrate
Substrate Preparation
The fused alumina substrate was cleaned using piranha solution (a mixture of
sulfuric acid and hydrogen peroxide in a ratio of 31) at 1200C for 15 minutes followed
by rinsing with copious amounts of Milli-Q water and finally blown dry with ultra high
purity N2 gas A 10 microl kaolinite suspension was applied to the alumina substrate and
dried in the same manner as the mica It was found that the alumina face of kaolinite was
exposed on the fused alumina substrate based on previous surface force measurements
172
[72] ie the negatively charged silica face of kaolinite is attached to the positively
charged fused-alumina substrate
The samples were prepared the night before AFM analysis and stored in a
desiccator until their use Just prior to the AFM experiments the substrates were
sonicated for a minute in Milli-Q water to remove loosely adhered kaolinite particles
washed with Milli-Q water and gently blown with N2 gas before AFM investigation All
substrates were attached to a standard sample puck using double-sided tape
623
A Nanoscope AFM with Nanoscope IV controller (Veeco Instruments Inc Santa
Barbara CA) was used with an E-type scanner Triangular beam silicon nitride (Si3N4)
cantilevers (Veeco Instruments Inc Santa Barbara CA) having pyramid-shaped tips
with spring constants of about 058 Nm were used The cantilevers were cleaned using
acetone ethanol water in that order and gently dried with ultra high purity N2 gas The
cantilevers were subsequently cleaned in a UV chamber for 30 minutes prior to use The
substrates were loaded on AFM equipped with a fluid cell The contact mode imaging
was done in Milli-Q water The AFM instrument was kept in an acoustic and vibration
isolation chamber The imaging was commenced 30 minutes after sample loading to
allow the thermal vibration of the cantilever to equilibrate in the fluid cell First an image
of the particles was obtained at a scan rate of 1 Hz and scan area of 1 microm Subsequently
the atomic resolution imaging was completed using the zoom-in and offset feature of the
Nanoscope vs 531R1 software (Veeco Instruments Inc Santa Barbara CA) to scan an
area of 12 nm on the particle surface The atomic imaging was obtained at a scan rate of
Atomic Force Microscopy
173
30 Hz at scan angle of 800ndash900 with very low integral and proportional gain (006) The
online filters (low pass and high pass) were turned off during the online crystal lattice
imaging
During offline image processing flattening and low pass filtering were applied to
obtain clear images using Nanoscope vs 531R1 software The images were further
Fourier-filtered (2D FFT) to obtain the crystal lattice images using SPIP software (Image
Metrology AS Denmark)
63
In order to obtain the crystal lattice imaging of the silica face and alumina face of
kaolinite the scanner was first calibrated using a mica substrate
Results and Discussion
Figure 61 presents the
crystal lattice imaging of mica which shows the height image fast-Fourier transform
(FFT) spectra and the FFT transformed height image In order to make sure that the
image is real the imaging was done at other locations on the mica substrate and also with
varying scan size and scan angle The repeated pattern of dark and light spots was
reproducible and the dark spots observed were scaled appropriately with the scan size and
angle The images showed some drift in both x and y direction during imaging The dark
spots in Figure 61C and 2D correspond to a hole surrounded by the hexagonal lattice of
oxygen atoms The light spots are attributed to the three-surface oxygen atoms forming a
SiO4 tetrahedron or pairs of SiO4 tetrahedra forming a hexagonal ring-like network
Similar images were reported for the 11 type clay mineral lizardite [190] and other 21
type clay minerals [184 185 193] from AFM observations on a single crystal The fast-
Fourier transform showed the intensity peaks of oxygen atoms arranged in a hexagonal
174
Figure 61- Crystal lattice imaging of mica substrate showing (A) Flattened height image (B) FFT spectra (C) FFT transformed flattened height image and (D) Zoomed-in image of (C) of scan area of 36 nm2 The six light spots in (D) shows the hexagonal ring of oxygen atoms around the dark spots representing a hole
A B
C D
175
ring network (see Figure 61B) The crystal lattice spacing between neighboring oxygen
atoms was calculated as 051 plusmn 008 nm from the average of 10 neighboring atoms This
is in very good agreement with the literature value of 0519 nm [194]
Figure 62 shows an image of a kaolinite particle on a mica substrate The image
shows the platy nature and the pseudo-hexagonal shape of the kaolinite particle The
scanning was sequentially zoomed on the particle Figure 63 shows the crystal lattice
imaging of the silica face of a kaolinite particle on the mica substrate The flattening and
low pass filtering was applied to the height image in an offline mode (see Figure 63B)
The FFT spectra showed the similar intensity of peaks of oxygen atoms arranged in a
hexagonal ring network as observed for the mica substrate As expected the silica face of
kaolinite showed the similar hexagonal ring-like network of oxygen atoms as observed on
the mica substrate (compare Figure 61D and Figure 63D) Note that the scan scale for
the image of the silica face of kaolinite was twice that used for the mica substrate (12 nm
vs 6 nm) which shows the reproducibility of the crystal lattice images obtained on
different substrates The crystal lattice spacing between neighboring oxygen atoms was
calculated as 050 plusmn 004 nm from the average of 10 neighboring atoms This lattice
spacing is in good agreement with 053 nm as reported in the literature [192]
The crystal lattice imaging of the alumina face of kaolinite on a fused alumina
substrate is shown in Figure 64 The FFT spectra shows the intensity peaks of the
hydroxyl atoms forming a hexagonal ring network similar to that obtained on the silica
face of kaolinite (see Figure 64c) Notice that the hexagonal ring of hydroxyls shows the
inner hydroxyl in the center of the ring instead of a hole as observed for the silica face of
kaolinite and mica substrates (compare Figure 61D Figure 63D and Figure 64D) The
176
41
Figure 62- (A) Topography and (B) Deflection images of kaolinite particle on the mica substrate
A
B
E c
m
177
Figure 63- Crystal lattice imaging of the silica face of kaolinite showing (A) Theoretical atomic lattice structure (B) Flattened-low pass filtered height image (C) FFT spectra and (D) FFT transformed flattened-low pass filtered height image of scan size 36 nm2 The six black circles in (D) shows the hexagonal ring of oxygen atoms around the dark spots representing a hole
B
C
A
D
178
Figure 64- Crystal lattice imaging of alumina face of kaolinite showing (A) Theoretical atomic lattice structure (B) Flattened-low pass filtered height image (C) FFT spectra and (D) FFT transformed flattened-low pass filtered height image of (B) The seven black circles in (D) shows the hexagonal ring of hydroxyl atoms with a central inner hydroxyl atom
BA
C D
B
179
image shown in Figure 64D is similar to the octahedral sheet of lizardite [190] the
internal octahedral sheets of micas and chlorite [194] and the brucite-like layers of
hydrotalcite [195] The octahedral sheet of kaolinite consists of a plane of hydroxyls on
the surface The average hydroxyl-hydroxyl distance of the octahedral sheet is 036 plusmn
004 nm which is in reasonable agreement with the literature value of 029 nm [196] For
a kaolinite pellet Kumai et al [192] observed the distance between the hydroxyl atoms
as 033 nm
Recently Gupta and Miller [72] indirectly identified the two kaolinite faces ndash
silica face and alumina face ndash through surface force measurements between each of these
two faces and a silicon nitride cantilever These authors demonstrated that the silica face
of kaolinite is negatively charged at pH gt 4 whereas the alumina face is positively
charged at pH lt 6 and negatively charged at pH gt 8 These results are in excellent
agreement with the lattice images of the silica face and the alumina face of kaolinite
showing the distinct feature of these faces (the hexagonal ring of oxygen atoms on the
silica face and the hexagonal ring of hydroxyls surrounding a central hydroxyl on the
alumina face)
More importantly the experimental technique developed by Gupta and Miller
[72] to order kaolinite particles with the desired face exposed is validated This procedure
using two different appropriate substrates is unique and could be applied for AFM
interrogation of any bilayer system with different characteristics to better understand their
surface properties and crystal structure
180
64
Crystal lattice images were obtained on the silica tetrahedral and alumina
octahedral faces of kaolinite using atomic force microscopy The images showed the
repeated tetrahedral oxygen atoms on the silica face forming a closed hexagonal ring-like
network with a hole in the center On the other hand as expected the alumina face of
kaolinite showed the hexagonal ring of hydroxyls surrounding a central hydroxyl These
results validate the procedure to order kaolinite particles with the desired face exposed
[72] It is clear that atomic force microscopy can be used effectively in the investigation
of mineral surfaces even for particles of nanometer size
Summary
CHAPTER 7
HIGH RESOLUTION TRANSMISSION ELECTRON
MICROSCOPY OF KAOLINITE
Results from a high resolution transmission electron microscopy investigation of
kaolinite has indicated that kaolinite (11 type of clay) is indeed composed of bilayers of
a silica tetrahedral sheet bonded to an alumina octahedral sheet with a c-spacing between
the bilayers of 72 Aring Occasionally defects in the form of bended bilayers was observed
in selected kaolinite particles HRTEM has also indicated that a trilayer structure (21
type clay) with increased c-spacing of 10 Aring was occasionally present in the kaolinite
structure lying between the kaolinite bilayers In addition occasionally a single trilayer
particle was found in the kaolinite population but this was a rare occasion Of course the
presence of such defects in the kaolinite particles and the presence of trace amounts of
21 layer clay minerals particles will influence the surface chemistry including the
surface charge properties of kaolinite
71
The understanding of the structure of the kaolinite is important as it influences its
surface chemistry particularly the electrokinetics properties The existence of defects in
Introduction
182
the bilayer of a kaolinite particle and the presence of other 21 clay mineral particles in
the kaolinite population will affect its surface charge properties Frequently X-ray
diffraction (XRD) is used to characterize the defects and other clay minerals in a kaolinite
sample The existence of layer defects andor a small amount of other clay mineral
particles does not always correlate with the XRD results In some instances high
crystallinity as estimated by XRD corresponds to fewer defects and dislocations in
kaolinite [197] XRD powder patterns are not sensitive enough to identify the small
amount of mixed clay minerals that may be present in the kaolinite samples
High resolution transmission electron microscopy (HRTEM) has been a powerful
tool in studying the layering structure of kaolinite and other clay minerals [60 197-202]
HRTEM has contributed to the investigation of stacking structures in phyllosilicates as
established in the literature [203] HRTEM imaging with the electron beam parallel to
layers enables direct determination of the stacking sequence for individual layers which
is necessary to analyze nonperiodic structures ie stacking disorders or faults as well as
other mixed-layer silicates Yada [204 205] first studied the structure of chrysotile and
antigorite using HRTEM They reported that the chrysotile has a fibrous structure with a
c-spacing of 73 Aring whereas antigorite consist of a wavy structure where the tetrahedral
sheet exchanges polarity with the octahedral sheet every few tetrahedra Amouric and
Olives [199] used HRTEM to investigate the transformation of smectite into kaolinite and
kaolinite-smectite interstratifications Mixed-layer silicates such as illite and smectite
have also been studied with HRTEM [206]
Despite the good success with HRTEM few studies have analyzed the stacking
and crystal organization of kaolin minerals [197 200] Ma and Eggleton [197] examine
183
the kaolinite surface using HRTEM and indicated that three types of face surfaces may
exist in natural kaolinite crystals Type 1 kaolinite structure is the ideal structure and has
the expected 7 Aring surface layer as the terminal layer exposed (ie TOTOTOTOhellipwhere T
stands for silica tetrahedral layer and O stands for alumina octahedral layer) Type 2
kaolinite structure has one 10 Aring pyrophyllite-like layer as the surface layer on one side of
the kaolinite particle (TOTOTOTOhellipTOTO(TOT)) Type 3 kaolinite structure has one
or several 10 Aring collapsed smectite-like layers at one or both sides of a stack
((TOT)TOTOTOTOhellipTOTO(TOT)) Kogure and Inoue [200] investigated the stacking
defects in kaolinite and dickite The authors observed a high density of stacking defects
in kaolinite which are formed by a mixture of two kinds of lateral interlayer shifts
between adjacent layers With this information Kogure and Inoue [200] also explained
the kaolinite-to-dickite transformation mechanism Different stacking sequence andor
defects may exist in kaolinite of particular origin
Therefore the objective of the research reported in this chapter is to investigate
whether the 11 bilayer structure of kaolinite is consistent with the ideal crystal structure
(Type 1) or is the Cornwall kaolinite used in this dissertation research described by
termination with a 21 structure which defines the face surfaces The surface chemistry
particularly the electrokinetic considerations of kaolinite particles and their face surfaces
would be affected by these terminations of 11 (kaolinite) or 21 (smectite) type layers
72
Kaolinite powder was ground for 10 minutes using an agate pestle mortar and
then embedded into a molded resin block Thin sections with a thickness from 50 nm to
Sample Preparation
184
100nm were cut from an intact resin block using a Leica UltraCut microtome (Leica
Microsystems) and collected onto formvar-coated copper mesh grids After being
transferred onto the grids the thin sections were also lightly coated with carbon to
minimize the charging effect during the TEM imaging
73
Tecnai F20 (FEI Co Oregon USA) a twin-lens system operated at 200kV was
used for the investigation of the thin sections of kaolinite particles The images
(4096times4096) were digitally acquired by an UltraScanTM 4000 (USC4000 Model 895
Gatan Inc) using a charge-coupled device (CCD) imaging The images were processed
and analyzed using DigitalMicrograph (version 391 powered by the Gatan Software
Team)
Electron Microscopy
74
The layered structure of kaolinite is shown in
Results and Discussion
Figure 71 at low magnification
showing the stacking of kaolinite particles viewed along their edge surface Single
particles of kaolinite were found to be 100-150 nm thick A bilayer in a kaolinite particle
is about 072 nm thick These results indicate that a kaolinite particle structure consists of
138-208 bilayers
The lattice fringe pattern of the kaolinite particles with the electron beam parallel
to 001 basal plane was obtained as shown in Figure 72 The dark and light fringe pattern
shows a c-spacing of 72 Aring This c-spacing is very consistent as reported in the literature
185
Figure 71- Low magnification TEM image showing the edges of kaolinite particles
Edge Surface of Kaolinite Particle
150 nm
186
Figure 72- Lattice fringe images of kaolinite showing c-spacing of 072 nm
Defect72 Aring
187
indicating that the kaolinite is indeed 11 bilayer structure consisting of the silica
tetrahedral and the alumina octahedral sheets [22 197 199 207] Figure 72 also shows
the stacking defect (bending of several layers) in the kaolinite particle Out of fourteen
particles examined only one showed this stacking fault Plancon et al [208] also
observed similar defects during their investigation of kaolinite samples Ma and Eggleton
[197] also observed defects in lattice fringes of kaolinite stacks such as dislocations and
layer terminations in primary kaolinites and deformations at the nanoscale (ie bending
of several layers) are common in transported kaolinites These defect structures are not
only important to crystal chemistry but also suggestive of the stability relationships
between the kaolinite layers
Figure 73 shows the lattice fringe image of another kaolinite particle showing
two different c-spacings of 72 Aring and 10 Aring The c-spacing of 72 Aring for the kaolinite
particle was consistent with the previous image of kaolinite particle as shown in Figure
72 The increased c-spacing of 10 Aring in stacks of kaolinite particles was also reported in
the literature [197 199] and has been attributed to 21 type layer structures such as
smectite These mixed layer silicates ndash kaolinite (11) and smectite (21) affect the
electrokinetic properties of these particles when suspended in water Not only is the
surface charge of the kaolinite particles influenced by the presence of these 21 layer
particles these 21 layer structures may also correspond to a weak zone where the
particles will cleave and expose a 21 type layer structure at both faces of the kaolinite
particle as explained in Figure 74 This defect may have a significant effect on the
electrokinetic properties of kaolinite particles dominated by the silica tetrahedral sheet at
188
Figure 73- Lattice fringe pattern of kaolinite along 001 basal plane
72 Aring
10 Aring
189
Figure 74- Schematic diagram of kaolinite with mixed-layer silicate showing that after cleavage the kaolinite particle may consist of silica a tetrahedral sheet at both faces
21 clay mineral(Smectite)
11 clay mineral (Kaolinite)
After Breakage
190
both faces Out of 14 particles examined with HRTEM two particles showed this mixed
layer silicates of 21 type intercalated between the stacks of kaolinite bilayers
A third type of stacking was also observed with HRTEM imaging which shows a
c-spacing of 10 Aring as shown in Figure 75 This increased c-spacing of 10 Aring corresponds
to 21 type clay minerals such as smectite [197 199] There was another lattice fringe
observed at 37 Aring which may arise from the octahedral sheet of 21 type clay minerals
The co-existence of single smectite-type clay minerals with kaolinite particles will affect
its surface properties particularly its electrokinetic and rheological properties when the
particles are prepared in suspension Examination of the literature has revealed different
values of cation exchange capacity (CEC) for kaolinite from 36 to100 micro-moleg
depending on the source of kaolinite and type of counterions [30-32] This wide variation
in CEC among different samples of kaolinite may exist when the 21 type clay minerals
such as pyrophyllite with low CEC or smectite with high CEC are intermixed with
kaolinite particles [197] Ferris and Jepson [29] analyzed the same kaolinite sample as
was used in this dissertation research and found a very low or no definite cation exchange
capacity The implication is that the kaolinite used in this research may be intermixed
with traces of 21 pyrophyllite-like clay minerals with low CEC Despite the variation in
CEC for kaolinite there is a common consensus among researchers that kaolinite has
very small cation exchange capacity in contrast to some other clay minerals such as
smectite
The electrokinetic characterization of silica and gibbsite particles has revealed a
point of zero charge (PZC) at pH 2-3 and 8-9 respectively [15 209] It is expected that
191
Figure 75- HRTEM image showing a smectite layer
37 Aring
10 Aring
192
particles composed of bilayers of one silica sheet (silica tetrahedral sheet) and another
alumina sheet (alumina octahedral sheet) such as ideal particles having one silica face
and one alumina face kaolinite will have a PZC which would be the average of pure
silica particles and pure alumina particles ie about pH 5-6 However many researchers
have reported a lower PZC at pH lt 3 for kaolinite as determined by electrophoresis [29
39-45 52] It is evident that the electrophoresis technique for surface charge
characterization is compromised by the heterogeneous charge character and platy shape
of kaolinite particles and does not reveal the true surface charge characteristics of
kaolinite In addition to the above the surface charge properties of kaolinite particles will
also be compromised by the presence of 21 clay layer defects which may be present in
the kaolinite structure (Figure 73) or by 21 clay particles (Figure 75) present as trace
impurities as revealed from the HRTEM results Ma and Eggleton [197] have observed
kaolinite stacks ended on one side or both sides by a 21 type structure The presence of
these 21 structures in the kaolinite sample will increase the silica dominance in kaolinite
and thereby may shift the PZC towards a lower pH value The surface charge properties
of kaolinite will therefore be affected by the presence of these 21 layer clay minerals
The potentiometric titration is another technique to measure surface charge of
particles which gave relatively higher PZC for kaolinite as pH 472 These results are in
good agreement with the PZC values reported in the literature as pH 43 [34] pH 45 [38]
and pH 46 [161] Though a bit higher PZC is obtained by potentiometric titration this
value is still lower than the expected PZC of pH 5-6 These results indicate the presence
of other 21 layer clay minerals which may be present with kaolinite affecting its surface
charge properties and lowering its PZC
193
It is clear from this study and other published studies that the surface charge
properties of kaolinite might be complicated by the presence of small amounts of 21
layer clay minerals HRTEM seems to be a reliable method to identify the surface layer
types of kaolinite In order to better understand the surface chemistry of kaolinite it is
highly important to quantify the presence of 21 layer clay minerals using HRTEM
75
HRTEM is an appropriate and reliable technique to describe defect structures and
impurities in kaolinite samples The lattice fringe images of Cornwall kaolinite from
HRTEM always showed that the kaolinite occurs as a bilayer structure with c-spacing of
72 Aring Occasionally there were defects such as bending of layers observed in the stacks
of kaolinite The 21 type clay minerals were also revealed in this study with increased c-
spacing of 10 Aring These 21 type clay minerals trilayer structure seem to exist in between
bilayers of kaolinite or as single particles The surface chemistry of kaolinite particularly
may be affected by the presence of even a small amount of 21 type clay minerals and
may shift the PZC of kaolinite towards lower pH Further investigation should be
conducted in order to quantify the effect of trilayer clay minerals in primary kaolinite
particles
Summary
CHAPTER 8
CONCLUSIONS AND FUTURE RESEARCH
The major objective of this dissertation research was to investigate the surface
chemistry of kaolinite particles in regards to composition morphology surface charge
properties of its faces rheological properties and particle interactions Last but not least
was the identification of the silica face the alumina face and the edge surface of kaolinite
particles In this regard all objectives have been achieved using a high purity kaolinite
sample from Cornwall UK In particular the following summaries describe the
accomplishments and contributions
A pool of advanced analytical techniques utilized in this dissertation research
such as XRF XRD SEM AFM FTIR and ISS has explored the detailed morphological
and surface chemistry features of kaolinite X-ray fluorescence (XRF) spectrometry
determined the chemical composition of kaolinite and thereby predict the structural
formula as (Si394Al006)IV(Al399Fe001)VIO10(OH)8Fe001Ca001Mg001K002Na0005 X-ray
diffraction study (XRD) showed that kaolinite was the dominant mineral phase with some
minor impurities of quartz and anatase Scanning electron microscopy (SEM) and atomic
force microscopy (AFM) confirmed the platy nature and hexagonal to subhedral shape of
kaolinite The median diameter and thickness of kaolinite from Cornwall UK were
195
determined as 600 nm and 11 nm respectively The surface chemistry features as
revealed by Fourier transform infrared spectroscopy (FTIR) determined the OH group
vibrations of the kaolinite surface from the inner OH group stretching vibrations at 3620
cm-1 and inner-surface OH group vibrations at 3691 cm-1 3668 cm-1 and 3651 cm-1 Low
energy ion scanning spectroscopy (ISS) revealed an overlapping band of SiAl elements
detected from both the silica and alumina faces of kaolinite
AFM surface force measurements revealed that the silica tetrahedral face of
kaolinite is negatively charged at pH gt 4 whereas the alumina octahedral face of
kaolinite is positively charged at pH lt 6 and negatively charged at pH gt 8 The results
suggest that the iso-electric point of the silica tetrahedral face is at pH lt 4 and that the
iso-electric point of the alumina octahedral face lies between pH 6 and 8 These results
contradict the generally accepted view that basal plane surfaces of kaolinite carry a
permanent negative charge due to minor substitution of Al3+ for Si4+ in the silica
tetrahedral layer and suggest some surface charge dependency of the two faces with
respect to solution pH
The electrokinetic properties of kaolinite are complicated by its anisotropic
features ndash nonuniform surface charge densities on the faces (the silica face the alumina
face and the edge surfaces) and its platy-shaped Using Smoluchowskirsquos classical model
the iso-electric point for kaolinite was determined at less than pH 3 The surface charge
properties of kaolinite were also determined experimentally using traditional titration
techniques such as M-R titration and potentiometric titration and using a new technique
by surface force measurements with atomic force microscopy The point of zero charge
was determined as pH 45 by titration techniques which is in good agreement with the
196
iso-electric point in between pH 4 and 5 determined by surface force measurements It
was found that the surface charge densities of kaolinite particles are better characterized
by titration and surface force measurements
Results from kaolinite particle interactions indicate that the silica facendashalumina
face interaction is dominant for kaolinite particle aggregation at low pH pH4 This facendash
face association increases the stacking of kaolinite layers and thereby promotes the
edgendashface (edgendashsilica face and edgendashalumina face) and facendashface (silica facendashalumina
face) associations with increasing pH and hence the maximum shear yield stress at pH 5-
55 The facendashface association at low pH has been confirmed from cryo-SEM images of
kaolinite aggregates taken from suspension which show that the particles are mostly
organized in a facendashface and edgendashface manner At higher pH conditions the cryo-SEM
images of the kaolinite aggregates reveal a lower degree of consolidation and the edgendash
edge association is evident
Crystal lattice resolution images reveal the hexagonal surface lattice for both the
silica and alumina faces of kaolinite Analysis of the silica face of kaolinite showed that
the hexagonal surface lattice ring of oxygen atoms had a periodicity of 050 plusmn 004 nm
between neighboring oxygen atoms which is in good agreement with the surface lattice
structure of the mica basal plane The center of the hexagonal ring of oxygen atoms is
vacant Analysis of the alumina face of kaolinite showed that the hexagonal surface
lattice ring of hydroxyls surround a hydroxyl in the center of the ring The atomic spacing
between neighboring hydroxyls was determined as 036 plusmn 004 nm
High resolution transmission electron microscopy investigation of kaolinite has
indicated that kaolinite is indeed composed of bilayers of silica tetrahedral sheet
197
covalently bonded to an alumina octahedral sheet The stacked bilayers have a c-spacing
of 72 Aring Occasionally defects in the form of bending of bilayers was observed in the
stack of bilayers composing a kaolinite particle HRTEM has also indicated that some
particles have a 21 type clay mineral in the stack of bilayers with an increased c-spacing
of 10 Aring under these circumstances
As noted in previous paragraphs a number of important contributions have been
made but perhaps most important has been the protocol of surface force measurements
for kaolinite particles It is expected that this protocol can be used to good advantage for
the surface clay study of other clay minerals in future research
During this dissertation research we have found that direct measurement of the
surface charge densities of the edge surface though highly desired is difficult at the
moment due to their nanosize exposure Preparation of such edge surface is difficult It is
our hope that future research will focus in this direction to develop new techniques for
preparing edge surfaces of kaolinite with no contamination from basal plane surfaces
This would help researchers to better understand the surface chemistry of kaolinite and
to better control their surface properties
Another aspect of this dissertation research was to investigate the electrophoretic
motion of kaolinite particles This objective was met with the design of appropriate
experimental techniques such as potentiometric titration and surface force measurements
An appropriate theoretical model to describe the electrophoretic mobilities of such
anisotropic particles is highly desired and a good review of ongoing work is already
discussed in this dissertation The review should provide a framework for the
198
development of such a procedure to study the electrokinetic properties of kaolinite and
other clay minerals in the future
Finally with regard to future research in addition to the surface charge
characteristics of clay surfaces the hydrophobic properties of clay faces should be
considered For many engineered systems such as flotation the surface wetting
characteristics along with surface charge properties will be equally important in order to
understand and control the behavior of these particles in a flotation system The
fundamental wetting characteristics of different clay faces minus the silica face the alumina
face and the edge surface would help us understand and better control the behavior of
clay particles in flotation separations as well as in other applications where suspensions
and pastes of clay particles are used
REFERENCES
[1] HH Murray Applied Clay Science 5 (1991) 379
[2] LE Taylor JA Hillier AJ Benham AC MacKenzie S British Geological World Mineral Production 1999-2003 British Geological Survey Nottingham 2005
[3] Y Hu X Liu Minerals Engineering 16 (2003) 1279
[4] Y-h Hu W Sun X-w Liu D-z Wang Transactions of Nonferrous Metals Society of China 13 (2003) 1430
[5] Y Hu H Jiang D Wang Minerals Engineering 16 (2003) 1221
[6] Y Hu X Liu Z Xu Minerals Engineering 16 (2003) 219
[7] Y Hu S Wei J Hao JD Miller K Fa International Journal of Mineral Processing 76 (2005) 163
[8] W-q Qin G-z Qiu Y-h Hu Transactions of Nonferrous Metals Society of China 13 (2003) 679
[9] L-y Xia H Zhong G-y Liu Z-q Huang Q-w Chang X-g Li Transactions of Nonferrous Metals Society of China 19 (2009) 446
[10] RJ Chalaturnyk JD Scott B Ozum Pet Sci Technol 20 (2002) 1025
[11] Fine Tailings Fundamentals Consortium Advances in Oil Sands Tailings Research Alberta Dept of Energy Oil Sands and Research Division Alberta Canada 1995
[12] ME Schrader GI Loeb Editors Modern Approaches to Wettability Theory and Applications Plenum 1992
[13] K Ma AC Pierre Clays and Clay Minerals 47 (1999) 522
[14] E Wieland W Stumm Geochim Cosmochim Acta 56 (1992) 3339
200
[15] JD Miller J Nalaskowski B Abdul H Du Canadian Journal of Chemical Engineering 85 (2007) 617
[16] HV Olphen An Introduction to Clay Colloid Chemistry For Clay Technologists Geologists and Soil Scientists Interscience New York 1963
[17] WA Deer RA Howie J Zussman An Introduction to the Rock-Forming Minerals Wiley New York 1966
[18] GH Bolt MGM Bruggenwert Editors Developments in Soil Science Vol 5A Soil Chemistry Pt A Basic Elements Elsevier 1976
[19] GH Bolt Editor Developments in Soil Science Vol 5B Soil Chemistry B Physicochemical Models Elsevier Scientific Publishing Company 1979
[20] JB Dixon SB Weed Editors Minerals in Soil Environments Soil Sci Soc Am 1977
[21] DJ Greenland MHB Hayes Editors The Chemistry of Soil Constituents Wiley 1978
[22] GW Brindley G Brown Editors Mineralogical Society Monograph No 5 Crystal Structures of Clay Minerals and Their X-ray Identification Mineralogical Society 1980
[23] RK Schofield HR Samson Discussions of the Faraday Society 18 (1954) 135
[24] J Lyklema Fundamentals of Interface and Colloid Science Volume II Solid-Liquid Interfaces Academic Press 1995
[25] JA Kittrick Am Mineral 51 (1966) 1457
[26] B Rand IE Melton Journal of Colloid and Interface Science 60 (1977) 308
[27] RK Schofield Br Clayworker 47 (1938) 208
[28] AW Flegmann JW Goodwin RH Ottewill Proceedings of the British Ceramic Society (1969) 31
[29] AP Ferris WB Jepson Journal of Colloid and Interface Science 51 (1975) 245
[30] NC Brady The Nature and Properties of Soils 9th Ed Macmillan 1984
[31] F Adams Editor Agronomy No 12 Soil Acidity and Liming 2nd Ed American Society of Agronomy Inc Crop Science Society of America Inc Soil Science Society of America Inc 1984
201
[32] RK Schofield J Soil Sci 1 (1949) 1
[33] PW Schindler P Liechti JC Westall Neth J Agric Sci 35 (1987) 219
[34] PV Brady RT Cygan KL Nagy Journal of Colloid and Interface Science 183 (1996) 356
[35] PV Brady RT Cygan KL Nagy in AJ Everett (Ed) Adsorption of Metals by Geomedia Academic Press San Diego 1998 p 371
[36] BK Schroth G Sposito Clays and Clay Minerals 45 (1997) 85
[37] F Huertas L Chou R Wollast Geochimica et Cosmochimica Acta (1999) 3261
[38] MM Motta CF Miranda Soil Science Society of America Journal 53 (1989) 380
[39] RW Smith Y Narimatsu Miner Eng 6 (1993) 753
[40] JM Cases C Touret-Poinsignon D Vestier C R Acad Sci Ser C 272 (1971) 728
[41] DJA Williams KP Williams Journal of Colloid and Interface Science 65 (1978) 79
[42] SB Johnson DR Dixon PJ Scales Colloids and Surfaces A Physicochemical and Engineering Aspects 146 (1999) 281
[43] SK Nicol RJ Hunter Australian Journal of Chemistry 23 (1970) 2177
[44] AC Pierre K Ma J Mater Sci 32 (1997) 2937
[45] J Yuan RJ Pruett Minerals and Metallurgical Processing 15 (1998) 50
[46] MS Ccedilelik in S Fernando Wypych and Kestur Gundappa (Eds) Interface Science and Technology Elsevier 2004 p 57
[47] PF Luckham S Rossi Advances in Colloid and Interface Science 82 (1999) 43
[48] N Street Australian Journal of Chemistry 9 (1956) 467
[49] SB Johnson AS Russell PJ Scales Colloids and Surfaces A Physicochemical and Engineering Aspects 141 (1998) 119
[50] SB Johnson GV Franks PJ Scales DV Boger TW Healy International Journal of Mineral Processing 58 (2000) 267
202
[51] I Sondi O Milat V Pravdic Journal of Colloid and Interface Science 189 (1997) 66
[52] C Chassagne F Mietta JC Winterwerp Journal of Colloid and Interface Science 336 (2009) 352
[53] F Franco LA Perez-Maqueda JL Perez-Rodriguez Journal of Colloid and Interface Science 274 (2004) 107
[54] J Cuadros T Dudek Clays and Clay Minerals 54 (2006) 1
[55] E Balan AM Saitta F Mauri G Calas American Mineralogist 86 (2001) 1321
[56] E Burdukova GC Van Leerdam FE Prins RG Smeink DJ Bradshaw JS Laskowski Miner Eng 21 (2008) 1020
[57] CT Johnston Clay Miner 45 (2010) 245
[58] M Zbik RSC Smart Minerals Engineering 15 (2002) 277
[59] M Zbik RSC Smart Clays Clay Miner 46 (1998) 153
[60] DW Thompson JJ MacMillan DA Wyatt Journal of Colloid and Interface Science 82 (1981) 362
[61] M Zbik RSC Smart Clays for Our Future Proceedings of the International Clay Conference 11th Ottawa Ont June 15-21 1997 (1997) 361
[62] BR Bickmore KL Nagy PE Sandlin TS Crater American Mineralogist 87 (2002) 780
[63] CC Harvey HH Murray Appl Clay Sci 11 (1997) 285
[64] CB Maxwell Z Zhang HH Murray Thiele Kaolin Company USA Patent Application 6379452 US 2002 p 5
[65] HH Murray Clays Clay Minerals 10 (1963) 291
[66] HH Murray International Journal of Mineral Processing 7 (1980) 263
[67] HH Murray Kirk-Othmer Encyclopedia of Chemical Technology 5th Ed 6 (2004) 685
[68] MS Prasad KJ Reid HH Murray Applied Clay Science 6 (1991) 87
[69] TM Herrington AQ Clarke JC Watts Colloids and Surfaces 68 (1992) 161
203
[70] B Rand IE Melton Nature (London United Kingdom) 257 (1975) 214
[71] AE James DJA Williams Advances in Colloid and Interface Science 17 (1982) 219
[72] V Gupta JD Miller Journal of Colloid and Interface Science 344 (2010) 362
[73] VC Farmer Science (Washington DC U S) 145 (1964) 1189
[74] JM Cases P Cunin Y Grillet C Poinsignon J Yvon Clay Miner 21 (1986) 55
[75] MS Zbik RL Frost Y-F Song Journal of Colloid and Interface Science 319 (2008) 169
[76] C Liu X Li F Xu PM Huang Soil Science and Plant Nutrition (Tokyo Japan) 49 (2003) 17
[77] JI Bidwell WB Jepson GL Toms Clay Minerals 8 (1970) 445
[78] LS Birks X-Ray Spectrochemical Analysis (Chemical Analysis Vol 11) 2nd Ed Wiley-Interscience 1969
[79] R Jenkins Introduction to X-Ray Spectrometry Heyden 1977
[80] R Jenkins X-Ray Fluorescence Spectrometry ACS 1978
[81] R Jenkins Chemical Analysis Vol 99 X-Ray Fluorescence Spectrometry John Wiley and Sons 1988
[82] R Jenkins X-Ray Fluorescence Spectrometry 2nd Ed In Chem Anal (N Y) 1999 152 Wiley 1999
[83] R Tertian F Claisse Principles of Quantitative X-Ray Fluorescence Analysis Heyden 1982
[84] HP Klug LE Alexander X-Ray Diffraction Procedures for Polycrystalline and Amorphous Materials 2nd Ed Wiley-Interscience 1974
[85] BD Cullity SR Stock Elements of X-Ray Diffraction 3rd Ed Prentice Hall 2001
[86] DL Bish JE Post Am Mineral 78 (1993) 932
[87] DL Bish Soil Sci Soc Am Proc 1994 p 267
204
[88] DM Moore RC Reynolds X-ray Diffraction and the Identification and Analysis of Clay Minerals 2nd Ed Oxford Univ Press 1997
[89] OC Wells A Boyde E Lifshin A Rezanowich Scanning Electron Microscopy McGraw-Hill 1974
[90] G Binnig CF Quate C Gerber Physical Review Letters 56 (1986) 930
[91] MF Hochella Jr Reviews in Mineralogy 23 (1990) 87
[92] SM Clark JD Baldeschwieler Rev Sci Instrum 64 (1993) 904
[93] PK Hansma B Drake D Grigg CB Prater F Yashar G Gurley V Elings S Feinstein R Lal Journal of Applied Physics 76 (1994) 796
[94] N Kato I Suzuki H Kikuta K Iwata Rev Sci Instrum 66 (1995) 5532
[95] GM Bancroft JR Brown WS Fyfe Anal Chem 49 (1977) 1044
[96] AR Gonzalez-Elipe JP Espinos G Munuera J Sanz JM Serratosa J Phys Chem 92 (1988) 3471
[97] H Seyama M Soma Kokuritsu Kogai Kenkyusho Kenkyu Hokoku 111 (1988) p 125
[98] JW Stucki CB Roth WE Baitinger Clays Clay Miner 24 (1976) 289
[99] MF Hochella Jr Rev Mineral 18 (1988) 573
[100] WP Inskeep EA Nater PR Bloom DS Vandervoort MS Erich Geochim Cosmochim Acta 55 (1991) 787
[101] RB Borade A Adnot S Kaliaguine J Catal 126 (1990) 26
[102] MH Koppelman AB Emerson JG Dillard Clays Clay Miner 28 (1980) 119
[103] RK Vempati RH Loeppert DL Cocke Solid State Ionics 38 (1990) 53
[104] RK Vempati RH Loeppert DC Dufner DL Cocke Soil Sci Soc Am J 54 (1990) 695
[105] AW Czanderna Editor Methods and Phenomena Their Applications in Science and Technology Vol 1 Methods of Surface Analysis Elsevier 1975
[106] EG Brame Jr JG Grasselli Editors Practical Spectroscopy Series Vol 1 Pt A Infrared and Raman Spectroscopy Marcel Dekker 1977
205
[107] RG Messerschmidt MA Harthcock Editors Practical Spectroscopy Series Vol 6 Infrared Microspectroscopy Theory and Applications Marcel Dekker Inc 1988
[108] NJ Everall JM Chalmers A Local S Allen Vib Spectrosc 10 (1996) 253
[109] EG Brame Jr JG Grasselli Editors Practical Spectroscopy Series Vol 1 Pt B Infrared and Raman Spectroscopy Dekker 1977
[110] EG Brame Jr JG Grasselli Editors Practical Spectroscopy Series Vol 1 Pt C Infrared and Raman Spectroscopy Dekker 1977
[111] NJ Harrick Am Lab (Fairfield Conn) 20 (1988) 98
[112] L Hupka Particle-Surface Interactions in Post-Lap Cleaning of AluminaTitanium Carbide Wafers The University of Utah Salt Lake City 2006
[113] AD Karathanasis Soil Science Society of America Book Series 5 (2008) 465
[114] C Ma RA Eggleton Clays and Clay Minerals 47 (1999) 174
[115] VC Farmer Clay Miner 33 (1998) 601
[116] HH Murray Appl Clay Sci 17 (2000) 207
[117] KL Konan C Peyratout J-P Bonnet A Smith A Jacquet P Magnoux P Ayrault Journal of Colloid and Interface Science 307 (2007) 101
[118] J Drelich J Long Z Xu J Masliyah CL White J Colloid Interface Sci 303 (2006) 627
[119] S Veeramasuneni MR Yalamanchili JD Miller J Colloid Interface Sci 184 (1996) 594
[120] I Larson CJ Drummond DYC Chan F Grieser Langmuir 13 (1997) 2109
[121] MR Yalamanchili S Veeramasuneni MAD Azevedo JD Miller Colloids Surf A 133 (1998) 77
[122] GV Franks L Meagher Colloids Surf A 214 (2003) 99
[123] S Assemi J Nalaskowski JD Miller WP Johnson Langmuir 22 (2006) 1403
[124] JI Bidwell WB Jepson GL Toms Clay Minerals 8 (1970) 445
[125] J Nalaskowski J Drelich J Hupka JD Miller Langmuir 19 (2003) 5311
206
[126] WA Ducker TJ Senden RM Pashley Nature (London) 353 (1991) 239
[127] J Drelich J Long A Yeung Can J Chem Eng 85 (2007) 625
[128] X Yin J Drelich Langmuir 24 (2008) 8013
[129] V Meacutedout-Maregravere Journal of Colloid and Interface Science 228 (2000) 434
[130] L Bergstrom Advances in Colloid and Interface Science 70 (1997) 125
[131] T Arai D Aoki Y Okabe M Fujihira Thin Solid Films 273 (1996) 322
[132] BV Zhmud J Sonnefeld L Bergstrom Colloids Surf A 158 (1999) 327
[133] I Sokolov QK Ong H Shodiev N Chechik D James M Oliver J Colloid Interface Sci 300 (2006) 475
[134] M Kosmulski Chemical Properties of Material Surfaces In Surfactant Sci Ser 2001 102 Marcel Dekker Inc 2001
[135] R Raiteri B Margesin M Grattarola Sensors and Actuators B Chemical 46 (1998) 126
[136] Z Zhou WD Gunter Clays and Clay Minerals 40 (1992) 365
[137] Z Fu MM Santore Langmuir 14 (1998) 4300
[138] CC Harvey G Lagaly in BKG Theng Faiumlza Bergaya L Gerhard (Eds) Developments in Clay Science Elsevier 2006 p 501
[139] H H Murray JE Kogel Applied Clay Science 29 (2005) 199
[140] HH Murray Applied Clay Science (1977) 29
[141] HH Murray JE Kogel Applied Clay Science 29 (2005) 199
[142] N Street AS Buchanan Australian Journal of Chemistry 9 (1956) 450
[143] E Tombaacutecz M Szekeres Applied Clay Science 34 (2006) 105
[144] C Galassi AL Costa P Pozzi Clays and Clay Minerals 49 (2001) 263
[145] G Sposito Environ Sci Technol 32 (1998) 2815
[146] W Stumm Chemistry of the Solid-Water Interface Processes at the Mineral-Water and Particle-Water Interface in Natural Systems Wiley New York 1992
207
[147] AL Mular RB Roberts Transactions of the Canadian Institute of Mining and Metallurgy 69 (1966) 438
[148] RJ Hunter Editor Colloid Science Zeta Potential in Colloid Science Principles and Applications Academic Press 1981
[149] HJ Butt K Graf M Kappl Physics and Chemistry of Interfaces Wiley-VCH 2003
[150] JH Masliyah S Bhattacharjee Electrokinetic and Colloid Transport Phenomena John Wiley amp Sons Inc 2006
[151] SL Carnie GM Torrie in SA Rice I Prigogine (Eds) Advances in Chemical Physics 2007 p 141
[152] L Blum in SA Rice I Prigogine (Eds) Advances in Chemical Physics 2007 p 171
[153] M Quesada-Peacuterez E Gonzaacutelez-Tovar A Martiacuten-Molina M Lozada-Cassou R Hidalgo-Aacutelvarez ChemPhysChem 4 (2003) 234
[154] DC Henry Proc R Soc London Ser A 133 (1931) 106
[155] JL Anderson Journal of Colloid and Interface Science 105 (1985) 45
[156] MC Fair JL Anderson Journal of Colloid and Interface Science 127 (1989) 388
[157] JD Sherwood HA Stone Phys Fluids 7 (1995) 697
[158] B Braggs D Fornasiero J Ralston R St Smart Clays and Clay Minerals 42 (1994) 123
[159] GK Korpi Electrokinetic and Ion Exchange Properties of Aluminum Oxide and Hydroxides 1965
[160] M Alvarez-Silva A Uribe-Salas M Mirnezami JA Finch Minerals Engineering 23 (2010) 383
[161] AC Riese Adsorption of Radium and Thorium onto Quartz and Kaolinite A Comparison of SolutionSurface Equilibria Models Colorado School of Mines Golden 1982
[162] Z Xie JV Walther Geochim Cosmochim Acta 56 (1992) 3357
208
[163] V Gupta JD Miller AV Nguyen Conference of Metallurgists Proceedings MetSoc Vancouver BC 2010
[164] NR OBrien Clays and Clay Minerals Proceedings of the Conference 19 (1971) 353
[165] A Casagrande Boston Society of Civil Engineers Proceedings 1940 p 72
[166] TW Lambe American Society of Civil Engineers Proceedings 1953 p 1
[167] TK Tan 4th International Conference on Soil Mechanics and Foundation Engineering Proceedings 1958 p 87
[168] IT Rosenqvist Norwegian Geotechnical Institute Proceedings 1963 p 1
[169] IT Rosenqvist American Society of Civil Engineers Proceedings 1959 p 31
[170] MS Zbik RSC Smart GE Morris Journal of Colloid and Interface Science 328 (2008) 73
[171] MS Zbik RL Frost Journal of Colloid and Interface Science 339 (2009) 110
[172] AV Nguyen HJ Schulze Colloidal Science of Flotation Marcel Dekker Inc 2004
[173] RB Secor CJ Radke Journal of Colloid and Interface Science 103 (1985) 237
[174] FRC Chang G Sposito Journal of Colloid and Interface Science 163 (1994) 19
[175] M Zbik RG Horn Colloids and Surfaces A Physicochemical and Engineering Aspects 222 (2003) 323
[176] TR Albrecht CF Quate Journal of Vacuum Science amp Technology A Vacuum Surfaces and Films 6 (1988) 271
[177] Y Sugawara T Ishizaka S Morita Journal of Vacuum Science amp Technology B Microelectronics and Nanometer Structures 9 (1991) 1092
[178] TR Albrecht CF Quate Journal of Applied Physics 62 (1987) 2599
[179] SAC Gould B Drake CB Prater AL Weisenhorn S Manne HG Hansma PK Hansma J Massie M Longmire et al Journal of Vacuum Science amp Technology A Vacuum Surfaces and Films 8 (1990) 369
[180] Y Gan EJ Wanless GV Franks Surface Science 601 (2007) 1064
209
[181] B Drake R Hellmann American Mineralogist 76 (1991) 1773
[182] F Ohnesorge G Binnig Science (Washington DC United States) 260 (1993) 1451
[183] G Meyer NM Amer Applied Physics Letters 56 (1990) 2100
[184] B Drake CB Prater AL Weisenhorn SA Gould TR Albrecht CF Quate DS Cannell HG Hansma PK Hansma Science (New York NY) 243 (1989) 1586
[185] H Hartman G Sposito A Yang S Manne SAC Gould PK Hansma Clays Clay Miner 38 (1990) 337
[186] H Lindgreen J Garnaes F Besenbacher E Laegsgaard I Stensgaard Clay Minerals 27 (1992) 331
[187] AL Weisenhorn JE Mac Dougall SAC Gould SD Cox WS Wise J Massie P Maivald VB Elings GD Stucky PK Hansma Science (Washington DC United States) 247 (1990) 1330
[188] PA Johnsson CM Eggleston MF Hochella American Mineralogist 76 (1991) 1442
[189] Y Gan Surface Science Reports 64 (2009) 99
[190] FJ Wicks K Kjoller GS Henderson Canadian Mineralogist 30 (1992) 83
[191] GA Vrdoljak GS Henderson JJ Fawcett FJ Wicks American Mineralogist 79 (1994) 107
[192] K Kumai K Tsuchiya T Nakato Y Sugahara K Kuroda Clay Sci 9 (1995) 311
[193] TG Sharp PI Oden PR Buseck Surf Sci 284 (1993) L405
[194] FJ Wicks K Kjoller RK Eby FC Hawthorne GS Henderson GA Vrdoljak Can Mineral 31 (1993) 541
[195] H Cai AC Hillier KR Franklin CC Nunn MD Ward Science (Washington D C) 266 (1994) 1551
[196] RWG Wyckoff Crystal Structures John Wiley amp Sons New York 1968
[197] C Ma RA Eggleton Clays and Clay Minerals 47 (1999) 181
[198] TF Bates Electron-Opt Invest Clays (1971) 109
210
[199] M Amouric J Olives Clays and Clay Minerals 46 (1998) 521
[200] T Kogure A Inoue Am Mineral 90 (2005) 85
[201] GD Guthrie Jr DR Veblen ACS Symposium Series 415 (1989) 75
[202] JG Thompson RL Withers Clays and Clay Minerals 35 (1987) 237
[203] M Amouric C Parron L Casalini Electron Microsc 1994 Proc Int Congr Electron Microsc 13th 2B (1994) 1285
[204] K Yada K Iishi Resumes Commun - Conf Int Phys Chim Miner Amiante 3rd (1975) 3 9
[205] K Yada Can Mineral 17 (1979) 679
[206] J Olives M Amouric R Perbost Clays and Clay Minerals 48 (2000) 282
[207] JH Anh DR Peacor Am Mineral 72 (1987) 353
[208] A Plancon Clay Miner 36 (2001) 1
[209] M Kosmulski Journal of Colloid and Interface Science 337 (2009) 439