![MAPPING AND SURVEYING USING GNSS - Indico [Home]indico.ictp.it/event/a09138/session/41/contribution/25/material/0/... · AUSPOS(Geoscience Australia)-service provided by Geoscience](https://static.fdocuments.us/doc/165x107/5ad709767f8b9a865b8b9d32/mapping-and-surveying-using-gnss-indico-home-geoscience-australia-service-provided.jpg)
SURAT BASIN SOIL MONITORING REPORT - Shell Australia · GeoScience Australia AUSPOS GPS processing...
24
Surat North – Water Monitoring & Management Plan QGC Page 199 of 199 APPENDIX L: FYFE REPORT ON QCLNG PROJECT SOIL SUBSIDENCE MONITORING SURVEY
Transcript of SURAT BASIN SOIL MONITORING REPORT - Shell Australia · GeoScience Australia AUSPOS GPS processing...

Surat North – Water Monitoring & Management Plan
QGC
Page 199 of 199
APPENDIX L: FYFE REPORT ON QCLNG PROJECT SOIL SUBSIDENCE MONITORING SURVEY

QCLNG PROJECT
SOIL SUBSIDENCE MONITORING SURVEY
PREPARED BY Fyfe Pty Ltd
ABN 57 008 116 130
ADDRESS 84B Hypatia Street, Chinchilla Qld 4413
CONTACT Craig Scutchings, Survey Manager
TELEPHONE office 61 7 4672 6102
DATE 18/08/2014

©Fyfe Pty Ltd, 2014
Proprietary Information Statement
The information contained in this document produced by Fyfe Pty Ltd is solely for the use of the Client identified on the cover sheet for the purpose for which it has been prepared and Fyfe Pty Ltd undertakes no duty to or accepts any responsibility to any third party who may rely upon this document.
All rights reserved. No section or element of this document may be removed from this document, reproduced, electronically stored or transmitted in any form without the written permission of Fyfe Pty Ltd.
Document Information
Prepared by: MARK SINDERBERRY SITE SUPERVISOR, Fyfe Pty Ltd Date: 17 August, 2014
Approved by: CRAIG SCUTCHINGS SURVEY MANAGER, Fyfe Pty Ltd Date: 18 August, 2014
Revision History
Revision Revision Status Date Prepared Reviewed Approved
A 18/8/2014 MDS CAS

SOIL SUBSIDENCE MONITORING SURVEY
QCLNG PROJECT
18/08/2014 PAGE I
CONTENTS
Page
EXECUTIVE SUMMARY ii
1. SCOPE OF WORK 1
2. METHODOLOGY 2
2.1 Preparations 2
2.2 Field Work 3
2.3 Collate Data 4
3. RESULTS 5
3.1 Results Table 5
3.2 Result Analysis 6
4. CONCLUSION 7
APPENDICES
Appendix A MONITORING STATION AHD Charts Appendix B Ground Monitoring Maps – (October 2013 to May 2014) Appendix C Ground Monitoring Maps – (October 2013 to August 2014)

SOIL SUBSIDENCE MONITORING SURVEY
QCLNG PROJECT
18/08/2014 PAGE II
EXECUTIVE SUMMARY
Coal Seam Gas (CSG) mining, undertakes a process whereby it removes associated waters from beneath the
surface, reducing the pressures in the soil formations, which leads to the premise that there may be a degree
of subsidence at the surface.
The Queensland Gas Company (QGC) has a legal obligation to detect any subsidence, and has instigated an
ongoing Soil Subsidence Monitoring Plan, to measure this potential ground movement. Presented in the
following pages, is a report in relation to how this ground monitoring is being measured and results to date.
During the course of background research for this project it was found that a baseline study has already been
conducted over four years (from January 2007 to January 2011), utilising Synthetic Aperture Radar (InSAR), to
give a historic data account of the ground movement, but this data is not shown in and does not represent
any part of this report.

SOIL SUBSIDENCE MONITORING SURVEY
QCLNG PROJECT
18/08/2014 PAGE 1
1. SCOPE OF WORK
Fyfe have been tasked to conduct geodetic surveys on a quarterly basis in order to monitor key permanent
marks in the QGC area of operations, predominately in the Surat Basin. The observations are to be recorded
and presented in a suitable manner to show any trending in the rise or subsidence of the ground surface over
a period of time.

SOIL SUBSIDENCE MONITORING SURVEY
QCLNG PROJECT
18/08/2014 PAGE 2
2. METHODOLOGY
Approximately 30 previously coordinated permanent survey marks (PSMs) were supplied to Fyfe as a base to
utilise for observations. The selected marks were chosen to give a good geometry over the area of interest.
These marks were checked for stability, access and repeatability.
Prior to the first round of observations Fyfe suggested the installation of concrete monitoring pillars for use
as the stations for the project. The advantage of having well constructed, deep stable permanent marks like
pillars as the stations is the elimination of seasonal ground heave and swell, elimination of equipment setup
errors and the added ability to site each mark in the best possible location to satisfy the project needs. In the
end, the cost and time associated with the installation of pillars made them uneconomical and existing PSMs
were reverted to as originally planned.
2.1 Preparations
Prior to performing the field work a field reconnaissance was undertaken in order to verify the survey marks
to be used. All equipment was check and calibrated and software updated to suit. A network design was
carried out in order to utilise the resources in the best possible method, and a spreadsheet for results was
established.
2.1.1 Field Reconnaissance
The PSMs supplied to Fyfe for use in the subsidence survey were examined to ensure they were suitable as
high precision monitoring stations. A field reconnaissance was required to check that the marks were
suitable to use. The criterion for suitability was based upon the type of permanent mark and construction
(for stability), having a clear unobstructed line of sight to satellites (sky plot) and good access to the sites
whilst adhering to the QGC Land Access policy. If any of the marks did not adhere to this, alternative marks
were selected in the vicinity, in order to maintain good geometry.
2.1.2 Equipment Preparation
A full review of all equipment was undertaken which included the calibration of tribrachs, bubble centering
and checks for centering errors. A comparison of measuring tapes was completed for consistency of setup
measurements across all sets of equipment. All GPS units were updated with the latest software and survey
styles adjusted to acquire like readings. Units were also checked against a baseline (known survey marks) for
accuracy and performance for geodetic quality measurements.
2.1.3 Network Design and field procedure
A Global Navigation Satellite System (GNSS) network was designed to ensure sufficient static observations
were planned, that gave satisfactory redundancies, to facilitate a network adjustment to be made if required.
This network design exercise helped plan and prepare for the utilisation of resources, time, costs and data
reporting. It allowed for resources to be minimised and timeframes maximised in order to achieve the results

SOIL SUBSIDENCE MONITORING SURVEY
QCLNG PROJECT
18/08/2014 PAGE 3
as required by Survey Practise (SP1) standards. As a result of the network design, crew scheduling and
equipment utilisation was organised and a procedure developed to maintain consistency of measurements
and reporting of results. This design led to the expectation that 3 crews were to be utilised (unless more
became available), using 6 Dual frequency GNSS receivers on each day of observations. The observation
sessions were to be a minimum of 4 hrs each, with up to three sessions per day per crew.
2.1.4 Office Calculations
Observations were recorded in a raw format and then converted to RINEX, to be reduced through the online
GeoScience Australia AUSPOS GPS processing service. This enables a consistent approach to the reduction of
observations and ensures that results would be calculated from precise monitoring stations which were
independent to the area of interest, continually monitored and maintained by the Geosciences Australia
governing body. The results obtained for horizontal, vertical and Positional Uncertainty (PU) measurements
would be recorded against each survey mark for each independent observation. Both the ellipsoidal height
and orthometric height would also be recorded in order to ensure that geoid‐spheroid separation values (N)
would not distort the results. A spreadsheet showing the Easting, Northing, Elevation, PU values and the
deltas, corresponding to these measurements, has been created and will be updated on a quarterly basis
following each monitoring session.
Individual data sets processed through AUSPOS increase with accuracy over time and therefore will have an
initial calculation using the Ultra Rapid or Rapid method using a predicted ephemeris, and then reprocessed
against the precise ephemeris to achieve the best result. It is envisaged that the results using the above
techniques would have a PU of 10‐15 mm in Easting and Northern, and 15‐30 mm in Elevation.
2.2 Field Work
A field procedure was written to standardise the equipment setup, observation methodology and recording
rate. A Static GPS Observation sheet was also created to record field equipment measurements and other
significant details i.e. crew names, dates, equipment, antennas and file names.
The field work utilised one crew in each of the Northern, Central and Southern areas. They observed up to 4
stations per day for 3 consecutive days. Each session was observed for a minimum of 4 hrs on a standard 30
second epoch rate.
To date there have been three surveys conducted in the field, these being October 2013, May 2014 and
August 2014. The frequency of these surveys is scheduled quarterly, however the January 2014 survey was
not completed due to a delay in the approval to proceed. The next survey is due to be completed in
November 2014.

SOIL SUBSIDENCE MONITORING SURVEY
QCLNG PROJECT
18/08/2014 PAGE 4
2.3 Collate Data
Once the data was captured, it was transferred to the office for processing where field observation sheets
were checked against the files, the files were converted to RINEX format, then individually submitted online
using the AUSPOS facility. Resultant reports have been filed and entered into an excel spread sheet. This
spreadsheet has been established to contain all relevant data, and incorporates multiple checks to ensure
that data entry errors were highlighted and removed.
The spreadsheet records the coordinated results from each station, PU values and compares them to past
results in order to determine if there have been any changes. The differential changes in elevation have been
tabulated to allow for the creation of monitoring station charts (Appendix A), which show the vertical
movement at each point. These will be updated as more observations are surveyed and give a better
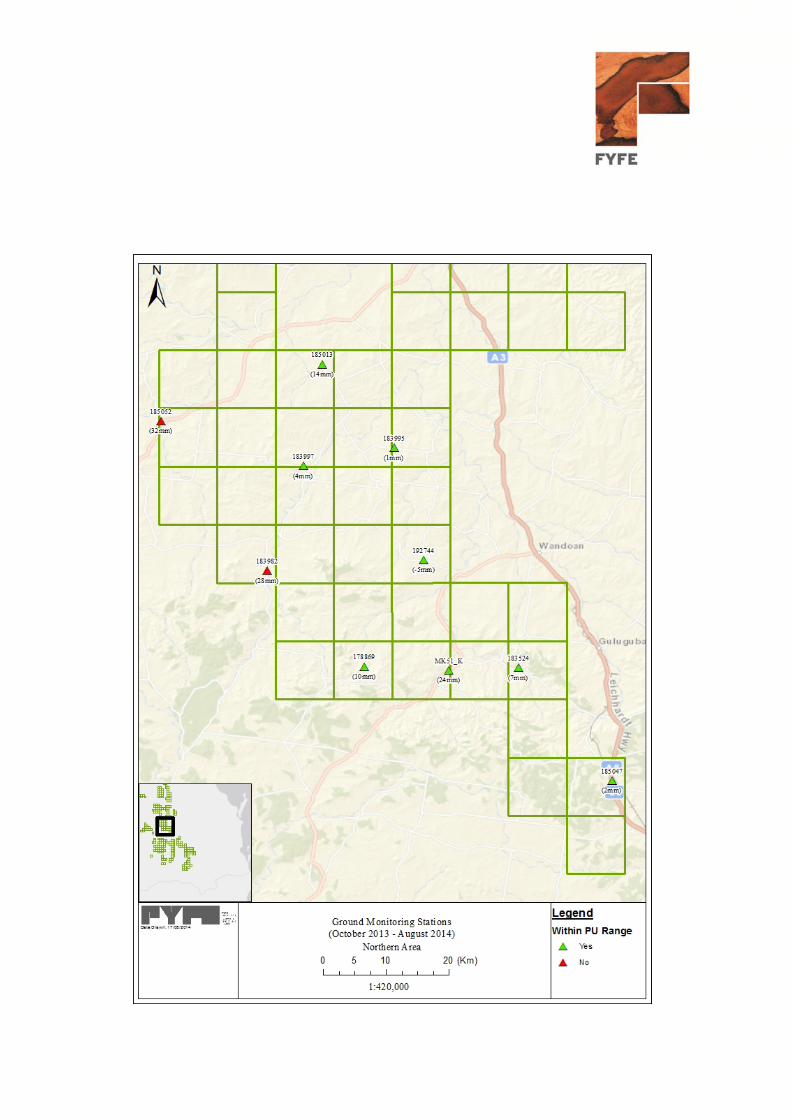
representation of what is occurring over time. There are also 3 maps (Northern, Central and Southern Areas)
showing the locations of each station and their corresponding elevation change from the initial October
observations. Each set of maps defines the elevation change, and is displayed in Green if the change is
contained within the PU value and Red if the change is outside the PU value, for the latest monitoring
observation. These can be found in Appendix B & C.
SOIL SUBSIDENCE MONITORING SURVEY
QCLNG PROJECT
18/08/2014 PAGE 5
3. RESULTS
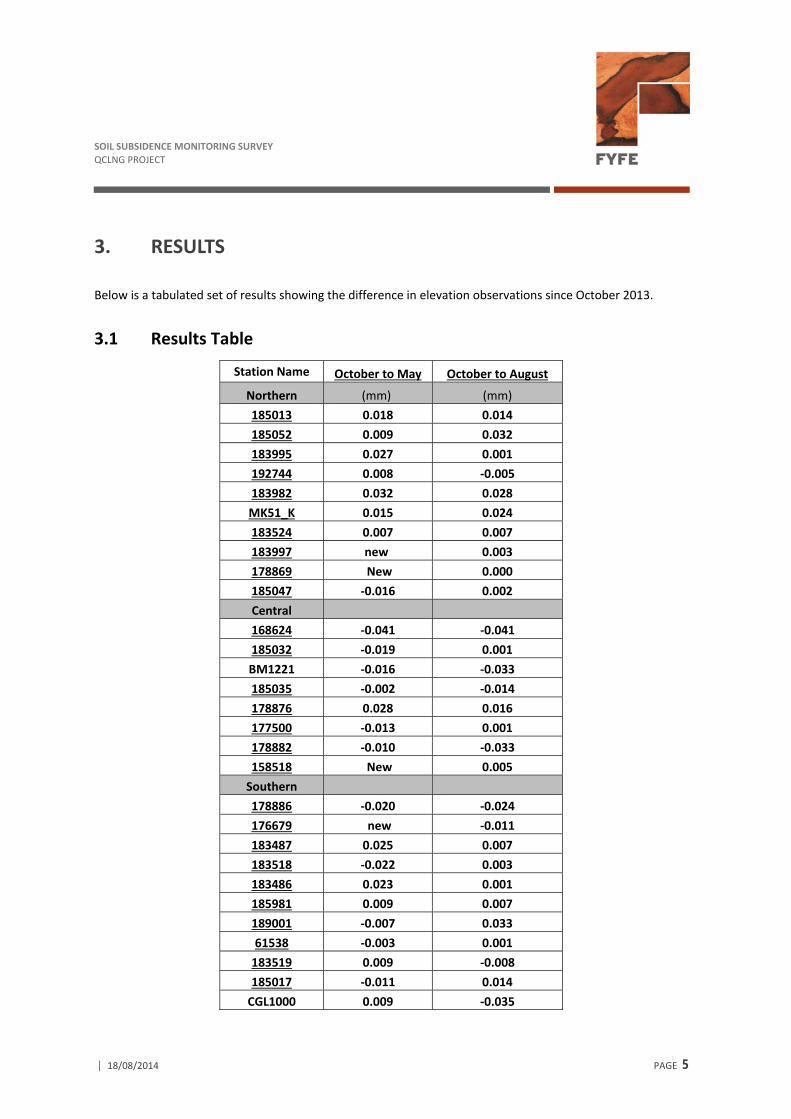
Below is a tabulated set of results showing the difference in elevation observations since October 2013.
3.1 Results Table
Station Name October to May October to August
Northern (mm) (mm)
185013 0.018 0.014
185052 0.009 0.032
183995 0.027 0.001
192744 0.008 ‐0.005
183982 0.032 0.028
MK51_K 0.015 0.024
183524 0.007 0.007
183997 new 0.003
178869 New 0.000
185047 ‐0.016 0.002
Central
168624 ‐0.041 ‐0.041
185032 ‐0.019 0.001
BM1221 ‐0.016 ‐0.033
185035 ‐0.002 ‐0.014
178876 0.028 0.016
177500 ‐0.013 0.001
178882 ‐0.010 ‐0.033
158518 New 0.005
Southern
178886 ‐0.020 ‐0.024
176679 new ‐0.011
183487 0.025 0.007
183518 ‐0.022 0.003
183486 0.023 0.001
185981 0.009 0.007
189001 ‐0.007 0.033
61538 ‐0.003 0.001
183519 0.009 ‐0.008
185017 ‐0.011 0.014
CGL1000 0.009 ‐0.035
SOIL SUBSIDENCE MONITORING SURVEY
QCLNG PROJECT
18/08/2014 PAGE 6
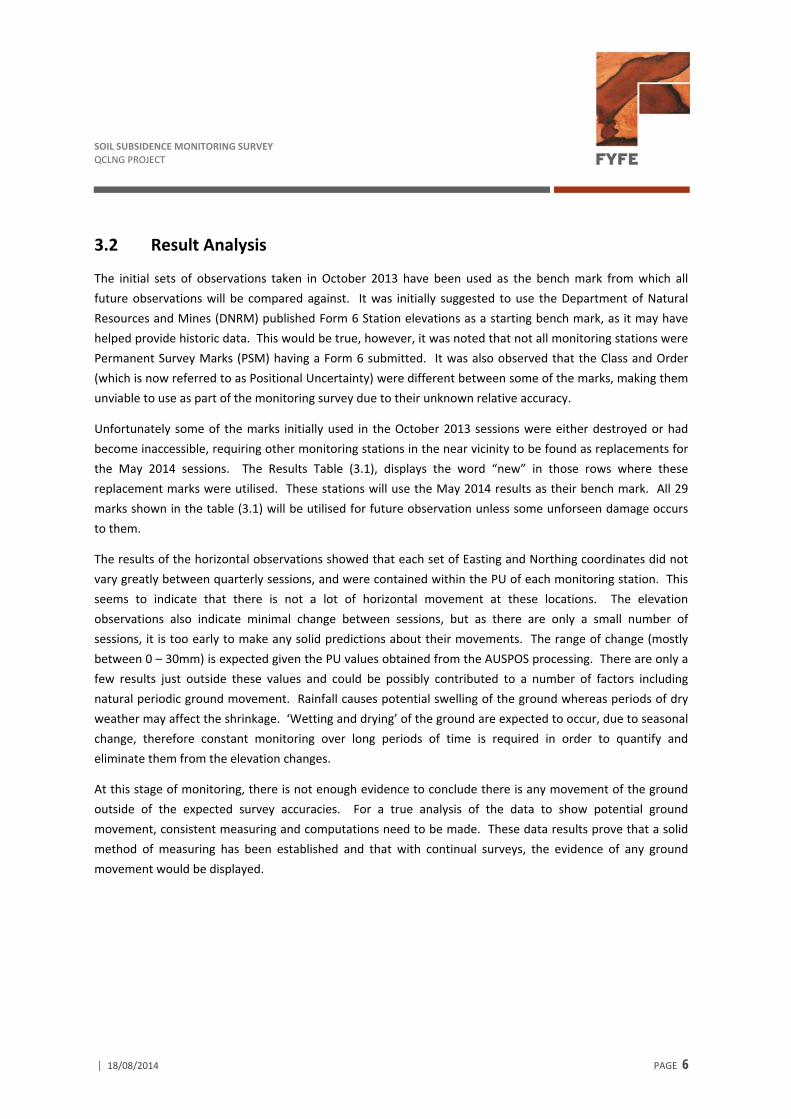
3.2 Result Analysis
The initial sets of observations taken in October 2013 have been used as the bench mark from which all
future observations will be compared against. It was initially suggested to use the Department of Natural
Resources and Mines (DNRM) published Form 6 Station elevations as a starting bench mark, as it may have
helped provide historic data. This would be true, however, it was noted that not all monitoring stations were
Permanent Survey Marks (PSM) having a Form 6 submitted. It was also observed that the Class and Order
(which is now referred to as Positional Uncertainty) were different between some of the marks, making them
unviable to use as part of the monitoring survey due to their unknown relative accuracy.
Unfortunately some of the marks initially used in the October 2013 sessions were either destroyed or had
become inaccessible, requiring other monitoring stations in the near vicinity to be found as replacements for
the May 2014 sessions. The Results Table (3.1), displays the word “new” in those rows where these
replacement marks were utilised. These stations will use the May 2014 results as their bench mark. All 29
marks shown in the table (3.1) will be utilised for future observation unless some unforseen damage occurs
to them.
The results of the horizontal observations showed that each set of Easting and Northing coordinates did not
vary greatly between quarterly sessions, and were contained within the PU of each monitoring station. This
seems to indicate that there is not a lot of horizontal movement at these locations. The elevation
observations also indicate minimal change between sessions, but as there are only a small number of
sessions, it is too early to make any solid predictions about their movements. The range of change (mostly
between 0 – 30mm) is expected given the PU values obtained from the AUSPOS processing. There are only a
few results just outside these values and could be possibly contributed to a number of factors including
natural periodic ground movement. Rainfall causes potential swelling of the ground whereas periods of dry
weather may affect the shrinkage. ‘Wetting and drying’ of the ground are expected to occur, due to seasonal
change, therefore constant monitoring over long periods of time is required in order to quantify and
eliminate them from the elevation changes.
At this stage of monitoring, there is not enough evidence to conclude there is any movement of the ground
outside of the expected survey accuracies. For a true analysis of the data to show potential ground
movement, consistent measuring and computations need to be made. These data results prove that a solid
method of measuring has been established and that with continual surveys, the evidence of any ground
movement would be displayed.

SOIL SUBSIDENCE MONITORING SURVEY
QCLNG PROJECT
18/08/2014 PAGE 7
4. CONCLUSION
The ground monitoring of specific locations within the QGC tenement area has been conducted in order to
satisfy the federal conditions for potential subsidence due to the mining of coal seam gas. A consistent
process of survey observations has been adopted and the computational results recorded have proven that a
solid procedure has been established. The results of the surveys conducted to date on 29 ground monitoring
stations, within the QGC tenement, have given consistent results and do not highlight any trend in the
movement of the ground during the period October 2013 through to August 2014.
The surveys would need to continue in order to provide enough data for analysis in order to eliminate
seasonal effects, and to provide evidence of potential subsurface movement.

APPENDIX A MONITORING STATION AHD CHARTS

Northern Area – Monitoring Station AHD Charts
WORK IN PROGRESS
WORK IN PROGRESS
265.494265.512 265.508
265.400
265.500
265.600
Oct 2013
Nov 2013
Dec 2013
Jan 2014
Feb 2014
Mar 2014
Apr 2014
May 2014
Jun 2014
Jul 2014
Aug 2014
PSM 185013 AHD
234.559 234.568
234.591
234.500
234.600
Oct 2013
Nov 2013
Dec 2013
Jan 2014
Feb 2014
Mar 2014
Apr 2014
May 2014
Jun 2014
Jul 2014
Aug 2014
PSM 185052 AHD
269.495
269.522269.496
269.400
269.500
269.600
Oct 2013
Nov 2013
Dec 2013
Jan 2014
Feb 2014
Mar 2014
Apr 2014
May 2014
Jun 2014
Jul 2014
Aug 2014
PSM 183995 AHD
272.015272.023
272.010
272.000
272.100
Oct 2013
Nov 2013
Dec 2013
Jan 2014
Feb 2014
Mar 2014
Apr 2014
May 2014
Jun 2014
Jul 2014
Aug 2014
PSM 192744 AHD
262.517
262.549 262.545
262.500
262.600
Oct 2013
Nov 2013
Dec 2013
Jan 2014
Feb 2014
Mar 2014
Apr 2014
May 2014
Jun 2014
Jul 2014
Aug 2014
PSM 183982 AHD
287.764 287.779287.788
287.700
287.800
Oct 2013
Nov 2013
Dec 2013
Jan 2014
Feb 2014
Mar 2014
Apr 2014
May 2014
Jun 2014
Jul 2014
Aug 2014
MK51_K AHD
310.927310.934 310.934
310.900
311.000
Oct 2013
Nov 2013
Dec 2013
Jan 2014
Feb 2014
Mar 2014
Apr 2014
May 2014
Jun 2014
Jul 2014
Aug 2014
PSM 183524 AHD269.192 269.195
269.100
269.200
Oct 2013
Nov 2013
Dec 2013
Jan 2014
Feb 2014
Mar 2014
Apr 2014
May 2014
Jun 2014
Jul 2014
Aug 2014
PSM 183997 AHD
389.736 389.736389.700
389.800
Oct 2013
Nov 2013
Dec 2013
Jan 2014
Feb 2014
Mar 2014
Apr 2014
May 2014
Jun 2014
Jul 2014
Aug 2014
PSM 178869 AHD
372.905 372.889372.907
372.800
372.900
373.000
Oct 2013
Nov 2013
Dec 2013
Jan 2014
Feb 2014
Mar 2014
Apr 2014
May 2014
Jun 2014
Jul 2014
Aug 2014
PSM 185047 AHD

Central Area – Monitoring Station AHD Charts
335.077
335.036 335.036
335.000
335.100
Oct 2013
Nov 2013
Dec 2013
Jan 2014
Feb 2014
Mar 2014
Apr 2014
May 2014
Jun 2014
Jul 2014
Aug 2014
PSM 168624 AHD
319.962319.943
319.963
319.900
Oct 2013
Nov 2013
Dec 2013
Jan 2014
Feb 2014
Mar 2014
Apr 2014
May 2014
Jun 2014
Jul 2014
Aug 2014
PSM 185032 AHD
306.765 306.749306.732
306.700
306.800
Oct 2013
Nov 2013
Dec 2013
Jan 2014
Feb 2014
Mar 2014
Apr 2014
May 2014
Jun 2014
Jul 2014
Aug 2014
BM 1221 AHD
324.840 324.838324.826
324.800
324.900
Oct 2013
Nov 2013
Dec 2013
Jan 2014
Feb 2014
Mar 2014
Apr 2014
May 2014
Jun 2014
Jul 2014
Aug 2014
PSM 185035 AHD
309.757
309.785309.773
309.700
Oct 2013
Nov 2013
Dec 2013
Jan 2014
Feb 2014
Mar 2014
Apr 2014
May 2014
Jun 2014
Jul 2014
Aug 2014
PSM 178876 AHD
326.336 326.323326.337
326.300
326.400
Oct 2013
Nov 2013
Dec 2013
Jan 2014
Feb 2014
Mar 2014
Apr 2014
May 2014
Jun 2014
Jul 2014
Aug 2014
PSM 177500 AHD
317.212 317.202317.179
317.100
317.200
317.300
Oct 2013
Nov 2013
Dec 2013
Jan 2014
Feb 2014
Mar 2014
Apr 2014
May 2014
Jun 2014
Jul 2014
Aug 2014
PSM 178882 AHD
325.405 325.410
325.400
325.500
Oct 2013
Nov 2013
Dec 2013
Jan 2014
Feb 2014
Mar 2014
Apr 2014
May 2014
Jun 2014
Jul 2014
Aug 2014
PSM 158518 AHD

Southern Area – Monitoring Station AHD Charts
342.728 342.708 342.704
342.600
342.700
342.800
Oct 2013
Nov 2013
Dec 2013
Jan 2014
Feb 2014
Mar 2014
Apr 2014
May 2014
Jun 2014
Jul 2014
Aug 2014
PSM 178886 AHD
350.016 350.005
349.900
350.000
350.100
Oct 2013
Nov 2013
Dec 2013
Jan 2014
Feb 2014
Mar 2014
Apr 2014
May 2014
Jun 2014
Jul 2014
Aug 2014
PSM 176679 AHD
378.440
378.465378.447
378.400
Oct 2013
Nov 2013
Dec 2013
Jan 2014
Feb 2014
Mar 2014
Apr 2014
May 2014
Jun 2014
Jul 2014
Aug 2014
PSM 183487 AHD
363.296 363.274363.299
363.200
363.300
363.400
Oct 2013
Nov 2013
Dec 2013
Jan 2014
Feb 2014
Mar 2014
Apr 2014
May 2014
Jun 2014
Jul 2014
Aug 2014
PSM 183518 AHD
371.336
371.359371.337
371.300
371.400
Oct 2013
Nov 2013
Dec 2013
Jan 2014
Feb 2014
Mar 2014
Apr 2014
May 2014
Jun 2014
Jul 2014
Aug 2014
PSM 183486 AHD
334.653334.662 334.660
334.600
334.700
Oct 2013
Nov 2013
Dec 2013
Jan 2014
Feb 2014
Mar 2014
Apr 2014
May 2014
Jun 2014
Jul 2014
Aug 2014
PSM 185981 AHD
345.343 345.336
345.376
345.300
345.400
Oct 2013
Nov 2013
Dec 2013
Jan 2014
Feb 2014
Mar 2014
Apr 2014
May 2014
Jun 2014
Jul 2014
Aug 2014
PSM 189001 AHD
345.543 345.540 345.544
345.500
345.600
Oct 2013
Nov 2013
Dec 2013
Jan 2014
Feb 2014
Mar 2014
Apr 2014
May 2014
Jun 2014
Jul 2014
Aug 2014
PSM 61538 AHD
329.271 329.280329.263
329.200
329.300
Oct 2013
Nov 2013
Dec 2013
Jan 2014
Feb 2014
Mar 2014
Apr 2014
May 2014
Jun 2014
Jul 2014
Aug 2014
PSM 183519 AHD
394.718 394.707394.732
394.600
394.700
394.800
Oct 2013
Nov 2013
Dec 2013
Jan 2014
Feb 2014
Mar 2014
Apr 2014
May 2014
Jun 2014
Jul 2014
Aug 2014
PSM 185017 AHD
394.841394.850
394.806
394.700
394.800
394.900
Oct 2013
Nov 2013
Dec 2013
Jan 2014
Feb 2014
Mar 2014
Apr 2014
May 2014
Jun 2014
Jul 2014
Aug 2014
CGL1000 AHD

APPENDIX B GROUND MONITORING MAPS – (OCTOBER 2013 TO MAY 2014)


014


APPENDIX C GROUND MONITORING MAPS – (OCTOBER 2013 TO AUGUST 2014)