Supply Chain Centers of Excellence Study - Summary Charts - 2014 - 2015
Upload
mariah-warnerCategory
view
213download
0
Supply Chain Maturity Study
Summary ChartsJune-July 2015
Supply Chain Insights LLC Copyright © 2015, p. 2
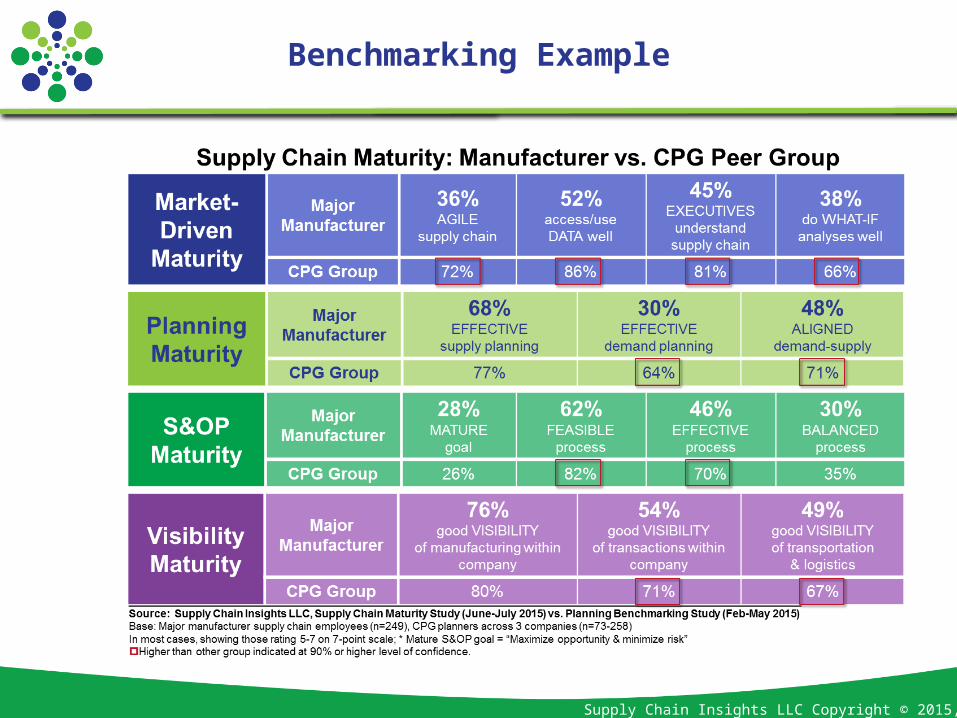
Benchmarking Example
Supply Chain Insights LLC Copyright © 2015, p. 3
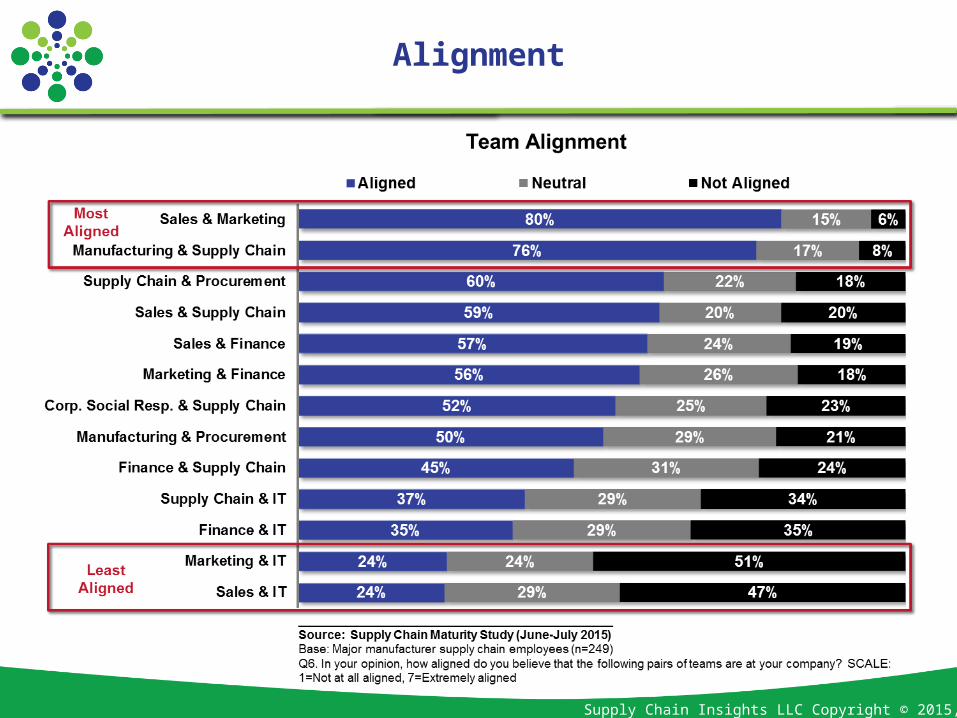
Alignment

Supply Chain Insights LLC Copyright © 2015, p. 4
Alignment Comparison
Supply Chain Insights LLC Copyright © 2015, p. 5
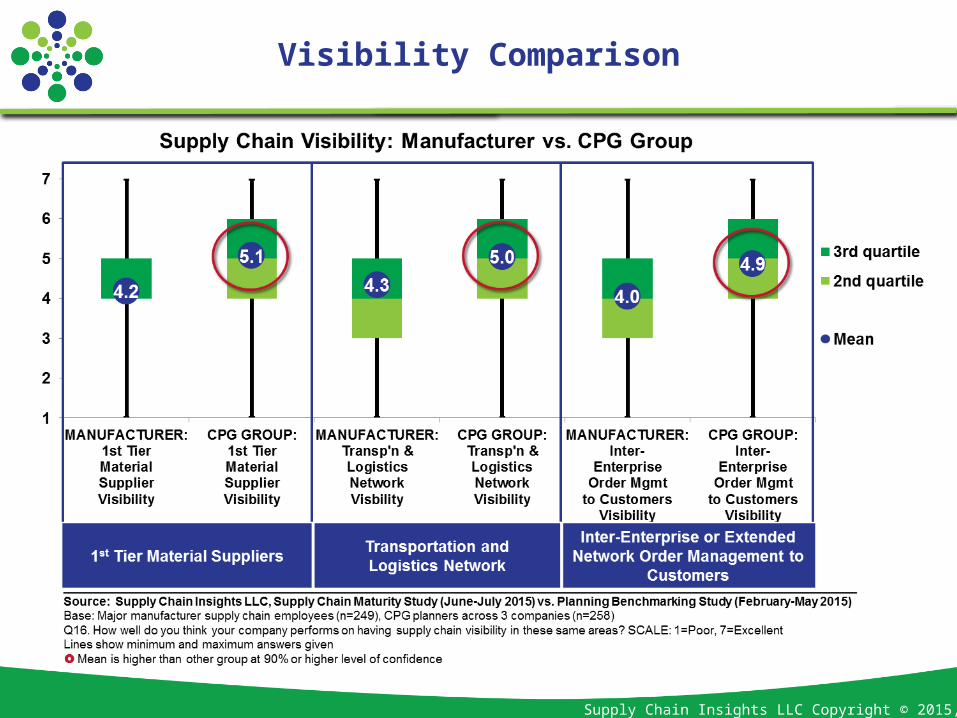
Visibility Comparison

Supply Chain Insights LLC Copyright © 2015, p. 6
S&OP Effectiveness:By Company/Division

Supply Chain Insights LLC Copyright © 2015, p. 7
Characteristics of Effective S&OP
Supply Chain Insights LLC Copyright © 2015, p. 8
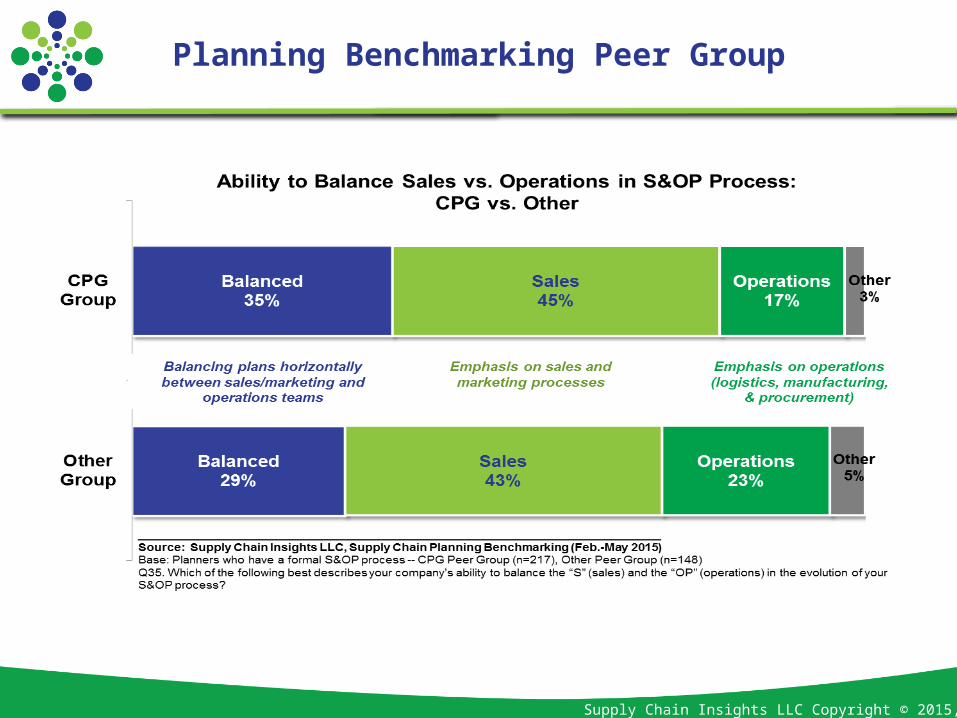
Planning Benchmarking Peer Group

Supply Chain Insights LLC Copyright © 2015, p. 9
Sales and Supply Chain Alignment:By Company/Division

Supply Chain Insights LLC Copyright © 2015, p. 10
Demand/Supply Alignment:By Company/Division