
Supplementary Information synthes ectrum of c rbon spher tween both sized at 900 arbon sphe es...
22
Supplementary Information CVD Synthesis of Carbon Spheres using NiFe-LDHs as Catalytic Precursors. Structural, electrochemical and magnetoresistive properties. Jose A. Carrasco, a Helena Prima-Garcia, a Jorge Romero, a Jesús Hernández-Saz, b Sergio I. Molina, b Gonzalo Abellán, a,c, * and Eugenio Coronado a, * a Instituto de Ciencia Molecular (ICMol), Universidad de Valencia, Catedrático José Beltrán 2, 46980, Paterna, Valencia, Spain. b Departamento de Ciencia de los Materiales e Ingeniería Metalúrgica y Química Inorgánica, IMEYMAT, Universidad de Cádiz, 11510 Puerto Real, Cádiz, Spain. c Department of Chemistry and Pharmacy and Institute of Advanced Materials and Processes (ZMP), University Erlangen-Nürnberg, Henkestr. 42, 91054 Erlangen and Dr.-Mack Str. 81, 90762 Fürth, Germany. Electronic Supplementary Material (ESI) for Journal of Materials Chemistry C. This journal is © The Royal Society of Chemistry 2015
Transcript of Supplementary Information synthes ectrum of c rbon spher tween both sized at 900 arbon sphe es...

Supplementary Information
CVD Synthesis of Carbon Spheres using NiFe-LDHs as Catalytic Precursors.
Structural, electrochemical and magnetoresistive properties.
Jose A. Carrasco,a Helena Prima-Garcia,a Jorge Romero,a Jesús Hernández-Saz,b Sergio
I. Molina,b Gonzalo Abellán,a,c,* and Eugenio Coronadoa,*
a Instituto de Ciencia Molecular (ICMol), Universidad de Valencia, Catedrático José
Beltrán 2, 46980, Paterna, Valencia, Spain.
b Departamento de Ciencia de los Materiales e Ingeniería Metalúrgica y Química
Inorgánica, IMEYMAT, Universidad de Cádiz, 11510 Puerto Real, Cádiz, Spain.
c Department of Chemistry and Pharmacy and Institute of Advanced Materials and
Processes (ZMP), University Erlangen-Nürnberg, Henkestr. 42, 91054 Erlangen and
Dr.-Mack Str. 81, 90762 Fürth, Germany.
Electronic Supplementary Material (ESI) for Journal of Materials Chemistry C.This journal is © The Royal Society of Chemistry 2015
Contents
SI 1. Characterization of carbon spheres before the annealing process.
SI 1.1. FESEM and HRTEM microscopy.
SI 1.2. XRPD.
SI 1.3. Thermogravimetric analysis (TGA) in air and N2.
SI 2. Characterization of control experiments.
SI 2.1. Calcination of NiFe-LDH
SI 2.2. Carbon Spheres
SI 2.2.1. FESEM microscopy.
SI 2.2.2. XRPD.
SI 2.2.3. Thermogravimetric analysis (TGA) in air and N2.
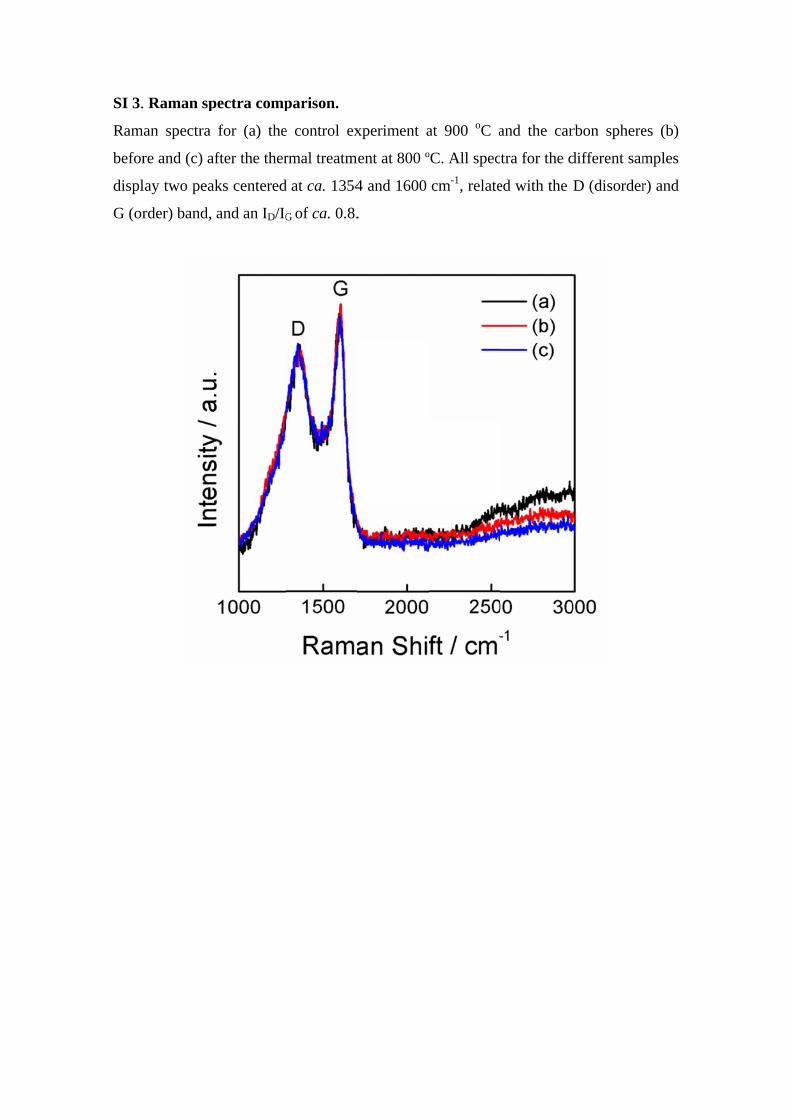
SI 3. Raman spectra comparison.
SI 4. DTA analysis of CS in air.
SI 5. Additional FESEM images of CS and their accretion effects.
SI 6. XPS of carbon spheres.
SI 6.1. XPS of carbon spheres synthesized at 900 oC and 1000 oC.
SI 6.1. XPS spectra of Fe 2p and Ni 2p core-levels in CS (900 oC).
SI 7. FIB-SEM sequential steps of the lift-out procedure.
SI 8. Differential pore volume distribution by DFT of CS.
SI 9. Electrochemical properties of carbon spheres synthesized at 1000 oC.
SI 10. Fit of the MR.
SI 11. Magnetic temperature dependence of CS.
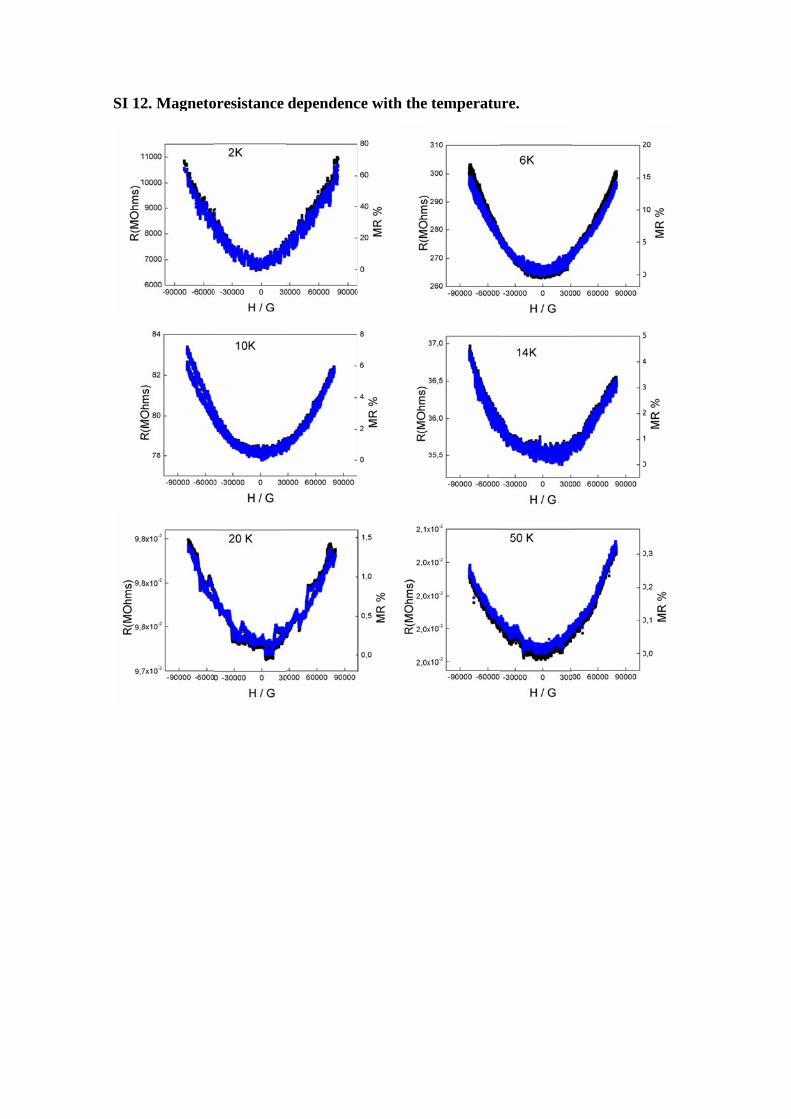
SI 12. Magnetoresistance dependence with the temperature.
SI 13. Additional References.

SI 1.
SI 1.
(A)
spher
Histo
. Character
.1. FESEM
Selected F
res. (B) HR
ogram of 50
rization of
M and HRTE
FESEM ima
RTEM show
0 spheres di
carbon sph
EM micros
age of the
wing the ch
splaying the
heres befor
scopy.
original (b
hain-like di
e average d
re the annea
before the
sposition d
diameter tak
aling proce
thermal tre
ue to accre
en from FE
ess.
eatment) ca
etion effects
ESEM image
arbon
s. (C)
es.

SI 1.2. XRPD.

SI 1.3. Thermogravimetric analysis (TGA) in air and N2.
In air atmosphere, the combustion temperature of ca. 595 oC, as obtained from the
DTA, is in good agreement within the range of carbon nano-spheres based on the
classification of Serp et al. according to the maximum of gasification rate.1
SI 2. Characterization of control experiments.
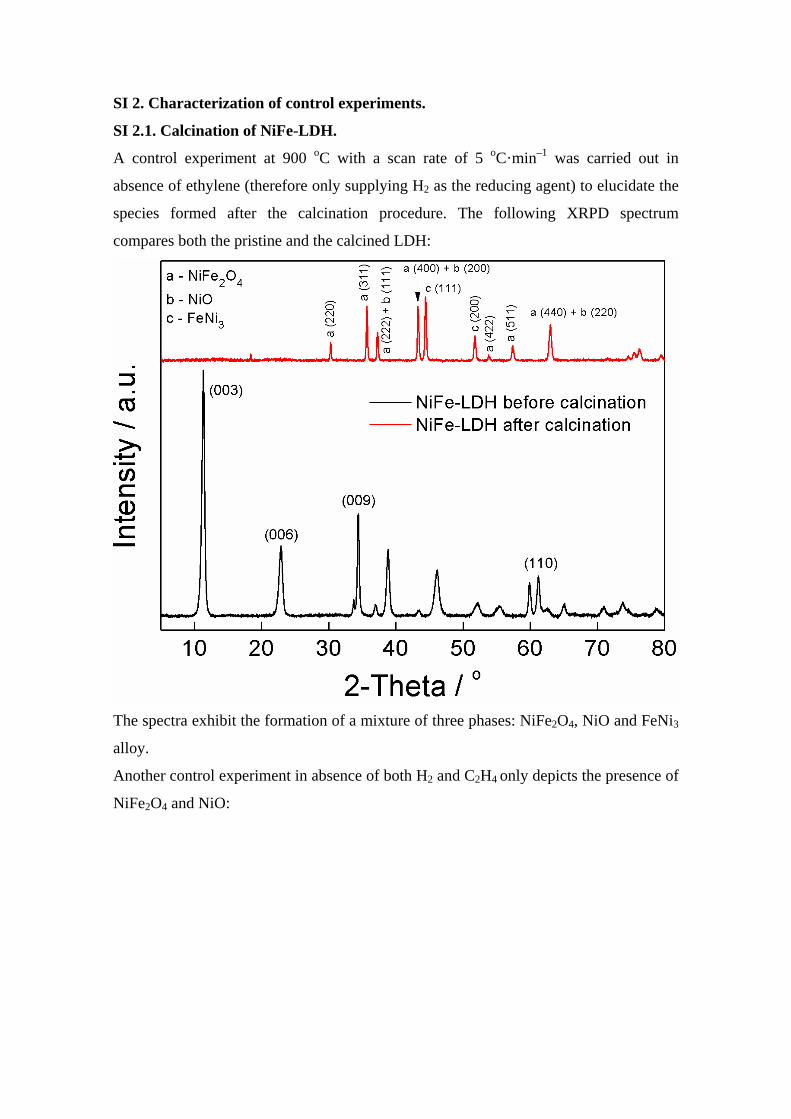
SI 2.1. Calcination of NiFe-LDH.
A control experiment at 900 oC with a scan rate of 5 oC·min–1 was carried out in
absence of ethylene (therefore only supplying H2 as the reducing agent) to elucidate the
species formed after the calcination procedure. The following XRPD spectrum
compares both the pristine and the calcined LDH:
The spectra exhibit the formation of a mixture of three phases: NiFe2O4, NiO and FeNi3
alloy.
Another control experiment in absence of both H2 and C2H4 only depicts the presence of
NiFe2O4 and NiO:
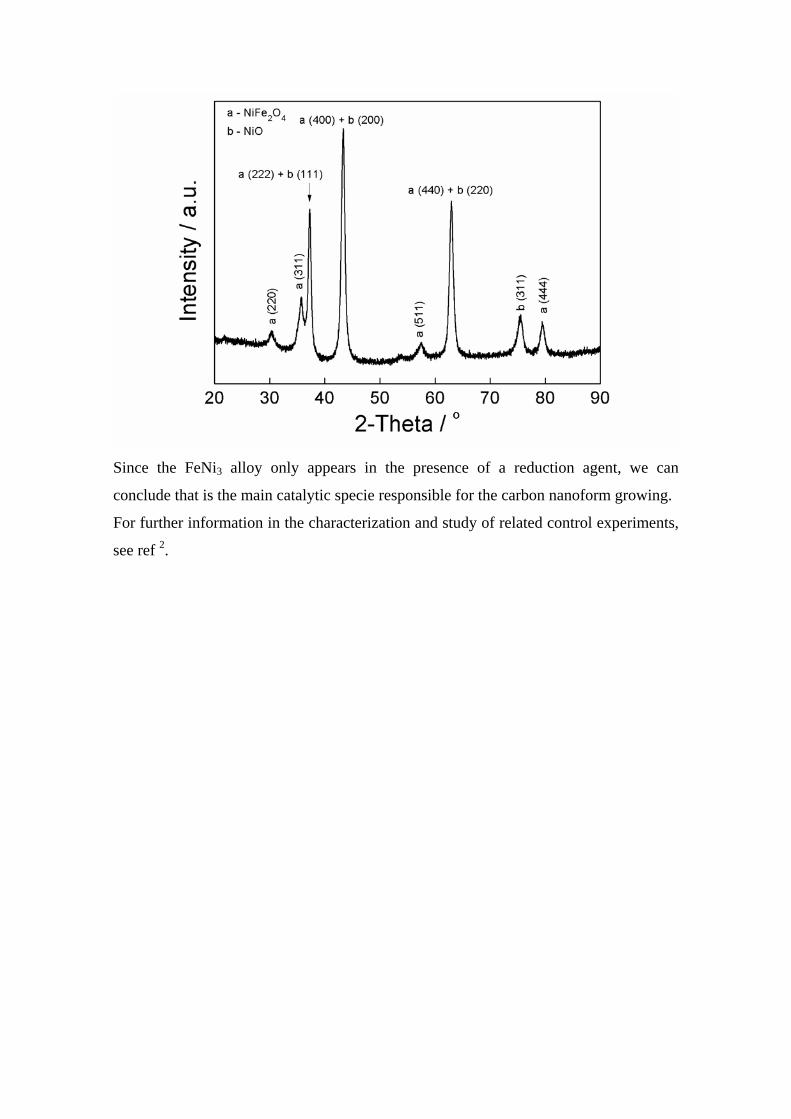
Since the FeNi3 alloy only appears in the presence of a reduction agent, we can
conclude that is the main catalytic specie responsible for the carbon nanoform growing.
For further information in the characterization and study of related control experiments,
see ref 2.

SI 2.
SI 2.
Both
from
The
morp
.2. Carbon
.2.1. FESEM
h images de
m ca. 700 –
latter ones
phology.
Spheres
M microsco
epict the fo
800 nm for
s are form
opy.
rmation of
the smalles
med by acc
f carbon sph
st ones to s
cumulation
heres with
everal micr
effects, di
a wide rang
rons for the
isplaying a
nge of diam
biggest sph
a caterpilla
meters,
heres.
ar-like
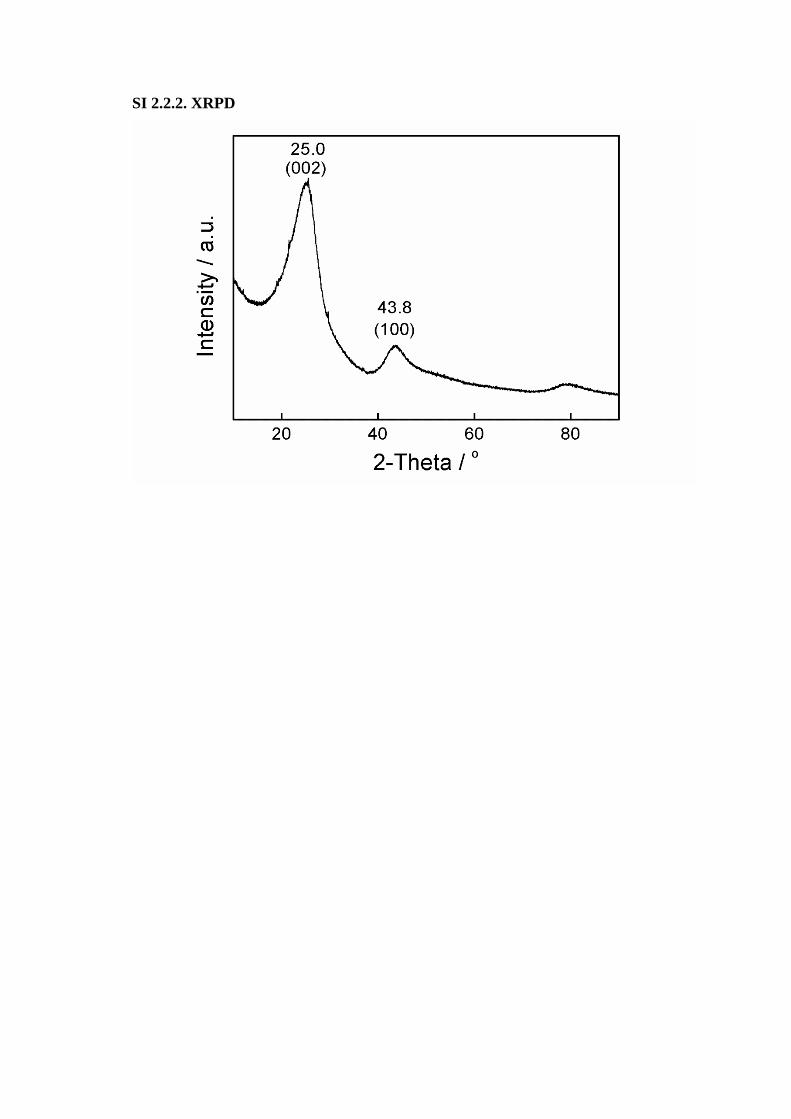
SI 2.2.2. XRPD

SI 2.2.3. Thermogravimetric analysis (TGA) in air and N2.
The combustion temperature of ca. 600 oC in air atmosphere (obtained from the DTA),
is in good agreement within the range of carbon nano-spheres according to the
classification of Serp et al. on the basis of the maximum of gasification rate.1
SI 3.
Ram
befor
displ
G (or
. Raman sp
man spectra
re and (c) a
lay two peak
rder) band,
pectra comp
for (a) the
fter the ther
ks centered
and an ID/IG
parison.
e control ex
rmal treatm
d at ca. 1354
G of ca. 0.8.
xperiment a
ment at 800 º
4 and 1600
.
at 900 oC a
ºC. All spec
cm-1, relate
and the car
tra for the d
ed with the
rbon sphere
different sam
D (disorder
es (b)
mples
r) and

SI 4. DTA analysis of CS in air.
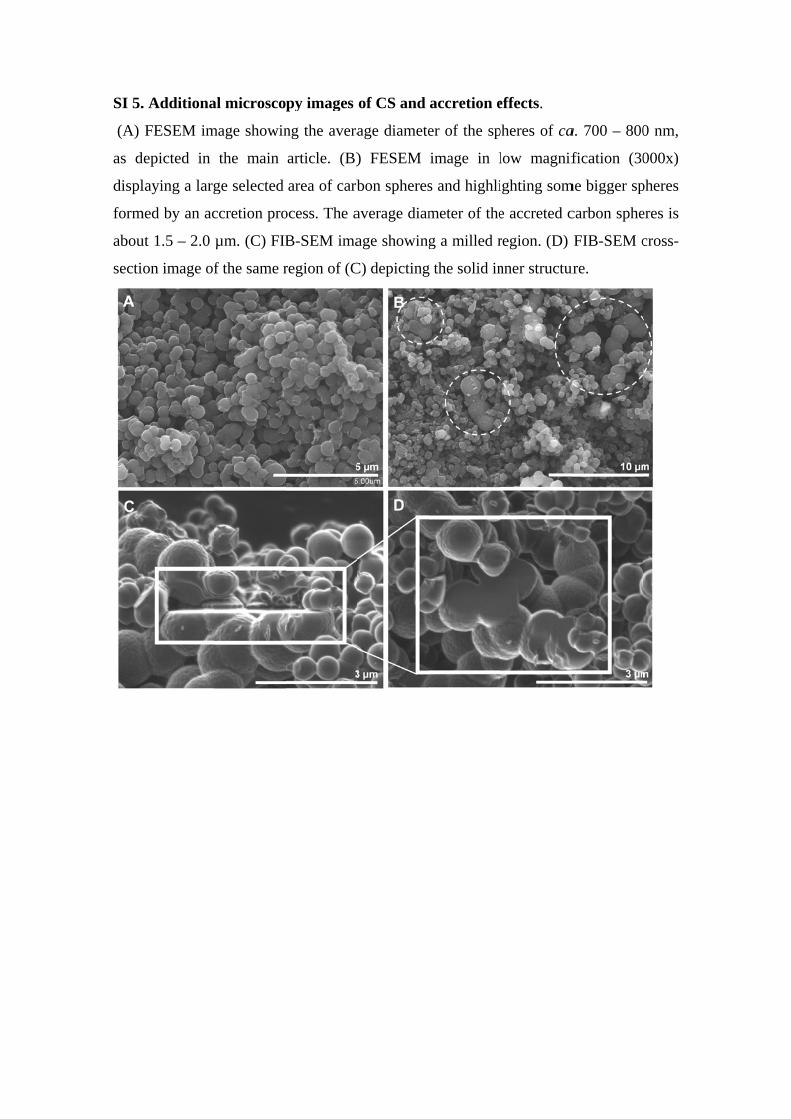
SI 5.
(A)
as d
displ
form
abou
sectio
. Additiona
FESEM im
depicted in
laying a larg
med by an ac
ut 1.5 – 2.0
on image of
al microsco
mage showin
the main
ge selected
ccretion pro
µm. (C) FIB
f the same r
py images
ng the avera
article. (B)
area of carb
ocess. The a
B-SEM ima
region of (C
of CS and
age diamete
) FESEM
bon spheres
average diam
age showing
C) depicting
accretion e
er of the sp
image in l
s and highli
meter of the
g a milled r
g the solid in
effects.
pheres of ca
low magnif
ighting som
e accreted c
region. (D)
nner structur
a. 700 – 800
fication (30
me bigger sp
carbon sphe
FIB-SEM c
ure.
0 nm,
000x)
pheres
eres is
cross-
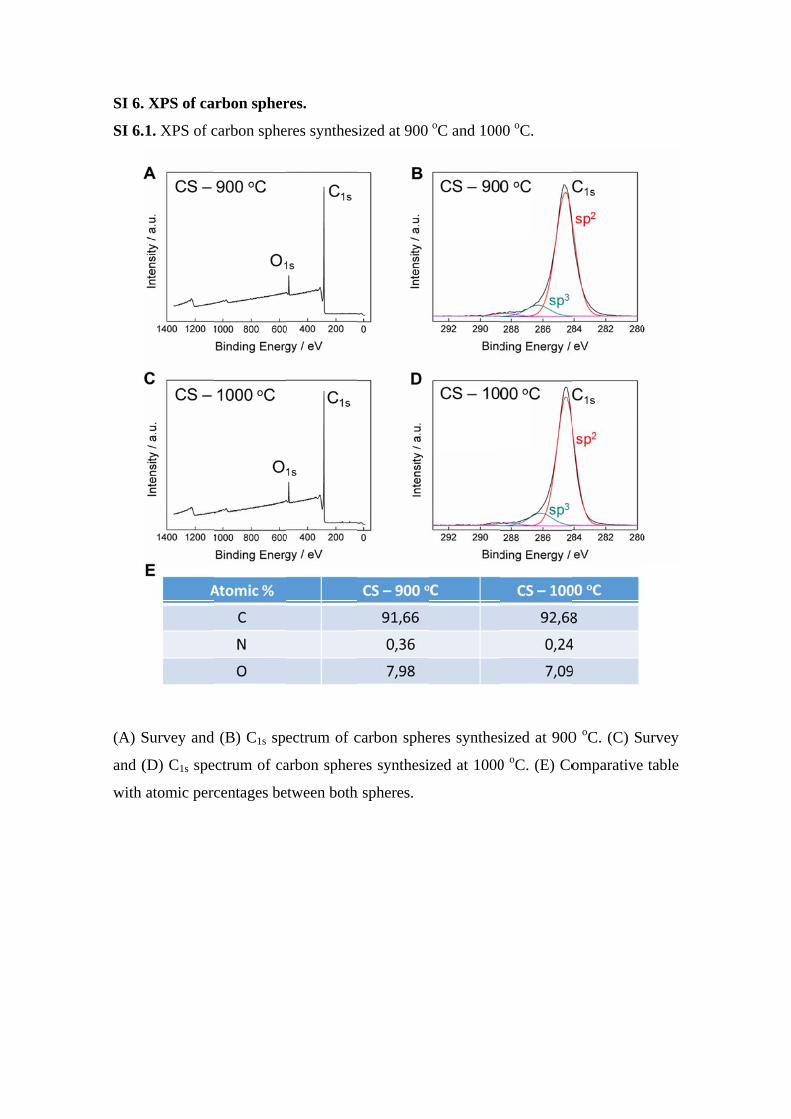
SI 6.
SI 6.
(A) S
and (
with
. XPS of ca
.1. XPS of c
Survey and
(D) C1s spe
atomic perc
arbon spher
carbon sphe
(B) C1s sp
ectrum of ca
centages be
res.
eres synthes
ectrum of c
arbon spher
etween both
sized at 900
carbon sphe
res synthesi
h spheres.
oC and 100
eres synthes
zed at 1000
00 oC.
sized at 900
0 oC. (E) Co
0 oC. (C) Su
omparative
urvey
table

SI 6.2. XPS spectra of the Fe 2p and Ni 2p core-levels in CS (900 oC).

SI 7. FIB-SEM sequential steps of the lift-out procedure.
(A) select a localization, (B) deposit a platinum layer, (C) mill trenches (tilted view),
(D) lamella attached to the micromanipulator, (E) lamella attached to the TEM grid and
the micromanipulator and (F) lamella thinned down to electron-transparency. From (A)
to (E) are FIB images and (F) is a SEM image.

SI 8. Differential pore volume distribution by DFT of CS.
DFT method summary
Pore volume = 0.009 cc·g-1
Surface area = 14.684 m²·g-1
Lower confidence limit = 10.960 Å
Fitting error = 0.410 %
Pore width (Mode) = 10.960 Å
The model which has been used is “QSDFT-N2-carbon adsorption branch at 77 K based
on a slit/cylinder pores” obtained from www.quantachrome.com/technical/dft.html, and
in good agreement with similar samples in literature.3,4 Differential pore volume
distribution by DFT is represented in the following plot:
The low value of pore volume suggests the presence of ultramicropores. 3,4

SI 9.
(A) C
disch
mate
. Electroche
CV curve a
harge curve
erial at diffe
emical pro
at various sc
s at differen
erent dischar
perties of c
can rates in
nt discharge
rge current
carbon sph
n a 6 M KO
e current de
densities.
eres synthe
OH aqueous
ensities. (C)
esized at 10
solution. (B
Specific ca
000 oC.
B) Galvano
apacitance o
ostatic
of the
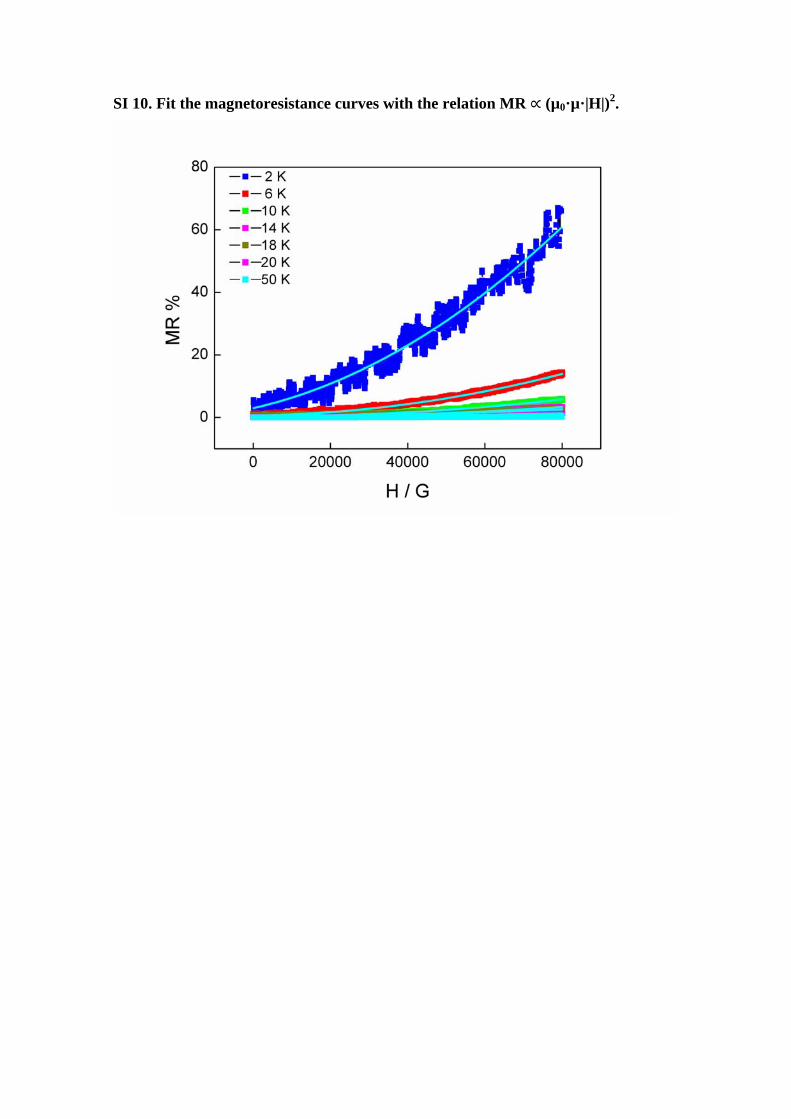
SI 10. Fit the magnetoresistance curves with the relation MR ∝ (µ0·µ·|H|)2.

SI 11. Magnetic temperature dependence of CS.
SI 12
2. Magnetooresistance dependencce with the temperatuure.

SI 13. Additional References.
1 P. Serp, R. Feurer, P. Kalck, Y. Kihn, J. L. Faria and J. L. Figueiredo, Carbon, 2001, 39, 621–626.
2 G. Abellán, J. A. Carrasco, E. Coronado, J. P. Prieto-Ruiz and H. Prima-García, Adv. Mater. Interfaces, 2014, 1, 1400184.
3 Y. Han, X. Dong, C. Zhang and S. Liu, J. Power Sources, 2012, 211, 92–96. 4 N. P. Wickramaratne, J. Xu, M. Wang, L. Zhu, L. Dai and M. Jaroniec, Chem. Mater.,
2014, 26, 2820–2828.