Supplementary Information - rsc.org · S1 Supplementary Information Armored Cobalt-Citrate...
12
S1 Supplementary Information Armored Cobalt-Citrate Framework with Graphene Oxide Exhibiting Improved Thermal Stability and Selectivity for Biogas Decarburization Yangcan Shen, 1,2 Ziyin Li, 1 Lihua Wang, 1 Yingxiang Ye, 1 Qing Liu, 1 Xiuling Ma, 1 Qianhou Chen, 1 Zhangjing Zhang 1,* and Shengchang Xiang 1,3,* 1 Fujian Provincial Key Laboratory of Polymer Materials, College of Material Sciences and Engineering, Fujian Normal University, 32 Shangsan Road, Fuzhou 350007,China 2 State Key Laboratory of Structural Chemistry, Fujian Institute of Research on the Structure of Matter, Chinese Academy of Sciences, Fuzhou, Fujian 350002, PR China 3 College of Life and Environmental Sciences, Minzu University of China, 27 South Zhongguancun Boulevard, Haidian District, Beijing 100081, China * To whom correspondence should be addressed. Email addresses: Z.-J. Zhang ([email protected] ) and S.-C. Xiang ([email protected] ) Electronic Supplementary Material (ESI) for Journal of Materials Chemistry A. This journal is © The Royal Society of Chemistry 2014
Transcript of Supplementary Information - rsc.org · S1 Supplementary Information Armored Cobalt-Citrate...

S1
Supplementary Information
Armored Cobalt-Citrate Framework with Graphene Oxide Exhibiting Improved
Thermal Stability and Selectivity for Biogas Decarburization
Yangcan Shen,1,2 Ziyin Li,1 Lihua Wang,1 Yingxiang Ye,1 Qing Liu,1 Xiuling Ma,1 Qianhou Chen,1
Zhangjing Zhang1,* and Shengchang Xiang1,3,*
1 Fujian Provincial Key Laboratory of Polymer Materials, College of Material Sciences and Engineering, Fujian
Normal University, 32 Shangsan Road, Fuzhou 350007,China 2 State Key Laboratory of Structural Chemistry, Fujian Institute of Research on the Structure of Matter, Chinese
Academy of Sciences, Fuzhou, Fujian 350002, PR China
3 College of Life and Environmental Sciences, Minzu University of China, 27 South Zhongguancun Boulevard,
Haidian District, Beijing 100081, China
* To whom correspondence should be addressed.
Email addresses: Z.-J. Zhang ([email protected]) and S.-C. Xiang ([email protected])
Electronic Supplementary Material (ESI) for Journal of Materials Chemistry A.This journal is © The Royal Society of Chemistry 2014

S2
Contents
Table S1 | Summary of the parameters and the enthalpies of gas adsorption on UTSA-16-GO
composites at 296 and 273 K obtained from the virial equation…………………….S3
Table S2 | Adsorption selectivities for equimolar CO2/CH4 mixture at 200 kPa and 296 K by IAST
on different MOFs …………………………………………………………………….S4
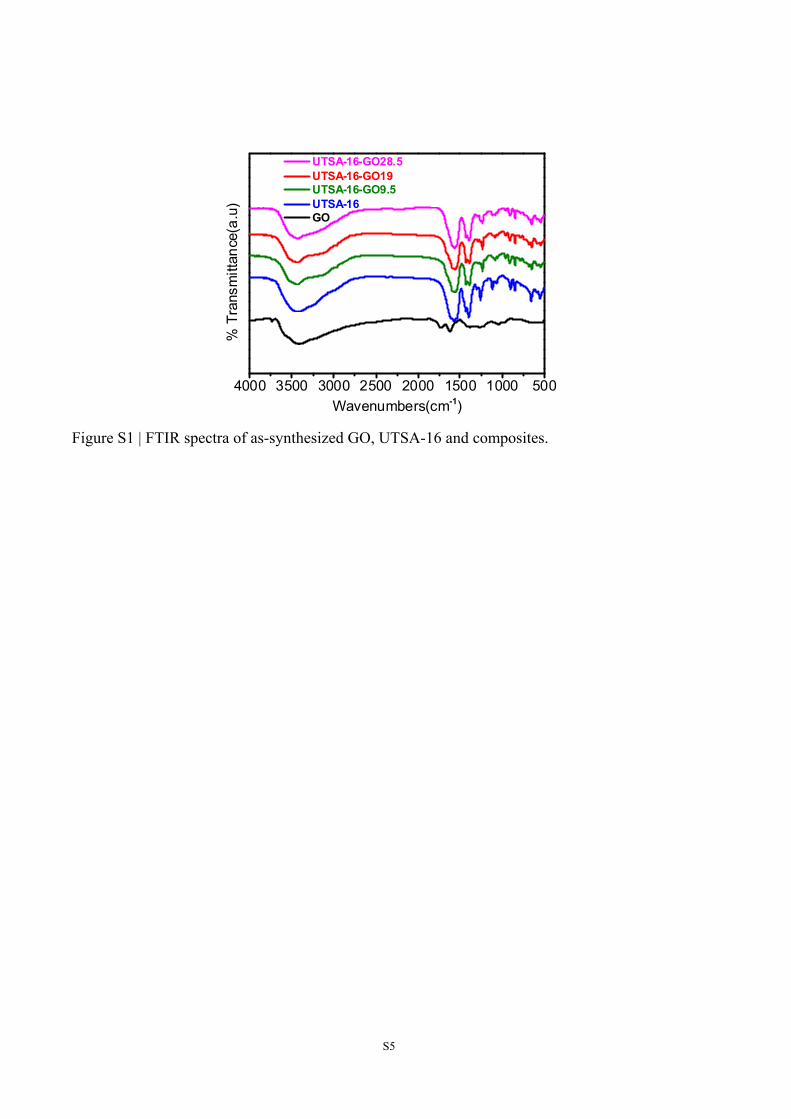
Figure S1 | FTIR spectra of as-synthesized GO, UTSA-16 and composites………………………S5
Figure S2 | SEM images for the composites……………………………..………………………S6
Figure S3 | TEM images for UTSA-16…………………………………………………………...S6
Figure S4 | TEM images for the composites……………………………………………………...S6
Figure S5 | (a) Cumulative pore volume and (b) pore-size distribution for UTSA-16 and its
composites……………………………………………………………………………S7
Figure S6 | The virial graphs for adsorption of CO2 on UTSA-16-GO9.5………………………..S8
Figure S7 | The virial graphs for adsorption of CH4 on UTSA-16-GO9.5………………………...S8
Figure S8 | The virial graphs for adsorption of CO2 on UTSA-16-GO19………………….…....S8
Figure S9 | The virial graphs for adsorption of CH4 on UTSA-16-GO19…………………...…….S9
Figure S10 | The virial graphs for adsorption of CO2 on UTSA-16-GO28.5……………....……...S9
Figure S11 | The virial graphs for adsorption of CH4 on UTSA-16-GO28.5…………...…………S9
Figure S12 | Comparison of the enthalpies for gas adsorption of CO2, CH4 on UTSA-16-GO9.5
from two methods: virial equation (solid) and linear extrapolation (open) ………….S10
Figure S13 | Comparison of the enthalpies for gas adsorption of CO2, CH4 on UTSA-16-GO19
from two methods: virial equation (solid) and linear extrapolation (open) …….……S10
Figure S14 | Comparison of the enthalpies for gas adsorption of CO2, CH4 on UTSA-16-GO28.5
from two methods: virial equation (solid) and linear extrapolation (open) ………….S10
Figure S15 | The graphs of the Single-site Langmuir-Freundlich equations fit for adsorption of CO2
(left) and CH4 (right) on UTSA-16-GO9.5 at 296K…………………………….……S11
Figure S16 | The graphs of the Single-site Langmuir-Freundlich equations fit for adsorption of CO2
(left) and CH4 (right) on UTSA-16-GO19 at 296K……………..……………………S11
Figure S17 | The graphs of the Single-site Langmuir-Freundlich equations fit for adsorption of CO2
(left) and CH4 (right) on UTSA-16-GO28.5 at 296K…………………………….….S11
Supplementary References……………………………………………………………………….S12

S3
Table S1 | Summary of the parameters and the enthalpies of gas adsorption on UTSA-16-GO composites at 296 and 273 K obtained from the virial equation, as shown in Figures S6~S11.
Sample adsorbate T/
K
A0/
ln(mol g-1 Pa-1)
A1/
g mol-1
R2 ∆H/
kJ mol-1
UTSA-16-GO9.5
UTSA-16-GO19
UTSA-16-GO28.5
CO2
CH4
CO2
CH4
CO2
CH4
296
273
296
273
296
273
296
273
296
273
296
273
-12.780±0.112
-11.544±0.141
-19.471±0.001
-19.097±0.001
-12.059±0.092
-10.616±0.119
-19.038±0.002
-18.646±3.946E-4
-12.021±0.075
-10.650±0.113
-19.176±6.443E-4
-18.800±0.002
-1684.456±27.666
-2002.903±41.121
-420.455±4.349
-324.566±12.874
-1405.067±29.558
-1653.615±37.188
-296.732±7.023
-251.911±1.888
-1943.720±56.301
-2285.230±70.018
-407.189±8.954
-402.117±11.438
0.998
0.998
0.999
0.994
0.996
0.998
0.996
0.999
0.994
0.996
0.996
0.996
36.1
10.9
42.1
11.7
40.0
11.4

S4
Table S2 | Adsorption selectivities for equimolar CO2/CH4 mixture at 200 kPa and 296 K by IAST on different MOFs.
MOFs T / K Sads (CO2/CH4) Supplementary
References
polyamine incorporated
amine-MIL-101 (Cr) (c)
298 931 1
polyamine incorporated
amine-MIL-101 (Cr) (b)
298 278 1
UTSA-16-GO19 296 114.4 This work
MgMOF-74 296 105 2
UTSA-16-GO9.5 296 98.7 This work
UTSA-16-GO28.5 296 89.4 This work
[Cd2L1(H2O)]2·5H2O 298 66 3
UTSA-16 296 29.8 2
polyamine incorporated
amine-MIL-101 (Cr) (a)
298 21 1
Fe2(dobdc) 298 20.2 4
UiO-66(Zr)-CO2H 298 19.2 5
MOF-5 (IRMOF-1) 298 15.5 6
UTSA-15a 296 14.2 2
Cu-TDPAT 296 13.8 2
bio-MOF-11 298 ~12 7
Cu(bpy-1)2(SiF6) 298 ~11 8
Zn5(BTA)6(TDA)2 296 10.8 2
ZIF-78 296 10.4 2
MIL-101 296 9.6 9
UTSA-72a 293 9.6 10
UTSA-25a 296 9.4 2
UTSA-20a 296 8.3 2
Fe2(O2)( dobdc ) 298 7.8 4
CuBTC 296 7.4 9
UTSA-33a 296 7.0 2
MIL-53 298 7 11
UTSA-34b 296 5.1 2
MOF-177 298 4.4 6
S5
4000 3500 3000 2500 2000 1500 1000 500
UTSA-16-GO28.5 UTSA-16-GO19 UTSA-16-GO9.5 UTSA-16 GO
% T
rans
mitt
ance
(a.u
)
Wavenumbers(cm-1)
Figure S1 | FTIR spectra of as-synthesized GO, UTSA-16 and composites.

S6
Figure S2 | SEM images for UTSA-16-GO9.5 (a) and UTSA-16-GO28.5 (b).
Figure S3 | TEM images for UTSA-16.
Figure S4 | TEM images for UTSA-16-GO9.5 (a, b), UTSA-16-GO28.5 (c, d).

S7
4 5 6 7 8 9 10 11
0.00
0.05
0.10
0.15
0.20
0.25
UTSA-16 UTSA-16-GO9.5 UTSA-16-GO19 UTSA-16-GO28.5
Cum
ula
tive
Pore
Volu
me (cm
3/g
)
Pore Width (Å)
(a)
4 5 6 7 8 9 10 11
0.0
0.5
1.0
1.5
2.0
2.5
3.0
Diffe
rential
Pore
Volu
me
(cm
3/g
)
Pore Width (Å)
(b) UTSA-16 UTSA-16-GO9.5 UTSA-16-GO19 UTSA-16-GO28.5
Figure S5 | (a) Cumulative pore volume and (b) pore-size distribution for UTSA-16 and its composites from CO2 adsorption at 273 K (calculated by using a slit pore NLDFT model).

S8
0.0018 0.0020 0.0022
-17.0
-16.8
-16.6
-16.4
-16.2
-16.0
ln(n/p
) (l
n(m
ol
g-1 P
a-1))
n (mol/g)
Equation y = a + b*x
Adj. R-Squar 0.99416
Value Standard Erro
ln(n/p) Intercept -12.77953 0.11172
ln(n/p) Slope -1943.7198 56.30142
0.0018 0.0019 0.0020 0.0021 0.0022-16.6
-16.4
-16.2
-16.0
-15.8
-15.6
Equat ion y = a + b*x
Adj. R-Square 0.99626
Value Standard Error
ln(n/p) Intercept -11.54447 0.14117
ln(n/p) Slope -2285.23021 70.01763
ln(n/p
) (l
n(m
ol
g-1 P
a-1))
n (mol/g)
Figure S6 | The virial graphs for adsorption of CO2 on UTSA-16-GO9.5 at 296 K (left) and 273 K (right).
0.00004 0.00008 0.00012 0.00016 0.00020
-19.55
-19.54
-19.53
-19.52
-19.51
-19.50
-19.49
-19.48
Equation y = a + b*x
Adj. R-Square 0.99567
Value Standard Error
ln(n/p) Intercept -19.47072 0.00114
ln(n/p) Slope -407.18866 8.9536
ln(n/p
) (l
n(m
ol g
-1 P
a-1))
n (mol/g)
0.00004 0.00008 0.00012 0.00016 0.00020-19.18
-19.17
-19.16
-19.15
-19.14
-19.13
-19.12
Equation y = a + b*x
Adj. R-Squar 0.99597
Value Standard Er ro
ln(n/p) Intercept -19.09704 0.00145
ln(n/p) Slope -402.1173 11.43756
ln(n/p
) (l
n(m
ol g
-1 P
a-1))
n (mol/g)
Figure S7 | The virial graphs for adsorption of CH4 on UTSA-16-GO9.5 at 296 K (left) and 273 K (right).
0.0028 0.0030 0.0032 0.0034-17.0
-16.8
-16.6
-16.4
-16.2
-16.0
-15.8
Equation y = a + b*x
Adj. R-Square 0.99603
Value Standard Error
ln(n/p) Intercept -12.05852 0.09227
ln(n/p) Slope -1405.06666 29.55846
ln(n/p
) (l
n(m
ol
g-1 P
a-1))
n (mol/g)
0.0029 0.0030 0.0031 0.0032 0.0033 0.0034-16.3
-16.2
-16.1
-16.0
-15.9
-15.8
-15.7
-15.6
-15.5
Equation y = a + b*x
Adj. R-Square 0.99798
Value Standard Error
ln(n/p) Intercept -10.61635 0.11927
ln(n/p) Slope -1653.61509 37.18781
ln(n/p
) (l
n(m
ol
g-1 P
a-1))
n (mol/g)
Figure S8 | The virial graphs for adsorption of CO2 on UTSA-16-GO19 at 296 K (left) and 273 K (right).

S9
0.0001 0.0002 0.0003-19.14
-19.13
-19.12
-19.11
-19.10
-19.09
-19.08
-19.07
Equation y = a + b*x
Adj. R-Square 0.99554
Value Standard Erro
ln(n/p) Intercept -19.03791 0.00158
ln(n/p) Slope -296.7318 7.02312
ln(n/p
) (l
n(m
ol g
-1 P
a-1))
n (mol/g)
0.00012 0.00016 0.00020 0.00024 0.00028-18.72
-18.71
-18.70
-18.69
-18.68
-18.67
Equation y = a + b*x
Adj. R-Square 0.99978
Value Standard Error
ln(n/p) Intercept -18.64601 3.94592E-4
ln(n/p) Slope -251.91073 1.88763
ln(n/p
) (l
n(m
ol g
-1 P
a-1))
n (mol/g)
Figure S9 | The virial graphs for adsorption of CH4 on UTSA-16-GO19 at 296 K (left) and 273 K (right).
0.0024 0.0026 0.0028 0.0030
-17.0
-16.8
-16.6
-16.4
-16.2
-16.0
Equation y = a + b*x
Adj. R-Square 0.99758
Value Standard Error
ln(n/p) Intercept -12.02134 0.07499
ln(n/p) Slope -1684.45581 27.66591
ln(n/p
) (l
n(m
ol
g-1 P
a-1))
n (mol/g)
0.0025 0.0026 0.0027 0.0028 0.0029-16.6
-16.4
-16.2
-16.0
-15.8
Equation y = a + b*x
Adj. R-Square 0.9979
Value Standard Error
ln(n/p) Intercept -10.65043 0.11315
ln(n/p) Slope -2002.90285 41.12092
ln(n/p
) (l
n(m
ol
g-1 P
a-1))
n (mol/g)
Figure S10 | The virial graphs for adsorption of CO2 on UTSA-16-GO28.5 at 296 K (left) and 273 K (right).
0.00008 0.00012 0.00016 0.00020-19.27
-19.26
-19.25
-19.24
-19.23
-19.22
-19.21
-19.20
Equation y = a + b*x
Adj. R-Square 0.99936
Value Standard Error
ln(n/p) Intercept -19.17624 6.44267E-4
ln(n/p) Slope -420.45468 4.34893
ln(n/p
) (l
n(m
ol g
-1 P
a-1))
n (mol/g)
0.00012 0.00016 0.00020 0.00024
-18.88
-18.87
-18.86
-18.85
-18.84
-18.83
Equation y = a + b*x
Adj. R-Square 0.99374
Value Standard Error
ln(n/p) Intercept -18.79991 0.00229
ln(n/p) Slope -324.56583 12.87415
ln(n/p
) (l
n(m
ol g
-1 P
a-1))
n (mol/g)
Figure S11 | The virial graphs for adsorption of CH4 on UTSA-16-GO28.5 at 296 K (left) and 273 K (right).

S10
1.7 1.8 1.9 2.0 2.1 2.20
5
10
15
20
25
30
Qst (
kJ/m
ol)
virial equation linear extrapolation
n (mmol/g)
CO2
0.04 0.08 0.12 0.16 0.200
2
4
6
8
10
12
14
16
18
20
CH4
Qst (
kJ/
mo
l)
virial equation linear extrapolation
n (mmol/g)
Figure S12 | Comparison of the enthalpies for gas adsorption of CO2 (left), CH4 (right) on UTSA-16-GO9.5 from two methods: virial equation (solid) and linear extrapolation (open).
2.7 2.8 2.9 3.0 3.1 3.2 3.3 3.40
5
10
15
20
25
30
35
40
CO2
Qst (
kJ/
mo
l)
virial equation linear extrapolation
n (mmol/g)0.10 0.15 0.20 0.25 0.30 0.35
2
4
6
8
10
12
14
16
18
20
Qst (
kJ/
mo
l)CH
4
virial equation linear extrapolation
n (mmol/g)
Figure S13 | Comparison of the enthalpies for gas adsorption of CO2 (left), CH4 (right) on UTSA-16-GO19 (magenta) from two methods: virial equation (solid) and linear extrapolation (open).
2.3 2.4 2.5 2.6 2.7 2.8 2.9 3.00
5
10
15
20
25
30
virial equation linear extrapolation
Qst (
kJ/m
ol)
n (mmol/g)
CO2
0.05 0.10 0.15 0.20 0.250
5
10
15
20
25
Qst (
kJ/m
ol)
virial equation linear extrapolation
n (mmol/g)
CH4
Figure S14 | Comparison of the enthalpies for gas adsorption of CO2 (left), CH4 (right) on UTSA-16-GO28.5 (olive) from two methods: virial equation (solid) and linear extrapolation (open).

S11
0 20 40 60 80 100 120
0.0
0.5
1.0
1.5
2.0
2.5
n (
mm
ol/g
)
P (kPa)
Model LFINST (User)Equation
A1*b1*x c1/(1+b1*x c1)
Adj. R-Square 0.99894Value Standard Error
G A1 2.5627 0.02819
G b1 0.1044 0.00624
G c1 1.01874 0.03181
0 20 40 60 80 100 1200.00
0.05
0.10
0.15
0.20
0.25
0.30
0.35
Model LFINST (User)Equation
A1*b1*x^c1/(1+b1*x c1)
Adj. R-Square 0.99999
Value Standard Error
G A1 2.23666 0.10508
G b1 0.00153 5.16172E-5
G c1 1.00894 0.00467
n (
mm
ol/g
)
P (kPa)
Figure S15 | The graphs of the Single-site Langmuir-Freundlich equations fit for adsorption of CO2 (left) and CH4 (right) on UTSA-16-GO9.5 at 296K.
0 20 40 60 80 100 120
0.0
0.5
1.0
1.5
2.0
2.5
3.0
3.5
4.0
n (
mm
ol/
g)
P (kPa)
Model LFINST (User)Equation
A1*b1*x^c1/(1+b1*x c1)
Adj. R-Square 0.99912
Value Standard Error
G A1 3.8233 0.03742
G b1 0.09555 0.00545
G c1 1.04687 0.02966
0 20 40 60 80 100 120
0.0
0.1
0.2
0.3
0.4
0.5
Model LFINST (User)EquationA1*b1*x c1/(1+b1*x c1)
Adj. R-Square 1
Value Standard Error
G A1 3.00401 0.05687
G b1 0.00173 2.24113E-5
G c1 1.01243 0.00216
n (
mm
ol/
g)
P (kPa)
Figure S16 | The graphs of the Single-site Langmuir-Freundlich equations fit for adsorption of CO2 (left) and CH4 (right) on UTSA-16-GO19 at 296K.
0 20 40 60 80 100 120
0.0
0.5
1.0
1.5
2.0
2.5
3.0
3.5
n (
mm
ol/g
)
P (kPa)
Model LFINST (User)Equat ion
A1*b1*x c1/(1+b1*x c1)
Adj. R-Square 0.99886
Value Standard Error
n A1 3.32428 0.03778
n b1 0.10662 0.00659
n c1 1.01625 0.03301
0 20 40 60 80 100 120
0.0
0.1
0.2
0.3
0.4
0.5
n (
mm
ol/
g)
P (kPa)
Model LFINST (User)Equation
A1*b1*x^c1/(1+b1*x^c1)
Adj. R-Square 0.99999Value Standard Error
n A1 3.14229 0.15237
n b1 0.00152 5.5175E-5
n c1 0.99127 0.00433
Figure S17 | The graphs of the Single-site Langmuir-Freundlich equations fit for adsorption of CO2 (left) and CH4 (right) on UTSA-16-GO28.5 at 296K.

S12
Supplementary References
(1) Q. Yan, Y. Lin, C. Kong and L. Chen, Chem. Commun., 2013, 49, 6 873.
(2) S. –C. Xiang, Y. -B. He, Z. -J. Zhang, H. Wu, W. Zhou, R. Krishna and B. –L. Chen, Nature Commun., 2012,
3, 954. (3) L. Hou, W. -J. Shi, Y. -Y. Wang, Y. Guo, C. Jin and Q. -Z. Shi, Chem. Commun., 2011, 47, 5464. (4) W. Lou, J. Yang, L. Li and J. Li. J. Solid State Chem., 2014, 213, 224. (5) Q. Yang, A. D. Wiersum, P. L. Llewellyn, V. Guillerm, C. Serre and G. Maurin, Chem. Commun., 2011, 47,
9603. (6) D. Saha, Z. Bao, F. Jia and S. Deng, Environ. Sci. Technol., 2010, 44, 1820. (7) E. Atci, I. Erucar and S. Keskin, J. Phys. Chem. C, 2011, 115, 6833. (8) S. D. Burd, S. Ma, J. A. Perman, B. J. Sikora, R. Q. Snurr, P. K. Thallapally, J. Tian, L. Wojtas and M. J.
Zaworotko, J. Am. Chem. Soc., 2012, 134, 3663.
(9) P. Chowdhury, S. Mekala, F. Dreisbach and S. Gumma, Microporous Mesoporous Mater., 2012, 152, 246.
(10) H. Alawisi, B. Li, Y. He, H. D. Arman, A. M. Asiri, H. Wang and B. Chen, Cryst. Growth Des., 2014, 14,
2522.
(11) V. Finsy, L. Ma, L. Alaerts, D. E. D. Vos, G. V. Baron and J. F. M. Denayer, Microporous Mesoporous Mater.,
2009, 120, 221.