Supplementary information for A Mantle-Driven Surge in … · Supplementary information for ......
16
SUPPLEMENTARY INFORMATION DOI: 10.1038/NGEO1426 NATURE GEOSCIENCE | www.nature.com/naturegeoscience 1 Supplementary information for “A Mantle-Driven Surge in Magma Supply to Kīlauea Volcano During 2003–2007” This supplement contains information on data collection methods, magma supply estimates for Kīlauea, deformation results from Mauna Loa and Kīlauea’s south flank, and deformation modeling procedures and results. METHODS All data were collected by staff of the Hawaiian Volcano Observatory (HVO). Processing and analysis methods are detailed below. Gas emissions SO 2 emission rate data are collected with an ultraviolet spectrometer (COSPEC or FLYSPEC) during repeated vehicle-based transects beneath gas plumes from Kīlauea’s summit and east rift zone (ERZ). Persistent trade winds from the northeast blow the plumes across roads 1 km and 9 km from the summit and ERZ source vents, respectively. Average transect values are combined with wind-speed data to derive emission rates, and error is calculated as the standard deviation of repeated transects. Procedures are given in [refs. 50–52]. CO 2 emissions are constrained using the SO 2 emission rate E SO2 and synchronously quantified volcanic CO 2 -to-SO 2 molar ratio CO 2 /SO 2 measured across the summit plume. The emission rate of CO 2 in tonnes per day is computed as 0.69 x (CO 2 )/(SO 2 ) E SO2 . Methodology is described in [ref. 34]. SO 2 emission rates from the ERZ can be used to assess the volume of magma that has degassed, which indicates the volume of magma that has been transported from the summit to the © 2012 Macmillan Publishers Limited. All rights reserved.
-
Upload
truonglien -
Category
Documents
-
view
214 -
download
1
Transcript of Supplementary information for A Mantle-Driven Surge in … · Supplementary information for ......
SUPPLEMENTARY INFORMATIONDOI: 10.1038/NGEO1426
NATURE GEOSCIENCE | www.nature.com/naturegeoscience 1
Supplementary information for “A Mantle-Driven Surge in Magma Supply to
Kīlauea Volcano During 2003–2007”
This supplement contains information on data collection methods, magma supply
estimates for Kīlauea, deformation results from Mauna Loa and Kīlauea’s south flank, and
deformation modeling procedures and results.
METHODS
All data were collected by staff of the Hawaiian Volcano Observatory (HVO).
Processing and analysis methods are detailed below.
Gas emissions
SO2 emission rate data are collected with an ultraviolet spectrometer (COSPEC or
FLYSPEC) during repeated vehicle-based transects beneath gas plumes from Kīlauea’s summit
and east rift zone (ERZ). Persistent trade winds from the northeast blow the plumes across roads
1 km and 9 km from the summit and ERZ source vents, respectively. Average transect values
are combined with wind-speed data to derive emission rates, and error is calculated as the
standard deviation of repeated transects. Procedures are given in [refs. 50–52].
CO2 emissions are constrained using the SO2 emission rate ESO2 and synchronously
quantified volcanic CO2-to-SO2 molar ratio CO2/SO2 measured across the summit plume. The
emission rate of CO2 in tonnes per day is computed as 0.69 x (CO2)/(SO2) ESO2. Methodology is
described in [ref. 34].
SO2 emission rates from the ERZ can be used to assess the volume of magma that has
degassed, which indicates the volume of magma that has been transported from the summit to the
© 2012 Macmillan Publishers Limited. All rights reserved.

ERZ. This calculation, based on knowledge of the CO2/SO2 molar ratio from eruptive gas
samples from the ERZ, indicates that 1.49 kg of SO2 is emitted per tonne of lava degassed36
.
Petrology
Samples of eruptive products, collected throughout the ongoing Puʻu ʻŌʻō-Kupaianaha
eruption, generally consist of rapidly quenched near-vent tephra and spatter, and lava collected
from surface flows, ponds, and tubes (through skylights). Bulk lava major-element analyses
(including MgO wt. %) are obtained by wavelength dispersive x-ray fluorescence. Procedures
are detailed in [refs. 28,53]. Eruption temperatures are based on geothermometry of MgO glass
contents54
. MgO content and glass temperatures generally track one another, but a noteworthy
exception is the time period immediately following the June 19, 2007 ERZ eruption, when
samples collected from Puʻu ʻŌʻō had some of the coolest glass temperatures during the 2000–
2009 time period. This is most likely caused by a combination of two factors: 1) the samples
were spatter, which tend to have lower glass temperatures than quenched molten lava, and 2) the
lava erupted within Puʻu ʻŌʻō during the July 1–21, 2007, time period of lowest glass
temperatures had clearly been resident beneath Puʻu ʻŌʻō (based on the low gas emissions) and
was therefore cooler than if it had been transported from the summit more recently.
Seismicity
Earthquake locations were determined from data collected by seismometers of HVO’s
permanent network. The seismic network, data processing, and location procedures are
described in [ref. 55].
© 2012 Macmillan Publishers Limited. All rights reserved.
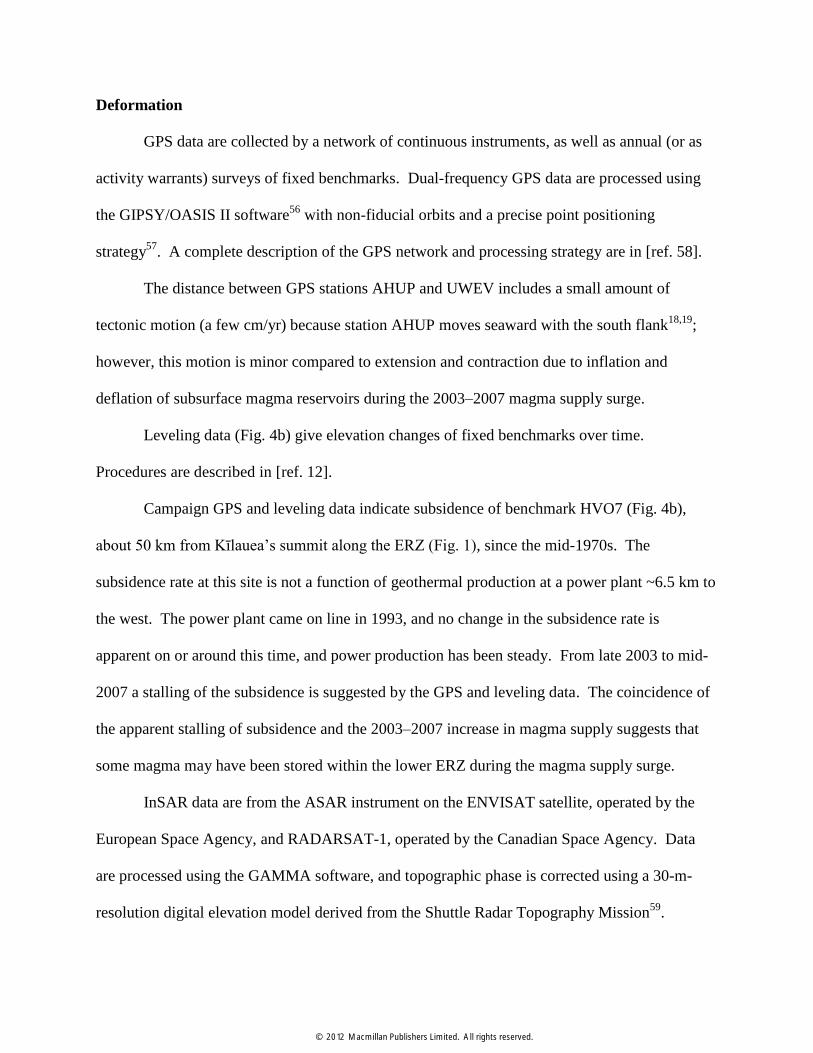
Deformation
GPS data are collected by a network of continuous instruments, as well as annual (or as
activity warrants) surveys of fixed benchmarks. Dual-frequency GPS data are processed using
the GIPSY/OASIS II software56
with non-fiducial orbits and a precise point positioning
strategy57
. A complete description of the GPS network and processing strategy are in [ref. 58].
The distance between GPS stations AHUP and UWEV includes a small amount of
tectonic motion (a few cm/yr) because station AHUP moves seaward with the south flank18,19
;
however, this motion is minor compared to extension and contraction due to inflation and
deflation of subsurface magma reservoirs during the 2003–2007 magma supply surge.
Leveling data (Fig. 4b) give elevation changes of fixed benchmarks over time.
Procedures are described in [ref. 12].
Campaign GPS and leveling data indicate subsidence of benchmark HVO7 (Fig. 4b),
about 50 km from Kīlauea’s summit along the ERZ (Fig. 1), since the mid-1970s. The
subsidence rate at this site is not a function of geothermal production at a power plant ~6.5 km to
the west. The power plant came on line in 1993, and no change in the subsidence rate is
apparent on or around this time, and power production has been steady. From late 2003 to mid-
2007 a stalling of the subsidence is suggested by the GPS and leveling data. The coincidence of
the apparent stalling of subsidence and the 2003–2007 increase in magma supply suggests that
some magma may have been stored within the lower ERZ during the magma supply surge.
InSAR data are from the ASAR instrument on the ENVISAT satellite, operated by the
European Space Agency, and RADARSAT-1, operated by the Canadian Space Agency. Data
are processed using the GAMMA software, and topographic phase is corrected using a 30-m-
resolution digital elevation model derived from the Shuttle Radar Topography Mission59
.
© 2012 Macmillan Publishers Limited. All rights reserved.

Coherence in resulting interferograms is improved using an adaptive filtering technique60
, and
unwrapping is done using a minimum-cost approach61
.
DEFORMATION MODELING
We modeled deformation data to infer the geometry of magma sources beneath the
summit and upper southwest rift zone of Kīlauea Volcano. Modeling was restricted to radar
interferometry data, which offers the best spatial resolution of any technique (only 3 GPS
stations were present in the summit area in 2006, so adding GPS would not significantly impact
the model result). The interferogram selected for modeling is from ENVISAT beam mode 6,
track 179, and spans 11 December 2005 to 31 December 2006. Data were inverted to determine
the best-fitting point source62
, approximating a magma reservoir, and horizontal uniform-opening
rectangular dislocation63
, approximating a sill, in an elastic, isotropic half-space. The best-fitting
model (supplementary fig. 1) includes a point source 2.9 km beneath the south caldera, with a
volume increase of about 0.009 km3, and a 4.8 km x 1.2 km sill at 3.8-km depth beneath the
upper SWRZ, with an opening of 0.65 m (equivalent to a volume of about 0.004 km3). The total
modeled volume increase during 2006 is therefore about 0.013 km3.
Our modeling results are approximate for several reasons. Perhaps most importantly, we
treat the magma as an incompressible fluid, which may result in an underestimate in volume
change by as much as a factor of 5[37,38]
. Other factors that can result in different depth and
volume change estimates include model geometry (for example, an ellipsoid instead of a point
source)64,65
, layering or the presence of weak materials66,67
, non-elastic rheologies68,69
, and
degassing and gas ascent70
. While important to a few factors, the effects of such variables on the
© 2012 Macmillan Publishers Limited. All rights reserved.

calculated magma supply are of second order, since the volume of extrusion is an order of
magnitude larger than the volume of storage beneath the summit and SWRZ.
DEFORMATION OF KĪLAUEA’S SOUTH FLANK
Deformation data indicate opening of Kīlauea’s deep rift system between about 3-km and
10-km depth, possibly due to magma accumulation coupled with seaward sliding of the
volcano’s south flank along a low-angle detachment fault17–19,71
. During 2003–2008, the rate of
south flank motion remained constant (supplementary fig. 2), suggesting that magma was neither
stored nor withdrawn from the deep rift zone.
DEFORMATION OF MAUNA LOA
After several years of deflation, GPS results indicated inflation of Mauna Loa volcano,
starting in mid-2002[31]
. The inflation rate decreased, but remained steady, from late 2002
through early 2004, increased several-fold during mid-2004 to mid-2005, waned, and changed to
deflation in late 2009 (supplementary fig. 3). The time period of inflation at Mauna Loa
bookends the inflation at Kīlauea, i.e., the magma supply increase that affected Kīlauea was also
manifested at Mauna Loa. The two volcanoes erupt isotopically distinct magmas, indicating
distinct mantle sources47
, but a surge from the hotspot that feeds both volcanoes could travel
through different regions of the mantle before reaching the surface.
PREVIOUS ESTIMATES OF MAGMA SUPPLY TO KĪLAUEA
Since the first estimate of the contemporary magma supply rate to Kīlauea Volcano was
published by Swanson7, many authors have quantified magma supply to Kīlauea over various
© 2012 Macmillan Publishers Limited. All rights reserved.

time periods, using different techniques. Table S1 details a selection of estimates made for
magma supply to Kīlauea’s shallow magmatic system (i.e., magma erupted or stored in the
summit and shallow rift zones). Magma supply estimates that include the deep rift zones25
are
not included; whether or not magma accumulates in this area of the volcano is uncertain, and no
evidence for a change in deep rift opening was found in the current study.
© 2012 Macmillan Publishers Limited. All rights reserved.

Supplementary Figure 1. Model of deformation during 2006. a, Line-of-sight displacements
(scale bar at lower right) recorded by an ENVISAT radar interferogram (with azimuth direction
to the north-northwest and an incidence angle of 40°, as indicated by the legend) spanning 15
December 2005 to 31 December 2006. b, Displacements predicted by a model that includes a
point source62
(white circle) beneath the south caldera at a depth of 2.9 km that expanded by
0 2.83 cm
range change
N3 km
40
A B
C
© 2012 Macmillan Publishers Limited. All rights reserved.
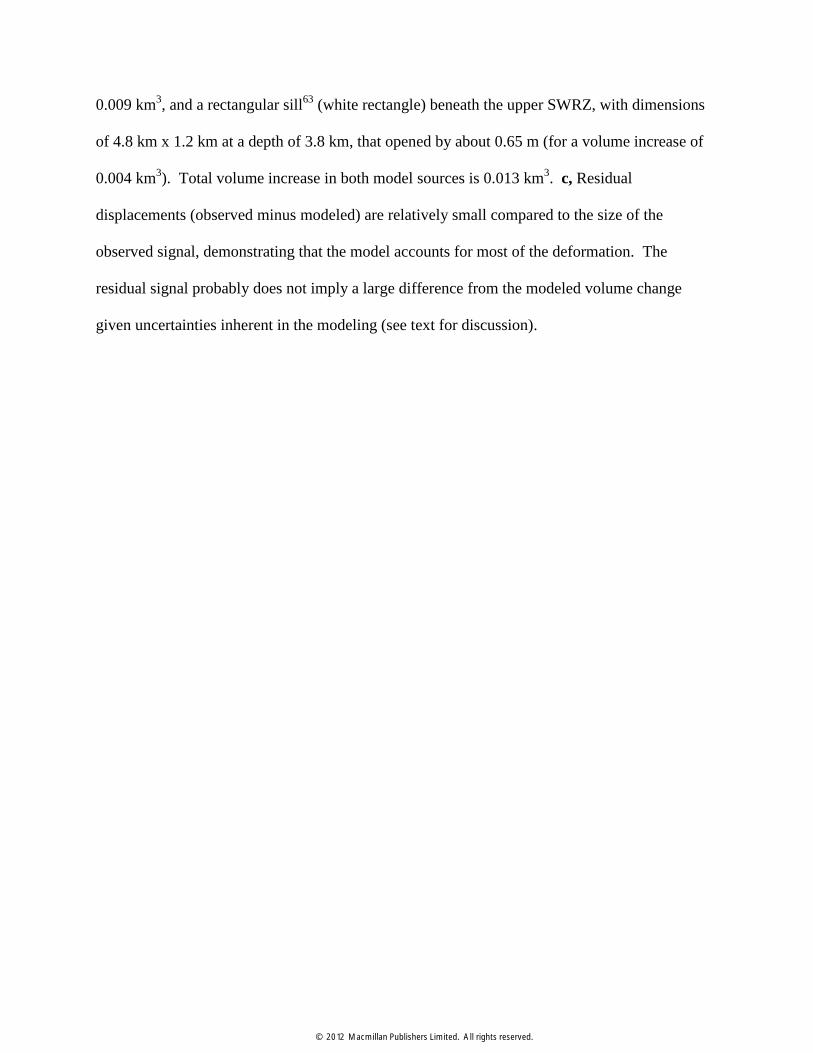
0.009 km3, and a rectangular sill
63 (white rectangle) beneath the upper SWRZ, with dimensions
of 4.8 km x 1.2 km at a depth of 3.8 km, that opened by about 0.65 m (for a volume increase of
0.004 km3). Total volume increase in both model sources is 0.013 km
3. c, Residual
displacements (observed minus modeled) are relatively small compared to the size of the
observed signal, demonstrating that the model accounts for most of the deformation. The
residual signal probably does not imply a large difference from the modeled volume change
given uncertainties inherent in the modeling (see text for discussion).
© 2012 Macmillan Publishers Limited. All rights reserved.
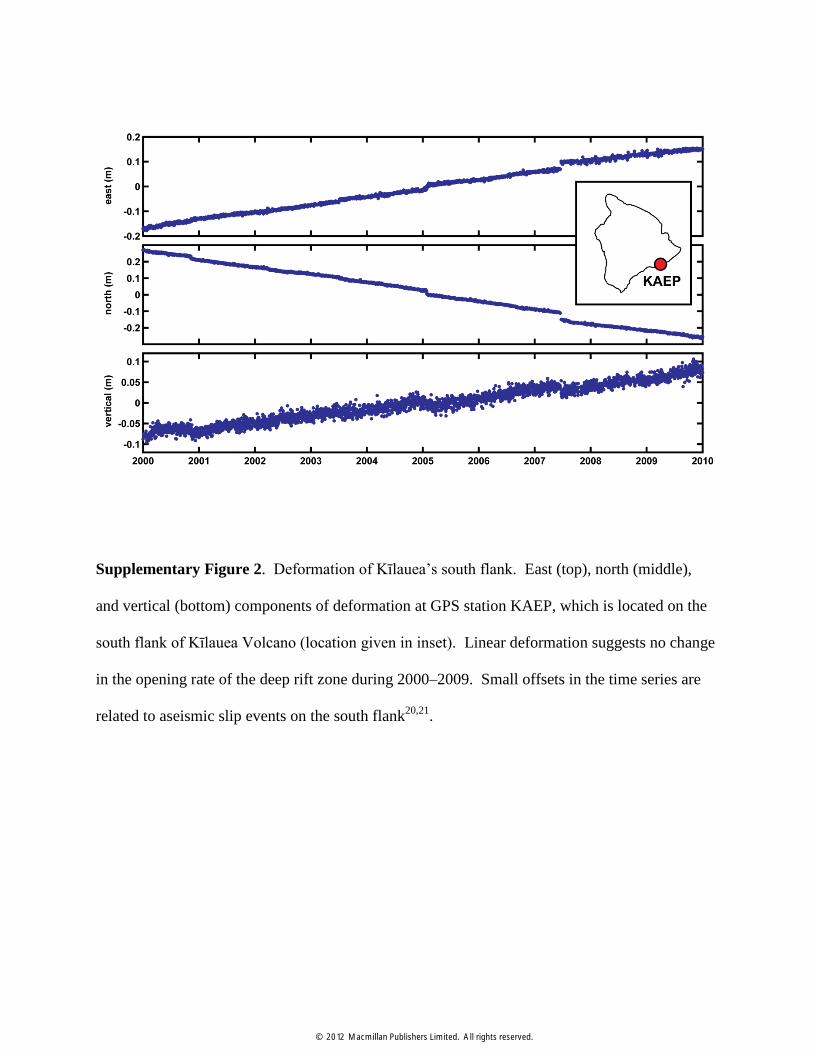
Supplementary Figure 2. Deformation of Kīlauea’s south flank. East (top), north (middle),
and vertical (bottom) components of deformation at GPS station KAEP, which is located on the
south flank of Kīlauea Volcano (location given in inset). Linear deformation suggests no change
in the opening rate of the deep rift zone during 2000–2009. Small offsets in the time series are
related to aseismic slip events on the south flank20,21
.
© 2012 Macmillan Publishers Limited. All rights reserved.

Supplementary Figure 3. Deformation of Mauna Loa. Vertical elevation change at a GPS
station MLSP, located on the south side of Mauna Loa’s summit caldera (location given in inset).
Uplift and inflation began in 2002, accelerated in 2004–2005, and gradually waned to no
deformation by the end of 2009[31,45]
.
© 2012 Macmillan Publishers Limited. All rights reserved.

Time period Supply (km3/yr) Method Reference
1918–1979 0.08 Ratio between repose times and
erupted volumes 48
1919–1990 0.09 Effusion rate of several sustained
eruptions 1
1952–1971 0.11 Effusion rate of three sustained
eruptions 7
1956–1983 0.09 Average summit and rift
deformation and eruption volumes 24
1959–1990 0.06 Average based on deformation and
eruption volumes 1
1960–1967 0.02–0.18 Deformation-inferred refilling of
summit reservoir 1
1966–1970 0.07 Deformation and eruption volumes 72
1967-1975 0.05–0.18 Deformation and eruption volumes 73
1971–1972 0.08 Deformation and erupted volumes 32
1975–1977 0.07–0.16 Microgravity and deformation 74
1975-1982 0.08 Deformation and erupted volumes 75
1983–1984 0.12 First 20 episodes of Pu`u `O`o
eruption 76
1983–2002 0.12 Pu`u `O`o eruption volumes 26
1983–2002 0.13 SO2 emissions from ERZ 36
1991 0.08 Deformation and effusion rates 77
© 2012 Macmillan Publishers Limited. All rights reserved.

Table S1. Magma supply rates to the shallow magma system of Kīlauea Volcano, as
determined by previous studies. Estimates that include deep rift opening, for example,
[ref. 25]. Calculated supply, time period over which the calculation was made, data used
to determine supply, and reference number are given.
© 2012 Macmillan Publishers Limited. All rights reserved.

References
50. Sutton, A. J., Elias, T., Gerlach, T. M. & Stokes, J. B. Implications for eruptive
processes as indicated by sulfur dioxide emissions from Kilauea Volcano, Hawaiʻi,
1979–1997. J. Volcanol. Geotherm. Res. 108, 283–302 (2001).
51. Elias, T. et al. Comparison of COSPEC and two miniature ultraviolet spectrometer
systems for SO2 measurements using scattered sunlight. Bull. Volcanol. 68, 313–
322 (2006).
52. Elias, T. & Sutton, A. J. Sulfur dioxide emission rates from Kīlauea Volcano,
Hawai‘i, an update; 2002-2006. U.S. Geol. Surv. Open-File Rep. 2007–1114 (2007).
53. Thornber, C. R. Olivine-liquid relations of lava erupted by Kilauea Volcano from
1994 to 1998; implications for shallow magmatic processes associated with the
ongoing east-rift-zone eruption. Can. Mineral. 39, 239–266 (2001).
54. Helz, R. T. & Thornber, C. R. Geothermometry of Kilauea Iki lava lake, Hawaii.
Bull. Volcanol. 49, 651–668 (1987).
55. Nakata, J. N. & Okubo, P. G. Hawaiian Volcano Observatory seismic data, January
to December 2008. U.S. Geol. Sur. Open-File Rep. 2009–1251 (2009).
56. Lichten, S. & Border, J. Strategies for high-precision Global Positioning System
orbit determination. J. Geophys. Res. 92, 12,751–12,762 (1987).
57. Zumberge, J. F., Heflin, M. B., Jefferson, D. C., Watkins, M. M. & Webb, F. H.
Precise point positioning for the efficient and robust analysis of GPS data from
large networks. J. Geophys. Res. 102, 5005–5017 (1997).
© 2012 Macmillan Publishers Limited. All rights reserved.

58. Miklius, A. et al. Global Positioning System Measurements on the Island of
Hawai`i; 1997 through 2004. U.S. Geol. Surv. Open-File Rep. 2005–1425 (2005).
59. Farr, T. G. & Kobrick, M. Shuttle Radar Topography Mission produces a wealth of
data. Eos Trans. Am. Geophys. Union 81, 583, 585 (2000).
60. Goldstein, R. M. & Werner, C. L. Radar interferogram filtering for geophysical
applications. Geophys. Res. Lett. 25, 4035–4038 (1998).
61. Chen, C. W. & Zebker, H. A. Two-dimensional phase unwrapping with use of
statistical models for cost functions in nonlinear optimization. Opt. Soc. Am. A 18,
338–351 (2001).
62. Mogi, K. Relations between the eruptions of various volcanoes and the
deformations of the ground surfaces around them. Bull. Earthquake Res. Inst. 36,
99–134 (1958).
63. Okada, Y. Surface deformation due to shear and tensile faults in a half-space. Bull.
Seismol. Soc. Am. 75, 1135–1154 (1985).
64. Fialko, Y., Khazan, Y. & Simons, M. Deformation due to a pressurized horizontal
circular crack in an elastic half-space, with application to volcano geodesy.
Geophys. J. Int. 146, 181-190 (2001).
65. Dieterich, J. H. & Decker, R. W. Finite element modeling of surface deformation
associated with volcanism. J. Geophys. Res. 80, 4094-4102 (1975).
66. Masterlark, T. Magma intrusion and deformation predictions: Sensitivities to the
Mogi assumptions. J. Geophys. Res. 112, B06419 (2007).
© 2012 Macmillan Publishers Limited. All rights reserved.

67. Crescentini, L. & Amoruso, A. Effects of crustal layering on the inversion of
deformation and gravity data in volcanic areas: An application to the Campi Flegrei
caldera, Italy. Geophys. Res. Lett. 34, L09303 (2007).
68. Masterlark, T., Haney, M., Dickinson, H., Fournier, T. & Searcy, C. Rheologic and
structural controls on the deformation of Okmok volcano, Alaska: FEMs, InSAR,
and ambient noise tomography. J. Geophys. Res.115, B02409 (2010).
69. Newman, A. V., Dixon, T. H., Ofoegbu, G. I. & Dixon, J. E. Geodetic and seismic
constraints on recent activity at Long Valley Caldera, California: Evidence for
viscoelastic rheology. J. Volcanol. Geotherm. Res. 105, 183-206 (2001).
70. Chouet, B. A., Dawson, P. B., James, M. R. & Lane, S.J. Seismic source
mechanism of degassing bursts at Kilauea Volcano, Hawaii: Results from
waveform inversion in the 10–50 s band. J. Geophys. Res. 115, B09311 (2010).
71. Clague, D. A. & Denlinger, R. P. Role of olivine cumulates in destabilizing the
flanks of Hawaiian volcanoes. Bull. Volcanol. 56, 425–434 (1994).
72. Dvorak, J., Okamura, A. & Dieterich, J. H. Analysis of surface deformation data,
Kilauea Volcano, Hawaii October 1966 to September 1970. J. Geophys. Res. 88,
9295–9304 (1983).
73. Wright, T. L. & Klein, F. W. in Dynamics of Crustal Magma Transfer, Storage, and
Differentiation, C. Annen, G. F. Zellmer, Eds. (Geol. Soc. Spec. Pub. 304),
Dynamics of magma supply to Kilauea Volcano, Hawaii: integrating seismic,
geodetic, and eruption data, 83-116 (2008).
74. Dzurisin D., Anderson, L. A., Eaton, G. P., Koyanagi, R. Y., Lipman, P. W.,
Lockwood, J. P., Okamura, R. T., Puniwai, G. S., Sako, M. K. & Yamashita, K.M.
© 2012 Macmillan Publishers Limited. All rights reserved.

Geophysical observations of Kilauea Volcano, Hawaii, 2. Constraints on the magma
supply during November 1975-September 1977. J. Volcanol. Geotherm. Res. 7,
241–269 (1980).
75. Johnson, D. J. Molten core model for Hawaiian rift zones. J. Volcanol. Geotherm.
Res. 66, 27–35 (1995).
76. Wolfe, E. W., Garcia, M. O., Jackson, D. B., Koyanagi, R. Y., Neal, C. A. &
Okamura, A. T. in Volcanism in Hawaii, R. W. Decker, T. L. Wright, P. H. Stauffer,
Eds. (U.S. Geol. Surv. Prof. Pap. 1350), The Puu Oo eruption of Kilauea Volcano,
episodes 1-20, January 3, 1983, to June 8, 1984, 471–508 (1987).
77. Denlinger, R. P. A dynamic balance between magma supply and eruption rate at
Kilauea volcano, Hawaii. J. Geophys. Res. 102, 18,091–18,100 (1997).
© 2012 Macmillan Publishers Limited. All rights reserved.