
SUPPLEMENTARY INFORMATION - images.nature.com · indicated by “ac” and the unacetylated form by...
6
SUPPLEMENTARY INFORMATION WWW.NATURE.COM/NATURECELLBIOLOGY 1 DOI: 10.1038/ncb2768 100 80 60 40 20 K18 K23 - - - me1 ac ac - me1 ac - - ac % peptide histone H3 20 10 30 K27 K36 - - - me1 me1 me1 me1 me2 me3 me2 me2 me3 me3 me3 ac - me1 me2 - me1 me2 me3 - - me1 me2 me1 me2 me3 - % peptide histone H3 e histone H4 K5 K8 K12 K16 - - - - - - - ac - - ac - - ac - - ac - - - - ac - ac - - ac ac - ac ac - ac - - ac ac - ac - ac ac - - - ac ac ac ac ac - ac ac ac ac - ac - ac ac ac ac ac ac % peptide 100 10 1 0.01 f H3K18me1 H3K27me1 H3K9me1 d c * * * * * * * * * * * 20 40 60 80 100 K4 K9 K18 K23 K27 K36 K79 K20 H3 H4 % peptide iPSCs MEFs un-me me3 me2 me1 b * * * * * * * * un-me me3 me2 me1 iPSCs MEFs iPSCs MEFs iPSCs MEFs a LC-MS/MS nucleus histones CH 3 CH 2 C-O-CCH 2 CH 3 O O ΔM = 56 Da Figure S1 Characterization of changes in global histone PTM levels during reprogramming. A) Scheme of the qMS approach. Histones were extracted from nuclei of various cell types and derivatized individually with propionic anhydride, causing a change in mass of 56 daltons. Quantification was performed by LC MS/MS on an orbitrap mass spectrometer. Subsequent analysis of histone PTMs was limited to acetylation and methylation on histone H3 and H4. For each tryptic peptide of H3 and H4, the sum of the observed combinations of acetyl, methyl, or unmethylated/unacetylated PTMs (i.e. isoforms) was set to 100%. B) The graph supports Figure 1B of the main text and shows the percentage of the mono- (me1), di- (me2), tri- methylated (me3), and unmethylated forms of the lysines of histone H3 and H4 that exhibit methylation in female iPSCs and MEFs. The unmethylated portion represents the sum of acetylated and unacetylated isoforms (ac/ un). Data presented is the mean of 6 values obtained from 2 biological replicates, each analyzed three times, and error bars represent the standard deviation, based on data presented in Table S1. Asterisks indicate significant differences between MEFs and iPSCs for the respective isoform, at p<0.01 as determined by the t-test. C) Characterization of the H3K18me1 antibody. A dot-blot containing H3K18me1, H3K9me1, and H3K27me1 peptide spots was incubated with a newly generated polyclonal H3K18me1 antibody to demonstrate the specificity of the antibody raised against H3K18me1 peptide. D) Graph displaying the percentages of all detected isoforms of the histone H3 peptide containing amino acid 18 to 26, in female iPSCs and MEFs. Data presented is the mean of 6 values obtained from 2 biological replicates, each analyzed three times based on data presented in Table S1. The asterisks indicate significantly different levels between iPSCs and MEFs at p<0.01, as determined by the t-test. Error bars = standard deviation of replicates. In this case, the lysine residues 18 and 23 can be acetylated (ac), methylated, or be in the un-acetylated/un-methylated (un) form. Notably, not all theoretically possible combinations of the modifications on K18 and K23 were found in our mass-spec analysis. Specifically, the K18me1/ K23me1 isoform and the higher degrees of H3K18 or H3K23 methylation were not detected. We found a 3-fold increase of the di-acetylated H3K18ac/ K23ac isoform of the peptide from MEFs to iPSCs, which was greater than that seen for the monoacetylated K18un/K23ac (2-fold) or K18ac/K23un (1.2-fold) isoforms, suggesting co-regulation of these two acetylation marks during reprogramming. E) As in (D), except for the percentages of the all detected isoforms of the histone H3 peptide containing amino acids 27 to 36. This peptide contains the lysine residues 27 and 36 that can be modified. H3K27ac, which is found at active enhancers, is more abundant in iPSCs than MEFs. H3K27me2 and me3, in the absence of acetylation or methylation on K36, are significantly higher in MEFs than iPSCs, but not when in the presence of the methylation marks on K36. F) As in (D), except for the percentages of the all detected isoforms of the histone H4 peptide containing amino acids 4 to 16, which contains the lysine residues 5,8,12, and 16, for which we detected only the acetylation PTM. Acetylation is indicated by “ac” and the unacetylated form by “-”. 50% of the peptide was completely unacetylated. Among the mono-acetylated forms of this peptide, the acetylation levels decrease from K16 to K8, followed by K5, and minimal acetylation occurred at K12, with relatively small differences between iPSCs and MEFs. For isoforms containing dual acetylation, the acetylation of both K8 and K16 is as abundant as the isoform that contains acetylation on K8 only, and significantly more prominent in iPSCs than MEFs. Though the triple acetylated isoforms of this peptide are of relatively low abundance, the isoform carrying K8ac, K5ac, and K16ac is almost as abundant as the isoform carrying only K5ac and is significantly more prominent in iPSCs than MEFs. Similarly, the completely acetylated isoform of this peptide is found at higher levels in iPSCs than MEFs. Together, the analysis of the histone PTM isoforms of this peptide suggests co-regulation of specific acetylation PTMs during reprogramming. © 2013 Macmillan Publishers Limited. All rights reserved.
Transcript of SUPPLEMENTARY INFORMATION - images.nature.com · indicated by “ac” and the unacetylated form by...

S U P P L E M E N TA RY I N F O R M AT I O N
WWW.NATURE.COM/NATURECELLBIOLOGY 1
DOI: 10.1038/ncb2768
100
80
60
40
20
K18K23
- - - me1 ac ac - me1 ac - - ac
% p
eptid
e
histone H3
20
10
30
K27K36
- - - me1 me1 me1 me1 me2 me3 me2 me2 me3 me3 me3 ac - me1 me2 - me1 me2 me3 - - me1 me2 me1 me2 me3 -
% p
eptid
e
histone H3e
histone H4
K5K8
K12K16
----
- - -ac
- -ac -
-ac - -
ac - - -
-ac -ac
- -acac
-acac -
ac - -ac
ac -ac -
acac - -
-acacac
acac -ac
acacac -
ac -acac
acacacac
% p
eptid
e
100
10
1
0.01
f
H3K
18m
e1
H3K
27m
e1
H3K
9me1
d
c
Supplementary Figure 1
*
*
*
**
**
**
*
*
20
40
60
80
100
K4 K9 K18 K23 K27 K36 K79 K20 H3 H4
% p
eptid
e
iPSC
s
MEF
sun-meme3me2me1b
*
*
*
*
* ** *
un-meme3me2me1
iPSCs MEFs
iPSCs MEFs
iPSCs MEFs
a
LC-MS/MS
nucleus
histones CH3CH2C-O-CCH2CH3
O O
ΔM = 56 Da
Figure S1 Characterization of changes in global histone PTM levels during reprogramming. A) Scheme of the qMS approach. Histones were extracted from nuclei of various cell types and derivatized individually with propionic anhydride, causing a change in mass of 56 daltons. Quantification was performed by LC MS/MS on an orbitrap mass spectrometer. Subsequent analysis of histone PTMs was limited to acetylation and methylation on histone H3 and H4. For each tryptic peptide of H3 and H4, the sum of the observed combinations of acetyl, methyl, or unmethylated/unacetylated PTMs (i.e. isoforms) was set to 100%. B) The graph supports Figure 1B of the main text and shows the percentage of the mono- (me1), di- (me2), tri-methylated (me3), and unmethylated forms of the lysines of histone H3 and H4 that exhibit methylation in female iPSCs and MEFs. The unmethylated portion represents the sum of acetylated and unacetylated isoforms (ac/un). Data presented is the mean of 6 values obtained from 2 biological replicates, each analyzed three times, and error bars represent the standard deviation, based on data presented in Table S1. Asterisks indicate significant differences between MEFs and iPSCs for the respective isoform, at p<0.01 as determined by the t-test. C) Characterization of the H3K18me1 antibody. A dot-blot containing H3K18me1, H3K9me1, and H3K27me1 peptide spots was incubated with a newly generated polyclonal H3K18me1 antibody to demonstrate the specificity of the antibody raised against H3K18me1 peptide. D) Graph displaying the percentages of all detected isoforms of the histone H3 peptide containing amino acid 18 to 26, in female iPSCs and MEFs. Data presented is the mean of 6 values obtained from 2 biological replicates, each analyzed three times based on data presented in Table S1. The asterisks indicate significantly different levels between iPSCs and MEFs at p<0.01, as determined by the t-test. Error bars = standard deviation of replicates. In this case, the lysine residues 18 and 23 can be acetylated (ac), methylated, or be in the un-acetylated/un-methylated (un) form. Notably, not all theoretically possible combinations of the modifications on K18
and K23 were found in our mass-spec analysis. Specifically, the K18me1/K23me1 isoform and the higher degrees of H3K18 or H3K23 methylation were not detected. We found a 3-fold increase of the di-acetylated H3K18ac/K23ac isoform of the peptide from MEFs to iPSCs, which was greater than that seen for the monoacetylated K18un/K23ac (2-fold) or K18ac/K23un (1.2-fold) isoforms, suggesting co-regulation of these two acetylation marks during reprogramming. E) As in (D), except for the percentages of the all detected isoforms of the histone H3 peptide containing amino acids 27 to 36. This peptide contains the lysine residues 27 and 36 that can be modified. H3K27ac, which is found at active enhancers, is more abundant in iPSCs than MEFs. H3K27me2 and me3, in the absence of acetylation or methylation on K36, are significantly higher in MEFs than iPSCs, but not when in the presence of the methylation marks on K36. F) As in (D), except for the percentages of the all detected isoforms of the histone H4 peptide containing amino acids 4 to 16, which contains the lysine residues 5,8,12, and 16, for which we detected only the acetylation PTM. Acetylation is indicated by “ac” and the unacetylated form by “-”. 50% of the peptide was completely unacetylated. Among the mono-acetylated forms of this peptide, the acetylation levels decrease from K16 to K8, followed by K5, and minimal acetylation occurred at K12, with relatively small differences between iPSCs and MEFs. For isoforms containing dual acetylation, the acetylation of both K8 and K16 is as abundant as the isoform that contains acetylation on K8 only, and significantly more prominent in iPSCs than MEFs. Though the triple acetylated isoforms of this peptide are of relatively low abundance, the isoform carrying K8ac, K5ac, and K16ac is almost as abundant as the isoform carrying only K5ac and is significantly more prominent in iPSCs than MEFs. Similarly, the completely acetylated isoform of this peptide is found at higher levels in iPSCs than MEFs. Together, the analysis of the histone PTM isoforms of this peptide suggests co-regulation of specific acetylation PTMs during reprogramming.
© 2013 Macmillan Publishers Limited. All rights reserved.

S U P P L E M E N TA RY I N F O R M AT I O N
2 WWW.NATURE.COM/NATURECELLBIOLOGY
299.0 300.0 301.0 302.0 303.0 304.0 305.0m/z
0
20
40
60
80
100
Rel
ativ
e Ab
unda
nce
302.732
303.234300.217
300.718302.229
303.735301.725301.221 304.236299.210
ESCs
MEFsMH2+obs = 300.217 m/z
MH2+calc = 300.216 m/z
H4K20me2b
Nucei isolationAcid extract histones
ESCs MEFs
ΔM = 61 Da
CD3CD2C-O-CCD2CD3
O O Post-harvest chemical
Derivatization (propionic anhydride) CH3CH2C-O-CCH2CH3
O O
ΔM = 56 Da
LC-MS/MS on Orbitrap mass spectrometer(quantication and identication)
a
Supplementary Figure 2
i. ii.
520.0 521.0 522.0 523.0 524.0 525.0 526.0 527.0
m/z
0
20
40
60
80
100
Rel
ativ
e Ab
unda
nce
523.822
524.324521.306
521.808524.825
523.318 525.326522.312520.813 525.827
H3K9me3K14ac
iPSCs
pre-iPSCs
MH2+obs = 521.306 m/z
MH2+calc = 521.306 m/z
c
i.ii.
Figure S2 Direct comparison of histone PTM abundance between two cell types. A) To compare the levels of histone PTMs between two different cell types directly, we quantified histone PTMs with a second proteomics approach. Here, histones were individually extracted from each of the two cell types to be compared, samples were derivatized with D0 and D5 propionic anhydride (for chemical isotopic labeling), respectively, yielding an additional mass of 61 and 56 dalton (Da). The samples from both cell types were then mixed equally and analyzed by high-resolution nanoLC-MS/MS experiments on an Orbitrap mass spectrometer. As a result, peptides derived from different cell types can be distinguished from their masses post identification. B) Quantitative mass spectrometry comparison of the histone H4K20me2 peptide extracted from ESCs and MEFs. i) Full
mass spectrum showing a pair of labeled peptide ions at 300.217 (ESCs) and 302.732 (MEFs) m/z, respectively. The peptide ion at 302.732 m/z (MEFs) is ~3-fold higher in abundance than the peptide at 300.217 m/z (ESCs). ii) MS/MS interrogation of the peptide ion at 300.217 m/z in (i) identifies this peptide as the H4 20-23 residue peptide (KVLR) with K20 dimethylation. C) Quantitative mass spectrometry comparison of the histone H3K9me3K14ac peptide extracted from iPSCs and pre-iPSCs. i) Full mass spectrum showing a pair of labeled peptide ions at 521.306 (iPSCs) and 523.822 (pre-iPSCs) m/z, respectively, indicating the differential abundance of the peptide between these cell types. ii) MS/MS interrogation of the peptide shown in (i) at 521.306 m/z confirms that the peptide contains H3K9me3K14ac.
© 2013 Macmillan Publishers Limited. All rights reserved.

S U P P L E M E N TA RY I N F O R M AT I O N
WWW.NATURE.COM/NATURECELLBIOLOGY 3
!"!#$"!#%"!#&"!#'"!#("!#)"!#*"!#+"!#,"$"
-./" -,0" 1213" -./"0..&"
-,"0..&"
1213"0..&"
!"
!#$"
!#%"
!#&"
!#'"
("
)*+(")*+,")*+-"!"
!#$"
%"
%#$"
&"
&#$"
'"
'#$"
()*+,-./,-"
()*+0102&3"
a!
b! c!
Supplementary Figure 3!
Rel
ativ
e Ex
pres
sion!
Ehm
t1!
Ctrl!
Ehm
t2!
Setd
b1!
Cbx
1!
Cbx
3!
Cbx
5!
Ehm
t1!
Ehm
t2!
Setd
b1!
Jmjd
2c!
1.0!
0.8!
0.6!
0.4!
0.2!
1.0!
0.8!
0.6!
0.4!
0.2!
3.5!
2.5!
1.5!
0.5!
3XHMT!
i! ii! iii!
iPSC
-Cbx
3#1
!iP
SC-C
bx3#
2 !
pre-
iPSC
s!
Ectopic-Oct4 Ectopic-Sox2!
iPSC
-Cbx
3#1 !
iPSC
-Cbx
3#2 !
pre-
iPSC
s!
d!14!
10!
6!
2!% N
anog
-GFP
cel
ls!
Ctrl!
3XH
MT!
Cbx
3!
Rel
ativ
e Ex
pres
sion!
Rel
ativ
e Ex
pres
sion!
Anti-
Esrrb!
Nan
og-G
FP!
Mer
ge!
DAP
I!
!"
#"
$"
%"
&"
'!"
'#"
'$"
()*" +,-.+(/.0102" *345"
Figure S3 Additional characterization of fibroblast and pre-iPSC reprogramming experiments. A) Confirmation of the efficient knockdown of Ehmt1, Ehmt2, Setdb1, or Cbx3, Cbx5, and Cbx1 transcript levels and of overexpression of Jmjd2c in the reprogramming experiments shown in Figure 3 of the main manuscript. qRT-PCR was performed three days after administering the first siRNA transfection or at the end of the overexpression experiment. For each graph, expression is plotted relative to transcript levels in control siRNA treatments, which was set to 1. Data presented is the mean of three technical replicates from one out of three representative experiments. i) Confirmation of knockdown for the experiment shown in Fig 3Ai. For the 3XHMT knockdown, all three H3K9 HMTases were efficiently knocked down. ii) Confirmation of knockdown for the experiment shown in Fig 3Aii. iii) Confirmation of Jmjd2c overexpression for the experiment shown in Fig 3C. B) Immunostaining analysis of a reprogrammed colony obtained on day 25 of a reprogramming experiment in which Nanog-GFP reporter
MEFs were infected with retroviruses expressing the reprogramming factors Oct4, Sox2, and Klf4, and the three H3K9 HMTases were simultaneously knocked down by siRNAs. Shown is an immunostaining for the pluripotency marker Esrrb (red), Nanog-driven GFP-fluorescence (green), and DAPI staining to mark the nuclei (blue). We conclude that reprogrammed colonies do not only exhibit the activation of the Nanog GFP reporter but also of other pluripotency markers. C) Quantification of Nanog-GFP-positive cells from 3XHMT or Cbx3 knockdown in pre-iPSCs carrying the Nanog-GFP reporter by FACS analysis. Data from duplicate experiments is presented. D) Nanog-GFP-positive, ESC-like colonies obtained upon Cbx3 knockdown in pre-iPSCs have silenced the Oct4 and Sox2 retroviruses. Semi-quantitative RT-PCR to determine expression of the retrovirally encoded Oct4 and Sox2 in pre-iPSCs and the iPSC lines Cbx3 #1 and #2 derived from these pre-iPSCs upon Cbx3 knockdown. We conclude that pre-iPSCs but not the iPSCs generated upon Cbx3 knockdown express the reprogramming factor-encoding retroviruses.
© 2013 Macmillan Publishers Limited. All rights reserved.
S U P P L E M E N TA RY I N F O R M AT I O N
4 WWW.NATURE.COM/NATURECELLBIOLOGY
295712333171
ESCs (3128)
pre-iPSCs (15290)b
e
a
Supplementary Figure 4
TSS +5kb-5kb
ESCs ESCspre-iPSCs pre-iPSCsCbx3 H3K9me3
c d
-1000 1000 2000 3000 4000
Metagene (bp)
-1000 1000 2000 3000 4000
Metagene (bp)
3.0
2.0
1.0
5.0
3.0
1.0
7.0
Aver
age
Pro
le
100 - 8080 - 6060 - 4040 - 2020 - 0Average
Percentile Expression
ESCs pre-iPSCs
Nanog
H3K9me3 pre-iPSCs
25
25
Cbx3 pre-iPSCs
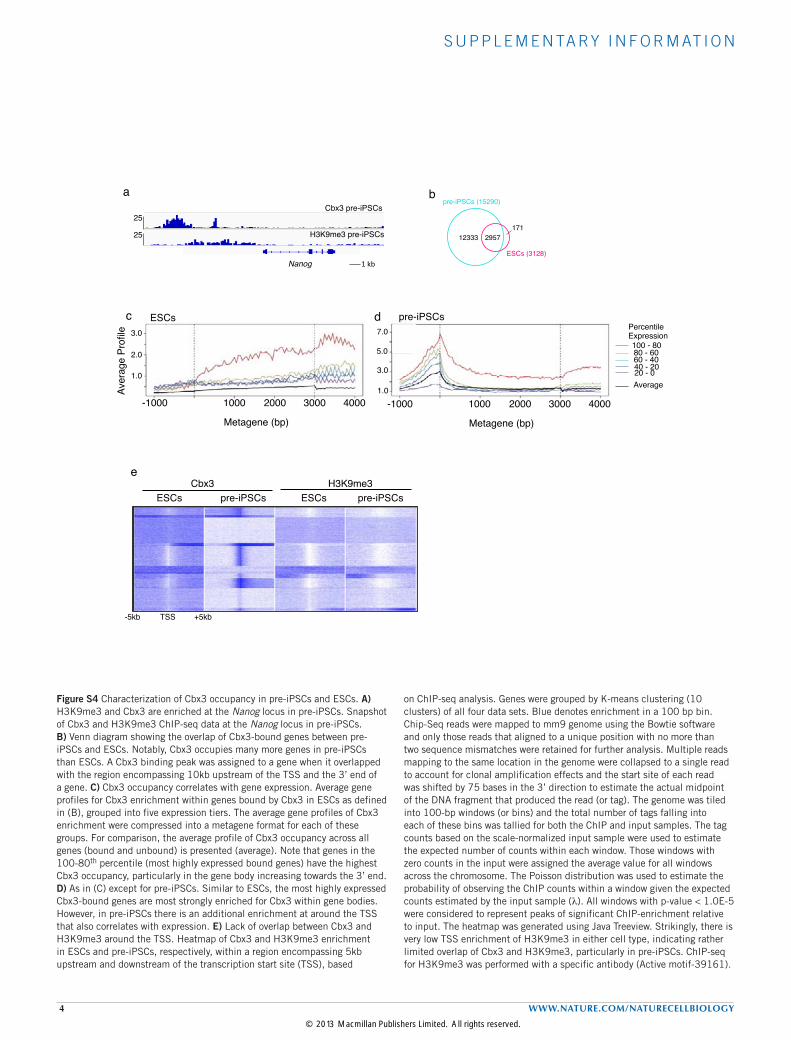
Figure S4 Characterization of Cbx3 occupancy in pre-iPSCs and ESCs. A) H3K9me3 and Cbx3 are enriched at the Nanog locus in pre-iPSCs. Snapshot of Cbx3 and H3K9me3 ChIP-seq data at the Nanog locus in pre-iPSCs. B) Venn diagram showing the overlap of Cbx3-bound genes between pre-iPSCs and ESCs. Notably, Cbx3 occupies many more genes in pre-iPSCs than ESCs. A Cbx3 binding peak was assigned to a gene when it overlapped with the region encompassing 10kb upstream of the TSS and the 3’ end of a gene. C) Cbx3 occupancy correlates with gene expression. Average gene profiles for Cbx3 enrichment within genes bound by Cbx3 in ESCs as defined in (B), grouped into five expression tiers. The average gene profiles of Cbx3 enrichment were compressed into a metagene format for each of these groups. For comparison, the average profile of Cbx3 occupancy across all genes (bound and unbound) is presented (average). Note that genes in the 100-80th percentile (most highly expressed bound genes) have the highest Cbx3 occupancy, particularly in the gene body increasing towards the 3’ end. D) As in (C) except for pre-iPSCs. Similar to ESCs, the most highly expressed Cbx3-bound genes are most strongly enriched for Cbx3 within gene bodies. However, in pre-iPSCs there is an additional enrichment at around the TSS that also correlates with expression. E) Lack of overlap between Cbx3 and H3K9me3 around the TSS. Heatmap of Cbx3 and H3K9me3 enrichment in ESCs and pre-iPSCs, respectively, within a region encompassing 5kb upstream and downstream of the transcription start site (TSS), based
on ChIP-seq analysis. Genes were grouped by K-means clustering (10 clusters) of all four data sets. Blue denotes enrichment in a 100 bp bin. Chip-Seq reads were mapped to mm9 genome using the Bowtie software and only those reads that aligned to a unique position with no more than two sequence mismatches were retained for further analysis. Multiple reads mapping to the same location in the genome were collapsed to a single read to account for clonal amplification effects and the start site of each read was shifted by 75 bases in the 3’ direction to estimate the actual midpoint of the DNA fragment that produced the read (or tag). The genome was tiled into 100-bp windows (or bins) and the total number of tags falling into each of these bins was tallied for both the ChIP and input samples. The tag counts based on the scale-normalized input sample were used to estimate the expected number of counts within each window. Those windows with zero counts in the input were assigned the average value for all windows across the chromosome. The Poisson distribution was used to estimate the probability of observing the ChIP counts within a window given the expected counts estimated by the input sample (λ). All windows with p-value < 1.0E-5 were considered to represent peaks of significant ChIP-enrichment relative to input. The heatmap was generated using Java Treeview. Strikingly, there is very low TSS enrichment of H3K9me3 in either cell type, indicating rather limited overlap of Cbx3 and H3K9me3, particularly in pre-iPSCs. ChIP-seq for H3K9me3 was performed with a specific antibody (Active motif-39161).
© 2013 Macmillan Publishers Limited. All rights reserved.

S U P P L E M E N TA RY I N F O R M AT I O N
WWW.NATURE.COM/NATURECELLBIOLOGY 5
25kDa
E N E NIPInput
Med2925kDa
25KDa
35KDaMed 6
Cbx3
25KDa15KDa
35KDa - +
Activator Input
Cbx3
Input - + 35KDa
25KDa
Activator
Med6
Supplementary Figure 5
i
ii
iii
i
ii
Med1
Rbbp5
Activator Input - +
35KDa
55KDa70KDa100KDa130KDa170KDa
iv
Cdk8
35KDa
55KDa
70KDa
100KDa130KDa170KDa
Activator Input - +iii
Figure S5 Additional characterization of the Mediator/Cbx3 interaction (unprocessed Western Blots) A) Uncropped image of the western blots presented in Fig 8B; i) Flag (Med29); ii) Cbx3; and iii) Med6. E= ESCs and N= ESC-derived neural precursors. Note that the membrane was cut before exposing to
antibody to save on reagents and samples are derived from the same experiment and that blots were processed in parallel. B) Uncropped images of western blots presented in Fig 8C; i) Cbx3; ii) Med6; iii) Cdk8; and iv) Med1, and Rbbp5. Samples were derived from the same experiment and processed in parallel.
© 2013 Macmillan Publishers Limited. All rights reserved.

S U P P L E M E N TA RY I N F O R M AT I O N
6 WWW.NATURE.COM/NATURECELLBIOLOGY
Supplementary Table Legends
Supplementary Table 1 (related to Figures 1 and 2)Summary of the levels of histone PTMs in all cell types analyzed. The information for all analyzed peptides and the relative level of all detected isoforms for each tryptic histone peptide are given. Fig 1a, 1b, 1c, 1e, 2a, 2b, 2c, S1b, S1d-f are based on these values. The average value denotes the mean of the histone PTM isoform data from two biological replicates and three technical replicates and “SD” the standard deviation.
Supplementary Table 2 (related to Figure 5)Summary of histone PTM levels upon 3XHMT, Cbx3, or control knockdown in pre-iPSCs, three days post siRNA transfection. For the 3XHMT and Cbx3 siRNA treatments, histone PTMs were determined in duplicate reactions, for control siRNA treatments in triplicate. Sheet 1 gives the relative levels of all detected isoforms for each histone peptide for each technical replicate. Sheet 2 contains the averaged data and standard deviation and, in addition, identifies significant differences in histone PTM levels between the control siRNA treatments and the siCbx3 or si3XHMT conditions. The data in this table are the source for the graphs in Figure 5
Supplementary Table 3 (related to Figure 6)Summary of microarray gene expression data for pre-iPSCs depleted for Cbx3 or 3XHMT. Sheet 1 contains the averaged expression data for ESCs, iPSCs and MEFs (taken from Sridharan et al 2009), and for all the replicates for pre-iPSCs treated with control siRNAs (3 biological replicates), siCbx3 (3 biological replicates), or si3XHMT (2 biological replicates) generated in this study. Sheet 2 and 3 contain 1.5 fold up and down regulated genes, respectively, for si3XHMT and siCbx3, respectively and are the source data for Fig 6a, 6b and 7g. Sheet 4 contains RNA-seq based expression data in ESCs and pre-iPSCs, for the set of genes differentially expressed in the 3XHMT and Cbx3 knockdown, representing the source data for Fig 6c.
Supplementary Table 4 (related to Figure 7)Summary of Cbx3 ChIP-seq data. Sheet 1 contains the locations of all peaks that are bound by Cbx3 in pre-iPSCs and ESCs, respectively and is the source data for Fig 7b, 7c and 7e Sheet 2 contains the list of genes bound by Cbx3 in pre-iPSCs and ESCs (from -10kb upstream to the transcription termination site) and their expression levels and is the source data for 7d and 7f.
© 2013 Macmillan Publishers Limited. All rights reserved.