1990-2050 sulphur dioxide emissions data from ECLIPSE v5a for use in Met Office HadCM3 family GCM
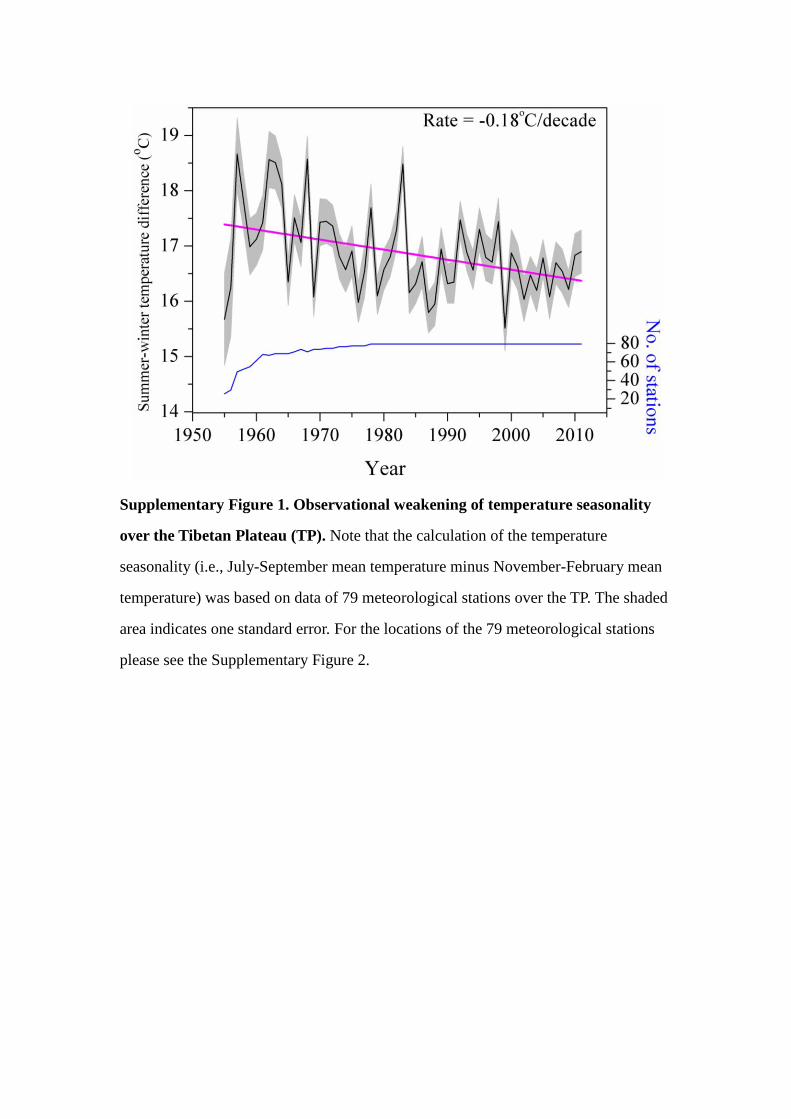
Supplementary Figure 1. Observational weakening of temperature seasonality
over the Tibetan Plateau (TP). Note that the calculation of the temperature
seasonality (i.e., July-September mean temperature minus November-February mean
temperature) was based on data of 79 meteorological stations over the TP. The shaded
area indicates one standard error. For the locations of the 79 meteorological stations
please see the Supplementary Figure 2.

Supplementary Figure 2. Locations of the 79 meteorological stations used in the
calculation of the temperature seasonality in Supplementary Figure 1. This map
was created using the software ArcMap 9.2.

Supplementary Figure 3. Individual TRW and MXD site chronologies with
sample size. (a) CD site. (b) ZG2 site. (c) RW site. (d) BD site. (e) ZG site.

Supplementary Figure 4. Climate-growth relationships of individual TRW and
MXD site chronologies with monthly temperature and precipitation. (a) CD site.
(b) RW site. (c) ZG1 site. (d) ZG2 site. (e) BD site. Left and right columns are the
correlation coefficients of individual TRW and MXD site chronologies with climate,
respectively. The three grey shaded areas highlight highly significant correlation.
“pO”, “pN” and “pD” mean previous October, November and December, respectively.
J-S means July-September, N-F means previous November to February. The
horizontal dotted lines indicate a statistical significance level of 0.01.

Supplementary Figure 5. Climate-growth relationships of the regional TRW and
MXD chronologies with climate. (a) Correlation coefficient between the detrended
regional MXD chronology and regionally monthly mean temperature and monthly
precipitation. (b) Correlation coefficient between the detrended regional TRW
chronology and regionally monthly mean temperature and monthly precipitation. “py”
means previous year, J-S means July-September, N-F means previous November to
February, horizontal dotted lines indicate a statistical significance level of 0.01. The
grey bar in a is the partial correlation coefficients of the MXD chronology with winter
temperature (i.e., previous November-February mean temperature), and in b is the
partial correlation coefficients of the TRW chronology with summer temperature (i.e.,
July-September mean temperature).

Supplementary Figure 6. Correlations and partial correlations of the regional
MXD chronology with seasonality climate variables. (a) Correlations of the
regional MXD chronology with the primary climate variable (monthly mean
temperature, T). (b) Partial correlations of the regional MXD chronology with
secondary climate variable (monthly total precipitation, P).
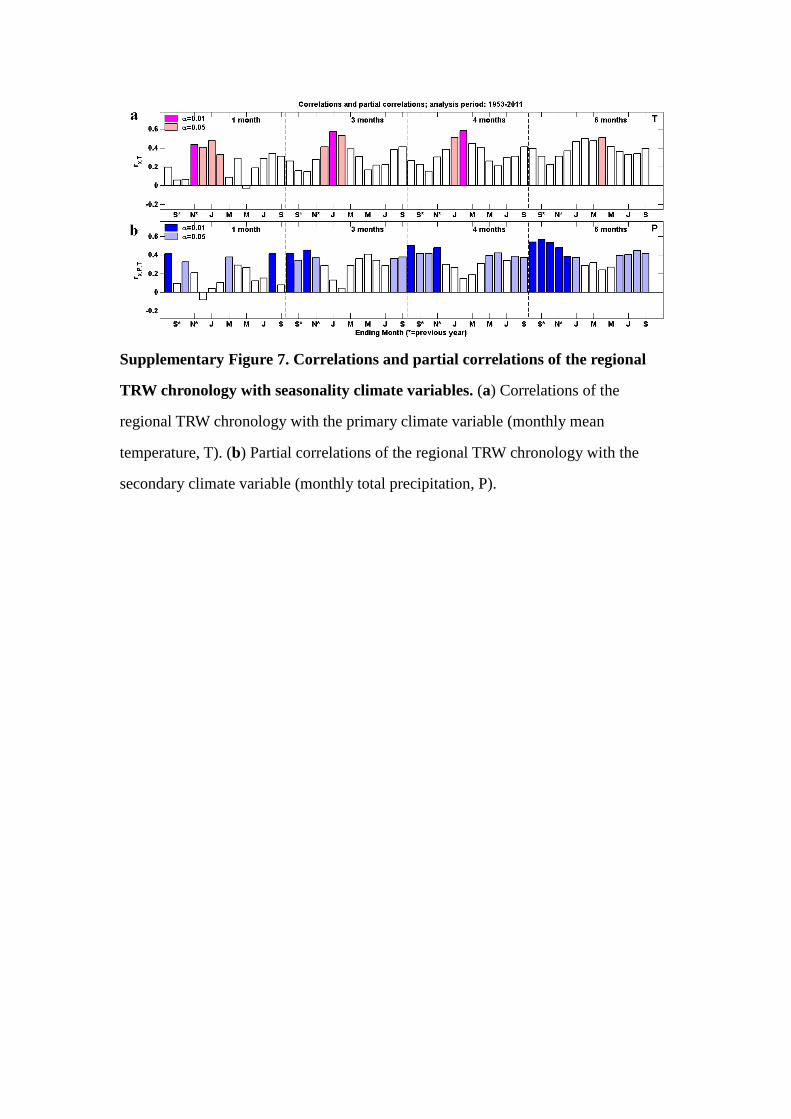
Supplementary Figure 7. Correlations and partial correlations of the regional
TRW chronology with seasonality climate variables. (a) Correlations of the
regional TRW chronology with the primary climate variable (monthly mean
temperature, T). (b) Partial correlations of the regional TRW chronology with the
secondary climate variable (monthly total precipitation, P).

Supplementary Figure 8. Regional tree-ring raw chronology and tree-ring
residual series (MXD minus TRW). (a,b) Regional TRW and MXD raw
chronologies established using the tree-ring series from 5 sampling sites (Fig. 1). (c)
Regional averaged tree-ring residual series (normalized MXD minus normalized
TRW) of all tree-ring series from the 5 sampling sites (Fig. 1). Blue shading in c
denotes 2 standard errors from the mean. (d) The sample depth. All tree samples are
ordered by the calendar age of their innermost ring.

Supplementary Figure 9. Detrended regional tree-ring residual series over the
period 1700-2011. (a) TMres1. (b) TMres2. (c) TMres3. The methods used to
establish three residual series are described in the Methods.
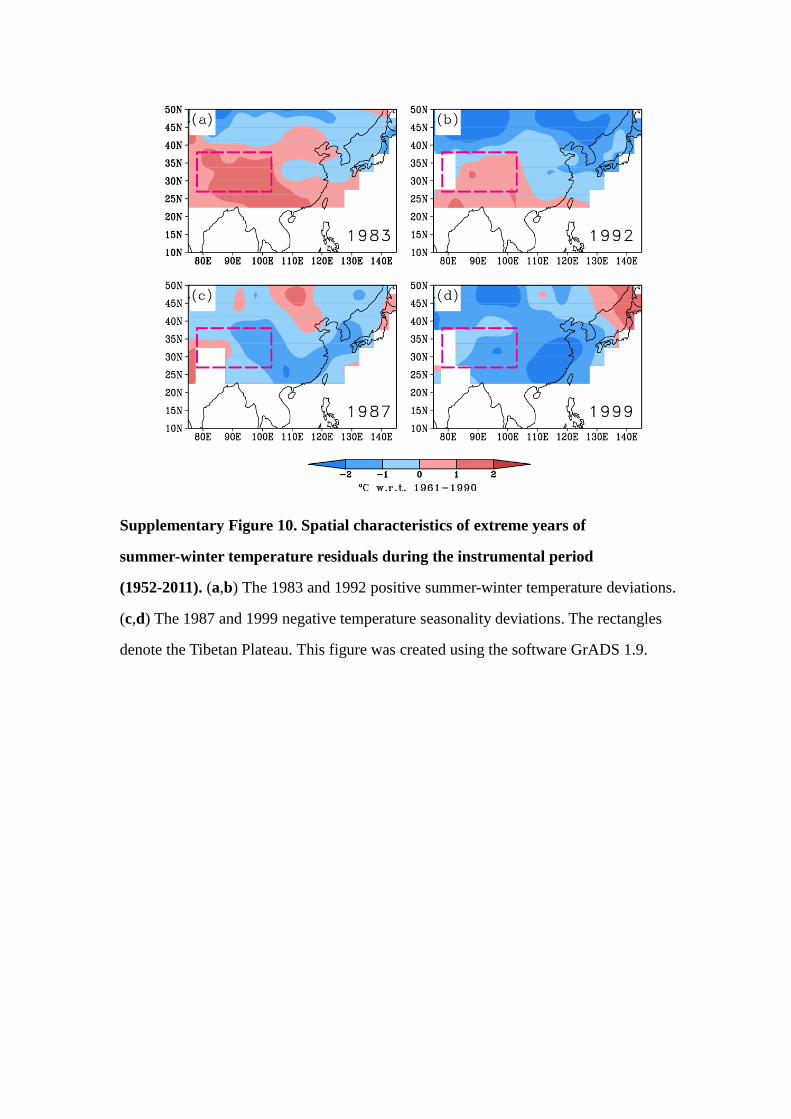
Supplementary Figure 10. Spatial characteristics of extreme years of
summer-winter temperature residuals during the instrumental period
(1952-2011). (a,b) The 1983 and 1992 positive summer-winter temperature deviations.
(c,d) The 1987 and 1999 negative temperature seasonality deviations. The rectangles
denote the Tibetan Plateau. This figure was created using the software GrADS 1.9.

Supplementary Figure 11. Data availability (i.e., number of years with data) for
calculation of the change rate of summer-winter temperature residuals in the
period 1874-2011 for each grid in Fig. 5. This figure was created using the software
GrADS 1.9.
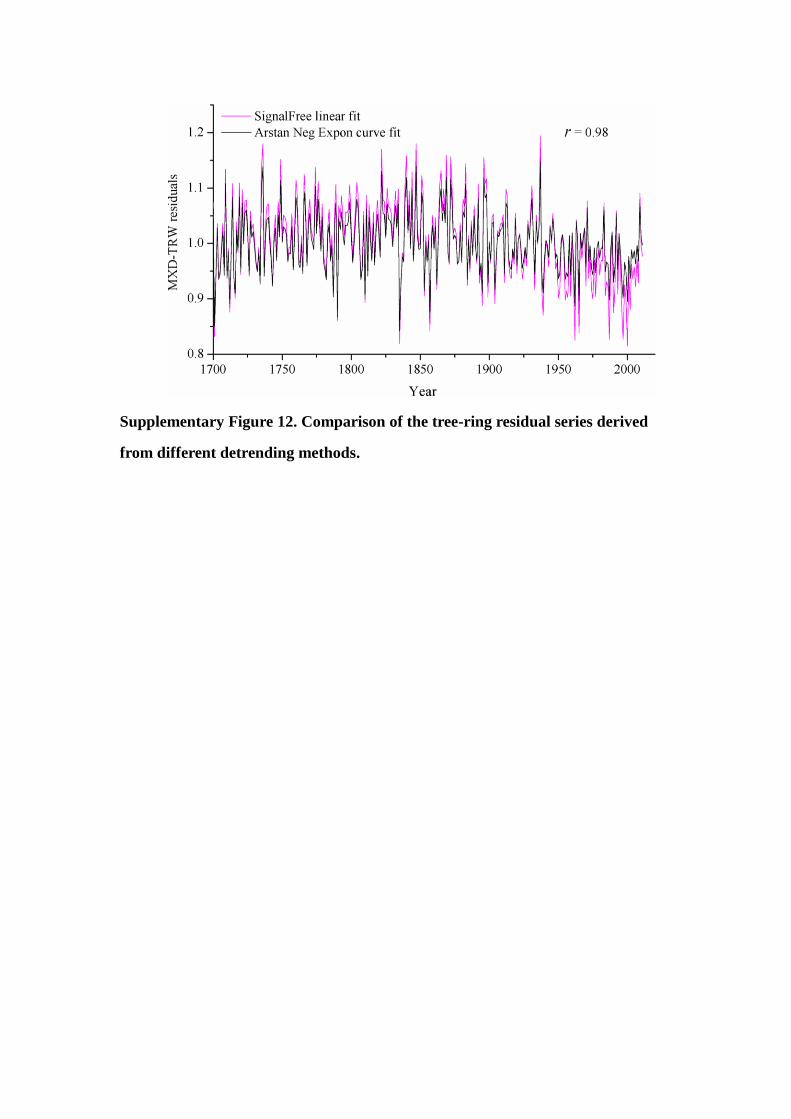
Supplementary Figure 12. Comparison of the tree-ring residual series derived
from different detrending methods.

Supplementary Table 1. Descriptions of the five tree-ring sampling sites on the
southeastern TP.
Site name Latitude/Longitude Elevation Time span Species No. of trees(cores)
ZG 29°59′N/97°55′E 3900-4100m 1509-2010 Balfour spruce 69
BD 30°05′N/97°25′E 4200-4305m 1512-2011 Balfour spruce 20
RW 29°31′N/96°45′E 4280-4337m 1635-2010 Balfour spruce 25
CD 31°04′N/96°58′E 4150m 1688-2000 Balfour spruce 19(33)
ZG2 29°59′N/97°54′E 4500m 1653-2000 Balfour spruce 20(28)
Note: the site information for ZG and BD was also listed in our previous publication1,
and site information for CD and ZG2 are also available in our previous paper2.

Supplementary Table 2. Correlation coefficients among the individual TRW site
chronologies.
CD_TRW RW_TRW ZG1_TRW ZG2_TRW
RW_TRW r=0.66,
p<0.0001
n=301
ZG1_TRW r=0.60,
p<0.0001,
n=301
r=0.63,
p<0.0001,
n=311
ZG2_TRW r=0.55,
p<0.0001,
n=301
r=0.48,
p<0.0001,
n=301
r=0.59,
p<0.0001,
n=301
BD_TRW r=0.47,
p<0.0001,
n=301
r=0.51,
p<0.0001,
n=311
r=0.65,
p<0.0001,
n=311
r=0.57,
p<0.0001,
n=301

Supplementary Table 3. Correlation coefficients among the individual MXD site
chronologies.
CD_MXD RW_MXD ZG1_MXD ZG2_MXD
RW_MXD r=0.49
p<0.0001
n=301
ZG1_MXD r=0.42
p<0.0001
n=301
r=0.28
p<0.0001
n=311
ZG2_MXD r=0.68
p<0.0001
n=301
r=0.49
p<0.0001
n=301
r=0.53
p<0.0001
n=301
BD_MXD r=0.38
p<0.0001
n=301
r=0.25
p<0.0001
n=311
r=0.67
p<0.0001
n=311
r=0.44
p<0.0001
n=301

Supplementary Table 4. Correlation coefficients between tree-ring residual series
(TMres1, 2 and 3) and instrumental temperature residuals (i.e., summer
temperature minus winter temperature) in individual station of the study area
and the regional average over their common period.
Meteorological
station
Latitude Longitude Altitude
(m asl)
Period r1 r2 r3
Nangqian 32o12′N 96o29′E 3644 1958-2011 0.47 0.41 0.45
Batang 30o00′N 99o06′E 2589 1960-2011 0.64 0.61 0.62
Daocheng 29o03′N 100o18′E 3728 1958-2011 0.51 0.50 0.48
Dege 31o48′N 98o35′E 3184 1958-2011 0.55 0.52 0.53
Garze 31o37′N 100o00′E 3394 1952-2011 0.44 0.37 0.43
Litang 30o00′N 100o16′E 3949 1953-2011 0.49 0.40 0.49
Xinlong 30o56′N 100o19′E 3000 1961-2011 0.65 0.62 0.62
Bomi 29o52′N 95o46′E 2736 1962-2011 0.54 0.47 0.52
Zayu 28o39′N 97o28′E 2328 1970-2011 0.52 0.45 0.51
Qamdo 31o09′N 97o10′E 3306 1955-2011 0.65 0.65 0.62
Dengqen 31o25′N 95o36′E 3873 1961-2011 0.50 0.46 0.48
Nyingchi 29o40′N 94o20′E 2992 1961-2011 0.53 0.45 0.52
Zuogang 29o40′N 97o50′E 3780 1979-2011 0.62 0.60 0.59
Regional average 1952-2011 0.61 0.56 0.58
r1: correlation coefficient between TMres1 and summer-minus-winter temperature
residuals; r2: correlation coefficient between TMres2 and summer-minus-winter
temperature residuals; r3: correlation coefficient between TMres3 and
summer-minus-winter temperature residuals. Note: all the correlation coefficients are
significant at the level of 0.01. All correlation coefficients were calculated based on
the normalized series.

Supplementary Table 5. Statistics of the calibration and verification for the
regression models.
Calibration Verification
Season Period R2 F RE ST ST1 PMT
Summer 1952-2011 54.8% 70.1 0.51 42+/18- 44+/15- 4.60
Winter 1952-2011 32.5% 26.5 0.25 40+/19- 40+/20-* 3.75
Summer-Winter 1955-2011 42.3% 32.2 0.30 44+/13- 38+/18-* 1.96
RE = reduction error, ST= sign test, ST1= first-difference sign test, PMT = product
mean test. The asterisk means at the significant level of 0.05, and all the other
statistics are significant at the level of p < 0.01.
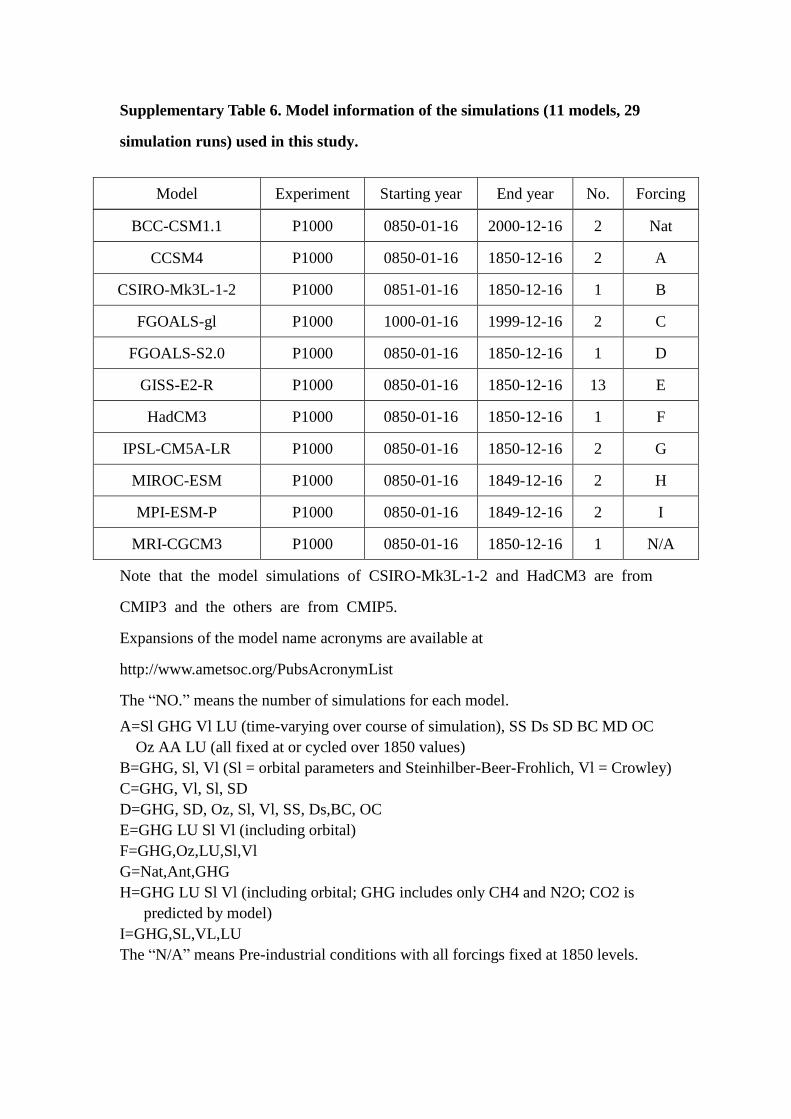
Supplementary Table 6. Model information of the simulations (11 models, 29
simulation runs) used in this study.
Model Experiment Starting year End year No. Forcing
BCC-CSM1.1 P1000 0850-01-16 2000-12-16 2 Nat
CCSM4 P1000 0850-01-16 1850-12-16 2 A
CSIRO-Mk3L-1-2 P1000 0851-01-16 1850-12-16 1 B
FGOALS-gl P1000 1000-01-16 1999-12-16 2 C
FGOALS-S2.0 P1000 0850-01-16 1850-12-16 1 D
GISS-E2-R P1000 0850-01-16 1850-12-16 13 E
HadCM3 P1000 0850-01-16 1850-12-16 1 F
IPSL-CM5A-LR P1000 0850-01-16 1850-12-16 2 G
MIROC-ESM P1000 0850-01-16 1849-12-16 2 H
MPI-ESM-P P1000 0850-01-16 1849-12-16 2 I
MRI-CGCM3 P1000 0850-01-16 1850-12-16 1 N/A
Note that the model simulations of CSIRO-Mk3L-1-2 and HadCM3 are from
CMIP3 and the others are from CMIP5.
Expansions of the model name acronyms are available at
http://www.ametsoc.org/PubsAcronymList
The “NO.” means the number of simulations for each model.
A=Sl GHG Vl LU (time-varying over course of simulation), SS Ds SD BC MD OC
Oz AA LU (all fixed at or cycled over 1850 values)
B=GHG, Sl, Vl (Sl = orbital parameters and Steinhilber-Beer-Frohlich, Vl = Crowley)
C=GHG, Vl, Sl, SD
D=GHG, SD, Oz, Sl, Vl, SS, Ds,BC, OC
E=GHG LU Sl Vl (including orbital)
F=GHG,Oz,LU,Sl,Vl
G=Nat,Ant,GHG
H=GHG LU Sl Vl (including orbital; GHG includes only CH4 and N2O; CO2 is
predicted by model)
I=GHG,SL,VL,LU
The “N/A” means Pre-industrial conditions with all forcings fixed at 1850 levels.

Supplementary references
1. Duan, J. P. & Zhang, Q. B. A 449 year warm season temperature reconstruction in the
southeastern Tibetan Plateau and its relation to solar activity. J Geophys Res-Atmos 119,
11578-11592 (2014).
2. Wang, L., Duan, J. P., Chen, J., Huang, L. & Shao, X. M. Temperature reconstruction from
tree-ring maximum density of Balfour spruce in eastern Tibet, China. Int J Climatol 30,
972-979 (2010).