Supplemental Material for: Crystallization processes …iffjones/gst16_SI.pdf · Supplemental...
8
Supplemental Material for: Crystallization processes in the phase change material Ge 2 Sb 2 Te 5 : Unbiased density functional/ molecular dynamics simulations J. Kalikka, 1,2 J. Akola, 2,3 and R. O. Jones 4 1 Singapore University of Technology and Design, 8 Somapah Road, Singapore 487372 2 Department of Physics, Tampere University of Technology, P.O. Box 692, FI-33101 Tampere, Finland 3 COMP Centre of Excellence, Department of Applied Physics, Aalto University, FI-00076 Aalto, Finland 4 Peter-Gr¨ unberg-Institut PGI-1 and JARA/HPC, Forschungszentrum J¨ ulich, D-52425 J¨ ulich, Germany The Supplemental Material shows the view of the final structure of run1 along the z -axis (Fig. SF1), the vibrational densities of states and the corresponding inverse participation ratios (IPR) at the end of run1 - 3 (Fig. SF2), the electronic densities of states and IPR for the same structures (Fig. SF3), and the same information on an expanded scale near the Fermi energy (Fig. SF4). The remaining three figures compare the experimental [neutron (ND) 1 and x-ray (XRD) 2 diffraction] total pair distribution functions G(r) with those calculated for the final structures of run1 (Fig. SF5), run2 (Fig. SF6), and run3 (Fig. SF7). 1 S. Shamoto, K. Kodama, S. Iikubo, T. Taguchi, N. Yamada, and T. Proffen, Jpn. J. Appl. Phys. 45, 8789 (2006). 2 S. Kohara, K. Kato, S. Kimura, H. Tanaka, T. Usuki, K. Suzuya, H. Tanaka, Y. Moritomo, T. Matsunaga, N. Yamada, Y. Tanaka, H. Suematsu, and M. Takata, Appl. Phys. Lett. 89, 201910 (2006). 1
Transcript of Supplemental Material for: Crystallization processes …iffjones/gst16_SI.pdf · Supplemental...
Supplemental Material for:
Crystallization processes in the phase change material Ge2Sb2Te5:
Unbiased density functional/ molecular dynamics simulations
J. Kalikka,1,2 J. Akola,2,3 and R. O. Jones4
1 Singapore University of Technology and Design, 8 Somapah Road, Singapore 487372
2 Department of Physics, Tampere University of Technology, P.O. Box 692, FI-33101 Tampere, Finland
3 COMP Centre of Excellence, Department of Applied Physics, Aalto University, FI-00076 Aalto, Finland
4 Peter-Grunberg-Institut PGI-1 and JARA/HPC, Forschungszentrum Julich, D-52425 Julich, Germany
The Supplemental Material shows the view of the final structure of run1 along the z-axis (Fig.
SF1), the vibrational densities of states and the corresponding inverse participation ratios (IPR)
at the end of run1−3 (Fig. SF2), the electronic densities of states and IPR for the same structures
(Fig. SF3), and the same information on an expanded scale near the Fermi energy (Fig. SF4). The
remaining three figures compare the experimental [neutron (ND)1 and x-ray (XRD)2 diffraction]
total pair distribution functions G(r) with those calculated for the final structures of run1 (Fig.
SF5), run2 (Fig. SF6), and run3 (Fig. SF7).
1 S. Shamoto, K. Kodama, S. Iikubo, T. Taguchi, N. Yamada, and T. Proffen, Jpn. J. Appl. Phys.
45, 8789 (2006).
2 S. Kohara, K. Kato, S. Kimura, H. Tanaka, T. Usuki, K. Suzuya, H. Tanaka, Y. Moritomo, T.
Matsunaga, N. Yamada, Y. Tanaka, H. Suematsu, and M. Takata, Appl. Phys. Lett. 89, 201910
(2006).
1
FIG. 1. [SF1] Optimized structure of run1 (2× 2× 2 replicas) viewed along the z-axis. Crystalline
atoms: ball-and-stick (Ge: brown, Sb: gray, Te: cyan), amorphous atoms thin lines (Ge: green,
Sb: purple, Te: orange).
2

0
2
4
6
8
10
12
14
0 25 50 75 100 125 150 175 200 225 250 0.001
0.01
0.1
1
VD
OS
(a.u
.)
IPR
(a.u
.)
Frequency (cm−1
)
Run 1 VIPRRun 1 VDOS
0
2
4
6
8
10
12
14
0 25 50 75 100 125 150 175 200 225 250 0.001
0.01
0.1
1
VD
OS
(a.u
.)
IPR
(a.u
.)
Frequency (cm−1
)
Run 2 VIPRRun 2 VDOS
0
2
4
6
8
10
12
14
0 25 50 75 100 125 150 175 200 225 250 0.001
0.01
0.1
1
VD
OS
(a.u
.)
IPR
(a.u
.)
Frequency (cm−1
)
Run 3 VIPRRun 3 VDOS
FIG. 2. [SF2] Vibrational densities of states (VDOS, left scale) and vibrational inverse participation
ratios (VIPR, logarithmic right scale) for structures at completion of run1 − 3 (top to bottom).
3

0
0.01
0.02
0.03
0.04
0.05
0.06
0.07
0.08
0.09
0.1
−14 −12 −10 −8 −6 −4 −2 0 2 0.001
0.01
0.1
1
ED
OS
(a.u
.)
IPR
(a.u
.)
Energy (eV)
Run 1 EIPRRun 1 EDOS
0
0.02
0.04
0.06
0.08
0.1
0.12
−14 −12 −10 −8 −6 −4 −2 0 2 0.001
0.01
0.1
1
ED
OS
(a.u
.)
IPR
(a.u
.)
Energy (eV)
Run 2 EIPRRun 2 EDOS
0
0.01
0.02
0.03
0.04
0.05
0.06
0.07
0.08
0.09
0.1
−14 −12 −10 −8 −6 −4 −2 0 2 0.001
0.01
0.1
1
ED
OS
(a.u
.)
IPR
(a.u
.)
Energy (eV)
Run 3 EIPRRun 3 EDOS
FIG. 3. [SF3] Electronic densities of states (eDOS, left scale) and electronic inverse participation
ratio (IPR, logarithmic right scale) for run1 − 3 (top to bottom).
4

0
0.005
0.01
0.015
0.02
0.025
0.03
0.035
0.04
0.045
0.05
−0.5 0 0.5 0.001
0.01
0.1
ED
OS
(a.u
.)
IPR
(a.u
.)
Energy (eV)
Run 1 EIPRRun 1 EDOS
0
0.01
0.02
0.03
0.04
0.05
0.06
−0.5 0 0.5 0.001
0.01
0.1
ED
OS
(a.u
.)
IPR
(a.u
.)
Energy (eV)
Run 2 EIPRRun 2 EDOS
0
0.01
0.02
0.03
0.04
0.05
0.06
−0.5 0 0.5 0.001
0.01
0.1
ED
OS
(a.u
.)
IPR
(a.u
.)
Energy (eV)
Run 3 EIPRRun 3 EDOS
FIG. 4. [SF4] Detail of Fig. 3 [SF3] in the neighborhood of the Fermi energy.
5
−3
−2
−1
0
1
2
3
4
5
6
7
8
9
10
11
12
2 4 6 8 10
G(r
)
r (Å)
c−Ge2Sb
2Te
5
run1
ND
(a)
(b)
XRD
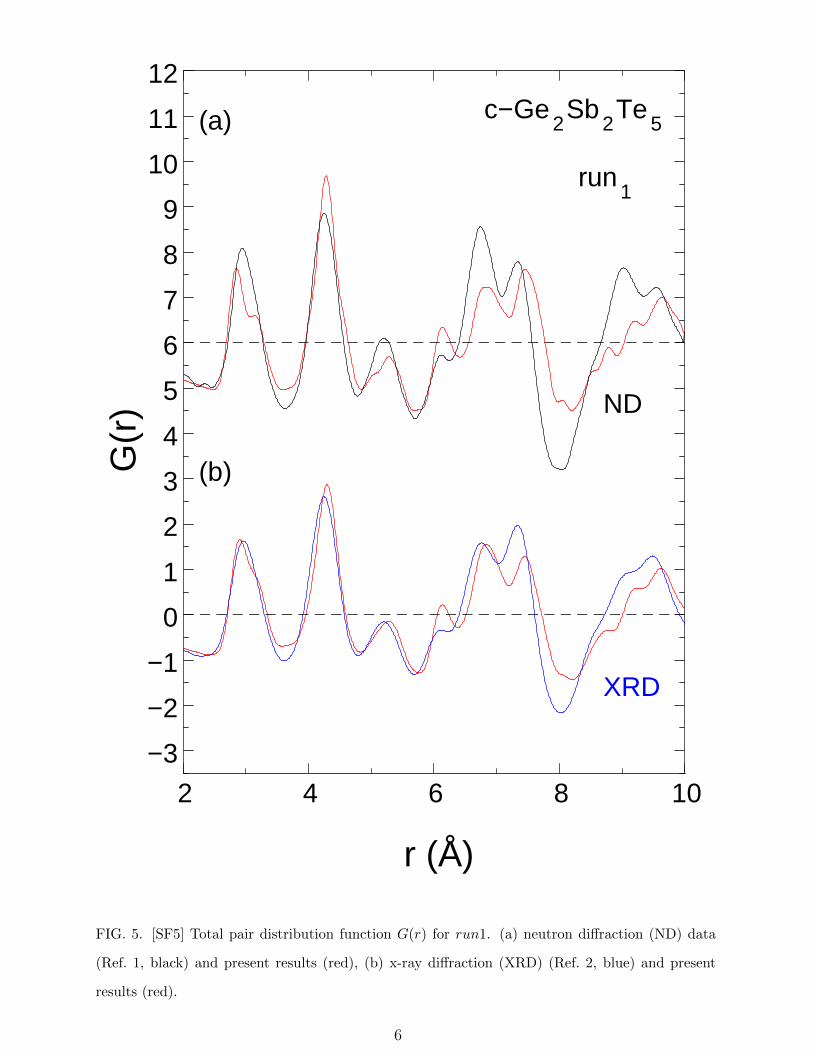
FIG. 5. [SF5] Total pair distribution function G(r) for run1. (a) neutron diffraction (ND) data
(Ref. 1, black) and present results (red), (b) x-ray diffraction (XRD) (Ref. 2, blue) and present
results (red).
6

−3
−2
−1
0
1
2
3
4
5
6
7
8
9
10
11
12
2 4 6 8 10
G(r
)
r (Å)
c−Ge2Sb
2Te
5
run2
ND
(a)
(b)
XRD
FIG. 6. [SF6] Total pair distribution function G(r) for run2. (a) neutron diffraction (ND) data
(Ref. 1, black) and present results (red), (b) x-ray diffraction (XRD) (Ref. 2, blue) and present
results (red).
7

−3
−2
−1
0
1
2
3
4
5
6
7
8
9
10
11
12
2 4 6 8 10
G(r
)
r (Å)
c−Ge2Sb
2Te
5
run3
ND
(a)
(b)
XRD
FIG. 7. [SF7] Total pair distribution function G(r) for run3. (a) neutron diffraction (ND) data
(Ref. 1, black) and present results (red), (b) x-ray diffraction (XRD) (Ref. 2, blue) and present
results (red).
8