SUPPLEMENT TO ORANGE COUNTY’S ANNUAL...
154
SUPPLEMENT TO ORANGE COUNTY’S ANNUAL REPORT TO THE STATE FOR FISCAL YEAR 2016/17
-
Upload
trinhxuyen -
Category
Documents
-
view
218 -
download
0
Transcript of SUPPLEMENT TO ORANGE COUNTY’S ANNUAL...

SUPPLEMENT TO ORANGE COUNTY’S ANNUAL REPORT TO THE STATE FOR
FISCAL YEAR 2016/17

TableofContentsBackground ............................................................................................................................................ 1
Orange County Demographics and Trends ...................................................................................... 2
Financial ............................................................................................................................................... 12
Sustainability Strategies ...................................................................................................................... 16
Strategic Partnerships ......................................................................................................................... 17
Systems Change ................................................................................................................................... 19
Detailed Program Outcomes ............................................................................................................ 21
Commission-Wide Data ..................................................................................................................... 24
Description of Children Served in FY 16/17 Based on Client Level Data ................. 24
Services Provided by All Commission-Funded Programs .............................................. 26
Service Outcomes for All Commission-Funded Programs ............................................ 30
Commission-Funded Grantees’ Intake and Exit Surveys ............................................... 32
CommissionInitiativeReportsHealthy Children
• Bridges Maternal Child Health Network • School Readiness Nursing • Children’s Dental • Community Health • Pediatric Health Services
Strong Families • Homeless Prevention • Family Support Services • Neighborhood Resource Network
Early Learning • Early Learning Specialists • Early Learning Math and Literacy • OC Reads • Readiness on the Road • OC STEM Initiative • Quality Start OC • Early Development Index

2016-17 Annual Report Supplement Page 1 of 33
CHILDREN AND FAMILIES COMMISSION OF ORANGE COUNTY (COMMISSION)
SUPPLEMENT TO THE ANNUAL REPORT TO THE STATE JULY 1, 2016 – JUNE 30, 2017
This supplemental report describes the Commission’s investments in the programs it funds and the outcome of those investments. It also documents barriers to young children and the Commission’s actions, programs and recommendations to advance the Commission’s vision of an Orange County in which all young children are healthy and ready to learn. Fiscal Year 2016/17 Snapshot The Children and Families Commission of Orange County is a leader in the development of programs, policy and best practices furthering the health and well-being of children from birth to age five. During Fiscal Year 2016/17, the Commission:
• Funded more than 96 organizations to help support more than 150 programs serving thousands of children, families and providers.
• Provided more than 1.8 million services to children ages 0 – 5. • More than 14,000 children ages 0 – 5 received developmental and/ or behavioral
screenings.
Background California voters passed Proposition 10, the California Children and Families First Act, in 1998. The Act provided for a 50 cent per pack excise tax on cigarettes. The monies collected are restricted to funding parent education, health, and early care programs that promote early childhood development from the prenatal stage through age five.
The Act enabled the Board of Supervisors in each county to establish its own Commission. On December 15, 1998, the Orange County Board of Supervisors adopted County Ordinance No. 98-18, creating the Children and Families Commission of Orange County.
In February 2000, the Children and Families Commission of Orange County adopted its first Strategic Plan to become eligible for Proposition 10 tobacco tax revenue allocations. The Strategic Plan outlines the Commission’s goals, outcomes, indicators and objectives, and guides its funding decisions. The Strategic Plan is reviewed annually in a public hearing.
The Commission’s mission is to: Provide leadership, funding and support for programs that achieve the vision that all children are healthy and ready to learn. Four goals are defined in the Strategic Plan:

2016-17 Annual Report Supplement Page 2 of 33
1. Healthy Children: Promote the overall physical, social, emotional and intellectual health of young children.
2. Strong Families: Support and strengthen families to promote good parenting for the optimal development of young children.
3. Early Learning: Provide early learning opportunities for young children to maximize their potential to succeed in school.
4. Capacity Building: Promote an effective and quality delivery system for young children and their families.
Orange County Demographics and Trends
IN 2016, THE NUMBER OF BIRTHS DECREASED WHILE THE NUMBER OF CHILDREN 0-5 IN ORANGE COUNTY INCREASED.
Births
Source: County of Orange Health Care Agency, Family Health Division
• There were 40,827 live births in Orange County in 2015. • This represents a five-year decrease of 0.8% in the number of live births in the
county.
41,166 40,876 40,083 41,625 40,827
0
5,000
10,000
15,000
20,000
25,000
30,000
35,000
40,000
45,000
2011 2012 2013 2014 2015
Number of Live Births Orange County, 2011-2015

2016-17 Annual Report Supplement Page 3 of 33
Children under Age Six
Source: California Department of Finance, Demographic Research Unit, Report P-3
• In 2016, there were an estimated 225,146 children ages five years and younger in Orange County, a slight increase over the previous year.
• In 2016, 7.1% of the total population in Orange County was ages five years or younger.
MORE FAMILIES WITH CHILDREN UNDER THE AGE OF 18 ARE LIVING IN POVERTY.
Poverty
Source: American Community Survey, 5-Year Estimates
228,312 226,557 224,251 224,670 225,146
0
50,000
100,000
150,000
200,000
250,000
2012 2013 2014 2015 2016
Number of Children Birth to Age Five Orange County, 2012-2016
7.6% 8.3% 8.8% 9.2% 9.1%
11.2% 12.3%
13.1% 13.7% 13.7%
0%
2%
4%
6%
8%
10%
12%
14%
16%
2011 2012 2013 2014 2015
Poverty Status of Families Orange County, 2011-2015
Families Living in Poverty Families with Related Children under 18 Living in Poverty

2016-17 Annual Report Supplement Page 4 of 33
• The California Poverty Measure, which has a broad definition of family and makes geographic adjustment for housing costs, estimates that 27.0% of Orange County’s children are living below the poverty line (Public Policy Institute of California).
• In 2015, 9.1% of families in Orange County were living below the Federal poverty line.
• The poverty rate in Orange County is even higher for families who have related children under age 18 (13.7%).
• At 19.4% and 17.3%, the cities of Santa Ana and Stanton have the highest rates of families living in poverty, respectively.
Percentage of Families Living in Poverty Orange County, 20151
Source: American Community Survey, 5-Year Estimates
1 Ranges in the maps included in this report are set using 0.5 standard deviation from county averages.

2016-17 Annual Report Supplement Page 5 of 33
THERE HAS BEEN AN INCREASE IN HEALTH INSURANCE COVERAGE AMONG CHILDREN 0-5. Publ i c Health Insurance
• In 2015, 40.4% of children from birth through age five in Orange County had public health insurance.
• This is an increase from 2014, when 38.7% of children birth through age five had public health insurance.
• The areas of Santa Ana, Midway City, and Garden Grove have the highest percentage of children from birth through age five receiving public insurance (71%, 68%, and 59%, respectively).
Percent of Children under Age Six with Public Insurance Orange County, 2015

2016-17 Annual Report Supplement Page 6 of 33
Source: American Community Survey, 5-Year Estimates
NINE IN 10 CHILDREN ARE ADEQUATELY IMMUNIZED UPON ENROLLING IN SCHOOL. Immunizat ions2
2 Includes both public and private schools in Orange County.

2016-17 Annual Report Supplement Page 7 of 33
Source: Kindergarten Retrospective Survey Results California Department of Health Services, Immunization Branch
• In the 2016/17 school year, 95.5% of children had all the required immunizations upon kindergarten entry.
• This is an increase of six percentage points since 2013 and is likely the result of Senate Bill 277, signed into law June 2015, which removes personal belief exemptions to vaccination requirements for entry to private or public elementary or secondary schools in California, as well as child day care centers.
• The school districts of Laguna Beach and Capistrano have the lowest rate of children up-to-date on their immunization at kindergarten entry (87.8% and 89.5%, respectively).
Percent of Children Up-to-Date on their Immunizations at Kindergarten Entry Orange County, 2016/17 School Year
89.3% 88.7% 90.1% 92.5% 95.5%
0%
20%
40%
60%
80%
100%
2013 2014 2015 2016 2017
Percent of Children Up-to-Date on ImmunizaTons at Kindergarten Entry Orange County, 2013-2017

2016-17 Annual Report Supplement Page 8 of 33
Source: Kindergarten Retrospective Survey Results California Department of Health Services, Immunization Branch

2016-17 Annual Report Supplement Page 9 of 33
2016 MARKS A FIVE-YEAR DROP IN SUBSTANTIATED CHILD MALTREATMENT REPORTS Chi ld Abuse and Foster Care
Source: University of California Berkeley, Center for Social Services Research (CSSR), Child Welfare Research Center. The Center for Social Services Research continually refines its data reporting, thus the figures presented in this chart do not necessarily align with the data presented in the 2015-16 Annual Report supplement.
• There has been a 17% decrease in substantiated child maltreatment reports over the past five years.
• In 2016, there were 9.5 substantiated child maltreatment reports per 1,000 children from birth through age five in Orange County.
• In 2016, there were 2.7 foster care entries per 1,000 children from birth through age five in Orange County.
o This rate has remained relatively unchanged over a five-year period.
LESS THAN HALF OF THIRD GRADE STUDENTS MEET OR EXCEED THE STATEWIDE ACHIEVEMENT STANDARD FOR LITERACY.
Third Grade Engl ish Language Arts and Mathematics
The California Department of Education has adopted new, online, end-of-year assessments of grade-level learning that measure progress toward college and career readiness. This Smarter Balance Assessment is aligned with the Common Core State Standards. 2015/16 is the second year data are available.3
Third grade test results vary significantly by district:
3 At that time of completion of the Supplemental Report, 2016/17 Smarter Balance data were still not
available.
11.4 10.3 10.6 10.9
9.5
2.7 2.4 2.7 2.8 2.7
0
2
4
6
8
10
12
2012 2013 2014 2015 2016
SubstanTated Reports and Foster Care Entries Entries (Rate per 1,000 Children Under Age Six) Orange County, 2012-2016
SubstanTated Reports Foster Care Entries

2016-17 Annual Report Supplement Page 10 of 33
o English Language Arts/Literacy: § Laguna Beach and Los Alamitos school districts had the highest rate of
third graders meeting or exceeding standards (81% and 83 %, respectively) § Anaheim City and Santa Ana school districts had the lowest proportion of
third graders meeting or exceeding standards (21% and 22%, respectively) o Mathematics:
§ Los Alamitos and Laguna Beach school districts had the highest rate of third graders meeting or exceeding standards (90% and 81%, respectively)
§ Anaheim City and Santa Ana school districts had the lowest proportion of third graders meeting or exceeding standards (27% and 30%, respectively)
Percentage of Third Graders Meeting or Exceeding Standards on Smarter Balanced Test Scores, English Language Arts/ Literacy, Orange County, 2015/16
Source: California Department of Education, DataQuest

2016-17 Annual Report Supplement Page 11 of 33
Percentage of Third Graders Meeting or Exceeding Standards on Smarter Balanced Test Scores, Mathematics Orange County, 2015/16
Source: California Department of Education, DataQuest

2016-17 Annual Report Supplement Page 12 of 33
• Less than half (49%) of third graders in Orange County met or exceeded standards in English Language Arts/ Literacy.
• Slightly more than half (55%) of third graders met or exceeded standards in Mathematics.
Source: California Department of Education, DataQuest
Financial Recognizing that the Commission operates within an environment of declining revenue, a Long Term Financial Plan was initially developed in 2001 to identify strategies to maximize the funding potential of Proposition 10 revenues, identify leveraging strategies and promote program sustainability. The 10-year financial projections are reviewed annually by the Commission prior to any budgetary action to ensure that budget decisions are considered with a long-term perspective.
Commission revenue is projected to decrease in the next ten years, as tobacco consumption declines, from $25,202,927 in annual revenues in fiscal year 2017/18 to $21,125,073 annual revenue by fiscal year 2021/22. Actual revenue decreased 15% in 2016/17 and Proposition 10 tobacco tax revenue is projected to continue to decline at an average annual rate of 3.5%. The Commission supplements the decline in annual revenue through annual withdrawals from its Long-Term Commitment account. This account, however, is expected to be fully exhausted within the next six years.
27% 22%
24% 23%
21% 30%
28% 25%
0%
20%
40%
60%
80%
100%
EnglishLanguageArts/Literacy Mathema<cs
SmarterBalanceEnglishLanguageArts/LiteracyandMathemaJcsTestResults,ThirdGradeOrangeCounty,2015/16
StandardsNotMet StandardsNearlyMet StandardsMet StandardsExceeded

2016-17 Annual Report Supplement Page 13 of 33
Passage o f Proposi t ion 56
On November 8, 2016, California voters approved Proposition 56 increasing the cigarette tax by $2.00 per pack. The definition of tobacco products under the tax code now includes cigarettes, smokeless tobacco, cigars and e-cigarettes. Tobacco tax revenue received by the Commission will be effected in two ways. Proposition 56 includes a backfill provision for potential reduced tobacco sales due to higher prices, and additional revenue will be received due to the expanded definition of tobacco products.
Early estimates of new tobacco tax revenues are more than $1 billion statewide. Using information from the Legislative Analyst Office, First 5 California prepared preliminary estimates of how the impact of raising the smoking age from 18 to 21, implementing a new annual licensing fee along with the passage of Proposition 56 may effect revenues. The following table lists the estimates for First 5 California and the five largest counties.
Tobacco Legislation and Measures: Estimated Revenue (in dollars) Annual
Licensing Fee
Age Increase to 21
Total already assumed in the LTFP
$2 Tax Increase
Expanded Definition of
Tobacco Products
Total Impact
First 5 CA $920,000 $-4,902,000 $-3,982,000 Neutral $6,000,000 $2,018,000 Los Angeles $952,242 $-5,073,794 $-4,121,552 Neutral $6,210,274 $2,088,722 San Diego $326,286 $-1,738,539 $-1,412,253 Neutral $2,127,955 $715,702 Orange $282,490 $-1,505,180 $-1,222,690 Neutral $1,842,326 $619,636 San Bernardino $229,050 $-1,220,439 $-991,389 Neutral $1,493,806 $502,417 Riverside $221,478 $-1,180,091 $-958,613 Neutral $1,444,419 $485,806
$0
$5
$10
$15
$20
$25
$30
$35
2016/17 Actuals 2017/18 Budget 2018/19 2019/20 2020/21 2021/22
In M
illio
ns
Commission Long Term Financial Plan update with Fiscal Year 2016/17 Actual Revenue and Expenses Fiscal Years 2016/17 - 2021/22
Projected Revenues Projected Expenses Year-End Fund Balance

2016-17 Annual Report Supplement Page 14 of 33
At this time, there are no recommended changes to revenue projections in the Long-Term Financial Plan. Revenue will be closely monitored over the months leading to the effective date of Proposition 56 and the final three months of the fiscal year while the new tax is in effect. It may not be until later in fiscal year 2017/18 that the true impact of recent legislation and Proposition 56 can be measured and realized. Updates and recommendations will be provided as new information becomes available and actual revenues are received over the next several months.
Revenue
Actual revenue declined 15% in fiscal year 2016/17 and Proposition 10 tobacco tax revenue is projected to continue to decline annually at an average annual rate between 3.5% and 4%.
Program Funding
Recognizing the steady decline in tobacco tax revenue, the Long-Term Financial Plan assumes a reduction of base budget program spending. Several years ago, the Commission made a strategic change in its funding strategy, transitioning to catalytic investments as an increasing share of its portfolio. Catalytic investments are intended to be one-time system-level funding awards that improve the systems that serve young children and their families without requiring on-going funding support.
$23,146,372 $22,336,249 $21,554,480 $20,800,073
$0
$5,000,000
$10,000,000
$15,000,000
$20,000,000
$25,000,000
2018/19 2019/20 2020/21 2021/22
Five-YearProposiJon10RevenueProjecJonChildrenandFamiliesCommission,2018/19-2021/22

2016-17 Annual Report Supplement Page 15 of 33
In 2016/17, a majority of the $31,875,486 program budget went toward supporting Healthy Children programs (69% of total program budget) and 21% was dedicated to Early Learning programs. Similarly, almost three-quarters of the $7,031,729 in catalytic funds was invested in Healthy Children programs.
Commission policy dictates that administrative costs are no more than 10% of the annual budget. Commission staff have worked to implement numerous cost reduction strategies. In fiscal year 2015/16, administrative costs were 6.7% of the Commission’s actual expenses. In fiscal year 2016/17, administrative costs were further reduced to 5.6%. Administrative cost savings have been achieved through multiple strategies, including reducing staff and consultant support, relocating offices to more cost-efficient space and developing a methodology for staff
$26,280,396 $30,649,229 $27,831,011 $24,097,152 $24,843,757
$5,710,344 $5,437,922
$6,415,133 $6,369,081 $7,031,729
$0
$10,000,000
$20,000,000
$30,000,000
$40,000,000
2012/13 2013/14 2014/15 2015/16 2016/17
Previous Five-Year Total Program Funding Children and Families Commission, Fiscal Years 2012/13 - 2016/17
Program CatalyTc
69%
8%
21%
2%
2016/17 Program Budget
74%
15%
11%
0.5%
2016/17 CatalyTc Budget

2016-17 Annual Report Supplement Page 16 of 33
to account for their time spent on direct program services. The Commission will continue to look for ways to develop efficient administrative operations, while ensuring that program and collaborative planning, and grantee oversight is not diminished or impacted.
In terms of evaluation costs, the Commission spent 2.2% of its budget on evaluation-related activities in Fiscal Year 2016/17. One tool used to control evaluation costs has been working with five Southern California Commissions to develop a common data system to facilitate data collection and reporting across the region.
Sustainability Strategies As tobacco tax revenue declines, the Commission continues to focus on addressing the sustainability challenge, and building the resources and partnerships to support and expand services for young children in Orange County. Examples of the Commission’s current sustainability strategies include:
• Transitioning an increasing portion of the funding portfolio to catalytic investments—one-time funding that is intended to improve the systems that service young children and their families without requiring ongoing funding support.
• Pursuing federal funding opportunities. Current examples include: o Leveraging funds from Medi-Cal Administrative Activities (MAA) and
Targeted Case Management (TCM). Since the inception of the program, the Commission and its agency partners have received approximately $47 million in federal funding.
o Leveraging unused federal funding through Intergovernmental Transfer (IGT). In partnership with CalOptima, the innovative way of bringing federal funding to Orange County has provided needed dollars to MOMs Orange County and CHOC Children’s, as well as Help Me Grow Orange County. The leveraged funds will continue to be used for prenatal support and early childhood mental health services in Orange County.
• Pursuing state funding opportunities: o Expanding dental care for low income youth through a Dental Transformation
Initiative Grant. Awarded by the California Department of Health Care Services, the $11 million grant will significantly increase access to prevention and early intervention services through teledentistry – onsite dental services that are set up at schools and other community sites throughout Orange County.

2016-17 Annual Report Supplement Page 17 of 33
Strategic Partnerships The Commission continues to develop and nurture key community partnerships in order to build upon and not replicate existing systems of care. Several key partnerships have been developed, as presented in this section.
Orange County Health Care System
Supporting children’s healthy development is a priority and efforts are focused on ensuring:
• children have access to health coverage starting at birth• young children have a health home and appropriately use the services• availability of quality primary and specialty care services, including oral heath, vision
care, and early intervention services• improving the quality of health care services specifically focused on the zero to age five
population.
To support these priorities, partnerships have been developed with hospitals, community clinics, public health, community organizations, medical professionals, and other health funders. For example:• Hospital and Community Based Organizations - Partnerships with birthing hospitals and
community based programs that provide parent support services as part of the Bridges Maternal Child Health Network program allows for initial contact with newborns and families in Orange County.
• Leading Pediatric Hospitals – Collaborative programs are designed to ensure that pediatric specialty care is available to address identified health and development needs. One joint project is The Center for Autism and Neurodevelopmental Disorders that provides an integrated approach to care and other early intervention services. The Center serves as a foundation for the Help Me Grow-Orange County program that connects children, their families, and providers to early intervention services available in the community.
• Pediatric Dental Clinics – Long-term support for a children’s dental initiative includes support for the flagship dental organization Healthy Smiles for Kids of Orange County. Additionally, the Commission invests in building a strong community clinic network that can provide pediatric dental services.
• CalOptima – As Orange County’s sole Medicaid managed care health plan, CalOptima plays a critical role in the Orange County healthcare safety net. The Commission works with CalOptima on evaluation research to measure effects of funded programs, and has partnered with the health plan to draw down federal funding for prenatal support services and early childhood mental health.
Orange County School Distr i c t s

2016-17 Annual Report Supplement Page 18 of 33
An important initiative of the Commission is school readiness. This includes working with children prior to entering kindergarten, and working with schools to develop a successful transition path from early care programs into elementary schools. School district nurses also assist in bridging communication between health and education service systems to ensure that young children are healthy and ready to learn.
Local and Regional Funders
The Commission participates as a member of several local and regional funding collaboratives when common missions and objectives create an opportunity for collective impact. The Commission is an active member of the Health Funders Partnership, the Orange County Funders Roundtable as well as other project specific partnerships. These partnerships allow the Commission to strengthen its community impact, develop diverse funding bases for program sustainability, and strengthen community support for outcomes for children and families.
Local Government and Business Community
The Commission is on the forefront of working with local government and business leaders to promote the importance of school readiness for workforce development. The Commission maintains active involvement with the local government and the business community through participation in the Orange County Forum and working with business support groups, such as the Orange County Business Council and the Association of California Cities, Orange County. In addition, the Commission has a strong working partnership with the Orange County Health Care Agency and Orange County Social Services Agency.
Community Based Organizat ions
Local health and human service organizations throughout Orange County administer and execute the programs funded by the Commissions. Partnerships with these organizations are essential to reaching the diverse ethnic and geographic populations in Orange County. Agreements with MOMS Orange County, Children’s Bureau of Southern California, and Orange County Child Abuse Prevention Center for home visitation services exemplify the integral role of community-based organizations in promoting children’s health and development.
Statewide Partnerships
Achievement of the goals and objectives set forth in the Strategic Plan requires statewide and regional partnerships with other First 5 county commissions and the state commission. The opportunity for collaborative plans and programs is specifically authorized in Proposition 10. Activities include technical assistance, and legislative and policy advocacy.

2016-17 Annual Report Supplement Page 19 of 33
Commission partnerships avoid duplication of effort and provide more efficient and targeted service delivery. Supported partnerships among health care providers, family resource centers, clinics, school districts, and early childhood education providers form the foundation for service delivery to families with young children.
Univers i ty Based Research Partnerships
The Commission has successfully collaborated with several local and regional universities to leverage knowledge and resources to advance the evaluation efforts of Commission-funded programs. For example, the Commission is partnering with researchers from Chapman University to assist in evaluating the effectiveness of the Bridges Maternal Child Health Network and provide continuous quality improvement recommendations. In addition, the Commission has partnered with University of California Irvine to examine the predictive reliability of the Early Development Index and overlaying of EDI data with other community data such as child maltreatment and poverty rates.
Systems Change Looking toward the future, the Commission is at the beginning of a systems change process, pivoting from an identity deeply embedded in directly funding programs and services to one that effectively leverages key partnerships, ongoing data collection and rigorous local evaluation to inform policy and further improve outcomes for children. A detailed “pivot paper” was presented in Fiscal Year 2016/17 to address the growing concern of declining revenue and outline the new direction for the Commission.
The Commission has built a strong foundation since its inception in 1998, with past investments yielding important outcomes that are foundational to collective impact, including improved service infrastructure, increased interagency collaboration, accountability for reporting, and identification and mitigation of service gaps.
Early Deve lopment Index
As an example, to document and inform the developmental needs of young children in Orange County, the Commission partnered with the UCLA Center for Healthier Children, Families, and Communities (UCLA) to implement the Early Development Index (EDI).4 Developed over the course of nearly 30 years, the EDI is a population-based measure of early child development and school readiness in five key domains: physical health, social competence, emotional maturity, language and cognitive skills, and communications skills and general knowledge.
4 UCLA is responsible for analyzing all the data and developing the de-identified data file, EDI data tables
and the individual schools’ reports.

2016-17 Annual Report Supplement Page 20 of 33
Orange County was the vanguard site for implementing the EDI in the United States. Researchers, policy makers and child advocates here understood that data drives meaningful decisions for early childhood education, health and well-being. In 2015, the Commission, in partnership with the County’s 25 school districts and kindergarten teachers,5 succeeded in collecting data in all of the public schools that have a kindergarten population. 2017 marked the third year of full EDI countywide data. Orange County’s collection of EDI data represents the largest and most complete and actionable picture of children’s development of any community using the EDI in the United States.
Collecting EDI data tells us how our communities’ children are doing, what programs and services are helping and where additional resources are needed to ensure the success of our entire community.
The EDI data are coupled with other population-based indicators, such as poverty levels to allow the Commission, community members and leaders to:
• Compare strengths and weaknesses in children’s development and school readiness; • Understand the relationship between EDI results and other important factors that
influence child well-being; • Support advocacy efforts, plan interventions and resource investments to help
children reach their potential; and • Track progress over time to see how changes in investments, policies, or other
factors influence children’s health and well-being.
The Commission remains committed to collecting EDI data well into the future to help policy makers, nonprofit groups, educators and child advocates to quantify the success of programs and policies in place, uncover pockets of need and collaborate to ensure necessary support reaches all children.
The Commission also partnered with the University of California Irvine (UCI) to conduct the first predictive validity study of the EDI for a U.S. population of children. The OC EDI Predictive Validity Study aims to understand the associations between the developmental status of children in kindergarten, as measured by the EDI, and children’s later educational outcomes, as measured by administrative data from participating school districts. Specifically, the study focuses on understanding which groups of children are most likely to struggle academically, be grade retained, be placed into special education, fail to transition from English language learners (ELL) status in a timely manner, and have greater rates of absenteeism. The primary objective is to use a variety of statistical methods to better understand how the EDI is related to these key educational outcomes. Ultimately, the intended purpose is for the EDI to aid in identifying groups of children that are most likely to have increased costs later in school, and therefore, where targeted early investments and interventions may be most cost-effective. The UCI study also focuses on the connection between kindergarten EDI and 3rd grade 5 In 2017, Lowell Joint School District’s three schools that are within Orange County boundaries also
participated.

2016-17 Annual Report Supplement Page 21 of 33
achievement in Math and English Language Arts/ Literacy. The initial results of the study show each EDI domain was closely and strongly associated with proficiency in 3rd grade.
Because of the Commission’s investment in the EDI, Orange County is now well positioned to use this countywide school readiness data to target interventions to improve early childhood health and learning outcomes. This investment among others have created the foundation and ecosystem needed for the Commission to take early childhood development efforts to the system-level necessary in today’s environment of declining revenue and increasing demand on services.
To achieve this pivot to a systems change focus, the Commission has begun implementing a multi-pronged approach to:
• Shift the distribution of investments from funding direct programs and services to initiatives and projects that will result in improved systems that foster the health and development of children.
• Rigorously promote application of the Early Development Index as the tool holds great promise in identifying early health, development and learning needs within specific neighborhoods and geographic areas, thereby allowing for better targeting of resources and setting the stage to determine the impact of interventions.
• Assess current partnerships to prioritize those that continue to promote the importance of improving outcomes for Orange County’s young children and foster new relationships that further that direction.
Detailed Program Outcomes The Commission implements a standardized set of indicators to address each of its targeted outcomes and objectives. The “Services Provided by…” tables (see Table 3 below) in this report detail the services provided for each subcategory and include four columns: the first two columns list the Strategic Plan outcomes and services used by Commission-funded programs and the third and fourth columns list the number of clients and services delivered, respectively.
In Fiscal Year 2016/17, there were 122,924 new Children ages 0-5; 111,856 new Family Members; and 11,086 new Service Providers served by Commission-funded programs. Children ages 0-5 received more than 1.8 million services, while their Family Members received more than 950,000 services. Over 21,000 services were provided to Service Providers during fiscal year 2016/17 (see Table 1 below).
Between fiscal years 2015/16 and 2016/17, there was an 8% decrease in the number of children ages 0-5 served, with children receiving 8.1% fewer services than the previous year. In contrast, there was a 3.7% increase in the number of parents/family members served; but they received 7.9% fewer services than the previous year. Lastly, there was a decrease in 16.6% in

2016-17 Annual Report Supplement Page 22 of 33
the number of providers served; with providers receiving 2.5% fewer services than the previous year.
Changes in Number of Clients Served and Number of Services Provided Fiscal Years 2015/16 and 2016/17
Clients served
Services provided
Children 0-5 -8.0% -8.1%
Families +3.7% -7.9%
Providers -16.6% -2.5%
In Fiscal Year 2016/17, the Commission completed the final year of a three-year planned reduction in funding due to declining revenue. The decline in Commission-funded services is consistent with the funding reduction and does not necessarily mean a reduction in actual community services, as there has been extensive work with community partners to sustain services, independent of Commission funding. For example, the Commission has pursued Intergovernmental Transfer (IGT) funds to provide additional revenue to priority Commission funded programs. The Commission completed its first IGT transaction early this fiscal year and was notified by CalOptima of an additional IGT opportunity that covers fiscal years 2015/16 and 2016/17. MOMS Orange County and CHOC Children’s met the IGT requirement. For every dollar provided as a match, approximately $1.80 will be returned to Orange County. Thus, it is reasonable to expect that an IGT of $4,235,000 will return an estimated total of $6,776,000 for prenatal health services, developmental services, and early childhood mental health services.
During fiscal year 2016/17, the Commission funded 96 organizations to implement 158 individual programs serving children, families, and providers. This report provides details on the numbers children, family members, and service providers served by Commission-funded programs and the services that were provided to them. For each funding subcategory, the following data are provided along with the data source(s):
Data Data Source(s) Number of children ages 0-5, family members, and service providers receiving services from Commission-funded programs
• Commission Data Collection and Reporting System
Number of services provided to children, family members, and service providers Number of children with client level data • Commission Data Collection and
Reporting System; Bridges Connect Data System for Children 0-5 (Client Level Data on children receiving intensive services and whose parents
Age breakouts of children with client level data Ethnicity of children with client level data Primary Language of children with client level data Poverty level of children with client level data

2016-17 Annual Report Supplement Page 23 of 33
consent to data collection) Numbers of different types of services provided to children, family members, and service providers
• Commission Data Collection and Reporting System
Key Service Outcomes • Service Outcome Questionnaires (SOQs) in Commission Data Collection and Reporting System, Bridges Connect, and the Homeless Management Information System
This report provides program information for the Commission as a whole. In addition, appendices are available, which provide the information by Commission goal areas and funding subcategories:
Commission Goal Area Funding Subcategory All Commission-Wide Data Healthy Children Bridges Maternal Child Health Network
Community Health Oral Health Pediatric Health Services School Readiness Nursing
Strong Families Homelessness Prevention Family Support Services
Early Learning Early Learning Programs
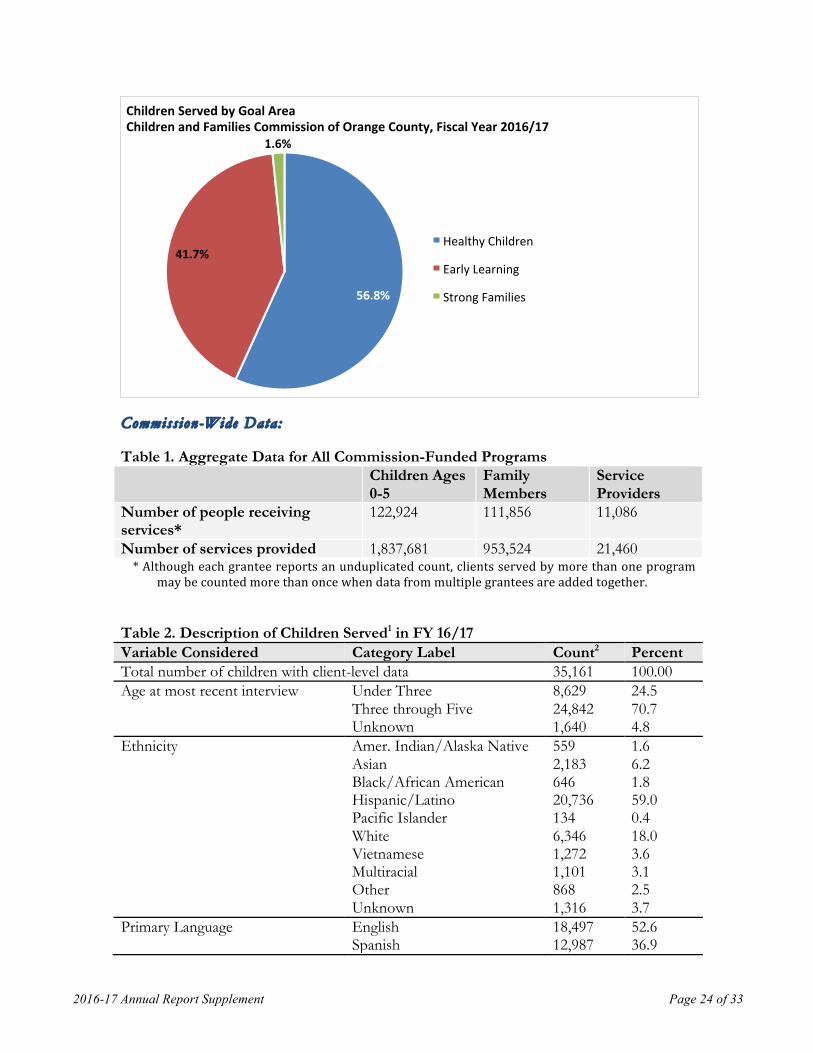
In fiscal year 2016/17, the majority of the children (56.8%) were served through the Commission’s Healthy Children goal area and another 41.7% were served through the Early Learning goal area. Only 1.6% of children were served through the Strong Families goal area.6
6 In the Appendices, the Capacity Building program information has been integrated into the three goal areas: Health Children, Early Learning, and Strong Families. Hence, Capacity Building does not have its own program narrative.
2016-17 Annual Report Supplement Page 24 of 33
Commission-Wide Data:
Table 1. Aggregate Data for All Commission-Funded Programs Children Ages
0-5 Family Members
Service Providers
Number of people receiving services*
122,924 111,856 11,086
Number of services provided 1,837,681 953,524 21,460 *Althougheachgranteereportsanunduplicatedcount,clientsservedbymorethanoneprogram
maybecountedmorethanoncewhendatafrommultiplegranteesareaddedtogether.Table 2. Description of Children Served1 in FY 16/17 Variable Considered Category Label Count2 Percent Total number of children with client-level data 35,161 100.00 Age at most recent interview Under Three
Three through Five Unknown
8,629 24,842 1,640
24.5 70.7 4.8
Ethnicity Amer. Indian/Alaska Native Asian
Black/African American Hispanic/Latino Pacific Islander White Vietnamese Multiracial Other Unknown
559 2,183 646 20,736 134 6,346 1,272 1,101 868 1,316
1.6 6.2 1.8 59.0 0.4 18.0 3.6 3.1 2.5 3.7
Primary Language English Spanish
18,497 12,987
52.6 36.9
56.8%
41.7%
1.6%
ChildrenServedbyGoalAreaChildrenandFamiliesCommissionofOrangeCounty,FiscalYear2016/17
HealthyChildren
EarlyLearning
StrongFamilies

2016-17 Annual Report Supplement Page 25 of 33
Vietnamese Korean Mandarin Farsi Filipino Other Unknown
979 93 129 61 22 486 1,907
2.8 0.3 0.4 0.2 0.1 1.4 5.4
At or Below 200% Federal Poverty Level 4,711 90.5 1 A child can be served by more than one provider. In that event, the child is counted each time he/she is served by a different provider.
2 The counts for specific demographic variables may be less than the total number of children entered in the Commission’s Data Collection and Reporting System and Bridges Connect. This typically occurs because survey respondents decline to answer a specific question, or an error in data entry results in an out-of-range value that must be deleted.

2016-17 Annual Report Supplement Page 26 of 33
Table 3. Services Provided by All Commission-Funded Programs Strategic Plan Outcome
Service Clients Served
Number of Services
HC.1 Increased percent of children born healthy
Case management meetings/home visits to support prenatal care
453 1,453
Pregnant women receive support for healthy pregnancy and early childhood health, including screening and education for alcohol, tobacco and other drugs (ATOD)
8,583 8,583
Home visits/case management meetings conducted with parents with a history of ATOD abuse
83 297
HC.2 Increased percent of children receiving developmental / behavioral screenings at milestone ages with linkage to appropriate services
Providers trained on how to screen, assess and/or identify child developmental milestones
156 153
Providers educated on child development, recognizing key milestones, and the importance of screening and/or assessment
6,004 6,465
Children receive developmental and/or behavioral screening using evidence-based screening tools (i.e., PEDS, ASQ, ASQ-SE, MCHAT, Child Behavior Checklist)
14,431 17,244
Children receive a dental screening, including visual inspection and/or assessment by professional dental resource
20,448 20,544
Children screened for up to date immunizations 15,210 18,307
Children receive vision screening using evidence-based tools (i.e., LEA, SureSight, PlusOptix12, etc)
14,246 14,630
Children receive hearing screening using evidence-based tools (i.e., OEA, Audiometry, Pure Tones, Tympanometry, etc)
9,701 10,307
Children receive body composition and stature screening (height, weight, BMI)
10,289 10,677
Children receive health status screening (i.e., asthma, allergies, etc.)
13,184 13,864
Children receive comprehensive screening (Includes: vision, hearing, height, weight, health, dental and developmental milestones
689 689
Children receive assessment (e.g., vision, hearing, speech/language, psychosocial issues, motor skills, health, special needs, and/or parent-child functioning)
2,757 12,564
Parents receive referrals regarding their child's health and developmental concerns
9,616 13,644
Parents are linked to referred services for their child's health and developmental concerns
4,410 5,370
Parents receive informational materials regarding developmental milestones and developmental screening
274 1,393
HC.3 Increased
Children are linked with health insurance enrollment 1,300 1,339
Children are linked to a health care home 1,998 2,052

2016-17 Annual Report Supplement Page 27 of 33
Table 3. Services Provided by All Commission-Funded Programs Strategic Plan Outcome
Service Clients Served
Number of Services
percent of children have and use a health home for comprehensive health services to include physical, dental and mental health
Children receive primary care services/visits, including well child and sick visits
919 2,247
Children are linked to a dental home 2,401 2,401 Children receive preventative dental treatment (e.g., cleaning, sealant)
13,465 15,272
Children receive restorative dental treatment (e.g., carries) 220 1,218 Children receive emergency dental treatment (e.g., abscess) 157 589 Children with special needs receive dental care 1,081 2,295 Parents receive education on oral health 13,811 16,263 Children receive oral health education 23,523 23,534 Providers receive oral health education 258 258
HC.4 Increased percent of children growing up in healthy and safe environments
Mothers receive breastfeeding education, intervention and support
13,945 31,128
Parents, pregnant women and families with infants receive nutrition and physical activity education
46 53
Children enrolled in nutrition and/or physical activity program
191 627
Children receive nutrition and physical activity education 974 974 Children participate in YMCA Aquatic Center programs 429 8,524 Parents participate in YMCA Aquatic Center programs 251 48,800 Children participate in YMCA sports programs 210 808 Parents receive Hepatitis B and/or Pertussis vaccine information in the hospital
12,700 28,866
Children receive specialty care clinic visits 544 2,619 Parents receive home visits focused on ongoing medical surveillance and linkage to appropriate referrals
150 447
Parents receive specialty care education, resources, referrals, and support
6,964 11,247
Providers receive specialty care education 515 515 Parents receive speech and language services 1,885 1,827
SF.1 Increased percent of families are stably housed
Children receive emergency or transitional shelter (bed nights)
432 39,221
Family members receive emergency or transitional shelter (bed nights)
613 50,062
Parents receive weekly case management services 681 4,926 SF.2 Increased percent of children are safe
Parents receive home safety checks using a Commission-approved tool
1,436 2,126
SF.3 Increased parent
Home visits to improve parent knowledge of healthy child development
2,535 16,109

2016-17 Annual Report Supplement Page 28 of 33
Table 3. Services Provided by All Commission-Funded Programs Strategic Plan Outcome
Service Clients Served
Number of Services
knowledge and skills to help prepare children to reach their optimal potential
Office visits to improve parent knowledge of healthy child development
15,317 22,201
Parents participate in parenting education classes/series on healthy child development and/or vision
6,497 6,294
Children receive health education classes 7,207 730 Children receive group interventions to improve healthy child development
137 374
Providers receive consultations to improve provider knowledge of healthy child development
1,195 1,845
SF.4 Increased access to and availability of family support services and resources
Mothers are screened with the Bridges Screening Tool 10,317 10,317
Parents receive referrals to services 25,799 49,089
Parents receive referrals to MCHN program services 1,860 1,860
Parents receive referrals to non-MHCN program services 11,269 55,101
Providers receive referrals to services 428 694
Parents receive follow up on referrals and services are accessed
7,647 16,502
Parents receive Kit for New Parents 23,146 23,146
Children receive behavioral health treatment services 41 662
Providers are educated to increase awareness and identification of behavioral health issues
1,131 302
Providers receive training on behavioral health treatment services for children 0-5
404 294
Parents receive education, resources, referrals, and support regarding their child's behavioral health issues
128 1,344
Parents receive behavioral health screening 1,350 3,563
EL.1 Increased all children’s developmental skills* to be proficient learners in school *Early literacy/ numeracy, self-regulation, social expression, and self-care and
Children read to at physicians’ offices or clinics 3,420 458
Parents participate in a program designed to increase the frequency of reading at home
14,666 454,241
Parents receive literacy information/assistance in waiting rooms or community events
11,188 4,678
Provider will recruit and support pediatrician offices to participate in Reach Out Read National Program
104 43
Books distributed to children N/A 160,075 New and used books collected for distribution N/A 180,135 Children participating in early literacy programs 47,577 1,548,877

2016-17 Annual Report Supplement Page 29 of 33
Table 3. Services Provided by All Commission-Funded Programs Strategic Plan Outcome
Service Clients Served
Number of Services
motor skills Children participate in early math/STEM programs 461 3,240
EL.2 Increased quality of early care and education
Providers will conduct classroom assessments using an established tool such as ECERS or CLASS, and develop improvement plans, when needed, to improve the quality of existing district and/or community ECE programs
380 379
Children receive enhanced evidence-based school readiness services through early education programs
1,140 20,690
Parents participate in a drop-in, family-focused early learning program (i.e., Learning Link)
3,725 33,570
Children participate in a drop-in, family-focused early learning program (i.e., Learning Link)
3,263 35,178
Providers are given resources and early intervention strategies for appropriate early care and education practices
269 282
EL.3 Increased early educator, parent and caregiver knowledge and skills to promote children’s readiness for school
Parents receive tools, resources, information and/or training needed to transition their child to school
28,371 107,476
Participate in EDI at one of the following levels: planning for future implementation; implementing EDI; or incorporating EDI data in planning efforts
N/A 191
EL.4 Improved transitions of children entering Kindergarten and K-12 system
Children visit Kindergarten classrooms prior to start of school year
8,825 N/A
Children's health and development records are transferred to their elementary school prior to entering Kindergarten
7,227 N/A
Children entering preschool programs are assigned a unique identifier
11,332 N/A
CB.1 Maximize all sustainability activities
Dollar amount raised from program fees/revenue N/A $11,217,091
Dollar amount raised from individual donations N/A $425,744 Dollar amount raised from Foundation donations N/A $3,660,426 Dollar amount raised from government funds/grants N/A $42,244,484
Dollar amount of in-kind contribution generated N/A $325,504
Dollar amount received by leveraging Commission dollars N/A $1,196,447
Educational loan repayments made on behalf of providers 2 $16,150
Number of volunteers recruited 1,307 N/A
CB.2 Increase access and efficiency,
Public information and outreach campaign to increase community awareness of an issue or to promote awareness of access to services (e.g., where to go if need screening,
N/A 407

2016-17 Annual Report Supplement Page 30 of 33
Table 3. Services Provided by All Commission-Funded Programs Strategic Plan Outcome
Service Clients Served
Number of Services
quality and effectiveness
importance of teeth brushing, developmental screenings, immunizations, breastfeeding, importance of fatherhood) Developing partnerships, coordinating and collaborating with other agencies to improve service delivery
N/A 1,457
Technical assistance is provided, such as assistance with sustainability plans, evaluation activities, and providing quality services
113 1,523
Provide trainings to build the capacity of the agency to increase quality services (including STEM related activities)
2,410 467
CB.3 Promote data to support decision making and program improvement
Children with special needs served 4,329 4,329
Table 4. Service Outcomes for All Commission-Funded Programs Key Strategic Plan Objectives SOQ Results Healthy Children • Increase to 100% the number of
children with health coverage • 99.7% of children served had dental insurance at
the end of services (compared to 98.7% at the beginning of services)
• Increase to 100% the proportion of children who have a health care home
• 99.5% of children had a dental health home at the end of services (compared to 95.4% at the beginning of services)
• Reduce dental cavities so that the proportion of young children with one or more cavities is no more than 9%
• 100% of children had no cavities at the end of services (compared to 78.9% at the beginning of services)
• Increase age appropriate immunization levels to at least 95%
• 96.1% of children received all age appropriate immunizations at the end of services (compared to 90.8% at the beginning of services)
• Increase to at least 90% the proportion of all pregnant women who receive early prenatal care, and decrease racial/ ethnic disparities
• 69.0% of mothers received prenatal care in the first trimester
• Reduce the percentage of infants exposed to alcohol, tobacco, and other drugs (ATOD) to zero percent (0%)
• 9.4% of expectant mothers used ATOD prior to starting intervention
• Increase to at least 90% the proportion of mothers who breastfeed their babies at early post-partum and to 50% those who continue to breastfeed at 6 months, any or exclusive
• 52.9% of mothers breastfed their babies until 6 months of age

2016-17 Annual Report Supplement Page 31 of 33
Key Strategic Plan Objectives SOQ Results Early Learning • 75% of typically developing children are
effective learners in literacy • 19.5% of children knew none of the alphabet
letters by name at the beginning of services compared to only 8.0% at the end of services
• 75% of typically developing children are effective learners in literacy
• 91.9% of children could identify his or her written name at the end of services, compared to only 78.5% at the beginning of services
• 75% of typically developing children are effective learners in literacy
• 98.3% of children had familiarity with books at the end of services, compared to 93.4% at the beginning of services
• 80% of typically developing children are effective learners in numeracy
• 94.1% of children could count a group of three to five objects by touching each object at the end of services, compared to 85.4% at the beginning of services.
• 80% of typically developing children are effective learners in numeracy
• 94.7% of children could correctly name at least two shapes at the end of services, compared to only 91.9% at the beginning of services
• 80% of typically developing children are effective learners in numeracy
• 86.6% of children could recite more than five numbers in order at the end of services, compared to only 62.7% at the beginning of services
• 75% of typically developing children are socially competent
• 97.8% of children could follow simple two-step oral directions at the end of services, compared to 94.7% at the beginning of services
• 75% of typically developing children are socially competent
• 95.5% of children cooperated with the daily classroom routine most of the time at the end of services, compared to 94.6% at the beginning of services
• Increase parents’ knowledge and involvement in preparing children for school
• 82.1% of parents taught their children letters, numbers, or words at least three times in the prior week at the end of services, compared to 76.6% at the beginning of services
• Increase parents’ knowledge and involvement in preparing children for school
• 89.8% of parents played with toys or games indoors at least three times in the prior week at the end of services, compared to 85.4% at the beginning of services
• Increase parents’ knowledge and involvement in preparing children for school
• 74.9% of parents went on outings with their child at least three times in the prior week at the end of services, compared to 65.3% at the beginning of services
• Increase parents’ knowledge and involvement in preparing children for school
• 92.6% of parents talked with their child about daily activities at least three times in the prior week at the end of services, compared to 89.5% at the beginning of services
• Increase parents’ knowledge and • 72.0% of parents played games, sports or exercised

2016-17 Annual Report Supplement Page 32 of 33
Key Strategic Plan Objectives SOQ Results involvement in preparing children for school
with their child at least three times in the prior week at the end of services, compared to 64.1% at the beginning of services
• Increase parents’ knowledge and involvement in preparing children for school
• 91.2% of parents felt they had sufficient information and support for their child to attend Kindergarten at the end of services, compared to 93.8% at the beginning of services
Strong Families • Reduce the number of children who are
homeless to zero • Among homelessness prevention programs, 53.9%
of children were unstably housed or at risk for homelessness at the end of services (compared 97.9% at beginning of services)
• Reduce the number of children who are homeless to zero
• 36.8% of children 3 or older were attending school on a regular basis at the end of services (compared to 35.6% at the beginning of services)
• Reduce the number of children who are homeless to zero
• 47.2% of children had a regular childcare arrangement at the end of services (compared to 33.1% at the beginning of services)
Commission-Funded Grantees ’ Intake and Exit Surveys
Commission-funded grantees collect client-level information on participating children and their families who consent to share information. This information is collected at the beginning of services and again at the end of services.
Mother ’s Educat ion
38.4% of mothers did not graduate from high school, 26.4% had a high school diploma or GED. Only 11.7% of mothers had a Bachelor’s degree or higher.

2016-17 Annual Report Supplement Page 33 of 33
Primary Language
More than half of the caretakers spoke English as the primary language (53.4%); with 38.5% speaking Spanish; 3.3% speaking primarily Vietnamese; and 4.8% speaking some other language, including Farsi, Tagalog, Korean, Arabic or Mandarin.
Health Insurance
After completion of Commission funded services, there were fewer children who were uninsured (0.8%) compared to before they began services (1.1%). There were also fewer children covered through private insurance at exit (8.6%) than at intake (9.7%); but more covered through public insurance at the end of services (90.7%) than before they began services (89.2%).
3.2%
11.8%
23.4%26.4%
18.4%
5.1%7.2%
3.8%0.7%
0%
5%
10%
15%
20%
25%
30%
No Formal Schooling
8th Grade or Less
9th to 12th Grade or
VocaTonal School
High School Diploma/GED
Some College or Some Technical
School
Associate's Degree or Technical
School Degree
Bachelor's Degree
Graduate or Professional
Degree
Other
Mother's Education Commission-Funded Grantees, Fiscal Year 2016/17
53.4%38.5%
4.8% 3.3%
PrimaryLanguageofCaretakerFiscalYear2016/17
English
Spanish
Other
Vietnamese

2016-17 Annual Report Supplement Page 34 of 33
Dental Care
At completion of Commission-funded services, more children had visited a dentist within the last six months (70.8%) compared to at the beginning of receiving services (67.5%).
Frequency or Reading to Chi ld
More families were reading to their children 3-6 times a week or daily after completing Commission funded services (73.9%) compared to before they received services (63.2%). In addition, at the end of services, only 3.0% of families indicated that they did not read to their child (compared with 9.1% at intake) or only read to their child 1-2 times per week (23.2% at exit vs. 27.7% at intake).
89.2%
9.7%1.1%
90.7%
8.6%0.8%
0%
20%
40%
60%
80%
100%
PublicInsurance PrivateInsurance Nocoverage
HealthInsuranceStatusCommission-FundedGrantees,FiscalYear2016/17
Intake Exit
67.5%
24.9%
5.7% 1.8%
70.8%
23.6%
4.1% 1.5%0%
20%
40%
60%
80%
Lessthan6monthsago Between6monthsandayearago
Between1to2yearsago
2yearsagoormore
WhenChildLastSawDenJstorDentalHygienistforDentalCareCommission-FundedGrantees,FiscalYear2016/17
Intake Exit

2016-17 Annual Report Supplement Page 35 of 33
9.1%
27.7% 29.9%33.3%
3.0%
23.2%
33.6%
40.3%
0%
10%
20%
30%
40%
50%
Notatall Onceortwiceaweek 3-6<mesaweek EveryDay
FrequencyofReadingorShowingPictureBookstoChildCommission-FundedGrantees,FiscalYear2016/17
Intake Exit

HEALTHY CHILDREN
The purpose of the Commission goal area of Healthy Children is to promote the overall physical, social, emotional and intellectual health of young children.

The following documents progress made within the Commission goal area of Healthy Children. The goal area consists of four funding subcategories:
• Bridges Maternal Child Health Network • School Readiness Nursing • Children’s Dental • Community Health
Together, these programs made significant progress toward improving young children’s health and ability to learn.
Fiscal Year 2016/17 Snapshot:
• 55.3% of mothers participating in the Bridges Maternal Child Health Network breastfed their babies until 6 months of age, exceeding the Commission’s goal of 50%
• 99.2% of children participating in the School Readiness Nursing program received all age appropriate immunizations at the end of services, exceeding the Commission’s goal of 95%
• 100% of children participating in Healthy Smiles had no cavities at the end of services, exceeding the Commission’s goal of 91%
• The Vision Program successfully screened more than 3,200 children this year, provided more than 880 comprehensive eye exams on the mobile van, and distributed approximately 600 free glasses to children in Orange County.

BRIDGES MATERNAL CHILD
HEALTH NETWORK
FY 16/17

Healthy Children: Bridges Maternal Child Health Network, Fiscal Year 2016/17 1 of 4
BRIDGES MATERNAL CHILD HEALTH NETWORK The Bridges Maternal Child Health Network (Bridges Network or Network) is a countywide program implemented through an integrated system of community providers. The Network supports children’s healthy development by identifying risk from prenatal through the critical first years of life, providing families with education, screening, and access to supportive services including referrals for home visitation by public health nurses and other professional staff. Home visiting is a voluntary, relationship-based intervention program that includes regular visits by a trained professional to a family’s home when the mother is expecting and/or after she has given birth. Evidence from home visiting programs show that when families receive this type of support, children are healthier and better prepared for school, parent-child bonds are stronger, and abuse and neglect are less likely.1
The Commission’s vision for the Network is to build and sustain a countywide maternal child health system that is responsive, efficient, and measurably improves the health and development of Orange County’s children through:
• Increased access to health coverage; • Early identification and referral of health, behavioral and developmental concerns; • Effective use of healthcare resources.
Through this model of prevention and early intervention, the Commission is helping Orange County’s young children have the healthiest start possible and reduce the need for costlier, more complex intervention services.
INVESTMENT
The Bridges Network of providers includes: 10 high birth hospitals, three community organizations (Children’s Bureau, MOMS Orange County, and Orange County Child Abuse Prevention Center), and four programs within the County of Orange Public Health Nursing.
Outreach by Bridges Network agencies begins at the earliest possible time in a child’s development, including work with pregnant mothers, bedside screening in the hospital when a child is born, and infant and toddler home visitation. Services include, but are not limited to:
• Prenatal outreach and education • Bedside screening and assessment • Breastfeeding support and education • Prenatal, Infant and Toddler Home Visitation programs • Home safety screening • Behavioral health screening
1 http://homvee.acf.hhs.gov/outcomes.aspx

Healthy Children: Bridges Maternal Child Health Network, Fiscal Year 2016/17 2 of 4
• Child abuse prevention education • Health insurance assistance • Screenings (developmental, vision, hearing, dental, etc.) • Health assessments • Referrals and access to community resources • Education of in home and community-based health-related topics including: oral
health, immunizations, insurance, development, home safety, prenatal health, breastfeeding, safe sleep, nutrition, substance abuse, and secondhand smoke
Bridges Maternal Child Health Network Program Investments
The Bridges Network was one of the Commission’s first funded programs and has received funding support of more than $31.8 million since Fiscal Year 2012/13. In Fiscal Year 2016/17, the Commission allocated approximately $7.9 million to the Bridges Network. Fiscal Year 2016/17 was the final year of a 3-year agreement for all Bridges Network service providers. The Commission approved another 3-year term, with essentially level funding, beginning in 2017/18.
This Fiscal Year, the Commission designated funds to be used as a match for a federal Intergovernmental Transfer (IGT) transaction. The IGT transaction will yield new funding for one of the Bridges Network providers, MOMS Orange County, and significantly enhances the sustainability of this program for the next nine years. The Fiscal Year 2016/17 budget included $2,245,476 in IGT funds.
OUTCOMES
In Fiscal Year 2016/17, the Commission’s investment in the Bridges Network produced the following outcomes for children from birth through age five and their families:
$6,309,448 $6,418,567$5,781,483
$5,427,521
$7,880,334
$0
$1,000,000
$2,000,000
$3,000,000
$4,000,000
$5,000,000
$6,000,000
$7,000,000
$8,000,000
2012/13 2013/14 2014/15 2015/16 2016/17

Healthy Children: Bridges Maternal Child Health Network, Fiscal Year 2016/17 3 of 4
• 95.2% of children received all age appropriate immunizations, exceeding the Commission’s goal of 95%
• 55.3% of mothers breastfed their babies until 6 months of age, exceeding the Commission’s goal of 50%
• 90.6% of mothers received early prenatal care (care in the first trimester of pregnancy)
• 99.7% of children had health insurance at the end of services • 8,565 pregnant women received support for a healthy pregnancy and early childhood
health, including screening and education for alcohol, tobacco and other drugs (ATOD)
• 13,945 mothers received breastfeeding education, intervention and support (prenatal and/or post-natal) according to the recommendations of the American Academy of Pediatrics (AAP)
• 23,146 parents received a Kit for New Parents at the hospital • 10,317 mothers were screened with the Bridges Screening Tool • 1,860 parents received referrals to Bridges Maternal Child Health Network programs
and 1,522 parents received follow up on referrals • 1,261 parents received a behavioral health screening, and 1,691 children received
developmental and/or behavioral screenings using AAP recommended tools (e.g. PEDS, ASQ, ASQ-SE, MCHAT, Child Behavior Checklist)
• 1,772 children were screened for up to date immunizations, and 12,700 parents received Hepatitis B and/or Pertussis vaccine information in the hospital
• 2,535 home visits were made to improve parent knowledge of healthy child development
HIGHLIGHTS
In 2016/17, the Commission began a partnership with Chapman University, and received funding from the Kay Family Foundation for a data analytics project. The grant was specifically awarded to conduct research to identify the “leaks in the pipeline,” i.e., where the Bridges Network is losing mothers between the hospital referral and a child/family enrolling in a home visitation program. Their research will improve the pre-screen algorithm to potentially reduce time and resources allocated to the screening process, and will identify factors that influence acceptance rates among mothers who are offered Bridges home visitation services. These insights will be used to implement programmatic changes and track planned improvements in screening efficiency and service utilization.
In addition to the research project, the Commission began the first phase of a continuous quality improvement (CQI) effort, using a consulting firm to work with Network providers to introduce a process called Rapid Cycle Evaluation (RCE). This is intended to test specific, well-defined improvements to the system in short intervals of time. Two home visitation providers ran pilot RCE projects to gain experience in the approach and test

Healthy Children: Bridges Maternal Child Health Network, Fiscal Year 2016/17 4 of 4
theories to improve referral and enrollment processes. Based on the results of the Chapman University research, the Commission plans to use Rapid Cycle Evaluation to test additional interventions and inform future program improvements.
CHALLENGES
Birth patterns at the 10 Bridges Network hospitals have changed since the Commission’s funding allocations were established more than 10 years ago. In order to make sure the hospitals are properly resourced, the Commission will be working in Fiscal Year 2017/18 with the Hospital Association of Southern California and the hospitals to revisit the allocation formula and develop any necessary improvements.
The 10 Bridges Network hospitals achieve nearly universal screening to assess risk and provide referrals to home visitation services. While the Toddler Home Visitation element of the Bridges Network is operating at capacity, the Infant Home Visitation program is currently underutilized. As part of an ongoing comprehensive effort, the Commission is working to ascertain the value of the Bridges program for improving child/family outcomes, as well as the most effective referral pathways to increase utilization of home visitation and other services.

SCHOOL READINESS
NURSING FY 16/17
Healthy Children: School Readiness Nursing, Fiscal Year 2016/17 1 of 3
SCHOOL READINESS NURSING The Commission established the School Readiness Nursing initiative in 2004 to foster the health and development of young children before they start school. School Readiness Nurses use a variety of strategies to support student learning—ranging from coordinating health service programs, to providing direct nursing care, to ensuring healthy and safe school environments and promoting community involvement in children’s health. The purpose of the School Readiness Nursing (SRN) initiative is to promote lifelong health in young children to prevent or decrease health problems, diseases and disorders and/or to facilitate early identification and treatment of health problems, thereby reducing long-term health care costs, enhancing quality of life and the potential for a successful educational experience. Ongoing work of the SRNs to achieve their objectives include:
• Body Mass Index (BMI)—SRNs assess children’s BMI and those with a BMI greater than 95% and less than 5% are provided with individualized follow up and supportive care for the child and family by providing education related to healthy eating choices and increased physical activity. At the end of the school year, the SRNs repeat the BMI readings to determine if a change has taken place.
• Vision screening—Another important clinical focus of SRNs is vision screening for preschool children with the use of the PlusOptix12 Vision Screener. This technology has been adopted by all the school districts in Orange County. Additionally, with the support of Dr. Robert Lingua at the Gavin Herbert Eye Institute, the screening and referral criteria for preschool children has been revised to address their needs at an earlier age and to include special needs children as well.
• Developmental screenings—Developmental screenings of preschool children in school districts and private settings, as well as providing developmental screenings of siblings, was a key objective for many SRNs this year.
INVESTMENT
Since Fiscal Year 2012/13, the Commission has allocated more than $14.2 million dollars to support health services for young children through the School Readiness Nursing Initiative. In FY 2016/17, the Commission funded 29 full-time equivalent (FTE) School Readiness Nurses (SRN), deploying them in 25 school districts in Orange County with a kindergarten population. Services provided by the School Readiness Nurses include screenings for young children from birth to age five for overall health, hearing, immunization, oral health, vision, and development/behavior, and linkage to any needed services to optimize healthy child development. The Commission also funded the Orange County Department of Education’s Medical Director through December of 2016 to provide expertise and consultation to the School Readiness Nurses in support of the integrated child health and wellness programs.

Healthy Children: School Readiness Nursing, Fiscal Year 2016/17 2 of 3
School Readiness Nursing Program Investments
Fiscal Year 2016/17 was the final year of a 3-year agreement for School Readiness Nursing. The Commission approved another 3-year term, with essentially level funding, beginning in FY 2017/18.
OUTCOMES
In FY 2016/17, the Commission’s investment in the School Readiness Nursing initiative produced the following outcomes for children birth through age five:
• 99.2% of children received all age appropriate immunizations at the end of services, exceeding the Commission’s goal of 95%
• 99.1% of children had health insurance at the end of services. • 10,289 children received a body composition and stature screening (height, weight,
BMI) • 10,654 children received a vision screening using evidence-based tools • 10,563 children received developmental and/or behavioral screening using American
Academy of Pediatrics recommended tools • 9,701 children received a hearing screening using evidence-based tools • 10,383 children received a dental screening, including visual inspection and/or
assessment by professional dental resource • 13,348 children were screened for up to date immunizations • 5,787 parents received referrals and 3,853 parents were linked to referred services for
their child's health and developmental concerns • 7,207 children and 4,977 parents participated in health education classes
$2,572,880
$2,944,423 $3,004,643 $2,990,612$2,761,653
$0
$500,000
$1,000,000
$1,500,000
$2,000,000
$2,500,000
$3,000,000
$3,500,000
2012/13 2013/14 2014/15 2015/16 2016/17
Healthy Children: School Readiness Nursing, Fiscal Year 2016/17 3 of 3
HIGHLIGHTS
In the area of obesity, nurses have seen a decrease in children’s BMI over time with the support provided for the families.
The Vision Program successfully screened more than 3,200 children this year and provided more than 880 comprehensive eye exams on the mobile van, which was purchased through funding for this program. In addition, the Vision Program has distributed approximately 600 free glasses to children in Orange County through the generous donations of community resources. The Vision Services program will continue to expand its program by working with the SRNs in each school district, as well as the private preschools, and with the community partners. The vision program will continue to provide screenings and interventions necessary to meet the vision needs of preschool children throughout Orange County.
Related to developmental screenings, the use of the ASQ-3 developmental screening tool (a parent completed screening tool) provides a reliable evaluation of the developmental needs of the child and is now being utilized in most of the school districts. The SRNs continue to work with the private preschools in the communities as well to ensure that all the screening needs for preschool children are available, as well as the referral options for parents and their children. The importance of identifying children before the age of three and referral to Regional Center of Orange County is a primary focus for the nurses to assure access to services at an early age.
CHALLENGES
Recently, the SRNs are seeing an increase in the number of special needs children who are integrated into regular preschool classroom settings. The inclusion of these children with special needs is changing the Scope of Work for the SRN as they work with these families to address their medical needs. In 2017/18, the Commission will evaluate the Scope of Work of the SRN and evaluate how these changes are impacting the role of the SRN in the school districts.

CHILDREN’S DENTAL FY 16/17

Healthy Children: Children’s Dental, Fiscal Year 2016/17 1 of 4
CHILDREN’S DENTAL In 2000, the Surgeon General reported that tooth decay was the most common chronic childhood disease, resulting in more than 51 million lost school hours each year. The Commission responded to children’s oral health needs with an initial $1 million investment in Fiscal Year 2002/03 to support the creation of a child-friendly oral health center, and launch a new nonprofit exclusively focused on providing dental care and prevention services to children. The Healthy Smiles for Kids of Orange County (Healthy Smiles) children’s dental clinic opened in 2005. Today, the Commission continues to invest in multiple strategies, including increased education and prevention, expanded access to screening, and building a network of providers to provide basic and restorative care for young children.
While significant progress has been made and Orange County has the highest percentage of low income children in the state who have received a preventative visit annually,1 further collaborative efforts are needed to ensure that no child enters kindergarten with untreated tooth decay or misses school because of dental disease. Good dental health is important for children’s healthy growth and development, yet a survey conducted by the Dental Health Foundation found that one in three children in Orange County had untreated tooth decay, a rate higher than the statewide average.2 Further, 10% of Orange County children (ages one through 18) reported never having visited a dentist. Although when only young children (ages one through five) are considered, the proportion of children who have never visited a dentist increases to 20%.3
INVESTMENT
Healthy Smiles works in partnership with a collaborative of countywide community clinics to provide education and treatment services annually to young children and family members to prevent and treat tooth decay. Services are provided through several fixed clinic sites, mobile dental vans, and a partnership with the Children’s Hospital of Orange County (CHOC Children’s), and include:
• dental screenings • sealants and fluoride treatments • restorative treatment, including for children requiring sedation • parent and caregiver oral health education • a pediatric dental residency program
Healthy Smiles has focused on expanding service through partnerships with schools – going directly to where the children are located. In addition, Healthy Smiles sites include the Healthy Smiles clinics in Garden Grove and at CHOC.
1“Pediatric Denti-Cal Dentists by CA Counties.” Children Now. 2014 Web. 22 January 2015. 2 Dental Health Foundation. An oral health assessment of Orange County’s kindergarten and 3rd grade children. Orange County Smile Survey. 2005. 3 UCLA Center for Health Policy Research. California Health Interview Survey. 2011-2012.

Healthy Children: Children’s Dental, Fiscal Year 2016/17 2 of 4
The pediatric dental residency program continues to partner with CHOC Children’s and the University of Southern California’s Advanced Pediatric Dentistry Program. This unique program provides a vehicle by which to influence provider behavior by incorporating best practices into dental education. This program continues to train pediatric dental residents serving Orange County and Los Angeles County. Further, community pediatric dental providers have been engaged to serve as adjunct faculty to the residency program. This has contributed to increased access to dental care and improved comprehensive quality care to the most vulnerable children in Orange County.
Since 2003, the Commission has allocated millions of dollars to support children’s oral health programs in Orange County, funding services through Healthy Smiles for Kids of Orange County (Healthy Smiles) as well as a pediatric dental residency program. In Fiscal Year 2012/13, the Commission made a $20 million catalytic investment, to Healthy Smiles, to sustain children’s oral health over a 10-year period (Fiscal Years 2012/13 to 2021/22), including expanded access to services in south Orange County, promotion of the importance of early screening and prevention, and continued support for the pediatric dental residency program. In addition to the residency program, the Commission supports a retention program that makes student loan payments on behalf of pediatric dentists who are willing to continue their work with Healthy Smiles once they have graduated.
Children’s Dental Health Program and Catalytic Investments
ProgramFundsCatalyticFunds
The Commission’s funding for Children’s Dental is through a catalytic agreement, and as such, was not up for renewal in the most recent funding cycle.
OUTCOMES
$1,2
09,7
11
$1,4
04,8
85
$1,5
20,9
71
$1,3
83,3
75
$1,1
28,3
86
$1,3
57,7
33
$2,0
91,5
55
$2,1
80,5
67
$2,2
21,3
72
$2,4
07,3
23
$0
$500,000
$1,000,000
$1,500,000
$2,000,000
$2,500,000
$3,000,000
2007/08 2008/09 2009/10 2010/11 2011/12 2012/13 2013/14 2014/15 2015/16 2016/17

Healthy Children: Children’s Dental, Fiscal Year 2016/17 3 of 4
In Fiscal Year 2016/17, the Commission’s investment in oral health programs produced the following outcomes for children ages birth through five:
• 100% of children had no cavities at the end of services, exceeding the Commission’s goal of 91%
• 100% of children had health insurance coverage at the end of services • 100% of children had dental insurance coverage at the end of services • 13,465 children received preventative dental treatment (e.g., cleaning, sealant) • 10,065 children received a dental screening, including visual inspection and/or
assessment by professional dental resource • 220 children received restorative dental treatment and 157 children received
emergency dental treatment • 1,912 children were linked to a dental home • 23,523 children and 12,162 parents received oral health education • 256 providers received oral health education
HIGHLIGHTS
In FY 2016/17, Healthy Smile’s Smile Clinic expansion was completed and the new general anesthesia suite operational as of March 2017. Utilization of the new general anesthesia suite improved efficiencies and provided a better learning experience for dental residents as well. General anesthesia wait times at the clinic have been reduced and patients are now able to be scheduled within 30 to 45 days.
This year, the Commission worked together with community partners including the Health Care Agency, Healthy Smiles, Orange County Federally Qualified Health Centers, and the Coalition of Community Health Centers to collaborate on oral health initiatives. These members have formed the Health Improvement Partnership Oral Health Workgroup, which will continue to meet and partner toward common community oral health goals. In addition, the Commission applied for funding through the California Department of Health Care Service's Dental Transformation Initiative (DTI) as the lead agency. Orange County was awarded $11,143,767 of DTI funds over a three-and-a-half-year period, with implementation beginning July 1, 2017. Members of the Oral Health Workgroup will also serve as an advisory toward the Local Dental Pilot Project (LDPP) that has been developed to meet the goals of the DTI.
The aim of the Orange County Local Dental Pilot Project is to improve the oral health of vulnerable children in Orange County by accomplishing three goals: (1) Increase the use of dental health preventive services, resulting in a decreased use of oral health restorative services; (2) increase capacity for dental services within Orange County’s safety net; and (3) increase continuity of oral health care among children at high risk for disruptions in care. These goals will be accomplished via four strategies:

Healthy Children: Children’s Dental, Fiscal Year 2016/17 4 of 4
1. Helping children find a dental home through a call center and referral service2. Expanding virtual dental homes 3. Coordinating telephonic care to improve continuity of care4. Recruiting and training pediatric dental providers through oral health provider
forums and summits
CHALLENGES
Healthy Smiles continues to focus on decreasing the wait time for children needing treatment under general anesthesia for oral sedation at the CHOC Operating Room. The wait times have increased to nine months for these cases and attempts have been made to increase this availability at CHOC with little success. With the Garden Grove clinic expanding their capacity, some of these patients in need of general anesthesia are being scheduled at that facility. One option is to hire an anesthesiologist to do the intubation method of anesthesia and be comfortable with seeing older children. Other options to meet the challenge of the Operating Room time for the dental patient is to seek block time at other local hospitals or become a licensed surgery center with appropriate medical oversight.

COMMUNITY HEALTH FY 16/17

Healthy Children: Community Health, Fiscal Year 2016/17 1 of 4
COMMUNITY HEALTH Three areas fall under Community Health: community clinics, health access and education, and nutrition and fitness.
In recent years, the Commission has worked with community clinics to obtain Federally Qualified Health Center (FQHC) designations which allows them to seek federal reimbursement – a sustainable, long-term funding source. By 2016/17, all seven community clinics previously funded by the Commission had obtained FQHC status.
In terms of health access and education, the Commission funds three organizations to expand children and families’ access to quality health services: 2-1-1 Orange County, the American Academy of Pediatrics-Orange County Chapter, and the Community Health Initiative of Orange County.
2-1-1 Orange County supports access to health services by maintaining an up-to-date database with information on thousands of programs, referring callers to organizations qualified to address their specific need for health and human services. Those needs include food, shelter, transportation, prenatal care, substance abuse, child development and elder care.
The American Academy of Pediatrics-Orange County Chapter (AAP-OC) provides evidence-based recommendations for child health to pediatricians, parents, professionals and public policy makers. By partnering with AAP-OC, the Commission has access to pediatric experts, and national and state pediatric health standards, to ensure quality of services.
The Community Health Initiative of Orange County links children and families to health insurance and a health care home by screening them for health care and social services programs, determining their eligibility and assisting them with the enrollment process.
To help young children struggling with overweight and obesity, Serving Kids Hope and the Santa Ana Family YMCA offer programs to educate children and families about nutrition and physical activity, and provide access to related services. Serving Kids Hope, which is a community-based program for children and their families with an emphasis on nutrition education, fitness support and promoting healthy lifestyle choices, also provides early diagnoses and treatment of children with obesity and related health issues.
INVESTMENT
In FY 2016/17, the Commission funded the Coalition of Orange County Community Health Centers (which has several clinic sites in Orange County that provide pediatric services) to provide medical and dental services for the pediatric patient. The Commission

Healthy Children: Community Health, Fiscal Year 2016/17 2 of 4
also provided funding this fiscal year to two clinics: El Sol Academy/SOS Wellness Clinic, and Boys and Girls Clubs of Garden Grove/ARCHES. The Coalition has seen a decrease in the number of pediatric patients utilizing their services this year and will continue to reach out to the community to improve access to services. The El Sol clinic hired an additional pediatrician to serve the pediatric population at this site and to help promote services for families in Santa Ana.
The Commission’s investment in 2-1-1 ensures its database is up-to-date for services specific to Orange County families with children younger than age six who have unique needs. In 2016, 2-1-1 Orange County received more than 160,000 calls for assistance. About 25% of those calls were from families with a child aged 0-5 in the household. For families with young children, the greatest proportion of calls were for assistance with housing, as well as other supports such as clothing, utilities, food and meals. The number of calls for mental health referrals for families with children under six, rose significantly from 1,531 in 2015 to 2,400 in 2016.
In 2016/17, the Commission’s work with AAP-OC focused on two areas: early literacy and developmental screenings. Reach Out and Read supports more than 60 pediatric practices and clinics in Orange County. New partners were identified and provided free and discounted new books for Reach Out and Read sites. Through Kaiser Permanente of Southern California and Scholastic Books, Inc, AAP-OC obtained more than $10,000 of in-kind donated books.
AAP-OC Chapter continues to participate with an Orange County collaborative focusing on expanding formal developmental screenings to all health and community providers serving young children. AAP-OC Chapter also assisted with the administration of a statewide survey of providers to assess current developmental screening practices, and attitudes/barriers of providing this service in the office setting.
Community Health Initiative of Orange County (CHI OC) continued to screen children and families for health care and social service programs, determining their eligibility and assisting them with the enrollment process. This fiscal year, CHI OC continued to see increasing numbers of families enrolled in social service programs and care coordination. They reach out to families with uninsured children, which is estimated to be approximately 3.5% of the population served. After families apply, CHI OC’s Certified Application Assistants (CAAs) follow-up with them, ensure that they can access their covered benefits and that their coverage is renewed every year. In FY 2016/17, CHI OC connected with nearly 650 families without medical and dental insurance as well as a medical home. More than 2,700 referrals were made for families in need of access and more than 1,600 families received follow up calls to assure linkage with the referrals provided.
The Commission continued its funding for Serving Kids Hope-Dr. Riba’s Health Club in FY 2016/17 to reach underserved children from birth through age five. They diagnose and treat children who are obese or at risk of obesity, using nutrition and fitness interventions. In May

Healthy Children: Community Health, Fiscal Year 2016/17 3 of 4
2008, the Commission approved $8.5 million in catalytic funding for an agreement with the YMCA-Santa Ana to create and sustain physical fitness and obesity prevention/treatment services. The site includes an aquatics center, an outdoor soccer arena and provides a home for Serving Kids Hope, allowing the agency to provide health, nutrition, physical fitness, pool safety, and community services to Santa Ana and residents of adjacent communities. This program helps families build a commitment to fitness and maintain a healthy body weight by providing access to fitness and prevention activities. No additional operational funds were provided to the YMCA-Santa Ana in FY 2016/17.
Community Health Program and Catalytic Investments
OUTCOMES
In Fiscal Year 2016/17, the Commission’s investment in the community health programs produced the following outcomes for children from birth through age five:
• 24,170 parents received referrals to services • 1,557 children were linked to a health care home • 974 children received nutrition and physical activity education • 919 children received primary care services, including well child and sick visits
HIGHLIGHTS
This year, 2-1-1 Orange County successfully transitioned to an online reporting system. This allows the Commission and others to easily access information about callers and trends relating to the most pressing issues facing our demographic, especially families with young children.
$2,54
2,34
8
$2,62
7,58
5
$2,28
1,88
2
$1,13
4,76
3
$1,01
3,87
4
$398,047$123,408
$136,756
$558,755
$2,137,452
$0
$500,000
$1,000,000
$1,500,000
$2,000,000
$2,500,000
$3,000,000
$3,500,000
2012/13 2013/14 2014/15 2015/16 2016/17
Program Cataly@c

Healthy Children: Community Health, Fiscal Year 2016/17 4 of 4
After working with a fundraising consultant, AAP-OC Chapter began to implement recommendations to increase sustainability of priority initiatives in 2016/17. Results included successful campaigns, AAP-OC’s most prosperous gala to date, and web page changes to promote new branding messages and recognize donors.
A steady decrease in BMI is being documented. Serving Kids Hope, through the components of medical management, nutritional guidance and physical activity support, is seeing an 80% decrease or normalization of the BMI percentile for the clients served. At the Santa Ana Health Club, more than 420 children participated in this program, focusing on healthy lifestyles including nutrition and physical activity to decrease obesity. Similarly, Santa Ana YMCA is seeing a steady decrease in BMI’s, providing a healthier lifestyle for children in the long term. In FY 2016/17, the Santa Ana YMCA provided the opportunity for more than 400 children and their parents to participate in the swimming program and more than 200 children to participate in sports activities that were available.
CHALLENGES
This year, the health care landscape changed significantly. One of the challenges faced by clinic sites is a decrease in the pediatric population with no apparent reason. The assumption is that families have continued to enroll in medical coverage and have been accessing their health care needs through their assigned medical homes. The Commission continued its shift from funding direct services to supporting clinics’ move to FQHC status and increased federal reimbursement for services. The Commission’s investment now largely focuses on increasing the quality of care through medical professional support.
Developmental screenings in Orange County occur in multiple settings, but only minimally by pediatricians or family practitioners in the provider setting. Over the next three years, the Commission is committed to working with AAP-OC to increase provider developmental screenings. AAP-OC will develop a quality improvement project with a health network, establishing a planning committee, identifying an appropriate network, recruiting practices and evaluating outcomes.
One of the challenges faced by Serving Kids Hope is the adequacy of space to provide the variety of services available for children and their families. The next steps will be to evaluate options for a new location, with the plan to relocate in the next two years.

PEDIATRIC HEALTH
SERVICES FY 16/17

Healthy Children: Pediatric Health Services, Fiscal Year 2016/17 1 of 5
PEDIATRIC HEALTH SERVICES In May 2003, the Commission approved the formation of the Pediatric Health Services Committee. The Committee’s responsibilities include: identifying priority pediatric health needs based on assessment of local conditions and issues, including input from educational and other communities; developing recommended programmatic areas for funding for improvements in children’s health related to school readiness; overseeing and evaluating the Commission’s investments in pediatric health services; and serving as the Commission’s Technical Advisory Committee.
In FY 2016/17, the Commission provided funding to the following programs under the umbrella of Pediatric Health Services:
Early Deve lopmental Servi ces
• The Center for Autism and Neurodevelopmental Disorders • Child Behavior Pathways • Early Developmental Assessment Center • Help Me Grow Orange County
Spec ial ty Servi ces
• Pediatric Subspecialty Loan Repayment • Community Support • Pediatric Vision Services
INVESTMENT
The Center for Autism and Neurodevelopmental Disorders (The Center) provides comprehensive evaluations, diagnosis, treatment, and management of children of all ages who are suspected of having developmental, behavioral or learning problems. The Center also provides family support, education, and advocacy, including workshops for parents with methods on how to deal with the behaviors associated with their child’s diagnosis. Families with children on the waitlist can participate in these workshops. In FY 2016/17, more than 5,000 parents attended classes, created specifically to address children’s behavioral health issues. Additionally, the Center trained more than 4,600 physicians in identifying and diagnosing suspected developmental and behavioral problems.
Child Behavior Pathways provides a preventive and “intervention before diagnosis” approach for behavioral disorders using a nine-week Community Parent Education (COPE) course, nine-week COPEing with Toddler Behavior classes, social skills lessons for children, and teacher training services. Child Behavior Pathways helps parents and teachers effectively manage challenging behaviors, improve family/classroom functioning, and encourage healthy relationships with infants, toddlers, and preschool age children. In FY 2016/17, Child Behavior Pathways provided more than 580 parent education classes for practical

Healthy Children: Pediatric Health Services, Fiscal Year 2016/17 2 of 5
interventions to work with children and their behavioral disorder. They also conducted trainings for providers with instruction on social skill development and specific interventions that can be utilized to deal with the special behavioral needs of young children. These trainings were attended by more than 390 providers this Fiscal Year.
Early Developmental Assessment Center (EDAC) provides comprehensive, multidisciplinary developmental and nutritional assessments, education, intervention strategies, care coordination and advocacy for high-risk infants and toddlers who have been referred from neonatal intensive care units and the community. In FY 2016/17 the EDAC continued to provide education for new physicians in the hospital setting as well as in their practices in the community. In FY 2016/17 to more than 1,000 providers were educated on the special needs of the children discharged from the NICU. Additionally, EDAC provided parent education and community resources to more than 1,500 parents – a significant increase over the previous fiscal year. Referrals based on the developmental needs and results of screening assessments are another important focus for this program. EDAC provided more than 1,275 referrals to community resources to address the needs of these infants.
Help Me Grow Orange County (HMG-OC) is based on a national systems model of developmental promotion, early detection and linkage to services. Orange County is part of the HMG National Network that includes more than 51 systems in 20 states across the country. Help Me Grow Orange County works with primary health care providers to promote and offer training in developmental surveillance and screening. In FY 2016/17, 159 health care providers and 46 medical students were engaged as part of the HMG-OC outreach with health care providers to promote and offer training in developmental surveillance and screening and linkage to services.
The Pediatric Subspecialty Loan Repayment program was created by the Commission in 2009 to address the shortage of pediatric subspecialists and the difficulties in recruiting such specialists to Orange County. Providers receive up to $125,000 for expenses incurred for undergraduate and graduate medical education. In exchange, the physicians agree to serve children from birth through age five and to affiliate with an Orange County hospital, clinic or physician practice with a patient base of at least 51% Medi-Cal beneficiaries for a three-year period. Dr. Taylor Lucas, the Commission’s funded Pediatric Fellow, continued to work with various community partners to identify local practice barriers and challenges in the management of obesity for the young child. She worked closely with the Resident programs of UCI, CHOC, and Millers to educate and focus on the importance of obesity prevention for young children. Dr. Taylor Lucas was involved in the interdisciplinary clinics at UCI (Santa Ana and Anaheim sites) that focused on health-related issues related to children with BMI’s greater than 85%. These clinics provided parent and child education and included play and physical activities to promote the improved wellness of these children.
Funding for this program was completed in December 2016, with sustainability goals being the focus to maintain these programs over time. Dr. Taylor Lucas is actively involved in the

Healthy Children: Pediatric Health Services, Fiscal Year 2016/17 3 of 5
community efforts through various organizations to promote the challenges of obesity management in the young child and through her collaboration with community groups as well as UC Irvine, Miller’s Children, CHOC, etc. she will seek out additional funding resources in support of this effort.
Community Support. In May 2012, the Pediatric Health Services Committee recommended a catalytic investment of $250,000 to help address the problem of child abuse, neglect and trauma in Orange County. The catalytic funding was used to support the Orange County Social Services Agency Chief Medical Officer (SSA CMO) position, which was filled in FY 2014/15. Over the past year, the SSA CMO has worked to develop a robust coalition (WE CAN) to prevent, diagnose, and treat child abuse and neglect and to strengthen the health and well-being of children, families and communities. The WE CAN Coalition includes broad representation from diverse sectors of stakeholders with representatives from more than 60 organizations and 100 programs and partnerships across Orange County. To achieve the mission and vision of the Coalition, they have formed nine distinct task forces. Task forces are working to assess their sector’s needs and identify strategic goals. A Steering Committee composed of each task force’s elected leaders and key county stakeholders oversees global strategic and organizational decisions.
In May 2013, the Commission allocated $1.5 million in catalytic funding for Orange County Pediatric Vision Services. The project is implemented through a contract with the University of California, Irvine’s Gavin Herbert Eye Institute as well as CHOC Children’s Hospital. The goals of the Pediatric Vision Services include:
• Identify and implement standards of care for Orange County pediatric vision services • Expand ages to ensure screening of 3 and 4-year olds • Ensure connection to the medical home and health coverage • Implement an information technology system for the management of vision related
health information • Develop an educational component for child’s family and community providers.
This Fiscal Year, the Commission designated funds to be used as a match for a federal Intergovernmental Transfer (IGT) transaction. The IGT transaction will yield new funding for the Pediatric Health Services Program, and significantly enhances the sustainability of this program for the next nine years. The Fiscal Year 2016/17 budget included $2,245,476 in IGT funds.

Healthy Children: Pediatric Health Services, Fiscal Year 2016/17 4 of 5
Pediatric Health Services Program and Catalytic Investments
OUTCOMES
In Fiscal Year 2016/17, the Commission’s investment in Pediatric Health Services programs produced the following services and outcomes for children from birth through five:
• 6,964 parents received specialty care education, resources, referrals, and support • 5,843 providers were educated on child development, recognizing key milestones,
and the importance of screening and/or assessment • 3,388 children received a vision screening using evidence-based tools (e.g., LEA,
SureSight, PlusOptix12, etc.) • 2,126 children received an assessment (e.g., vision, hearing, speech/language,
psychosocial issues, motor skills, health, special needs, and/or parent-child functioning)
• 399 providers received training on behavioral health treatment services for children 0-5
HIGHLIGHTS
In FY 2016/17, the Center for Autism focused on an internal process to improve waitlist management and put significant emphasis on hiring new providers to assist with the assessment and diagnosis of children, as well as providing more intervention services. With additional staff available, the Center placed an increased emphasis on training medical and mental health providers about Autism Spectrum Disorder (ASD). The Center also placed significant effort on improving clinical flow by revamping their triage process. This effort, coupled with an increase in providers, allowed the Center to reduce their wait time for families to an average of three months as of May 2017.
$3,94
9,04
0
$4,12
0,09
9
$3,43
3,91
7
$3,36
7,30
7
$5,33
3,07
7
$2,000,000$3,000,000
$2,013,306$1,267,390
$682,992
$0
$1,000,000
$2,000,000
$3,000,000
$4,000,000
$5,000,000
$6,000,000
$7,000,000
$8,000,000
2012/13 2013/14 2014/15 2015/16 2016/17
Program Cataly@c

Healthy Children: Pediatric Health Services, Fiscal Year 2016/17 5 of 5
Help Me Grow Orange County, in partnership with Orange County Department of Education/Quality Start OC, implemented an innovative pilot project to reach family child care providers. They implemented online access to developmental screening for children receiving care in family child care homes and completed 111 screenings.
In FY 2016/17, Pediatric Vision Services received an endowment gift of $1,000,000 in addition to other donations. These funds provide free services and glasses to disadvantaged children. Using the EyeMobile Van, the program increased the number of children served in more than eight school districts this year and will expand that service next year. This year, the Vision van screened more than 3,246 children and distributed 598 new glasses and 60 replacement glasses in the private and public school systems.
CHALLENGES
Over the past year, the Center for Autism provided more education and training opportunities for parents and caretakers. Considering the difficulties of attending meetings in person due to busy work schedules, juggling numerous therapy visits, babysitting needs, and other life commitments, the Center pursued and received funding from McBeth Foundation to video parent trainings, which means the trainings will be accessible online for free.
One of the challenges faced by Child Behavior Pathways is financial sustainability. Child Behavior Pathways continues to work with individual school districts to provide school-based Mental Health service contracts and will continue to seek other sustainability efforts in support of the program.
The challenges faced by the Pediatric Vision program have been missed appointments and a lack of understanding by parents about the importance of vision services. The focus has been to provide additional education about the benefits, and value of the program and services that are available.
Because Commission funding alone cannot sustain important Pediatric Health Services, future work will focus on:
1. Helping to develop systems to support specialty medical services
2. Engaging with community partners (such as Social Services Agency, Health Care Agency, Orange County Department of Education) to look at system supports for those needs in a comprehensive and collaborative way.

HEALTHY
CHILDREN APPENDICES
FY 16/17

Healthy Children: APPENDICES, Fiscal Year 2016/17 1 of 17
APPENDICES – DETAILED OUTCOMES TABLES Bridges Maternal Child Health Network
In Fiscal Year 2016/17, the Commission’s investment in the Bridges Network produced the following services for children from birth through age five:
Table 1. Aggregate Data for Bridges Network
Children Ages 0-5 Family Members Service Providers Number of people receiving services*
13,459 25,518 24
Number of services provided
87,273 171,782 1,467
* Although each grantee reports an unduplicated count, clients served by more than one program may be counted more than once when data from multiple grantees are added together.
Table 2. Description of Children Served in FY 16/17 by Bridges Network Total2 Variable Considered Category Label Count1 Percent Total number of children with client-level data 3,857 100.0
Age at most recent interview Under age Three Three through Five
3,540 317
91.8 8.2
Ethnicity Amer. Indian/Alaska Native Asian
Black/African American Hispanic/Latino Pacific Islander White Vietnamese Multiracial Other Unknown
2 43 35 3,334 12 210 47 109 60 5
0.05 1.1 0.9 86.4 0.3 5.4 1.2 2.8 1.6 0.1
Primary Language English Spanish Vietnamese Korean Mandarin Farsi Filipino Other Unknown
1,108 1,936 34 1 21 5 3 101 648
28.7 50.2 0.9 0.03 0.5 0.1 0.08 2.6 16.8
At or Below 200% Federal Poverty Level 1,499 92.5

Healthy Children: APPENDICES, Fiscal Year 2016/17 2 of 17
1The counts for specific demographic variables may be less than the total number of children entered into the Commission’s Data Collection and Reporting System. This typically occurs because survey respondents decline to answer a specific question, or an error in data entry results in an out-of-range value that must be deleted.
2The majority of clients served by Bridges Providers were also served by Bridges Hospitals. The Total column includes the unduplicated number of clients served by both Bridges Hospitals and Providers.
Table 3. Services Provided by Bridges Network Grantees
Strategic Plan Outcome Service Clients
Served Number of Services
HC.1 Increased percent of children born healthy
Case management meetings/home visits to support prenatal care
453 1,453
Pregnant women receive support for healthy pregnancy and early childhood health, including screening and education for alcohol, tobacco and other drugs (ATOD)
8,565 8,565
Home visits/case management meetings conducted with parents with a history of ATOD abuse
83 297
HC.2 Increased percent of children receiving developmental / behavioral screenings at milestone ages with linkage to appropriate services
Children receive developmental and/or behavioral screening using AAP recommended tools (e.g. PEDS, ASQ, ASQ-SE, MCHAT, Child Behavior Checklist)
1,691 2,804
Children screened for up to date immunizations
1,772 4,421
Children receive assessment (i.e., vision, hearing, speech/language, psychosocial issues (cognitive, emotional, behavioral), motor skills, health, special needs, and/or parent-child functioning)
631 1,641
Parents receive referrals regarding their child's health and developmental concerns
927 1,070
Parents are linked to referred services for their child's health and developmental concerns
557 611
HC.3 Increased percent of children have and use a health home for comprehensive health services to include physical, dental and mental health
Children are linked with health insurance enrollment
260 260
Children are linked to a health care home 307 307 Parents receive education on oral health 1,649 3,183
HC.4 Increased percent of children
Mothers receive breastfeeding education, intervention and support (prenatal and/or
13,945 31,128

Healthy Children: APPENDICES, Fiscal Year 2016/17 3 of 17
Strategic Plan Outcome Service Clients
Served Number of Services
growing up in healthy and safe environments
post-natal) according to the recommendations of the American Academy of Pediatrics Parents receive Hepatitis B and/or Pertussis vaccine information in the hospital
12,700 28,866
Parents receive home visits focused on ongoing medical surveillance and linkage to appropriate referrals
150 447
SF.2 Increased percent of children are safe
Parents receive home safety checks using a Commission-approved tool
1,436 2,126
SF.3 Increased parent knowledge and skills to help prepare children to reach their optimal potential
Home visits to improve parent knowledge of healthy child development
2,535 16,109
SF.4 Increased access to and availability of family support services and resources
Mothers are screened with the Bridges Screening Tool
10,317 10,317
Parents receive referrals to MCHN programs 1,860 1,860 Parents receive referrals to non-MCHN programs
11,269 55,101
Parents receive follow up on referrals and services are accessed
1,522 5,561
Parents receive Kit for New Parents 23,146 23,146 Parents receive behavioral health screening 1,261 3,474
CB.1 Maximize all sustainability activities
Dollar amount raised from program fees/revenue
N/A $0
Dollar amount raised from individual donations
N/A $0
Dollar amount raised from Foundation donations
N/A $10,976
Dollar amount raised from government funds/grants
N/A $0
Dollar amount of in-kind contribution generated
N/A $164,784
Dollar amount received by leveraging Commission dollars
N/A $756,592
CB.2 Increase access and efficiency, quality and effectiveness
Developing partnerships, coordinating and collaborating with other agencies to improve service delivery
N/A 5
Technical assistance is provided, such as assistance with sustainability plans, evaluation activities, and providing quality services
14 1,460

Healthy Children: APPENDICES, Fiscal Year 2016/17 4 of 17
Strategic Plan Outcome Service Clients
Served Number of Services
Provide trainings to build the capacity of the agency to increase quality services (including STEM related activities)
10 8
CB.3 Promote data to support decision making and program improvement
Children with special needs served 1,262 1,262
*Children receive more than one screening over the course of the program.
Table 4. Service Outcomes (SOQs) for Bridges Network Programs Key Strategic Plan Objectives SOQ Results Healthy Children • Increase to 100% the number of children
with health coverage • 99.7% of children served had health insurance
at the end of services (compared to 99.4% at the beginning of services)
• Increase to 100% the proportion of children who have a health care home
• 97.2% of children had a medical health home at the end of services (compared to 94.7% at the beginning of services)
• Increase age appropriate immunization levels to at least 95%
• 95.2% of children received all age appropriate immunizations at the end of services (compared to 89.4% at the beginning of services)
• Increase to at least 90% the proportion of all pregnant women who receive early prenatal care, and decrease racial/ ethnic disparities
• 90.6% of mothers received prenatal care in the first trimester
• Reduce the percentage of infants exposed to alcohol, tobacco, and other drugs (ATOD) to zero percent (0%)
• 11.5% of expectant mothers used ATOD prior to starting intervention
• Increase to at least 90% the proportion of mothers who breastfeed their babies at early post-partum and to 50% those who continue to breastfeed at 6 months, any or exclusive
• 55.3% of mothers breastfed their babies until 6 months of age

Healthy Children: APPENDICES, Fiscal Year 2016/17 5 of 17
School Readiness Nurses
Table 1. Aggregate Data for School Readiness Nursing Children Ages 0-5 Family Members Service Providers Number of people receiving services*
15,691 12,356 1,063
Number of services provided
119,082 48,796 2,242
* Although each grantee reports an unduplicated count, clients served by more than one program may be counted more than once when data from multiple grantees are added together.
Table 2. Description of Children Served in FY 16/17 by School Readiness Nursing (n=15,691)
Variable Considered Category Label Count1 Percent
Age at most recent interview
Under Three Three through Five Unknown
505 15,186
0
3.2 96.8 0.0
Ethnicity
Amer. Indian/Alaska Native Asian
Black/African American Hispanic/Latino Middle Eastern Pacific Islander White/Caucasian Vietnamese Multiracial Other Unknown
513 1,443 272
8,247 305 97
2,927 873 594 71 349
3.3 9.0 1.7 52.6 1.9 0.6 18.7 5.6 3.8 0.5 2.2
Primary Language
Arabic English Farsi (Persian) Filipino (Tagalog) Korean Mandarin (Putonghua) Spanish Vietnamese Other Unknown
117 9,494
39 14 62 97
4,729 658 183 298
0.7 60.5 0.2 0.1 0.4 0.6 30.1 4.2 1.2 1.9
At or Below 200% Federal Poverty Level 445 82.9 1The counts for specific demographic variables may be less than the total number of children entered into the Commission’s Data Collection and Reporting System. This typically occurs because survey respondents decline to answer a specific question, or an error in data entry results in an out-of-range value that must be deleted.

Healthy Children: APPENDICES, Fiscal Year 2016/17 6 of 17
Table 3. Services Provided by School Readiness Nursing Grantees Strategic Plan
Outcome Service Clients
Served Number
of Services HC.2 Increased percent of children receiving developmental / behavioral screenings at milestone ages with linkage to appropriate services
Children receive developmental and/or behavioral screening using AAP recommended tools (e.g. PEDS, ASQ, ASQ-SE, MCHAT, Child Behavior Checklist)
10,563 11,517
Children receive a dental screening, including visual inspection and/or assessment by professional dental resource
10,383 10,479
Children screened for up to date immunizations 13,348 13,886 Children receive vision screening using evidence-based tools (e.g., LEA, SureSight, PlusOptix12, etc)
10,654 11,025
Children receive hearing screening using evidence-based tools (e.g., OEA, Audiometry, Pure Tones, Tympanometry)
9,701 10,307
Children receive body composition and stature screening (height, weight, BMI)
10,289 10,677
Children receive health status screening (i.e., asthma, allergies, etc.)
13,184 13,864
Parents receive referrals regarding their child's health and developmental concerns
5,787 7,104
Parents are linked to referred services for their child's health and developmental concerns
3,853 4,759
HC.3 Increased percent of children have and use a health home for comprehensive health services to include physical, dental and mental health
Children are linked with health insurance enrollment 22 22 Children are linked to a health care home 38 38
SF.3 Increased parent knowledge and skills to help prepare children to reach their optimal potential
Office visits to improve parent knowledge of healthy child development
15,317 22,201
Parents participate in parenting education classes on healthy child development
4,977 368
Children receive health education classes 7,207 730 Providers receive consultations to improve provider knowledge of healthy child development
1,195 1,845
CB.2 Increase access and efficiency, quality and effectiveness
Children with special needs served 1,813 1,813
Table 4. Service Outcomes (SOQs) for School Readiness Nursing Grantees
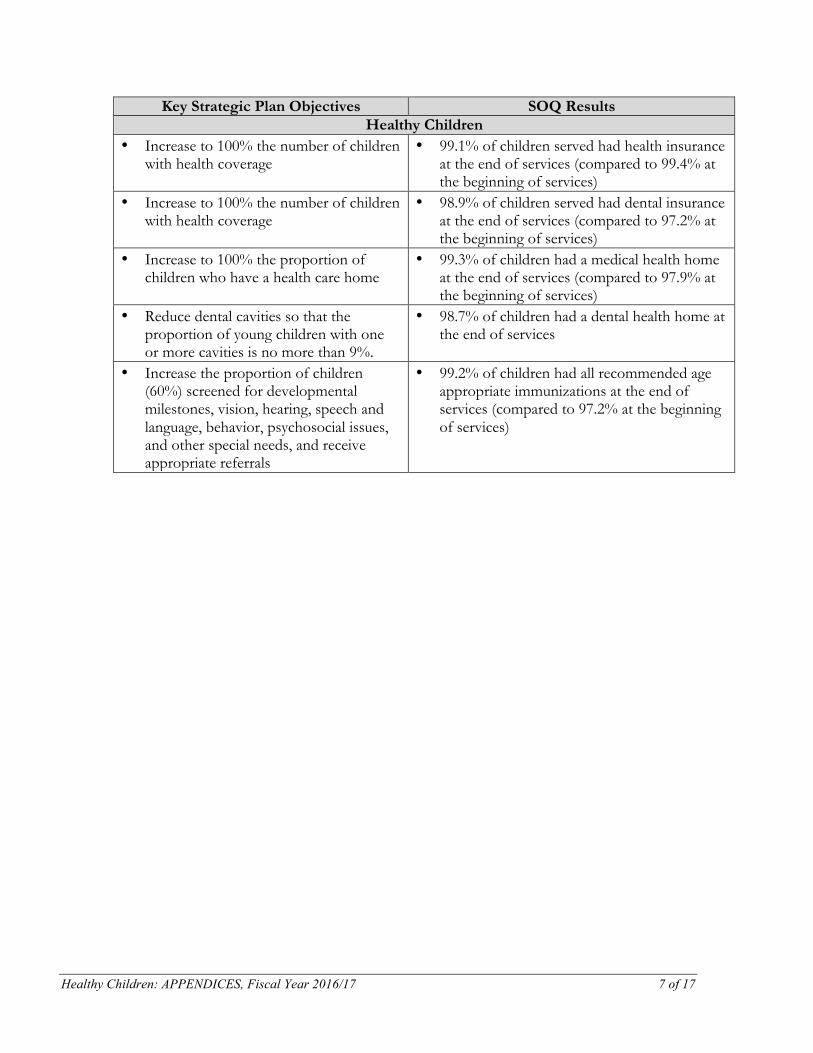
Healthy Children: APPENDICES, Fiscal Year 2016/17 7 of 17
Key Strategic Plan Objectives SOQ Results Healthy Children
• Increase to 100% the number of children with health coverage
• 99.1% of children served had health insurance at the end of services (compared to 99.4% at the beginning of services)
• Increase to 100% the number of children with health coverage
• 98.9% of children served had dental insurance at the end of services (compared to 97.2% at the beginning of services)
• Increase to 100% the proportion of children who have a health care home
• 99.3% of children had a medical health home at the end of services (compared to 97.9% at the beginning of services)
• Reduce dental cavities so that the proportion of young children with one or more cavities is no more than 9%.
• 98.7% of children had a dental health home at the end of services
• Increase the proportion of children (60%) screened for developmental milestones, vision, hearing, speech and language, behavior, psychosocial issues, and other special needs, and receive appropriate referrals
• 99.2% of children had all recommended age appropriate immunizations at the end of services (compared to 97.2% at the beginning of services)

Healthy Children: APPENDICES, Fiscal Year 2016/17 8 of 17
Children’s Dental
Table 1. Aggregate Data for Oral Health Children Ages 0-5 Family Members Service Providers Number of people receiving services*
27,424 12,223 258
Number of services provided
31,875 13,141 258
* Although each grantee reports an unduplicated count, clients served by more than one program may be counted more than once when data from multiple grantees are added together.
Table 2. Description of Children Served in FY 16/17 by Oral Health (N=978)
Variable Considered Category Label
Count1
Percent
Age at most recent interview
Under Three Three through Five
408 570
41.7 58.3
Ethnicity Amer. Indian/Alaska Native Asian
Black/African American Hispanic/Latino Pacific Islander White Vietnamese Multiracial Other Unknown
0 22 5
750 2
103 9 57 15 15
0.0 2.2 0.5 76.7 0.2 10.5 0.9 5.8 1.5 1.5
Primary Language Arabic English Farsi (Persian) Filipino (Tagalog) Korean Mandarin (Putonghua) Spanish Vietnamese Other Unknown
0 537 3 1 2 2
417 6 7 3
0.0 54.9 0.3 0.1 0.3 0.2 42.6 0.6 0.7 0.3
At or Below 200% Federal Poverty Level 985 95.9
1The counts for specific demographic variables may be less than the total number of children entered into the Commission’s Data Collection and Reporting System. This typically occurs because survey respondents decline to answer a specific question, or an error in data entry results in an out-of-range value that must be deleted.
Table 3. Services Provided by Oral Health Grantees Strategic Plan
Outcome Service Clients
Served Number of
Services HC.2 Increased percent of children receiving developmental /
Children receive a dental screening, including visual inspection and/or assessment by professional dental resource
10,065 10,065

Healthy Children: APPENDICES, Fiscal Year 2016/17 9 of 17
Strategic Plan Outcome
Service Clients Served
Number of Services
behavioral screenings at milestone ages with linkage to appropriate services HC.3 Increased percent of children have and use a health home for comprehensive health services to include physical, dental and mental health
Children are linked with health insurance enrollment
61 61
Children are linked to a dental home 1,912 1,912 Children receive preventative dental treatment (e.g., cleaning, sealant)
13,465 15,272
Children receive restorative dental treatment (e.g., carries)
220 1,218
Children receive emergency dental treatment (e.g., abscess)
157 589
Children with special needs receive dental care 1,081 2,295
Parents receive education on oral health 12,162 13,080
Children receive oral health education 23,523 23,534 Providers receive oral health education 258 258
SF.4 Increased access to and availability of family support services and resources
Parents receive follow up on referrals and services are accessed
917 917
CB.1 Maximize all sustainability activities
Dollar amount raised from program fees/revenue
N/A $2,873,826
Dollar amount raised from individual donations N/A $243,735 Dollar amount raised from Foundation donations N/A $925,505 Dollar amount raised from government funds/grants
N/A $0
3CB.2 Increase access and efficiency, quality and effectiveness
Public information and outreach campaign to increase community awareness of an issue or to promote awareness of access to services (e.g., where to go if need screening, importance of teeth brushing, developmental screenings, immunizations, breastfeeding, importance of fatherhood)
N/A 74
Developing partnerships, coordinating and collaborating with other agencies to improve service delivery
N/A 3
Educational loan repayments are made on behalf of providers who meet the established selection criteria
2 $16,150

Healthy Children: APPENDICES, Fiscal Year 2016/17 10 of 17
Table 4. Service Outcomes (SOQs) for Oral Health Grantees Key Strategic Plan Objectives SOQ Results
Healthy Children • Increase to 100% the number of
children with health coverage • 100% of children served had health insurance at
the end of services (compared to 99.6% at the beginning of services)
• Increase to 100% the number of children with health coverage
• 100% of children served had dental insurance at the end of services (compared to 99.9% at the beginning of services)
• Increase to 100% the proportion of children who have a health care home
• 98.0% of children had a medical health home at the end of services (compared to 97.7% at the beginning of services)
• Increase to 100% the proportion of children who have a health care home
• 99.7% of children had a dental health home at the end of services (compared to 97.5% at the beginning of services)
• Reduce dental cavities so that the proportion of young children with one or more cavities is no more than 9%
• 100% of children had no cavities at the end of services (compared to 78.9% at the beginning of services)

Healthy Children: APPENDICES, Fiscal Year 2016/17 11 of 17
Community Health
Table 1. Aggregate Data for Community Health Children Ages 0-5 Family Members Service Providers Number of people receiving services*
5,460 22,540 1,162
Number of services provided
12,237 51,025 1,188
* Although each grantee reports an unduplicated count, clients served by more than one program may be counted more than once when data from multiple grantees are added together.
Table 2. Description of Children Served in FY 16/17 by Community Health (N=3,687)
Variable Considered Category Label Count1 Percent Age at most recent interview
Under Three Three through Five Unknown age
884 1,940
863
24.0 52.6 23.4
Ethnicity Amer. Indian/Alaska Native Asian Black/African American Hispanic/Latino Pacific Islander White Vietnamese Middle Eastern Multiracial Other Unknown
19 42 13
2,552 2
561 158
1 12 23
304
0.5 1.2 0.4
69.2 0.1
15.2 4.3
0.03 0.3 0.6 8.2
Primary Language English Spanish Vietnamese Korean Mandarin Farsi Filipino Other Unknown
1,772 1,566
141 0 0 1 0
12 195
48.1 42.5 3.8 0.0 0.0
0.03 0.0 0.3 5.3
At or Below 200% Federal Poverty Level 352 92.5 1The counts for specific demographic variables may be less than the total number of children entered into the Commission’s Data Collection and Reporting System. This typically occurs because survey respondents decline to answer a specific question, or an error in data entry results in an out-of-range value that must be deleted.

Healthy Children: APPENDICES, Fiscal Year 2016/17 12 of 17
Table 3. Services Provided by Community Health Grantees Strategic Plan
Outcome Service Clients
Served Number
of Services HC.1 Increased percent of children born healthy
Pregnant women receive support for healthy pregnancy and early childhood health, including screening and education for alcohol, tobacco and other drugs (ATOD)
18 18
HC.2 Increased percent of children receiving developmental / behavioral screenings at milestone ages with linkage to appropriate services
Providers trained on how to screen, assess and/or identify child developmental milestones
8 5
Providers educated on child development, recognizing key milestones, and the importance of screening and/or assessment
161 10
Children receive developmental and/or behavioral screening using evidence-based screening tools (i.e., PEDS, ASQ, ASQ-SE, MCHAT, Child Behavior Checklist)
514 799
Children receive vision screening using evidence based tools (i.e., LEA, SureSight, PlusOptix12)
204 217
Parents receive referrals regarding their child's health and developmental concerns
229 335
HC.3 Increased percent of children have and use a health home for comprehensive health services to include physical, dental and mental health
Children are linked with health insurance enrollment
916 916
Children are linked to a health care home 1,557 1,557 Children receive primary care services/visits, including well child and sick visits
919 2,247
Children are linked to a dental home 398 398
HC.4 Increased percent of children growing up in healthy and safe environments
Parents (pregnant women and families with infants) receive nutrition and physical activity education
46 53
Children enrolled in nutrition and/or physical activity program
187 623
Children receive nutrition and physical activity education
974 974
Children participate in YMCA Aquatic Center programs
429 8,524
Parents participate in YMCA Aquatic Center programs
251 4,800
Children participate in YMCA sports programs
210 808
Providers receive specialty care education 515 515 SF.4 Increased access to and availability of
Parents receive referrals to services 24,170 44,144 Providers receive referrals to services 74 226

Healthy Children: APPENDICES, Fiscal Year 2016/17 13 of 17
Strategic Plan Outcome
Service Clients Served
Number of Services
family support services and resources
Parents receive follow up on referrals and services are accessed
3,100 3,376
EL.1 Increased all children’s developmental skills to be proficient learners in school
Provider will recruit and support pediatrician offices to participate in Reach Out Read National Program
104 43
B.1 Maximize all sustainability activities
Dollar amount raised from program fees/revenue
N/A $2,250
Dollar amount raised from individual donations
N/A $110,208
Dollar amount raised from Foundation donations
N/A $961,860
Dollar amount raised from government funds/grants
N/A $1,844,544
Dollar amount of in-kind contribution generated
N/A $86,102
Dollar amount received by leveraging Commission dollars
N/A $61,276
Make available space for use by Commission grantees (days)
N/A 256
CB.2 Increase access and efficiency, quality and effectiveness
Public information and outreach campaign to increase community awareness of an issue or to promote awareness of access to services
N/A 317
Developing partnerships, coordinating and collaborating with other agencies to improve service delivery
N/A 249
Technical assistance is provided, such as assistance with sustainability plans, evaluation activities, and providing quality services
99 63
Provide trainings to build the capacity of the agency to increase quality services (including STEM related activities)
6 8
CB.3 Promote data to support decision making and program improvement
Children with special needs served 15 15
Table 4. Service Outcomes (SOQs) for Community Health Grantees Key Strategic Plan Objectives SOQ Results

Healthy Children: APPENDICES, Fiscal Year 2016/17 14 of 17
Healthy Children • Increase to 100% the number of
children with health coverage • 97.4% of children served had health insurance
at the end of services (compared to 94.8% at the beginning of services)
• Increase to 100% the proportion of children who have a health care home
• 97.9% of children had a medical health home at the end of services (compared to 92.4% at the beginning of services)
• Increase to at least 90% the proportion of all pregnant women who receive early prenatal care, and decrease racial/ ethnic disparities
• 85.7% of mothers received prenatal care in the first trimester
• Reduce the percentage of infants exposed to alcohol, tobacco, and other drugs (ATOD) to zero percent (0%)
• 3.0% of expectant mothers used ATOD prior to starting intervention
• Increase age appropriate immunization levels to at least 95%
• 80.8% of children received all age appropriate immunizations at the beginning of services

Healthy Children: APPENDICES, Fiscal Year 2016/17 15 of 17
Pediatric Health Services
Table 1. Aggregate Data for Pediatric Health Services Children Ages 0-5 Family Members Service Providers Number of people receiving services*
7,732 10,209 6,443
Number of services provided
25,513 26,988 9,546
* Although each grantee reports an unduplicated count, clients served by more than one program may be counted more than once when data from multiple grantees are added together. Table 2. Description of Children Served in FY 16/17 by Pediatric Health Services
(n=7,732) Variable Considered Category Label Count1 Percent
Age at most recent interview
Under Three Three through Five Unknown
1,953 5,638 141
25.2 72.9 1.8
Ethnicity Amer. Indian/Alaska Native Asian
Black/African American Hispanic/Latino Middle Eastern Pacific Islander White/Caucasian Vietnamese Multiracial Other Unknown
2 456 235
3,850 8 8
2,125 97 256 329 340
0.03 5.9 3.0 49.8 0.1 0.1 27.5 1.3 3.3 4.3 4.4
Primary Language Arabic English Farsi (Persian) Filipino (Tagalog) Korean Mandarin (Putonghua) Spanish Vietnamese Other Unknown
0 4,457
5 2 5 3
3,043 51 15 151
0.0 57.6 0.06 0.03 0.06 0.04 39.4 0.7 0.2 2.0
1The counts for specific demographic variables may be less than the total number of children entered into the Commission’s Data Collection and Reporting System. This typically occurs because survey respondents decline to answer a specific question, or an error in data entry results in an out-of-range value that must be deleted.

Healthy Children: APPENDICES, Fiscal Year 2016/17 16 of 17
Table 3. Services Provided by Pediatric Health Services Grantees Strategic Plan
Outcome Service Clients
Served Number
of Services
HC.2 Increased percent of children receiving developmental / behavioral screenings at milestone ages with linkage to appropriate services
Providers trained on how to screen, assess and/or identify child developmental milestones
148 148
Providers educated on child development, recognizing key milestones, and the importance of screening and/or assessment
5,843 6,455
Children receive developmental and/or behavioral screening using AAP recommended tools (e.g. PEDS, ASQ, ASQ-SE, MCHAT, Child Behavior Checklist)
508 943
Children receive vision screening using evidence-based tools (i.e., LEA, SureSight, PlusOptix12, etc)
3,388 3,388
Children receive assessment (e.g., vision, hearing, speech/language, psychosocial issues, motor skills, health, special needs, and/or parent-child functioning)
2,126 10,923
Parents receive referrals regarding their child's health and developmental concerns
1,956 4,552
HC.3 Increased percent of children have and use a health home for comprehensive health services to include physical, dental and mental health
Children receive primary care services/visits, including well child and sick visits
544 2,619
HC.4 Increased percent of children growing up in healthy and safe environments
Children enrolled in nutrition and/or physical activity program
4 4
Children receive specialty care clinic visits 544 2,619 Parents receive specialty care education, resources, referrals, and support
6,964 11,247
SF.3 Increased parent knowledge and skills to help prepare children to reach their optimal potential
Parents participate in a parenting education class series on healthy child development (and vision)
1,499 5,894
Children receive group interventions to improve healthy child development
137 187
SF.4 Increased access to and availability of family support services and resources
Parents receive referrals to services 1,629 4,945 Providers receive referrals to services 230 468 Parents receive follow up on referrals and services are accessed
790 1,051
Providers receive training on behavioral health treatment services for children 0-5
399 18

Healthy Children: APPENDICES, Fiscal Year 2016/17 17 of 17
Table 3. Services Provided by Pediatric Health Services Grantees Strategic Plan
Outcome Service Clients
Served Number
of Services
CB.1 Maximize all sustainability activities
Dollar amount raised from program fees/revenue N/A $2,573,087 Dollar amount raised from individual donations N/A $39,201 Dollar amount raised from Foundation donations N/A $1,102,500 Dollar amount raised from government funds/grants
N/A $0
CB.2 Increase access and efficiency, quality and effectiveness
Developing partnerships, coordinating and collaborating with other agencies to improve service delivery
N/A 342
CB.3 Promote data to support decision making and program improvement
Children with special needs served 660 660

STRONG FAMILIES
The purpose of the Commission goal area of Strong Families is to promote good parenting for the optimal development of young children.

The following documents progress made within the Commission goal area of Strong Families. The goal area consists of three funding subcategories:
• Homeless Prevention • Family Support Services • Neighborhood Resource Network
Together, these programs made significant progress toward helping young children be healthy and ready to learn. Desired outcomes for strong families:
• Increased family self-sufficiency • Increased parenting knowledge and skills • Increased access to and availability of family support services and resources • Reduced child maltreatment
Fiscal Year 2016/17 Snapshot:
• There was a 44.9%increase in children who were stably housed at the end of services
• There was a 14%increase in the number of children with a regular childcare arrangement, at the end of services
• 521 children received 37,685 services, including emergency or transitional shelter, developmental and or behavioral screenings, health home services (including physical, dental and mental health), and linkages to educational services
• Nearly 100% of children participating in Family Support programs had health insurance coverage at the end of services
• 959 children participating in Family Support programs received developmental and/or behavioral screening using AAP recommended tools

HOMELESS PREVENTION
FY 16/17

Strong Families: Homeless Prevention, Fiscal Year 2016/17 1 of 6
The Commission invests in programs that provide families in need with a safe and stable home environment, information on child development and developmental screenings. This support includes funding for transitional and emergency shelters, and direct services with an emphasis on basic needs such as food, shelter and clothing.
HOMELESS PREVENTION Homelessness adversely affects individuals and families, but leaves a particular mark on our most vulnerable population, children 0-5. The Commission has identified homeless prevention for families with young children as a strategic priority and continues to invest in capital (catalytic) and operational (ongoing) projects. Partnering with shelter providers, homeless advocates, government agencies, faith-based organizations, and public and private entities ensures a holistic approach to tackling homelessness in Orange County.
• The 2017 Point in Time Count reveals that on any given night there were 4,792 people identified as homeless in Orange County, 54% living unsheltered; 46% living sheltered. Within this staggering number, 754 were identified as homeless children.
Data is a critical component to understanding the issue and a key component to shaping programs and policies affecting homelessness. Documenting the number, characteristics, and needs of persons who experience homelessness in our communities, as well as the number of people receiving services and the capacity of these services, is essential to identifying the proper strategies to address the problem.1
As critical as data are in affecting change, it tends to be difficult to get accurate, timely data on homelessness in our community. Some of this difficulty is due in part to the transient nature of this population. Another reason is that homeless families tend to guard their privacy. They may hesitate to seek services fear their children will be taken into the child welfare system, even though county officials say a child would not be placed in protective custody based solely on a “family’s housing situation.” 2 Despite these difficulties and compared to a decade ago, collecting data on individuals and families has improved greatly allowing for a better understanding of how to meet these needs.
Data points from federally funded programs, school districts and Commission investments paint this homeless picture in Orange County:
1 “Using Data to Understand and End Homelessness”, Evidence Matters: Office of Policy Development and
Research, U.S. Department of Housing and Urban Development (https://www.huduser.gov/portal/periodicals/em/summer12/highlight2.html) 2 Theresa Walker, “O.C. Nonprofit Groups Identify 189 Families Struggling with Housing during Three
Day Census. Orange County Register, June 2, 2017. (http://www.ocregister.com/2017/06/02/o-c-nonprofit-groups-identify-189-families-struggling-with-housing-during-three-day-census/)
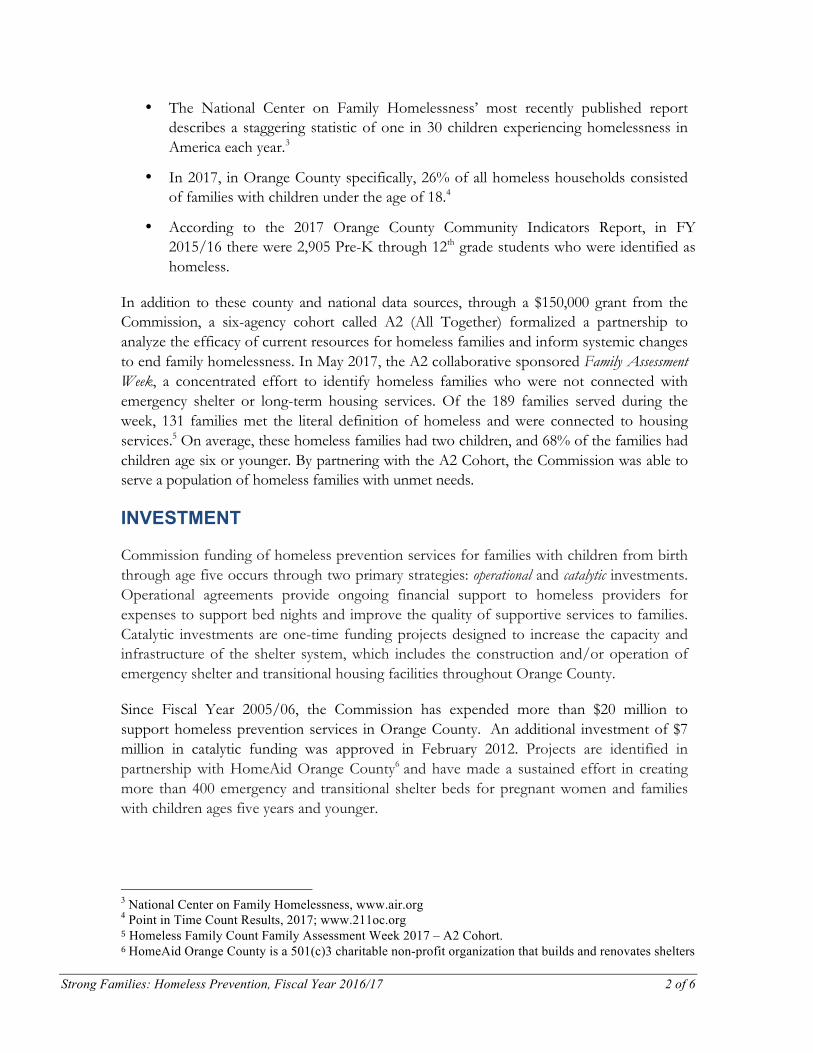
Strong Families: Homeless Prevention, Fiscal Year 2016/17 2 of 6
• The National Center on Family Homelessness’ most recently published report describes a staggering statistic of one in 30 children experiencing homelessness in America each year.3
• In 2017, in Orange County specifically, 26% of all homeless households consisted of families with children under the age of 18.4
• According to the 2017 Orange County Community Indicators Report, in FY 2015/16 there were 2,905 Pre-K through 12th grade students who were identified as homeless.
In addition to these county and national data sources, through a $150,000 grant from the Commission, a six-agency cohort called A2 (All Together) formalized a partnership to analyze the efficacy of current resources for homeless families and inform systemic changes to end family homelessness. In May 2017, the A2 collaborative sponsored Family Assessment Week, a concentrated effort to identify homeless families who were not connected with emergency shelter or long-term housing services. Of the 189 families served during the week, 131 families met the literal definition of homeless and were connected to housing services.5 On average, these homeless families had two children, and 68% of the families had children age six or younger. By partnering with the A2 Cohort, the Commission was able to serve a population of homeless families with unmet needs.
INVESTMENT
Commission funding of homeless prevention services for families with children from birth through age five occurs through two primary strategies: operational and catalytic investments. Operational agreements provide ongoing financial support to homeless providers for expenses to support bed nights and improve the quality of supportive services to families. Catalytic investments are one-time funding projects designed to increase the capacity and infrastructure of the shelter system, which includes the construction and/or operation of emergency shelter and transitional housing facilities throughout Orange County.
Since Fiscal Year 2005/06, the Commission has expended more than $20 million to support homeless prevention services in Orange County. An additional investment of $7 million in catalytic funding was approved in February 2012. Projects are identified in partnership with HomeAid Orange County6 and have made a sustained effort in creating more than 400 emergency and transitional shelter beds for pregnant women and families with children ages five years and younger.
3 National Center on Family Homelessness, www.air.org 4 Point in Time Count Results, 2017; www.211oc.org 5 Homeless Family Count Family Assessment Week 2017 – A2 Cohort. 6HomeAid Orange County is a 501(c)3 charitable non-profit organization that builds and renovates shelters

Strong Families: Homeless Prevention, Fiscal Year 2016/17 3 of 6
Catalyt i c and Operat ional Projec t s
Services include an emphasis on providing for basic needs such as food, shelter and clothing. In addition, the Commission places a special emphasis on providing services for high-risk pregnant women to achieve successful, independent living and break the cycle of homelessness.
Beyond the basic needs, the root causes of homelessness and poverty are complicated. Interdisciplinary interventions are necessary, including but not limited to mental health services, substance abuse treatment, job training and education. Shelter providers that receive Commission funding are required to provide these critical services. To meet that need and avoid duplication of services, shelter providers are forming partnerships with other Commission-funded grantees and government resources to leverage additional funding. These partnerships ensure Commission investments are maximized.
Within funding models, the Commission is addressing a spectrum of services as follows:
• Emergency Shelter: The focus of emergency shelter services is to identify permanent housing options within the targeted 90-day emergency shelter stay. By concentrating on assessment and triage, and intentionally linking families to permanent housing, our emphasis can move from sheltering families for a short period of time to providing long-term housing solutions. Emergency shelter also includes augmented emergency services in conjunction with the County-funded Cold Weather Armory program to transition families into more stable housing. Current Commission emergency shelter investments include:
o Casa Teresa (*C)7 o Family Assistance Ministry (*C) o Illumination Foundation (*C) o Laura’s House (*C) o Mercy House (*C) o Pathways of Hope (*C) o Precious Life Shelter
• Transitional Housing: The focus of transitional housing is on moving families from temporary housing to permanent housing. The Commission is working with shelter providers to shorten transitional housing stays and offer rapid re-housing8 (RRH) whenever possible, while recognizing and respecting the uniqueness of each family and their specific needs. Length of stay is up to 24 months with case management and support services to meet basic needs including but not limited
7 *C denotes catalytic funding 8HUD.Gov/recovery. Rapid re-housing is a strategy to provide financial assistance and services to prevent individuals and families from becoming homeless and help those who are experiencing homelessness to be quickly re-housed and stabilized.

Strong Families: Homeless Prevention, Fiscal Year 2016/17 4 of 6
to, clothing, food, and personal care items. Current Commission transitional housing investments include:
o Casa Teresa o Colette’s Children’s Home o Families Forward o Illumination Foundation o Laura’s House (*C) o Orange County Rescue Mission (*C) o Pathways of Hope (*C) o Precious Life Shelter o Mercy House
Looking Ahead to Fiscal Year 2017-18
In preparation for 2017-2020 contract renewals, Commission staff conducted a deep-dive analysis into future homeless investments and how those partnerships align with the business plan and strategic intent objectives. All operational projects were reviewed and recommendations for contract renewals were made based on core program assessment and program-specific considerations.
As a critical component to the Commission’s shift from a service delivery model to focusing on long-term outcomes, funding conditions were attached to several renewed agreements. The conditions are focused on the service provider achieving specific outcomes related to moving families into permanent housing options in order for funding to continue in the next fiscal year. The conditions are linked closely with the Commission’s strategic intent objectives and address major challenges in serving homeless families with children 0-5.
$2,118,041 $1,814,109 $1,753,096 $1,499,459
$1,092,710
$750,000 $750,000 $929,000
$1,138,500
$962,620
$0
$500,000
$1,000,000
$1,500,000
$2,000,000
$2,500,000
$3,000,000
2012/13 2013/14 2014/15 2015/16 2016/17
Homeless Program Investments Children and Families Commission Program Budget, Fiscal Years 2012/13 - 2016/17
Budget CatalyIc Investment

Strong Families: Homeless Prevention, Fiscal Year 2016/17 5 of 6
Similar to the shift in funding homeless operating agreements, the Commission has transitioned catalytic agreement funding from simply funding programs to creating system-level impact. The A2 Cohort is an example of a Commission-funded collaborative that has changed the way homeless family assessments are done through targeted measures. The real-time data drive approach to triaging families for services is both impactful at a systems level and service provision.
In Fiscal Year 2017/18, Commission funding will support the creation of an emergency shelter in collaboration with Mercy House and HomeAid Orange County. The Mercy House Family Care Center will provide short-term, interim housing to an estimated 10-15 homeless families at a time, serving up to 80-120 families with children annually based on a maximum 45-day stay with the goal of placing families within permanent housing within 30 days. Families will be linked with additional services such as medical, dental, counseling and childcare services.
OUTCOMES
In Fiscal Year 2016/17, the Commission’s investment in homeless prevention programs produced the following services and outcomes for children ages birth through five:
• There was a 44.9 percent increase in children who were stably housed at the end of services (53.9% of children unstably housed at the end of services, compared with 97.9% in the beginning)
• There was a 14 percent increase in the number of children with a regular childcare arrangement, with 47.2% of children having a regular childcare arrangement at the end of services compared to 33.1% at the beginning of services
• 521 children received 37,685 services, including emergency or transitional shelter,
developmental and or behavioral screenings, health home services (including physical, dental and mental health), and linkages to educational services
• 681 family members received 54,374 services, including emergency or transitional
shelter, informational materials regarding children’s developmental milestones and developmental screening, weekly case management services and parenting education classes
HIGHLIGHTS
In Fiscal Year 2016/17, Commission catalytic funding has supported transitional and emergency beds throughout Orange County including the following new programs which began serving clients:
• Family Assistance Ministries (FAM – FAMily House) – Provides up to 11 units of emergency shelter at a time serving an estimated 44 families annually in South Orange County. FAM provides short-term, interim emergency housing for
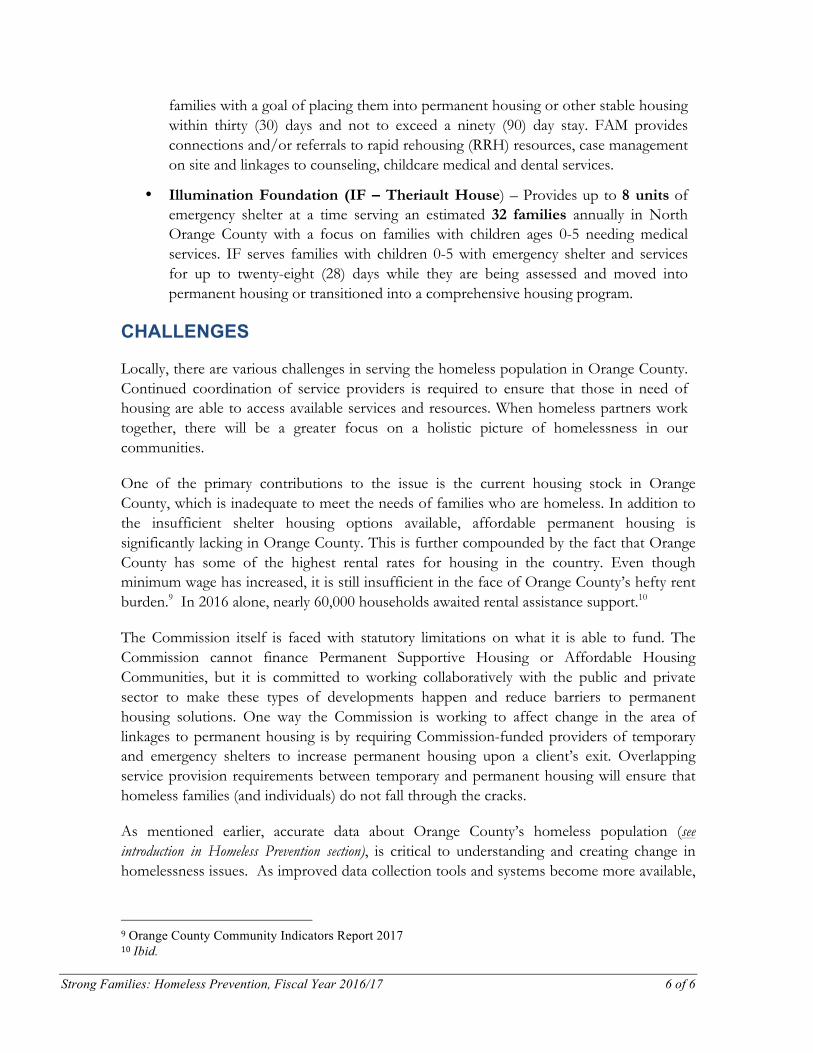
Strong Families: Homeless Prevention, Fiscal Year 2016/17 6 of 6
families with a goal of placing them into permanent housing or other stable housing within thirty (30) days and not to exceed a ninety (90) day stay. FAM provides connections and/or referrals to rapid rehousing (RRH) resources, case management on site and linkages to counseling, childcare medical and dental services.
• Illumination Foundation (IF – Theriault House) – Provides up to 8 units of emergency shelter at a time serving an estimated 32 families annually in North Orange County with a focus on families with children ages 0-5 needing medical services. IF serves families with children 0-5 with emergency shelter and services for up to twenty-eight (28) days while they are being assessed and moved into permanent housing or transitioned into a comprehensive housing program.
CHALLENGES
Locally, there are various challenges in serving the homeless population in Orange County. Continued coordination of service providers is required to ensure that those in need of housing are able to access available services and resources. When homeless partners work together, there will be a greater focus on a holistic picture of homelessness in our communities.
One of the primary contributions to the issue is the current housing stock in Orange County, which is inadequate to meet the needs of families who are homeless. In addition to the insufficient shelter housing options available, affordable permanent housing is significantly lacking in Orange County. This is further compounded by the fact that Orange County has some of the highest rental rates for housing in the country. Even though minimum wage has increased, it is still insufficient in the face of Orange County’s hefty rent burden.9 In 2016 alone, nearly 60,000 households awaited rental assistance support.10
The Commission itself is faced with statutory limitations on what it is able to fund. The Commission cannot finance Permanent Supportive Housing or Affordable Housing Communities, but it is committed to working collaboratively with the public and private sector to make these types of developments happen and reduce barriers to permanent housing solutions. One way the Commission is working to affect change in the area of linkages to permanent housing is by requiring Commission-funded providers of temporary and emergency shelters to increase permanent housing upon a client’s exit. Overlapping service provision requirements between temporary and permanent housing will ensure that homeless families (and individuals) do not fall through the cracks.
As mentioned earlier, accurate data about Orange County’s homeless population (see introduction in Homeless Prevention section), is critical to understanding and creating change in homelessness issues. As improved data collection tools and systems become more available,
9Orange County Community Indicators Report 201710Ibid.

Strong Families: Homeless Prevention, Fiscal Year 2016/17 7 of 6
the Commission is well positioned to move forward in program evaluation and data analysis to address issues impacting homeless families with young children in Orange County.

FAMILY SUPPORT SERVICES FY 16/17

Strong Families, Families Support Services, Fiscal Year 2016/17 1 of 4
FAMILY SUPPORT SERVICES Family support services include several programs that provide children with developmental screenings and early intervention through linkages to needed services. Early intervention is a strategy for prevention as well as for maximizing a child’s developmental trajectory. With intervention at birth or soon after the diagnosis of a disability or high-risk factors, the developmental gains are greater and the likelihood of developing additional problems is reduced.1 Further, early identification of developmental concerns and intervention promotes school readiness and healthy development. Organizations or initiatives funded by the Commission that provide developmental screenings and early intervention services include Family Support Network, the Early Childhood System of Care, and the Child Guidance Center.
INVESTMENT
The Family Support Network (FSN) provides comprehensive developmental and behavioral screenings for children birth through age five at various Orange County sites to identify children with symptoms of developmental, cognitive or speech delays. Mothers are also screened for post-natal depression. Based on the screening results, Family Support Network refers children for further evaluation, intervention, and linkage to care. In FY 2016/17, Family Support screened a total of 931 children, including children screened through Commission funding as well as leveraged dollars from the Regional Center of Orange County. More than 75% of the children screened had Medi-Cal insurance. FSN also made a concerted effort to reach children from Orange County’s Asian-speaking population this Fiscal Year, and the screening numbers include more than 100 children from the Asian community.
The Early Childhood System of Care program is jointly funded by the Commission and the Orange County Social Services Agency to address the health and development needs of children birth through age five entering the child welfare system. Public Health Nurses provide intensive case management to ensure that children receive developmental screenings and have access to primary care providers, primary dental services, and linkages to other community resources to maximize their potential.
1 Cooper, J. H. (1981). “An Early Childhood Special Education Primer”. Chapel Hill, NC: Technical
Assistance Development System (TADS); Garland, C., N. W. Stone, J. Swanson, and G. Woodruff, eds. (1981). “Early Intervention for Children with Special Needs and their Families: Findings and Recommendations”. Westar Series Paper No. 11. Seattle, WA: University of Washington. ED 207-278; Maisto, A. A., and M. L. German. (1979). "Variables Related to Progress in a Parent-Infant Training Program for High-Risk Infants." Journal of Pediatric Psychology 4: 409-419; Strain, P. S., C. C. Young, and J. Horowitz. (1981). "Generalized Behavior Change During Oppositional Child Training: An Examination of Child and Family Demographic Variables." Behavior Modification 1: 15-26.

Strong Families, Families Support Services, Fiscal Year 2016/17 2 of 4
The Child Guidance Center provides quality outpatient mental health, trauma and child abuse-related counseling. Through Commission investments, the Child Guidance Center provides training to parents with children from birth through age five using the Parent-Child Interactive Therapy (PCIT) program. The program’s objective is to have 75% of parents who complete the PCIT program show a 30% improvement in their parenting skills as reflected on pre- and post-evaluation instruments developed by the University of California Davis, Medical Center Child Abuse Research and Evaluation Center (CARE). In addition to their typical referrals, the Child Guidance Center receives referrals from the Neighborhood Resource Network program (described in the next section of this report). This year, the Child Guidance Center served 43 Orange County parents and children enrolled in the PCIT 10-session treatment, with follow up provided as needed. Of these families, 72% experienced improvement in parent stress, child behavior problems and problem intensity. Additionally, five Mental Health Therapists completed training in the PCIT methodology this year: four were bilingual; two Spanish-, one Farsi-, and one Japanese-speaking.
Child Guidance Center’s PCIT professional team has taken a leadership role in training for the PCIT community at local, national, and international conferences. Locally, they provided PCIT training to Orange County Health Care Agency’s Children & Youth Behavioral Health Outpatient clinics in Santa Ana and Costa Mesa (from contracts outside of Commission funding). Child Guidance Center’s PCIT-trained staff also presented at UC Davis’ 16th Annual Conference on PCIT for Traumatized Children to more than 500 attendees on the UCLA Campus.
Family Support Services Program and Catalytic Investments
$72
0,72
3
$66
7,56
5
$60
6,38
1
$48
7,28
2
$82
5,86
4
$27,500
$355,000
$190,833
$57,042
$0
$200,000
$400,000
$600,000
$800,000
$1,000,000
$1,200,000
2012/13 2013/14 2014/15 2015/16 2016/17
Program Cataly@c

Strong Families, Families Support Services, Fiscal Year 2016/17 3 of 4
OUTCOMES
In Fiscal Year 2016/17, the Commission’s investment in family support services programs produced the following services and outcomes for children ages birth through five:
• Nearly met the Commission’s goal of 100% health insurance coverage, with 99.2% of children having health insurance at the end of services
• 959 children received developmental and/or behavioral screening using AAP recommended tools
• 689 children received comprehensive screenings (Includes: vision, hearing, height, weight, health, and developmental milestones using PEDS or ASQ)
• 717 parents received referrals regarding their child's health and developmental concerns
• 89 parents received a behavioral health screening and 41 children received behavioral health services
• 91 children were linked to a dental home • 61 children were linked to a health care home.
HIGHLIGHTS
In FY 2016/17, the Commission hired a consultant to assist Family Support Network (FSN) in identifying and exploring the feasibility of alternative sources of sustainable funding and/or reimbursement within the local healthcare system. The consultant assessed FSN’s current offerings as well as the potential for local healthcare partners to use FSN services. While the consultant’s work is not complete, it appears some health networks may be interested in contracting with FSN for screening services. Moving in this direction would require FSN to expand or build its infrastructure related to things like billing and data analytics. The consultant will recommend an FSN service delivery model with the highest potential for sustainable financing within the local healthcare landscape.
The Early Childhood System of Care (ECSOC) has worked over the past year to implement several strategies to improve their services. For more than a year, the Social Services Agency liaison was unable to effectively ensure that children attended Early Development Assessment Center (EDAC) appointments. This year, the program implemented new case management procedures to increase the attendance of the assessment appointments and within the first few months of implementation, attendance at EDAC assessments improved significantly. The program also implemented a new procedure to remind Social Workers to complete Regional Center intake packets in a timely manner, and to offer assistance in completing the packets if needed. Additionally, a Regional Center liaison was identified for ECSOC Public Health Nurses to communicate with regarding referrals made and pending appointments. ECSOC has also partnered with Help Me Grow Orange County to ensure children are getting needed services. Finally, ECSOC developed an informational

Strong Families, Families Support Services, Fiscal Year 2016/17 4 of 4
presentation about the program, which has increased awareness of the program and nursing services available to social workers and children in out-of-home placement.
CHALLENGES
The number of children in the Early Childhood System of Care was lower in Fiscal Year 2016/17 compared to the previous year; however, the acuity was higher with children requiring more intensive case management and follow up to specialty care and home visitations. Home visitations increased from the previous fiscal year, and children required longer nursing case management to ensure they were linked to referred services.

NEIGHBORHOOD RESOURCE NETWORK
FY 16/17

Strong Families, Neighborhood Resource Network, Fiscal Year 2016/17 1 of 3
NEIGHBORHOOD RESOURCE NETWORK A recent study reported that of California infants born in 2006 who remained at home following an initial allegation of abuse or neglect to the Child Abuse Registry (CAR), six of 10 were re-reported within five years.1 Building off of this research, in FY 2015/16, the Commission partnered with the Social Service Agency of Orange County (SSA), to develop a responsive Differential Response Path 1 program entitled the Neighborhood Resource Network (NRN) Program.
The two-year pilot program focuses on families with at least one child age 0-5 that have an initial Child Abuse Registry report, and based on an assessment by Social Service staff would not receive further services. NRN was designed to support these families by creating a voluntary support structure of community services to help manage the circumstances putting stress on their family unit, thereby the potential for abuse.
In October 2015, the Commission entered into a two-year agreement with the Children’s Home Society of California (CHS) to serve as the administrative hub agency for the project. In addition, several agencies referred to as Community Service Providers (CSPs) entered into a Memorandum of Understanding with the Commission, CHS, and SSA to be a service provider in the NRN collaborative. CSP’s include: Child Behavior Pathways, Child Guidance Center, Children’s Bureau, Help Me Grow Orange County, Human Options and Olive Crest, Orange County Child Abuse Prevention Center.
A critical aspect of the project for long-term sustainability efforts is the requirement for service providers to participate in a rigorous evaluation. Led by Dr. Emily Putnam-Hornstein of the Children’s Data Network (CDN) at the University of Southern California, the evaluation is conducted through a random control trial under protocols developed by CDN.
INVESTMENT
The Commission invested $502,185 for a two-year agreement with Children’s Home Society, beginning November 1, 2016 and ending January 31, 2018. The agreement has two different payment structures. CHS is reimbursed for administrative oversight of the project and is limited to a maximum budget of $177,185 for the two-year program. The remaining proportion of the funding (no less than $325,000) is used for performance stipends to the Community Service Providers (CSP) that are participating. The intent of the agreement structure is to provide performance payments to CSPs as they engage families, complete services, and ultimately stabilize the family so there is not another substantiated child abuse report. The performance payment structure for individual CSPs is as follows:
1 Putnam-Hornstein, et al., “Risk of Re-Reporting Among Infants Who Remain at Home Following Alleged Maltreatment,” Child Maltreatment, 21 Nov 2014

Strong Families, Neighborhood Resource Network, Fiscal Year 2016/17 2 of 3
CSPs Providing Outreach, Assessments, and Services Outreach Assessment &
Service Total Payment
Determination of Consent
$100 $100
Pre-Assessment $100 $100 Post-Assessment $125 $125 Six (6)-Month Outcome* $125
TOTAL $100 $225 $450 Begins on date CSP or CHS inputs into database that case is closed. * The six-month outcome payment is based on the family not re-entering the child welfare system six months post completion of NRN services.
HIGHLIGHTS
In April 2016, the Institute for Child Success (ICS) awarded the Commission a technical assistance grant to determine the feasibility of implementing a Pay for Success (PFS) financing model for the Neighborhood Resource Network (NRN) program. Under the guidance of ICS, Commission staff completed a series of assessment memos, which determined that PFS is a feasible financing model for the program. The rigor and analysis that these memos required pushed the Commission to assess the NRN program with innovative, data driven methodologies and resulted in more focused criteria on certain child maltreatment outcomes that are be best supported by specific evidence-based programs. This, along with the difficulties in engaging families, have resulted in NRN being restructured.
Key to restructuring the NRN program are new engagement strategies along with a new platform to reach families directly in the communities in which they live. Furthermore, incentives to families for engagement and program retention are being researched. Flexibility in NRN program development allows the Commission and partners to design a program based on lessons learned during the pilot stage thus ensuring successful measurable program outcomes.
CHALLENGES
As a pilot program, NRN has faced several challenges that have led to a program redesign. Some of the challenges include:
• Difficulty in engaging the population of families who fit the criteria of NRN. Criteria include families that are experiencing their first Child Abuse Registry report, have a child aged 0–5, and who are not eligible to receive further services from Orange County Social Services Agency (SSA).

Strong Families, Neighborhood Resource Network, Fiscal Year 2016/17 3 of 3
• Restrictive telephone script that Community Service Providers must use when conducting family outreach.
• Difficulty in completion of services for families because of other family stressors that are more immediate (rent, food, transportation, and medical needs).
• Community Service Providers have indicated that the amount of time spent trying to engage families is disproportionate to performance payment structure and often does not result in any additional success payments.
• Not all evidence-based programs that are used in NRN support outcomes that an end payor focused on outcome measurement is willing to pay for.

STRONG FAMILIES APPENDICES
FY 16/17

Strong Families, APPENDICES, Fiscal Year 2016/17 1 of 7
APPENDICES – DETAILED OUTCOME TABLES Homeless Prevention
Table 1. Aggregate Data for Homeless Prevention Children Ages 0-5 Family Members Service Providers Number of people receiving services*
525 681 0
Number of services provided
37,677 61,957 0
Table 2. Description of Children Served in FY 16/17 by Homeless Prevention (n=521) Variable Considered
Category Label
Count
Percent
Age at most recent interview
Under Three Three through Five
276 245
53.0 47.0
Ethnicity Amer. Indian/Alaska Native Asian
Black/African American Hispanic/Latino Pacific Islander White Vietnamese Multiracial Other Unknown
0 4
70 281 10
110 0
37 3 6
0.0 0.8
13.4 53.9 1.9
21.1 0.0 7.1 0.6 1.2
Primary Language* English Spanish Vietnamese Mandarin Farsi Other
71 42 0 1 0 2
61.2 36.2 0.0 0.9 0.0 1.7
At or Below 200% Federal Poverty Level 514 98.6 *Note: Primary Language is not collected for clients in the HMIS system. Table 3. Services Provided by Homeless Prevention Grantees
Strategic Plan Outcome
Service Clients Served
Number of Services
HC.2 Increased percent of children receiving developmental / behavioral screenings at milestone ages with
Parents receive informational materials regarding developmental milestones and developmental screening
309 1,393

Strong Families, APPENDICES, Fiscal Year 2016/17 2 of 7
linkage to appropriate services HC.3 Increased percent of children have and use a health home for comprehensive health services to include physical, dental and mental health
Children are linked with health insurance enrollment
41 80
Children are linked to a health care home 35 89
SF.1 Increased percent of families are stably housed
Children receive emergency or transitional shelter (bed nights)
432 37,267
Family members (parents and older siblings) receive emergency or transitional shelter
613 47,215
Parents receive weekly case management services
681 4,926
SF.3 Increased parent knowledge and skills to help prepare children to reach their optimal potential
Parents receive follow up on referrals and services are accessed
637 3,584
EL.1 Increased all children’s developmental skills to be proficient learners in school
Parents participate in a program designed to increase the frequency of reading at home
276 2,353
CB.1 Maximize all sustainability activities
Dollar amount raised from program fees/revenue
N/A $9,617
Dollar amount raised from individual donations
N/A $20,419
Dollar amount raised from Foundation donations
N/A $320,313
Dollar amount raised from government funds/grants
N/A $415,075
Dollar amount of in-kind contribution generated
N/A $33,273
Dollar amount received by leveraging Commission dollars
N/A $15,402
CB.2 Increase access and efficiency, quality and effectiveness
Developing partnerships, coordinating and collaborating with other agencies to improve service delivery
N/A 13

Strong Families, APPENDICES, Fiscal Year 2016/17 3 of 7
Table 4. Service Outcomes (SOQs) for Homeless Prevention Grantees Key Strategic Plan Objectives SOQ Results
Healthy Children • Increase to 100% the number of
children with health coverage • 97.4% of children served had health
insurance at the end of services (compared to 97.1% at the beginning of services)
• Increase to 100% the proportion of children who have a health care home
• 97.8% of children had a medical health home at the end of services (compared to 95.9% at the beginning of services)
Strong Families • Reduce the number of children who
are homeless to zero • 53.9% of children were unstably housed or
at risk for homelessness at the end of services (compared 97.9% at beginning of services)
• Reduce the number of children who are homeless to zero
• 36.8% of children 3 or older were attending school on a regular basis at the end of services (compared to 35.6% at the beginning of services)
• Reduce the number of children who are homeless to zero
• 47.2% of children had a regular childcare arrangement at the end of services (compared to 33.1% at the beginning of services)

Strong Families, APPENDICES, Fiscal Year 2016/17 4 of 7
Family Support Services
Table 1. Aggregate Data for Family Support Services Children Ages 0-5 Family Members Service Providers Number of people receiving services*
1,387 1,272 0
Number of services provided
6,034 11,130 0
*Although each grantee reports an unduplicated count, clients served by more than one program may be counted more than once when data from multiple grantees are added together.
Table 2. Description of Children Served in FY 16/17 by Family Support Services Variable Considered
Category Label
Count1
Percent
Age at most recent interview
Under Three Three through Five Unknown
646 55 686
46.6 4.0 49.5
Ethnicity Amer. Indian/Alaska Native Asian
Black/African American Hispanic/Latino Pacific Islander White Vietnamese Multiracial Other Unknown
19 77 13 819 1 203 1 0 13 241
1.4 5.6 0.9 59.0 0.07 14.6 0.07 0.0 0.9 17.4
Primary Language Arabic English Farsi (Persian) Filipino (Tagalog) Korean Mandarin (Putonghua) Spanish Vietnamese Other Unknown
1 475 0 0 20 0 688 16 5 182
0.07 34.2 0.07 0.0 1.4 0.0 49.6 1.2 0.4 13.1
At or Below 200% Federal Poverty Level 297 81.8 1The counts for specific demographic variables may be less than the total number of children entered into the Commission’s Data Collection and Reporting System. This typically occurs because survey respondents decline to answer a specific question, or an error in data entry results in an out-of-range value that must be deleted.

Strong Families, APPENDICES, Fiscal Year 2016/17 5 of 7
Table 3. Services Provided by Family Support Services Grantees Strategic Plan Outcome
Service Clients Served
Number of Services
HC.2 Increased percent of children receiving developmental / behavioral screenings at milestone ages with linkage to appropriate services
Children receive developmental and/or behavioral screening using AAP recommended tools (e.g. PEDS, ASQ, ASQ-SE, MCHAT, Child Behavior Checklist)
959 985
Children receive comprehensive screening (Includes: vision, hearing, height, weight, health, and developmental milestones using PEDS or ASQ)
689 689
Parents receive referrals regarding their child's health and developmental concerns
717 583
HC.3 Increased percent of children have and use a health home for comprehensive health services to include physical, dental and mental health
Children are linked to a health care home 61 61 Children are linked to a dental home 91 91
SF.4 Increased access to and availability of family support services and resources
Parents receive follow up on referrals and services are accessed
806 1,465
Children receive behavioral health treatment services
41 662
Providers receive training on behavioral health treatment services for children 0-5
5 276
Parents receive education, resources, referrals, and support regarding their child's behavioral health issues
128 1,344
Parents receive behavioral health screening 89 89
CB.1 Maximize all sustainability activities
Dollar amount raised from individual donations N/A $0 Dollar amount raised from Foundation donations
N/A $253,700
Dollar amount raised from government funds/grants
N/A $1,009,008
Dollar amount of in-kind contribution generated N/A $15,025 Dollar amount received by leveraging N/A $363,176

Strong Families, APPENDICES, Fiscal Year 2016/17 6 of 7
Strategic Plan Outcome
Service Clients Served
Number of Services
Commission dollars CB.3 Promote data to support decision making and program improvement
Children with special needs served 579 579
Table 4. Service Outcomes (SOQs) for Family Support Services Grantees Key Strategic Plan Objectives SOQ Results Healthy Children
• Increase to 100% the number of children with health coverage
• 96.6% of children served had health insurance at the end of services (compared to 98.0% at the beginning of services)
• Increase to 100% the proportion of children who have a health care home
• 99.2% of children had a medical health home at the end of services (compared to 97.6% at the beginning of services)

EARLY LEARNING
The purpose of the Commission goal area of Early Learning is to provide early learning opportunities for young children to maximize their potential to succeed in school.

Early Learning Programs Report, Fiscal Year 2016/17 1 of 2
EARLY LEARNING PROGRAMS REPORT This report describes the Commission’s investments in Early Learning programs for young children, as well as the impact of those investments. The Early Learning programs designed to support opportunities for young children to maximize their potential to succeed in school. The Commission supports programmatic initiatives in school readiness, early literacy and language development, early STEM (science, technology, engineering, and mathematics) education and early learning quality improvement programs. Fiscal Year 2016/17 Snapshot:
• 92% of children could identify his or her written name at the end of services, exceeding the Commission goal of 75%.
• 86% of children could recite at least five numbers in order, exceeding the Commission’s goal of 80%.
• 82% of parents taught their children letters, numbers, or words at least three times in the prior week at the end of services, compared to 73% at the beginning of services
• $44,832,484 was raised through Early Learning program fees, individual and foundation donations, and government funds and grants
WHY INVEST IN EARLY LEARNING? Early learning skills lay the foundation for children’s success in school. An analysis of six longitudinal studies showed the strongest predictors of later achievement in school are school-entry math, reading, and attention skills.1 Yet there are many children in Orange County who start kindergarten lacking certain skills. Children who are not proficient readers by the end of third grade are four times more likely to leave school without a diploma than proficient readers.2 Students that drop out of high school earn approximately $10,000 a year less than graduates,3 and cost society an estimated $292,000 over their lifetime.4
Research shows that quality birth-to-five early childhood education delivers the greatest return on investment5. Every dollar invested in high-quality early childhood education for disadvantaged children delivers a 13% annual return on investment, significantly higher than the 7-10% return delivered by preschool alone.6 Here in Orange County there are many ways children can receive early childhood education, whether it is in a preschool’s setting, early literacy programs or other parent/child learning initiatives.
1 Duncan GJ, Dowsett CJ, Claessens A, Magnuson K, Huston AC, Klebanov P, Pagani LS, Feinstein L,
Engel M, Brooks-Gunn J, Sexton H, Duckworth K, Japel C. (2007). “School readiness and later achievement.” Developmental Psychology 43.06: 1428-46. Web. 6 Sept. 2015.
2 Hernandez DJ. (2012). “Double Jeopardy: How Third-Grade reading skills and Poverty Influence High School Graduation.” The Annie E. Casey Foundation. Web. 6 Sept. 2015.
3 http://www.census.gov/compendia/statab/2012/tables/12s0232.pdf 4 Sum A, KhatiwadaI, McLaughlin J. (2009). “The Consequences of Dropping Out of High School.”
Northeastern University. 5 www.heckmanequation.org 6 Ibid

Early Learning Programs Report, Fiscal Year 2016/17 2 of 2
In 2016, 52% of children in Orange County were developmentally ready for kindergarten, the same as in 2015. Orange County measures children’s readiness for school by using the Early Development Index (EDI). The EDI tracks five areas of a children’s development: physical health and well-being; communication skills and general knowledge; social competence; physical health and well-being; communication skills and general knowledge; social competence; emotional maturity; and language and cognitive development. Kindergartners attending public schools are assessed to determine their readiness when they first enter school. Children are considered developmentally ready for school if they are on track in all five areas.7
The Commission is utilizing EDI data and other outcome measures to determine how best to invest in early learning programs that will help Orange County’s children develop important skills. To address the achievement gap that exists in Orange County, programs are focused on reaching children and families in all communities. The Commission’s Early Learning programs consist of the following programs and initiatives:
• Early Learning Specialists • Early Literacy & Math Program/AmeriCorps • OC Reads (formerly Champions for Children’s Literacy) • Readiness on the Road • OC STEM Initiative • Quality Start OC • Early Development Index
The investment in the Early Learning programs supports the strategic plan outcomes to:
• Increase all children’s developmental skills to be proficient learners in school • Increase quality of early care and education • Increase early educator, parent and caregiver knowledge and skills to promote
children’s readiness for school • Improve transitions of children from preschool to kindergarten.
7 Orange County Community Indicators Report 2017

Early Learning Programs Report, Fiscal Year 2016/17 3 of 2
$5,782,240
$9,657,424 $9,437,596
$7,491,599
$5,999,406
$0
$2,000,000
$4,000,000
$6,000,000
$8,000,000
$10,000,000
$12,000,000
2012/13 2013/14 2014/15 2015/16 2016/17
Early Learning Program Budget Fiscal Years 2012/13 through 2016/17

EARLY LEARNING SPECIALISTS
FY 16/17
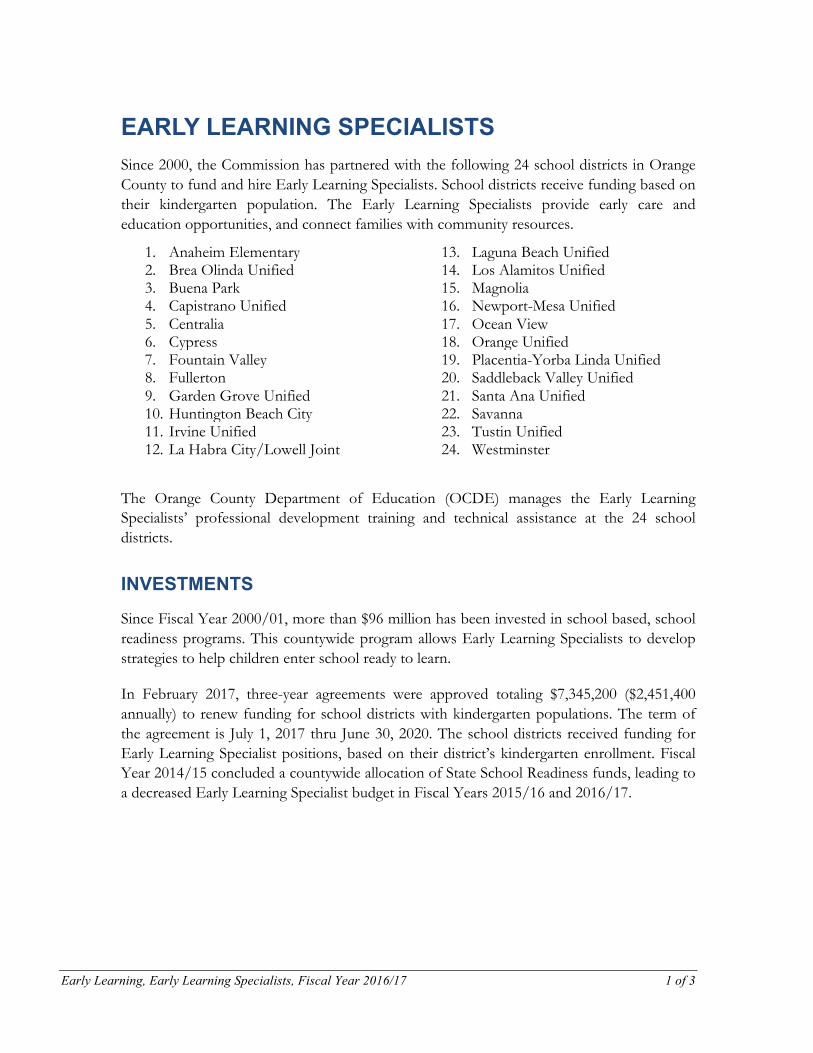
Early Learning, Early Learning Specialists, Fiscal Year 2016/17 1 of 3
EARLY LEARNING SPECIALISTS Since 2000, the Commission has partnered with the following 24 school districts in Orange County to fund and hire Early Learning Specialists. School districts receive funding based on their kindergarten population. The Early Learning Specialists provide early care and education opportunities, and connect families with community resources.
1. Anaheim Elementary 13. Laguna Beach Unified 2. Brea Olinda Unified 14. Los Alamitos Unified 3. Buena Park 15. Magnolia 4. Capistrano Unified 16. Newport-Mesa Unified 5. Centralia 17. Ocean View 6. Cypress 18. Orange Unified 7. Fountain Valley 19. Placentia-Yorba Linda Unified 8. Fullerton 20. Saddleback Valley Unified 9. Garden Grove Unified 21. Santa Ana Unified 10. Huntington Beach City 22. Savanna 11. Irvine Unified 23. Tustin Unified 12. La Habra City/Lowell Joint 24. Westminster
The Orange County Department of Education (OCDE) manages the Early Learning Specialists’ professional development training and technical assistance at the 24 school districts.
INVESTMENTS
Since Fiscal Year 2000/01, more than $96 million has been invested in school based, school readiness programs. This countywide program allows Early Learning Specialists to develop strategies to help children enter school ready to learn.
In February 2017, three-year agreements were approved totaling $7,345,200 ($2,451,400 annually) to renew funding for school districts with kindergarten populations. The term of the agreement is July 1, 2017 thru June 30, 2020. The school districts received funding for Early Learning Specialist positions, based on their district’s kindergarten enrollment. Fiscal Year 2014/15 concluded a countywide allocation of State School Readiness funds, leading to a decreased Early Learning Specialist budget in Fiscal Years 2015/16 and 2016/17.

Early Learning, Early Learning Specialists, Fiscal Year 2016/17 2 of 3
The OCDE was identified as a critical partner and approved a three year agreement for $150,000 ($50,000 annually) to advocate the use and implementation of Early Development Index (EDI) data to school district superintendents and educational programs; serve as the countywide advocate for early learning, Local Control Accountability Plan (LCAP), and children’s policy issues; serve as the lead STEM practitioner for the OC STEM Initiative; and provide meeting space and manage logistics for the countywide Early Learning Specialists meetings.
OUTCOMES
• 96% of children could correctly name at least two shapes at the end of services, exceeding the Commission goal of 80%
• 89% of children could recite at least five numbers in order, exceeding the Commission’s goal of 80%.
• 91% of children could identify his or her written name at the end of services, compared to only 81% at the beginning of services
• 82% of parents taught their children letters, numbers, or words at least three times in the prior week at the end of services, compared to 73% at the beginning of services
• $44,832,484 was raised through program fees, individual and foundation donations, and government funds and grant
HIGHLIGHTS
Learning Link
Twenty school districts are operating Learning Link programs in conjunction with the Early Learning Specialists. The goal of the Learning Link program is to provide an accessible and creative learning environment to help young children become better prepared for kindergarten and guide parents in their role as their children’s first teacher. Learning Link is an interactive place for parents to bond with their children and to support their growth
$4,004,901$4,393,107
$3,825,487
$2,977,910$2,451,400
$0
$1,000,000
$2,000,000
$3,000,000
$4,000,000
$5,000,000
2012/13 2013/14 2014/15 2015/16 2016/17
EarlyLearningSpecialistsInvestmentsChildrenandFamiliesCommissionProgramBudget,FiscalYears2012/13-2016/17

Early Learning, Early Learning Specialists, Fiscal Year 2016/17 3 of 3
across a range of disciplines, including early education, language development, health and wellness, and family support. In Fiscal Year 2016/17, more than 3,000 children participated in drop-in, family focused early learning programs and more than 34,000 services were provided.
Unique Statewide Student Identifier
The state of California utilizes a Statewide Student Identifier (SSID) which is a unique, non-personally-identifiable number linked to a given individual student within the California public K–12 educational system. SSIDs are used to maintain data on individual students, such as linking students to statewide assessment scores and tracking students in and out of schools and Local Education Agencies (LEA) in order to determine more accurate dropout and graduation rates. In Orange County, the majority of school districts now assign a transferrable number into the state system that offers the ability to link children earlier than kindergarten. Last year, more than 11,000 preschool children were assigned an SSID and were added into the system. School districts have begun to analyze this connected data as children move through the grades. The data supports that children who have early learning experiences need fewer services including special education and grade retention. This data also assists districts in earlier planning for incoming students in regards to classroom assignments, proposed interventions and smoother transitions into the K-12 system.
Sustainability Planning
The Early Learning Specialists develop strategies for program sustainability and help to build capacity for organizations that help parents to become their child’s first teacher. These strategies have included internal cost reductions and program efficiencies, fee-for-service models, and federal and state revenue sources such as the Local Control Funding Formula (LCFF). Many school districts now include early learning in their school district's Local Control Accountability Plan (LCAP). In Fiscal Year 2016/17, Orange County school districts were awarded approximately $4 million in ongoing state preschool funding to serve more than 800 children in all-inclusive full day and part day programs. Of signifiance is the fact that three school districts were new to this funding source. Currently 20 of the 24 school districts that have a kindergarten population provide state preschool. Through this funding, almost $39 million a year provides ongoing sustainable services for early learning programs.
CHALLENGES
Adding early learning to the Local Control Accountability Plan (LCAP). School districts are recognizing that early learning is a core part of the educational system, however dedicated funding has not been pronounced. Inclusion in their LCAP would ensure county-wide district level commitment.
Physical space in schools dedicated to early learning. Although most school districts in Orange County are experiencing declining enrollment, it is still often difficult to dedicate appropriate space for early learning programs. Occupancy, bathroom and playground regulations differ
Early Learning, Early Learning Specialists, Fiscal Year 2016/17 4 of 3
from kindergarten requirements which necessitates additional planning and facility preparation.

EARLY LITERACY AND MATH
FY 16/17

Early Learning, Early Literacy and Math, Fiscal Year 2016/17 1 of 4
EARLY LITERACY AND MATH Fiscal Year 2016/17 marked the sixth year of the catalytic funding agreement with THINK Together to implement the following early literacy and math programs: Center-Based Early Literacy, Book Bank, Read for the Record, Raising a Reader, Reach Out and Read (ROR), and the Early Learning STEM Conference. THINK Together also manages 30 AmeriCorps members that support the early learning programs targeted at low income children at the Boys and Girls Clubs of Garden Grove and THINK Together. In addition to providing direct services to children, the AmeriCorps members assist agencies with developing long-term sustainability through the recruitment and support of volunteers.
Center-Based Early Literacy Programs
Center-Based Early Literacy programs foster early learning and math literacy among three to four year-olds by developing foundational skills that are aligned with the Pre-school Foundations utilized by the state of California. The Center-Based Learning Program is contingent on the support of 26 AmeriCorps members.
The program also provides parents/caregivers with age-appropriate early learning and math literacy strategies that can be used at home to engage their children and support their continued learning. As parents begin to emulate the strategies they have learned in the class at home, children’s learning is reinforced.
In FY 2016/17, the Center-Based Early Literacy programs served 1,038 children and 155 adult participants/guardians in one of the two 15-week sessions. The courses focused on evidence-based school readiness services and/or drop-in, family focused early learning programs. These sessions took place at eight different school sites located in six different cities in Orange County. The demographic makeup of the communities served at the different sites varied widely, and the data confirm that communities of high-need successfully accessed the program.
The Center-based programs were evaluated, quantitatively, using the Phonological Awareness Literacy Screening (PALS) tool, a scientifically-based phonological awareness and literacy screening that measures children’s development of important literacy fundamentals. The PALS was administered to each student at the end of the first and second session to children four years old and older, and compared to two years ago, there was tremendous improvement. The PALS evaluation report includes comprehensive data on the Center-base program results.
Book Bank Program
The Book Bank collects new and gently-used books throughout the year and processes them for redistribution to all communities in Orange County so families can begin to build a home-library. The book collection and distribution goals were exceeded in Fiscal Year

Early Learning, Early Literacy and Math, Fiscal Year 2016/17 2 of 4
2016/17, with 103,028 children’s books being redistributed to multiple communities across Orange County.
The We Care Wednesday event at the Orange County Fair garnered more than 76,134 books. The program will continue to expand its scope by fostering and solidifying new partnerships, refining current book cleaning and distribution systems, and providing more opportunities for partners to contribute.
Read for the Record
Read for the Record is a national event led by Jumpstart to raise awareness of the importance of early literacy. Jumpstart selects a children’s book to be read at various venues across the country, setting records for the largest reading experience. During the week of October 24, 2016, “The Bear Ate Your Sandwich,” by Julia Sarcone-Roach, was read to a record number of 58,679 children across the country. THINK Together partnered with Help Me Grow to provide resources to families and read this book during weekends at Orange County’s Festival of Children. Like last year, Wonder Grove Kids provided an animated character, “Maria” who read the story to children.
Since 2009, the number of children ages 0 – 5 that have been read to has risen steadily.
Raising a Reader
Raising a Reader is an early literacy and family engagement program designed to help families develop book sharing routines with their children. To practice the habit of sharing books, families are provided with a different book bag each week that contains award-winning books that they can read with their children. With constant access to new books, caregivers can engage children in regular reading to develop a child’s literacy. Raising a Reader is provided through the Center-Based Early Literacy program sites as well as external partnership sites. The relationship with the Raising a Reader organization is continuously seeking new opportunities and funding new classrooms.
In total, 2,478 bags are in rotation in Orange County at sites managed by THINK Together. The new processes continue to facilitate the program running as efficiently as possible, including required trainings, MOUs and scheduled site visits. The partnerships with The Masons of California has remained strong. Through funding from the Masons, Think continued to expand programming to nine sites, with four sites in Santa Ana, one site in Orange, two sites in Anaheim and two sites in Buena Park. RAR has also expanded their book selections. Each bag includes a financial literacy book, and a book focusing on Science, Technology, Engineering and Math (STEM). RAR continues to grow, according to the goals set forth in the strategic plan.
Reach Out and Read
The Reach Out and Read program promotes the importance of parents reading with their young children at home. Pediatric medical clinics receive new and gently used books for

Early Learning, Early Literacy and Math, Fiscal Year 2016/17 3 of 4
pediatricians to use during Child Wellness Visits. Trained volunteer readers read to children in the waiting room. Readers model how to engage the child in early literacy behaviors and effective reading strategies for parents. Parents receive materials and other resources that support literacy development in their children.
The Reach Out and Read model continued to surpass the number of children read to, as well as the number of volunteers trained. A total of 171 new volunteers were trained as readers in FY 2016-2017, and 1,379 children were read to throughout the year.
AmeriCorps
The federal AmeriCorps places thousands of young adults into intensive service positions where they learn valuable work skills, earn money for education, and develop an appreciation for citizenship. THINK Together manages 30 AmeriCorps members that are serving in Orange County’s high need communities. Four AmeriCorps members are serving at the Boys & Girls Clubs of Garden Grove’s Readiness on the Road program; and 26 are serving at THINK Together’s Early Literacy and Math program.
INVESTMENTS
In Fiscal Year 2011/12, THINK Together was awarded $1 million to manage the Early Literacy and Math Program. In Fiscal Year 2012/13, THINK Together received a $5 million catalytic award with a service payback provision through 2022. Annual operating funds were also allocated to support the program. Operating funding began at $750,000, and decreased by $250,000 for the next two-years landing at $250,000 in the third year. In Fiscal Year 2015/16, an additional $60,000 was allocated to support the AmeriCorps program resulting in $310,000 of operational funding. Since Fiscal Year 2010/11, nearly $15 million has been invested in the AmeriCorps programs.
In February 2017, a new three year agreement for the AmeriCorps and Early Literacy and Math programs was awarded in the amount of $930,000 ($310,000 annually) for the term of July 1, 2017 through June 30, 2020.
OUTCOMES
• 85% of children could identify his or her written name at the end of services, compared to only 65% at the beginning of services
• 92% of children could correctly name at least two shapes at the end of services, compared to only 79% at the beginning of services
• 80% of children could recite more than five numbers in order at the end of services, compared to only 57% at the beginning of services
• 103,028 books distributed to children • 51,000 hours served by AmeriCorps members • 3,420 children read to at physician’s offices or clinics (Reach Out and Read)
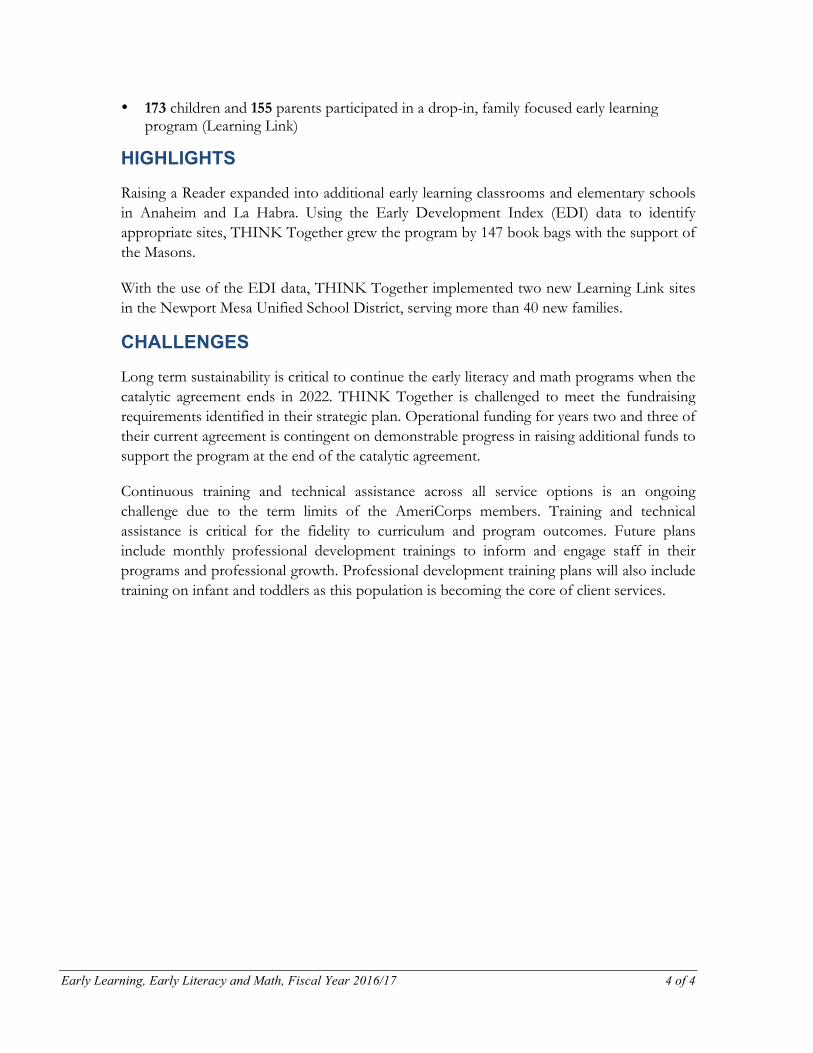
Early Learning, Early Literacy and Math, Fiscal Year 2016/17 4 of 4
• 173 children and 155 parents participated in a drop-in, family focused early learning program (Learning Link)
HIGHLIGHTS
Raising a Reader expanded into additional early learning classrooms and elementary schools in Anaheim and La Habra. Using the Early Development Index (EDI) data to identify appropriate sites, THINK Together grew the program by 147 book bags with the support of the Masons.
With the use of the EDI data, THINK Together implemented two new Learning Link sites in the Newport Mesa Unified School District, serving more than 40 new families.
CHALLENGES
Long term sustainability is critical to continue the early literacy and math programs when the catalytic agreement ends in 2022. THINK Together is challenged to meet the fundraising requirements identified in their strategic plan. Operational funding for years two and three of their current agreement is contingent on demonstrable progress in raising additional funds to support the program at the end of the catalytic agreement.
Continuous training and technical assistance across all service options is an ongoing challenge due to the term limits of the AmeriCorps members. Training and technical assistance is critical for the fidelity to curriculum and program outcomes. Future plans include monthly professional development trainings to inform and engage staff in their programs and professional growth. Professional development training plans will also include training on infant and toddlers as this population is becoming the core of client services.

OC READS FY 16/17

Early Learning, OC Reads, Fiscal Year 2016/17 1 of 3
OC READS OC Reads, formerly Champions for Children’s Literacy, is a collaboration that began in FY 2014/15 between the Commission, Orange County United Way and the Orange County Community Foundation to develop a shared funding model to improve early literacy outcomes in Orange County. Representatives from the three organizations comprise the leadership team that meet to expand and improve evidence-based literacy programs and interventions for young children 0-8 in communities most at risk of not achieving grade level reading as identified by the Early Development Index (EDI) and Smarter Balanced Test scores.
INVESTMENTS
In Fiscal Year 2014/15, the Commission and United Way each allocated $36,000 to jointly fund an OC Reads project manager. In Fiscal Year 2015/16, an annual allocation of $150,000 for three years was allocated to a shared funding pool to improve literacy outcomes. Only $128,731 was spent in Fiscal Year 2016/17. The United Way and Community Foundation each added $100,000 to the pool for a total annual funding amount of $350,000. The Orange County Community Foundation increased their allocation to $300,000 for Fiscal Year 2017/18. The Orange County United Way is the fiscal lead for the shared funding pool.
Funder 2016/17 2017/18 2018/19 Restrictions Children & Families Commission
$128,731 $170,000 $150,000 Children 0-5
OC Community Foundation
$100,000 $300,000 $100,000 Gift to educational institutions
OC United Way $100,000 $100,000 $100,000 Children 0-8 Total $328,731 $570,000 $350,000
OUTCOMES
• 275 children were provided “Let’s Read Together” classes, and 1,416 services were offered
• 201 parents completed school readiness and child development education sessions • 165 parents received referrals for 548 services • 21 parents completed health education sessions
HIGHLIGHTS
In March 2016, a Request for Proposals was distributed to 70 individuals representing more than 30 organizations that serve six targeted communities determined by the Early Development Index data and the Smarter Balance Test scores. The applicants were required to create a collaborative model using proven evidence-based literacy programs and

Early Learning, OC Reads, Fiscal Year 2016/17 2 of 3
interventions. Applicants were also required to provide 1:1 match funding. The programs and intervention strategies were expected to be sustainable, measurable, and scalable. The following four eligible communities were funded.
• Anaheim Elementary School District- Integrated Model City’s “Footsteps 2 Brilliance” Mobile Technology Platform. Key application is the Academic Language Program for Students that delivers interactive e-books and education games to smart phones and tablets. Funding amount of $100,000 supported the purchase of one-year license, training and implementation package.
• Boys and Girls Club of Central Orange Coast - Expanded Flying Start, early literacy intervention, from eight to 15 school sites. The program was developed in 2014 and provides effective in-school and summer literacy activities, with monthly family literacy nights. Funding amount of $100,000 supported staffing, curriculum purchase, tablets, and staff training.
• Boys and Girls Clubs of Garden Grove- Integrated the Words Alive Literacy model in the existing Readiness on the Road early learning program. The program includes home focused interventions including book sharing, reading activities and kindergarten tool kits. Funding amount of $52,448 supported staffing, books, activity materials and screening tools.
• La Habra City School District – Expanded the existing School Readiness Literacy Program/Learning Link and developed extended Summer Readiness Learning Program implementing California Department of Education’s Preschool Learning Foundations. Trained Community Liaisons, led by a certified teacher, models literacy activities for parents, caregivers and children. Funding amount of $61,283 supported staffing, books and supplies.
Commission funding was only used to support the early intervention programs in the communities of Garden Grove and La Habra, funding from United Way and the Community Foundation supported the school aged programs. Three of the four programs were able to achieve or surpass targeted outcomes. It was mutually decided to discontinue the Boys and Girls Club of Garden Grove program due to the inability to engage the targeted communities after several adjustments to the program.
A key factor in success for these programs is the importance of community engagement. Strengthening the community’s understanding of the importance of early literacy and partnerships between the school district and community providers are a critical component for this process.
CHALLENGES
The challenge for future years is to build on the momentum and partnerships developed in the first year in the following areas:

Early Learning, OC Reads, Fiscal Year 2016/17 3 of 3
• Early Developmental Index - In Anaheim and La Habra, the EDI will be used to develop a deeper understanding of the strengths and vulnerabilities of young children. With the Santa Ana Early Learning Initiative as a program model, the focus will be on building a diverse stakeholder group for each community, shared measurements of success, and strategies to align early learning programs.
• Alignment – Link the programs funded by OC Reads with other community campaigns for greater support of early literacy efforts. Specifically, PBS SoCal’s early learning outreach in Anaheim and La Habra to increase parent engagement and knowledge about free resources available through PBS.
• School Aged Interventions - Commission funding will not be used for school aged intervention. The Orange County Community Foundation and United Way will meet with school districts to discuss the potential to use OC Reads funding to directly support children who have been identified at-risk of not reading at grade level by third grade.

READINESS ON THE ROAD
FY 16/17

Early Learning, Readiness on the Road, Fiscal Year 2016/17 1 of 3
READINESS ON THE ROAD The Boys and Girls Club of Garden Grove provides early learning services as well as health services. The early learning portion of the contract includes an evidence-based school readiness program (Readiness on the Road), which uses a modified High Scope curriculum. The program also includes developmental screenings, referrals and follow up; parent education classes; professional development classes for early care providers; and support for Learning Links.
The health component, known as Access to Resources for Children’s Health, Education, and Support (ARCHES) links families with young children with health services at the Garden Grove Health Center, including referrals and follow up for general health, dental, vision and family support; assists with insurance enrollment; and provides outreach to homeless families for health services.
Using the American Academy of Pediatrics recommended developmental screening tool of the Ages and Stages Questionnaire (ASQ), the Boys and Girls Club of Garden Grove works with parents to assess children in the program, identify issues or concerns, and then teach parents how to navigate the systems in order to help children be healthy and ready to learn.
INVESTMENTS
The Boys and Girls Club of Garden Grove received an annual allocation of $437,400 from Fiscal Year 2011/12 through Fiscal Year 2014/15, with a reduction to $294,700 for Fiscal Year 2015/16 and $259,700 for Fiscal Year 2016/17. In Fiscal Year 2017/18 the Club received a one-year allocation of $79,000 to transition the Readiness on the Road program to other funding sources or to provide alternative options to families that are interested in early learning programs. The transitional services include a volunteer coordinator and a fund developer. The Garden Grove Unified School District has early learning programs with similar activities that are available for families in the community.

Early Learning, Readiness on the Road, Fiscal Year 2016/17 2 of 3
OUTCOMES
• 79% of children could count a group of three to five objects by touching each object at the end of services, compared to 63% at the beginning of services
• 95% of parents taught their children letters, numbers, or words at least three times in the prior week at the end of services, compared to 80% at the beginning of services
• 55% of children knew none of the alphabet letters by name at the beginning of services compared to only 5% at the end of services
• $36,222 in Medi-Cal Administrative Activities (MAA) reimbursement funding • 588 children received developmental or behavioral screenings • 118 parents received follow up on a referral made for their child, and services were
accessed.
HIGHLIGHTS
As a portion of a sustainability plan that began in 2011, MAA was implemented into program claiming plans for early learning and ARCHES programs beginning in 2013. Since implementation, MAA has produced 50 percent of claimable staff time dedicated to Medi-Cal outreach and linkage to services. In Fiscal Year 2016/17, MAA reimbursement for Fiscal Years 2013/14 and 2014/15 were received. After a times survey allocation, the early learning program received $36,222. The program is expected to receive $12,000 to $15,000 for Fiscal Year 2015/16. MAA funding is reinvested back into staffing, evaluation and program development and expansion.
CHALLENGES
School enrollment within the Garden Grove Unified School District is currently in decline. Many families within the targeted population are facing significant financial difficulty, are transient, and frequently move to schools in other school districts or other counties. Birth
$355,400 $355,400 $355,400 $355,400$212,700 $177,770
$82,000 $82,000 $82,000 $82,000
$82,000$82,000
$0
$100,000
$200,000
$300,000
$400,000
$500,000
2011/12 2012/13 2013/14 2014/15 2015/16 2016/17
CommissionInvestmentinBoysandGirlsClubofGardenGroveFiscalYears2011/12through2016/17
EarlyLearningServices ARCHES

Early Learning, Readiness on the Road, Fiscal Year 2016/17 3 of 3
rates across southern California have also fallen and the number of families with children 0-5 continues to decrease. The natural decline of the service population created difficulty in recruiting and retaining a constant group of children and families for each program session. Revising the program schedule to include afternoon hours was not optimal as children were less responsive and participative than in the morning.
A barrier for the target population is immigration, deportation, and the security of the family unit among undocumented families. This issue discouraged many families from seeking support services and created additional barriers for the program to identify, communicate, and recruit children and families for early learning services.

OC STEM INITIATIVE
FY 16/17

Early Learning, OC STEM Initiative, Fiscal Year 2016/17 1 of 3
OC STEM INITIATIVE Compelling evidence suggests that the achievement gaps that exist between student groups in second grade are foreshadowed at kindergarten entry.1 Research also suggests that very young children are ready to learn a broad array of mathematics content that will give them a solid base for future learning.2 Six longitudinal studies showed that early math skills are the most powerful predictor of later school success.3 And in a survey conducted in 2010, Californians reported seeing early science as foundational to success in high school.4
This is important because while the United States lags behind other nations in STEM (Science, Technology, Engineering, and Mathematics) education, California is projecting a growth in STEM careers.
Further, overall STEM occupations pay well at all educational levels. People in STEM occupations with a high school diploma or less have higher lifetime earnings than people in other occupations with similar education levels (approximately $500,000 more). Similarly, STEM majors make substantially more over their lifetime than non-STEM majors.5 Quality STEM education is important for Orange County’s youngest children to be able to succeed in school, as well as for the development of Orange County’s future workforce.
The Commission is a member of the OC STEM Initiative that began in 2011 as a partnership with the Samueli Foundation and has expanded to a membership organization comprised of business foundations, educational organizations, and content experts. The focus is on the full continuum of learning from preschool through college, with the overarching goal that students are college and career ready in STEM fields.
INVESTMENTS
In Fiscal Year 2011/12, the Commission allocated $250,000 over three years to the OC STEM Initiative to develop a strategic plan, launch the program and secure other funding partners. In Fiscal Year 2014/15, funding for the program was renewed at $125,000 for an additional three years to support the implementation the OC STEM Initiative Strategic Plan.
1 California’s Math Pipeline: Success Begins Early, July 2011 2 Duncan, G, Dowsett, C., Claessens, A., Magnuson, K., Huston, A., Klebanov, P., Pagani, L., et al. (2007)
School Readiness and Later Achievement. Developmental Psychology, 43, 1428-1446. 3 Ibid. 4 A Priority for California’s Future: Science for Students – Analysis of Public Opinion Research (2010).
Sacramento, CA: The Center for the Future of Teaching and Learning at WestEd. 5 Carnevale, A, Smith, N. and Melton, M. (2011). STEM Science, Technology Engineering, Mathematics –
Full Report. Georgetown University Center on Education and the Workforce.

Early Learning, OC STEM Initiative, Fiscal Year 2016/17 2 of 3
In February 2017, a three year agreement was approved for $105,000 ($35,000 annually) for the term of July 1, 2017 thru June 30, 2020. The agreement continues to focus on early learning utilizing Early Learning Index (EDI data) with the OC STEM Initiative. Concentrating on improving STEM education, $10,000 was allocated of early learning time to support the Ecosystem Institute, a professional learning institute designed to strengthen Orange County school district leadership through the development of STEM Learning Ecosystems and implementation of Science, Technology, Engineering and Mathematics (STEM) education programs over an intensive 12-month time period. The program has created a catalytic “systems-change” ensuring children are exposed to STEM disciplines at an early age. The OC STEM Initiative is a major partner in the annual Early Learning STEM symposium and the Board membership provides networking opportunities with STEM focused organizations and exposure to “thought leadership.”
OUTCOMES
• 400+ attended the 2017 Early Childhood STEM Symposium • 9 school districts participated in the STEM EcoSystem
HIGHLIGHTS
Early Childhood STEM Symposium
More than 400 early educators and administrators attended the 2017 Early Childhood STEM Symposium as the Anaheim Marriott in March 2017. The successful event included a discussion with experts on creating a STEM-based environment, which was followed by hands-on workshops that included activities and projects that participants can recreate in their classrooms. The highlight of the event was the key note presentation by NASA
$100,000
$75,000 $75,000
$50,000 $50,000
$25,000
$0
$20,000
$40,000
$60,000
$80,000
$100,000
$120,000
2011/12 2012/13 2013/14 2014/15 2015/16 2016/17
CommissionInvestmentinOCSTEMIniQaQveFiscalYears2011/12through2016/17

Early Learning, OC STEM Initiative, Fiscal Year 2016/17 3 of 3
astronaut Leland Melvin who shared his story. Mr. Melvin engaged the audience with his life story that included a time in the National Football League and two trips on the Space Shuttle Atlantis to help build the International Space Station. The event was planned in partnership with the OC STEM Initiative, Orange County Department of Education, and THINK Together.
STEM EcoSystem
Nine school districts participated in the year-long Cohort 2 Ecosystem Institute. This cohort participated in site visits at STEM focused businesses to strengthen the partnerships between school and community. In addition, a day of training was dedicated to early learning workshops and EDI data information. Discussion included the intersection and importance of instructional practices and articulation with programs serving children 0-5 and K-3 schools.
The engagement of the Early Learning Specialists at each district has raised awareness in realizing the amount of early learning services provided within their school district and community. It also has offered time for staff to bridge information between all ecosystem partners.
CHALLENGES
Eighteen of the 27 Orange County school districts have participated in the OC STEM Ecosystem Institute. However, there is a lack of full participation of every school district due to the amount of off campus staff time needed to participate in the year-long program, lack of recognizable benefit to their existing STEM instruction, and alignment with their Local Control Accountability Plan priorities.
There continues to be limited understanding regarding what early STEM education entails. Membership on the OC STEM leadership committee is critical to continue advocating for the inclusion of early learning in OC STEM programs and activities as appropriate.

QUALITY START OC FY 16/17

Early Learning, Quality Start OC, Fiscal Year 2016/17 1 of 3
QUALITY START OC Forty years of research shows that children receiving high quality early education are more likely to be prepared and do better in school, graduate high school, attend college or job training, earn higher wages, and lead longer, healthier lives. A quality rating and improvement system (QRIS) is a systemic approach to assess, improve, and communicate the effectiveness and quality of early education programs. Participating programs are assessed every two years, and are assigned an overall rating of 1-5 stars. California’s QRIS measures: child assessment; health and developmental screening; teacher and director qualifications; and classroom instruction.
Orange County Department of Education (OCDE) operates the Quality Start OC QRIS. Funding comes from the California Department of Education QRIS Block grants, and First 5 California IMPACT (Improve and Maximize Programs so All Children Thrive) and Hub grants. These funds allow OCDE to assess, rate, and provide quality improvement coaching and training to more than 300 preschool programs in Orange County. Quality Start OC QRIS participants include school district, non-profit, faith-based, family child care, and private providers.
California counties are divided into 10 hub regions to provide coordination and specialized support to the hub member counties and to create economies of scale. The Children and Families Commission of Orange County is a member of the Region 9 Hub, which includes Imperial, Riverside, and San Bernardino Counties. The OCDE is the most senior organization with knowledge and expertise in QRIS due to their groundbreaking work with the Race to the Top Early Learning Challenge grant that ended June 30, 2016. As part of the grant, OCDE was a member of a statewide consortium to develop the California Rating Matrix and Framework. The Region 9 members selected OCDE to provide regional coordination, training, and technical expertise.
INVESTMENTS
The Commission is the fiscal agent for the four-year (2016/17-2019/20) IMPACT and Hub agreements with First 5 California. More than $5 million was awarded to support the implementation of Quality Start OC QRIS, and another $2.8 million for Region 9 Hub technical assistance. The budget for Fiscal Year 2016/17 was underspent due to delays with finalizing the agreements with First 5 California and OCDE. There are not limitations on when the funding must be spent, therefore the remaining balance will be re-budgeted over the three remaining years of the agreement.

Early Learning, Quality Start OC, Fiscal Year 2016/17 2 of 3
OUTCOMES
• 1,800 hours of preschool instructional coaching • 300 hours of technical assistance • 273 classroom quality assessments • 250 rated centers: 88% are rated as highest quality • 63 rated family child care homes: 35% are rated as highest quality • 55 professional development trainings • 12 Parent Nights
HIGHLIGHTS
Help Me Grow National Award
Help Me Grow Orange County and the OCDE team received a $10,000 Help Me Grow National Innovations Challenge Grant this year. The Orange County team was one of four finalists invited to present. The winning innovation leveraged the Quality Rating and Improvement System (QRIS), the Help Me grow infrastructure and the use of mobile devices to complete developmental screenings. The Innovation Challenge was developed to advance comprehensive early childhood systems that support developmental promotion, early detection, referral and linkage to services.
Orange County Community Colleges
The Early Childhood Education Roundtable launched, which is a working group comprised of QRIS leads and department chairs from each community college child development department. This group works to align early childhood course offerings across the county, and to leverage resources to develop on-boarding and support courses for English-language learners and adults needing technology skills in order to access online coursework.
Region 9 Hub Partnerships
The Region 9 Hub has been recognized for its effective communication and collaboration across the four participating counties: Imperial, Orange, Riverside, and San Bernardino. Hub funds built capacity in each county to deliver coaching and trainings support through several series of coach, assessor, and trainer workshops. The successful QRIS Region 9 Hub Summer Institute was a four day event of workshops for QRIS staff on systems development, training-of-trainers, and marketing strategies.
CHALLENGES
Due to changes to both the state and local agreements, much focus was given to resolving outstanding issues before the final agreements were signed. Therefore, implementation of

Early Learning, Quality Start OC, Fiscal Year 2016/17 3 of 3
the program was significantly delayed. While the program elements, which supports preschool programs with resources to improve quality was implemented throughout the year, the administrative process to develop “systems change” was delayed. Creating an infrastructure and implementation strategy for private and non-traditional preschool programs is the focus for Fiscal Year 2017/18.

EARLY DEVELOPMENT
INDEX FY 16/17

Early Learning, Early Development Index, Fiscal Year 2016/17 1 of 2
EARLY DEVELOPMENT INDEX (EDI) Developed over the course of nearly 30 years, the EDI is a population-based measure of early child development and school readiness in five key domains: physical health, social competence, emotional maturity, language and cognitive skills, and communications skills and general knowledge. Through rigorous, international testing, the EDI has been found to be a reliable indicator of a child’s well-being that has been used to monitor populations of children over time; report on populations of children in different communities; predict how groups of children will do in elementary school; and, inform systems and policies concerning young children and their families.
Collecting EDI tells how the community’s children are doing, what programs and opportunities are helping and where additional resources need to be deployed to ensure the success of the entire community. The EDI data helps policy makers, nonprofit groups, educators and child advocates to quantify the success of programs and policies in place, uncover pockets of need and collaborate to ensure necessary support reaches all children.
The first iteration of EDI was developed in the late 1990s at the Offord Centre at McMaster University in Ontario, Canada. In 2008, researchers at UCLA established a licensing agreement with the Offord Centre to develop a U.S. version of the EDI. Orange County was the vanguard site for implementing the EDI in the United States. Researchers, policy makers and child advocates understand that data drives meaningful decisions for early childhood education, health and well-being.
INVESTMENT
The annual average Commission investment is $300,000. Funding began with the initial pilot of the EDI in 2007. Beginning in 2015, in partnership with the county’s 24 elementary school districts and kindergarten teachers, data was collected in all of the public schools that have a kindergarten population.
OUTCOMES
• 61% Ready – Social Competence: Approaches to learning • 50% Ready – Physical Health & Well–being: Gross and fine motor skills • 46% Ready – Social Competence: Overall social competence • 38% Ready – Social Maturity: Prosocial and helping behavior • 38% Ready – Communication Skills and General Knowledge

Early Learning, Early Development Index, Fiscal Year 2016/17 2 of 2
HIGHLIGHTS
Predictive Validity Study
The University of California, Irvine School of Education conducted a predictive validity study of the Early Development Index. The preliminary results confirmed that scores from the EDI do predict third grade achievement. The final study for publication is in progress.
EDI Microsite
An Early Development Index microsite was added to the Children and Families Commission website. The site provides public access to basic information about EDI, how children are surveyed, and descriptions of the five developmental domains. The site also includes regional maps showing kindergarten readiness data with pop-up information for each community, and countywide findings in each of the five domains. The EDI resources available for downloading and printing include a program brief, deep dive report, predictive validity study, parents’ handbook and the research dossier.
CHALLENGES
EDI data is a new resource for school personnel. Although EDI data demonstrates the growing need for effective early learning programs, and the positive effect such programs have on kindergarten readiness, school principals, and other administrators do not have adequate awareness or experience with this information. Some do not currently view EDI data as a current priority or focus area and therefore limit EDI’s effectiveness.

EARLY LEARNING APPENDICES
FY 16/17

Early Learning, APPENDICES, Fiscal Year 2016/17 2 of 13
APPENDICES – DETAILED OUTCOMES TABLES Early Learning Specialists
In fiscal year 2016/17, the Commission’s investment in Early Learning Specialists produced the following services and outcomes for children ages birth through five:
Table 1. Aggregate Data for Early Learning Specialist Children Ages 0-5 Family Members Service Providers Number of people receiving services*
13,663 14,603 1,799
Number of services provided
1,311,620 512,129 6,636
* Although each grantee reports an unduplicated count, clients served by more than one program may be counted more than once when data from multiple grantees are added together.
Table 2. Description of Children Served in FY 16/17 by Early Learning Specialist Programs (n=636)
Variable Considered Category Label Count1 Percent Age at most recent interview
Under Three Three through Five
74 562
11.6 88.4
Ethnicity Amer. Indian/Alaska Native Asian
Black/African American Hispanic/Latino Pacific Islander White Vietnamese Multiracial Middle Eastern Other Unknown
0 27 1
470 0
59 31 24 2 6
16
0.0 4.2 0.2
73.9 0.0 9.3 4.9 3.8 0.3 0.9 2.5
Primary Language Arabic English Farsi (Persian) Filipino (Tagalog) Korean Mandarin (Putonghua) Spanish Vietnamese Other Unknown
3 262
4 0 3 3
314 30 8 9
0.5 41.2 0.6 0.0 0.5 0.5
49.4 4.7 1.3 1.5
At or Below 200% Federal Poverty Level 419 84.4 1The counts for specific demographic variables may be less than the total number of children entered into the Commission’s Data Collection and Reporting System. This typically occurs because survey respondents decline to answer a specific question, or an error in data entry results in an out-of-range value that must be deleted.

Early Learning, APPENDICES, Fiscal Year 2016/17 3 of 13
Table 3. Services Provided by Early Learning Specialist Programs Strategic Plan
Outcome Service Clients
Served Number of
Services HC.4 Increased percent of children growing up in healthy and safe environments
Parents receive speech and language services 1,109 1,051
EL.1 Increased all children’s developmental skills to be proficient learners in school
Parents participate in a program designed to increase the frequency of reading at home
11,912 400,401
Parents receive literacy information/assistance in waiting rooms or community events
3,085 2,743
Books distributed to children N/A 57,047 New and used books collected for distribution N/A 49,195 Children participating in early literacy programs 15,317 1,467,608 Children participate in early math/STEM programs 461 3,240
EL.2 Increased quality of early care and education
Providers will conduct classroom assessments using an established tool such as ECERS or CLASS, and develop improvement plans, when needed, to improve the quality of existing district and/or community ECE programs
380 379
Parents participate in a drop-in, family-focused early learning program (i.e., Learning Link)
3,570 32,805
Children participate in a drop-in, family-focused early learning program (i.e., Learning Link)
3,090 34,439
EL.3 Increased early educator, parent and caregiver knowledge and skills to promote children’s readiness for school
Parents receive tools, resources, information and/or training needed to transition their child to school
27,901 104,696
Participate in EDI at one of the following levels: planning for future implementation; implementing EDI; or incorporating EDI data in planning efforts (schools)
N/A 191
EL.4 Improved transitions of children entering Kindergarten and K-12 system
Children visit Kindergarten classrooms prior to start of school year
8,825 N/A
Children's health and development records are transferred to their elementary school prior to entering Kindergarten
7,227 N/A
Children entering preschool programs are assigned a unique identifier
11,332 N/A
SF.4 Increased access to and availability of family support services and resources
Providers are educated to increase awareness and identification of behavioral health issues for children 0-5
1,131 302
CB.1 Maximize all sustainability activities
Dollar amount raised from program fees/revenue N/A $5,757,375 Dollar amount raised from individual donations N/A $12,181

Early Learning, APPENDICES, Fiscal Year 2016/17 4 of 13
Strategic Plan Outcome
Service Clients Served
Number of Services
Dollar amount raised from Foundation donations N/A $85,572 Dollar amount raised from government funds/grants N/A $38,968,356
CB.2 Increase access and efficiency, quality and effectiveness
Provide trainings to build the capacity of the agency to increase quality services (including STEM related activities)
1,835 420
Table 4. Service Outcomes (SOQs) for Early Learning Specialists Key Strategic Plan Objectives SOQ Results
Early Learning • 75% of typically developing children
are effective learners in literacy • 19.9% of children knew none of the alphabet letters
by name at the beginning of services compared to only 7.9% at the end of services
• 75% of typically developing children are effective learners in literacy
• 91.4% of children could identify his or her written name at the end of services, compared to only 80.9% at the beginning of services
• 75% of typically developing children are effective learners in literacy
• 98.7% of children had familiarity with books at the end of services, compared to 94.2% at the beginning of services
• 80% of typically developing children are effective learners in numeracy
• 95.0% of children could count a group of three to five objects by touching each object at the end of services, compared to 86.1% at the beginning of services.
• 80% of typically developing children are effective learners in numeracy
• 95.9% of children could correctly name at least two shapes at the end of services, compared to only 83.7% at the beginning of services
• 80% of typically developing children are effective learners in numeracy
• 88.6% of children could recite at least five numbers in order at the end of services, compared to only 60.0% at the beginning of services
• 75% of typically developing children are socially competent
• 98.2% of children could follow simple two-step oral directions at the end of services, compared to 97.4% at the beginning of services
• 75% of typically developing children are socially competent
• 96.4% of children cooperated with the daily classroom routine most of the time at the end of services, compared to 93.2% at the beginning of services
• Increase parents’ knowledge and involvement in preparing children for school
• 82.0% of parents taught their children letters, numbers, or words at least three times in the prior week at the end of services, compared to 72.7% at the beginning of services
• Increase parents’ knowledge and involvement in preparing children for school
• 88.2% of parents played with toys or games indoors at least three times in the prior week at the end of services, compared to 89.4% at the beginning of services

Early Learning, APPENDICES, Fiscal Year 2016/17 5 of 13
Key Strategic Plan Objectives SOQ Results • Increase parents’ knowledge and
involvement in preparing children for school
• 75.0% of parents went on outings with their child at least three times in the prior week at the end of services, compared to 66.9% at the beginning of services
• Increase parents’ knowledge and involvement in preparing children for school
• 90.0% of parents talked with their child about daily activities at least three times in the prior week at the end of services, compared to 90.3% at the beginning of services
• Increase parents’ knowledge and involvement in preparing children for school
• 66.8% of parents played, games, sports or exercised with their child at least three times in the prior week at the end of services, compared to 65.8% at the beginning of services
• Increase parents’ knowledge and involvement in preparing children for school
• 91.0% of parents felt they had sufficient information and support for their child to attend Kindergarten at the end of services, compared to 90.9% at the beginning of services
Healthy Children • Increase to 100% the number of
children with health coverage • 99.2% of children served had health insurance at the
end of services (compared to 99.7% at the beginning of services)
• Increase to 100% the proportion of children who have a health care home
• 98.5% of children had a medical health home at the end of services (compared to 97.8% at the beginning of services)

Early Learning, APPENDICES, Fiscal Year 2016/17 6 of 13
Early Literacy and Math
Think Together
In fiscal year 2016/17, the Commission’s investment in Think Together produced the following services for children ages birth through five:
Table 1. Aggregate Data for Think Together
Children Ages 0-5 Family Members Service Providers Number of people receiving services
37,112 10,994 212
Number of services provided
204,758 54,610 27
Table 2. Description of Children Served in FY 16/17 by Think Together (n=201) Variable Considered Category Label Count1 Percent
Age at most recent interview
Under Three Three through Five
55 146
27.4 72.6
Ethnicity
Amer. Indian/Alaska Native Asian
Black/African American Hispanic/Latino Middle Eastern Pacific Islander White/Caucasian Vietnamese Multiracial Other Unknown
4 22 2
135 0 2 8 3 9 2 14
2.0 10.9 1.0 67.2 0.0 1.0 4.0 1.5 4.5 1.0 7.0
Primary Language
Arabic English Farsi (Persian) Filipino (Tagalog) Korean Mandarin (Putonghua) Spanish Vietnamese Other Unknown
0 102 2 0 0 0 76 5 2 14
0.0 50.7 1.0 0.0 0.0 0.0 37.8 2.3 1.0 7.0
1 The counts for specific demographic variables may be less than the total number of children entered into the Commission’s Data Collection and Reporting System. This typically occurs because survey respondents decline to answer a specific question, or an error in data entry results in an out-of-range value that must be deleted.

Early Learning, APPENDICES, Fiscal Year 2016/17 7 of 13
Table 3. Services Provided by Think Together Strategic Plan
Outcome Service Client
s Serve
d
Number of
Services
EL.1 Increased all children’s developmental skills to be proficient learners in school
Children read to at physicians' offices or clinics 3,420 458 Parents participate in a program designed to increase the frequency of reading at home
2,478 51,487
Parents receive literacy information/assistance in waiting rooms or community events
8,103 1,935
Books distributed to children N/A 103,028 New and used books collected for distribution N/A 130,940 Children participating in early literacy programs 32,260 81,269
EL.2 Increased quality of early care and education
Children receive enhanced evidence-based school readiness services through early education programs
865 19,274
Parents participate in a drop-in, family-focused early learning program (i.e., Learning Link)
155 765
Children participate in a drop-in, family-focused early learning program (i.e., Learning Link)
173 739
Providers are given resources and early intervention strategies for appropriate early care and education practices
269 282
EL.3 Increased early educator, parent and caregiver knowledge and skills to promote children’s readiness for school
Parents receive tools, resources, information and/or training needed to transition their child to school
222 27
CB.1 Maximize all sustainability activities
Number of volunteers recruited 1,307 1,307
CB.2 Increase access and efficiency, quality and effectiveness
Developing partnerships, coordinating and collaborating with other agencies to improve service delivery
N/A 30
Present best/innovative practices N/A 6
Provide trainings to build the capacity of the agency to increase quality services (including STEM related activities)
44 28

Early Learning, APPENDICES, Fiscal Year 2016/17 8 of 13
Table 4 Service Outcomes (SOQs) for Think Together Key Strategic Plan Objectives SOQ Results
Early Learning • 75% of typically developing children
are effective learners in literacy • 23.3% of children knew none of the alphabet
letters by name at the beginning of services compared to only 15.3% at the end of services
• 75% of typically developing children are effective learners in literacy
• 85.4% of children could identify his or her written name at the end of services, compared to only 64.8% at the beginning of services
• 75% of typically developing children are effective learners in literacy
• 97.7% of children had familiarity with books at the end of services, compared to 92.7% at the beginning of services
• 80% of typically developing children are effective learners in numeracy
• 93.2% of children could count a group of three to five objects by touching each object at the end of services, compared to 84.0% at the beginning of services.
• 80% of typically developing children are effective learners in numeracy
• 92.2% of children could correctly name at least two shapes at the end of services, compared to only 78.7% at the beginning of services
• 80% of typically developing children are effective learners in numeracy
• 80.0% of children could recite more than five numbers in order at the end of services, compared to only 57.3% at the beginning of services
• Increase parents’ knowledge and involvement in preparing children for school
• 77.6% of parents taught their children letters, numbers, or words at least three times in the prior week at the end of services, compared to 68.8% at the beginning of services
• Increase parents’ knowledge and involvement in preparing children for school
• 94.1% of parents talked with their child about daily activities at least three times in the prior week at the end of services, compared to 89.4% at the beginning of services
• Increase parents’ knowledge and involvement in preparing children for school
• 94.1% of parents felt they had sufficient information and support for their child to attend Kindergarten at the end of services, compared to 86.7% at the beginning of services
Healthy Children • Increase to 100% the number of
children with health coverage • 100% of children served had health insurance at
the end of services (compared to 100% at the beginning of services)
• Increase to 100% the proportion of children who have a health care home
• 95.2% of children had a medical health home at the end of services (compared to 95.2% at the beginning of services)

Early Learning, APPENDICES, Fiscal Year 2016/17 9 of 13
Boys and Girls Club of Garden Grove
In fiscal year 2016/17, the Commission’s investment in Boys and Girls Club of Garden Grove produced the following services for children ages birth through five:
Table 1. Aggregate Data for Boys and Girls Club of Garden Grove
Children Ages 0-5 Family Members Service Providers Number of people receiving services
471 387 44
Number of services provided
1,612 1,190 93
Table 2. Description of Children Served in FY 16/17 by Boys and Girls Club of Garden Grove (N=471)
Variable Considered Category Label Count1 Percent
Age at most recent interview
Under Three Three through Five
288 183
61.1 38.9
Ethnicity
Amer. Indian/Alaska Native Asian
Black/African American Hispanic/Latino Middle Eastern Pacific Islander White/Caucasian Vietnamese Multiracial Other Unknown
0 47 0
298 0 0 40 53 3 30 0
0.0 10.0 0.0 63.3 0.0 0.0 8.5 11.3 0.6 6.4 0.0
Primary Language
Arabic English Farsi (Persian) Filipino (Tagalog) Korean Mandarin (Putonghua) Spanish Vietnamese Other Unknown
0 219 2 2 0 2
176 38 30 2
0.0 46.5 0.4 0.4 0.0 0.4 37.4 8.1 6.4 0.4
1 The counts for specific demographic variables may be less than the total number of children entered into the Commission’s Data Collection and Reporting System. This typically occurs because survey respondents decline to answer a specific question, or an error in data entry results in an out-of-range value that must be deleted.

Early Learning, APPENDICES, Fiscal Year 2016/17 10 of 13
Table 3. Services Provided by Boys and Girls Club of Garden Grove Strategic Plan
Outcome Service Client
s Serve
d
Number of
Services
HC.2 Increased percent of children receiving developmental / behavioral screenings at milestone ages with linkage to appropriate services
Children receive developmental and/or behavioral screening using evidence-based screening tools (i.e., PEDS, ASQ, ASQ-SE, MCHAT, Child Behavior Checklist)
588 588
HC.4 Increased percent of children growing up in healthy and safe environments
Parents receive speech and language services 2,328 2,328
EL.2 Increased quality of early care and education
Children receive enhanced evidence-based school readiness services through early education programs
825 4,248
Providers are given resources and early intervention strategies for appropriate early care and education practices
141 684
EL.3 Increased early educator, parent and caregiver knowledge and skills to promote children’s readiness for school
Parents receive tools, resources, information and/or training needed to transition their child to school
636 5,802
SF.3 Increased parent knowledge and skills to help prepare children to reach their optimal potential
Parents participate in a parenting education class or series on healthy child development
63 96
SF.4 Increased access to and availability of family support services and resources
Parents receive follow up on referrals and services are accessed
495 1,644
CB.1 Maximize all sustainability activities
Dollar amount raised from program fees/revenue N/A $936 Dollar amount raised from individual donations N/A $0
Dollar amount raised from Foundation donations N/A $0 Dollar amount raised from government funds/grants N/A $0 Dollar amount of in-kind contribution generated N/A $26,320
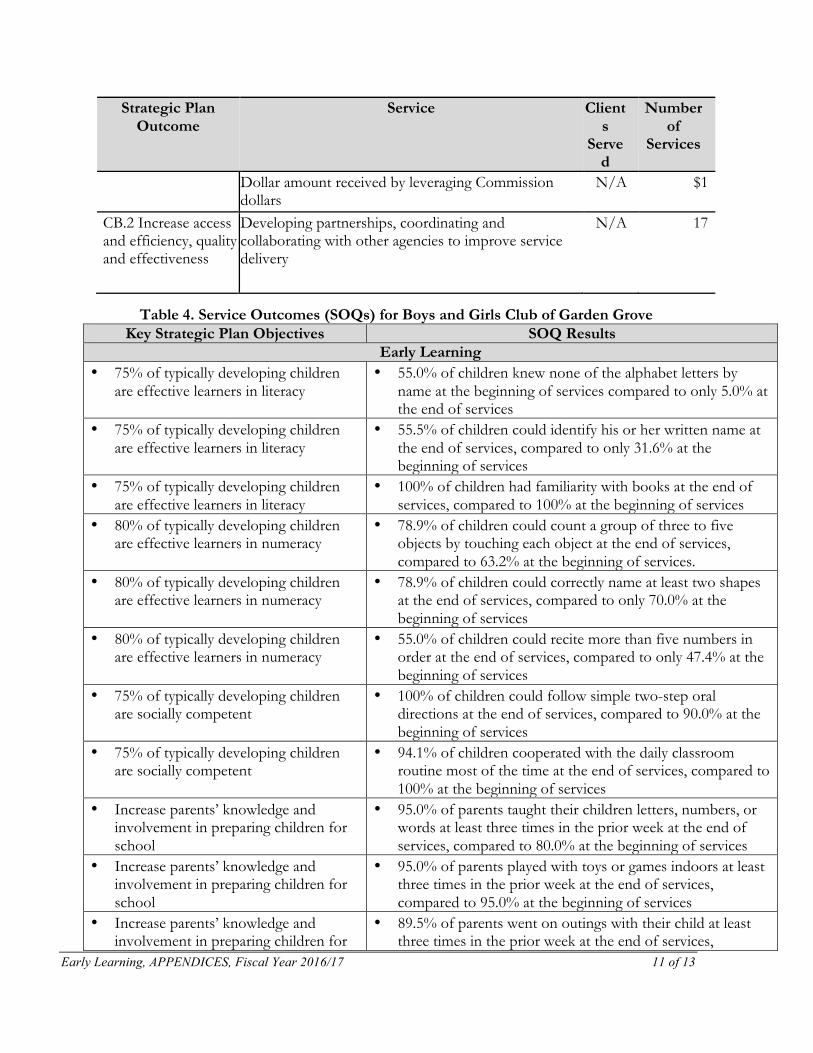
Early Learning, APPENDICES, Fiscal Year 2016/17 11 of 13
Strategic Plan Outcome
Service Clients
Served
Number of
Services
Dollar amount received by leveraging Commission dollars
N/A $1
CB.2 Increase access and efficiency, quality and effectiveness
Developing partnerships, coordinating and collaborating with other agencies to improve service delivery
N/A 17
Table 4. Service Outcomes (SOQs) for Boys and Girls Club of Garden Grove Key Strategic Plan Objectives SOQ Results
Early Learning • 75% of typically developing children
are effective learners in literacy • 55.0% of children knew none of the alphabet letters by
name at the beginning of services compared to only 5.0% at the end of services
• 75% of typically developing children are effective learners in literacy
• 55.5% of children could identify his or her written name at the end of services, compared to only 31.6% at the beginning of services
• 75% of typically developing children are effective learners in literacy
• 100% of children had familiarity with books at the end of services, compared to 100% at the beginning of services
• 80% of typically developing children are effective learners in numeracy
• 78.9% of children could count a group of three to five objects by touching each object at the end of services, compared to 63.2% at the beginning of services.
• 80% of typically developing children are effective learners in numeracy
• 78.9% of children could correctly name at least two shapes at the end of services, compared to only 70.0% at the beginning of services
• 80% of typically developing children are effective learners in numeracy
• 55.0% of children could recite more than five numbers in order at the end of services, compared to only 47.4% at the beginning of services
• 75% of typically developing children are socially competent
• 100% of children could follow simple two-step oral directions at the end of services, compared to 90.0% at the beginning of services
• 75% of typically developing children are socially competent
• 94.1% of children cooperated with the daily classroom routine most of the time at the end of services, compared to 100% at the beginning of services
• Increase parents’ knowledge and involvement in preparing children for school
• 95.0% of parents taught their children letters, numbers, or words at least three times in the prior week at the end of services, compared to 80.0% at the beginning of services
• Increase parents’ knowledge and involvement in preparing children for school
• 95.0% of parents played with toys or games indoors at least three times in the prior week at the end of services, compared to 95.0% at the beginning of services
• Increase parents’ knowledge and involvement in preparing children for
• 89.5% of parents went on outings with their child at least three times in the prior week at the end of services,

Early Learning, APPENDICES, Fiscal Year 2016/17 12 of 13
Key Strategic Plan Objectives SOQ Results school compared to 89.5% at the beginning of services
• Increase parents’ knowledge and involvement in preparing children for school
• 94.4% of parents talked with their child about daily activities at least three times in the prior week at the end of services, compared to 85.0% at the beginning of services
• Increase parents’ knowledge and involvement in preparing children for school
• 83.3% of parents played, games, sports or exercised with their child at least three times in the prior week at the end of services, compared to 80.0% at the beginning of services
• Increase parents’ knowledge and involvement in preparing children for school
• 76.4% of parents felt they had sufficient information and support for their child to attend Kindergarten at the end of services, compared to 84.2% at the beginning of services
Healthy Children • Increase to 100% the number of
children with health coverage • 100% of children served had health insurance at the end of
services (compared to 100% at the beginning of services) • Increase to 100% the proportion of
children who have a health care home • 100% of children had a medical health home at the end of
services (compared to 94.7% at the beginning of services)

Early Learning, APPENDICES, Fiscal Year 2016/17 13 of 13
Orange County Department of Education
In fiscal year 2016/17, the Commission’s investment in the Orange County Department of Education produced the following services for children ages birth through five:
Table 1. Aggregate Data for Orange County Department of Education
Children Ages 0-5 Family Members Service Providers Number of people receiving services
0 0 434
Number of services provided
0 0 3
Table 2. Services Provided by the Orange County Department of Education Strategic Plan
Outcome Service Clients
Served Number
of Services
EL.1 Increased all children’s developmental skills to be proficient learners in school
Participate in MIND Institute Early Math Program (preschools)
N/A 21
Providers participate in Building Blocks of Communication
71 71
CB.2 Increase access and efficiency, quality and effectiveness
Developing partnerships, coordinating and collaborating with other agencies to improve service delivery
N/A 15
Public information and outreach campaigns to increase community awareness of an issue or promote awareness of access to services
N/A 5
Provide trainings to build the capacity of the agency to increase quality services (including STEM related activities)
434 3