Suppl. Figure 1 A B - Cancer...
12
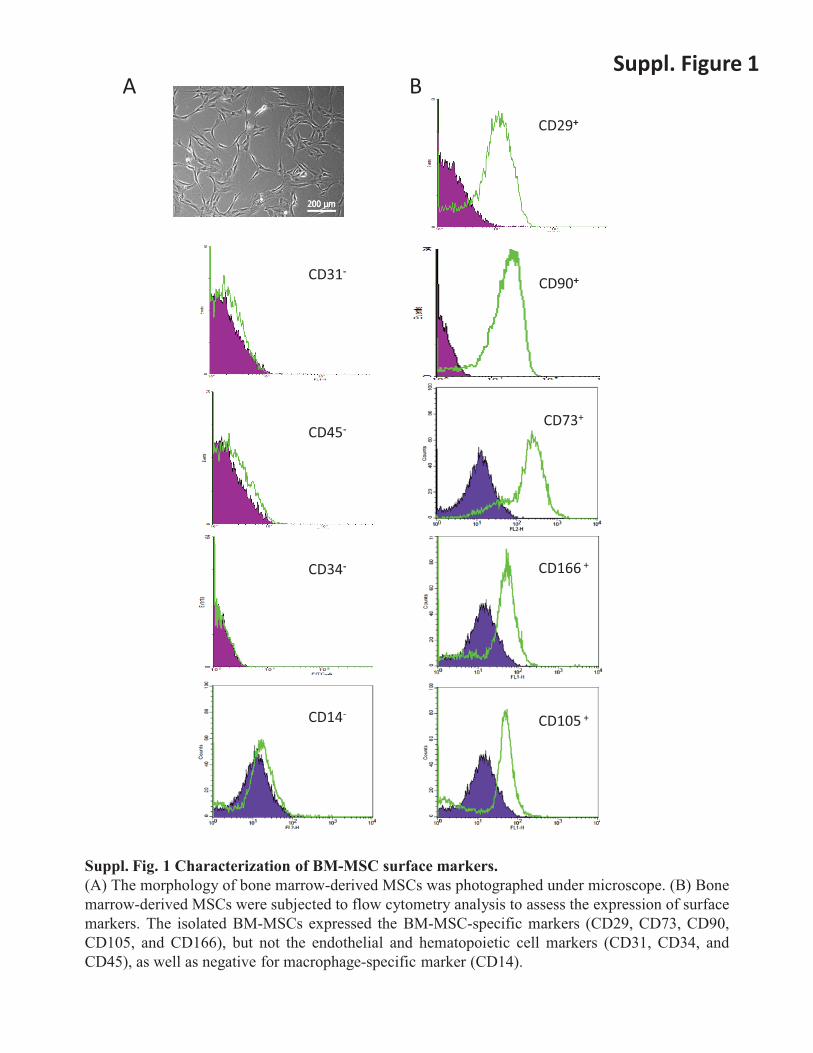
Suppl. Figure 1 A CD31 - CD45 - CD34 - CD14 - CD29 + CD90 + CD73 + CD166 + CD105 + Suppl. Fig. 1 Characterization of BM-MSC surface markers. (A) The morphology of bone marrow-derived MSCs was photographed under microscope. (B) Bone marrow-derived MSCs were subjected to flow cytometry analysis to assess the expression of surface markers. The isolated BM-MSCs expressed the BM-MSC-specific markers (CD29, CD73, CD90, CD105, and CD166), but not the endothelial and hematopoietic cell markers (CD31, CD34, and CD45), as well as negative for macrophage-specific marker (CD14). B
Transcript of Suppl. Figure 1 A B - Cancer...
Suppl. Figure 1 A
CD31-
CD45-
CD34-
CD14-
CD29+
CD90+
CD73+
CD166 +
CD105 +
Suppl. Fig. 1 Characterization of BM-MSC surface markers. (A) The morphology of bone marrow-derived MSCs was photographed under microscope. (B) Bone marrow-derived MSCs were subjected to flow cytometry analysis to assess the expression of surface markers. The isolated BM-MSCs expressed the BM-MSC-specific markers (CD29, CD73, CD90, CD105, and CD166), but not the endothelial and hematopoietic cell markers (CD31, CD34, and CD45), as well as negative for macrophage-specific marker (CD14).
B
0
20
40
60
80
100
120
140
Control Low CM High CM
% o
f mig
rato
ry c
ells
BM-MSC-2
*
0
20
40
60
80
100
120
140
Control Low CM High CM
% o
f mig
rato
ry c
ells
BM-MSC-3
*
0
20
40
60
80
100
120
Control Low CM High CM
% o
f mig
rato
ry c
ell
EM-MSC-1
* *
0
20
40
60
80
100
120
Control Low CM High CM
% o
f mig
rato
ry c
ell
EM-MSC-2
* *
Suppl. Figure 2
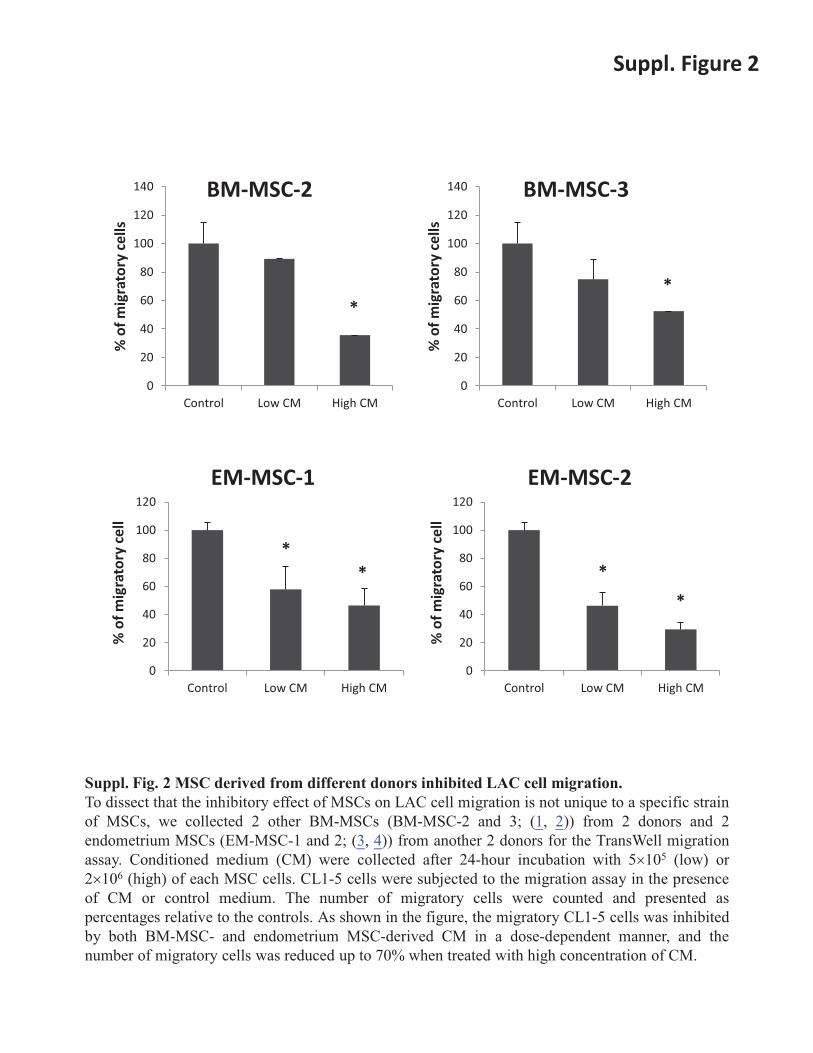
Suppl. Fig. 2 MSC derived from different donors inhibited LAC cell migration. To dissect that the inhibitory effect of MSCs on LAC cell migration is not unique to a specific strain of MSCs, we collected 2 other BM-MSCs (BM-MSC-2 and 3; (1, 2)) from 2 donors and 2 endometrium MSCs (EM-MSC-1 and 2; (3, 4)) from another 2 donors for the TransWell migration assay. Conditioned medium (CM) were collected after 24-hour incubation with 5�105 (low) or 2�106 (high) of each MSC cells. CL1-5 cells were subjected to the migration assay in the presence of CM or control medium. The number of migratory cells were counted and presented as percentages relative to the controls. As shown in the figure, the migratory CL1-5 cells was inhibited by both BM-MSC- and endometrium MSC-derived CM in a dose-dependent manner, and the number of migratory cells was reduced up to 70% when treated with high concentration of CM.
OSM
18S
BM-MSC-1
0
5
10
15
20
25
30
35
18S OSMCt
qPCR of BM-MSC-1
ELISA
0
2
4
6
8
10
12
14
OSM
con
cent
ratio
n (p
g/m
l)
Suppl. Figure 3
A B
C
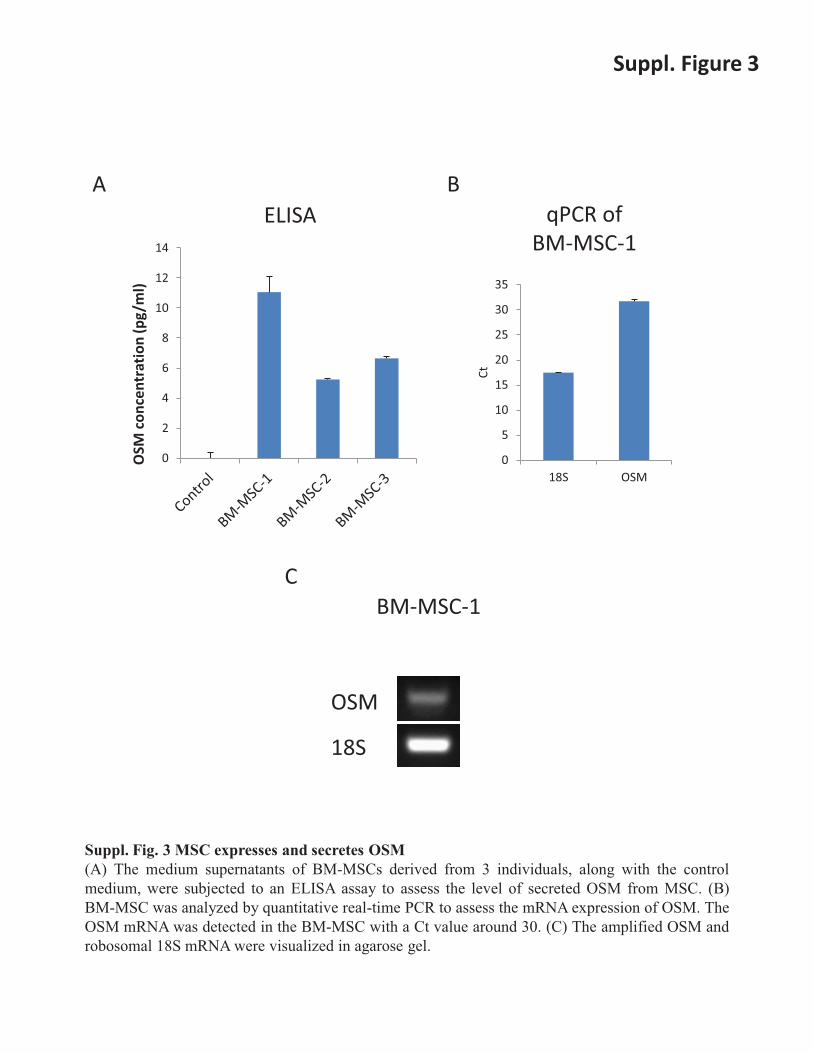
Suppl. Fig. 3 MSC expresses and secretes OSM (A) The medium supernatants of BM-MSCs derived from 3 individuals, along with the control medium, were subjected to an ELISA assay to assess the level of secreted OSM from MSC. (B) BM-MSC was analyzed by quantitative real-time PCR to assess the mRNA expression of OSM. The OSM mRNA was detected in the BM-MSC with a Ct value around 30. (C) The amplified OSM and robosomal 18S mRNA were visualized in agarose gel.
Suppl. Figure 4
0
5
10
15
20
25
30
35
0 2.5 5 10 20
Prol
ifera
tive
chan
ge (F
old)
OSM (ng/ml)
CL1-5 24 h
72 h
0
5
10
15
20
25
30
35
0 2.5 5 10 20
Prol
ifera
tive
chan
ge (F
old)
OSM (ng/ml)
A549 24 h
72 h
* *
*
*
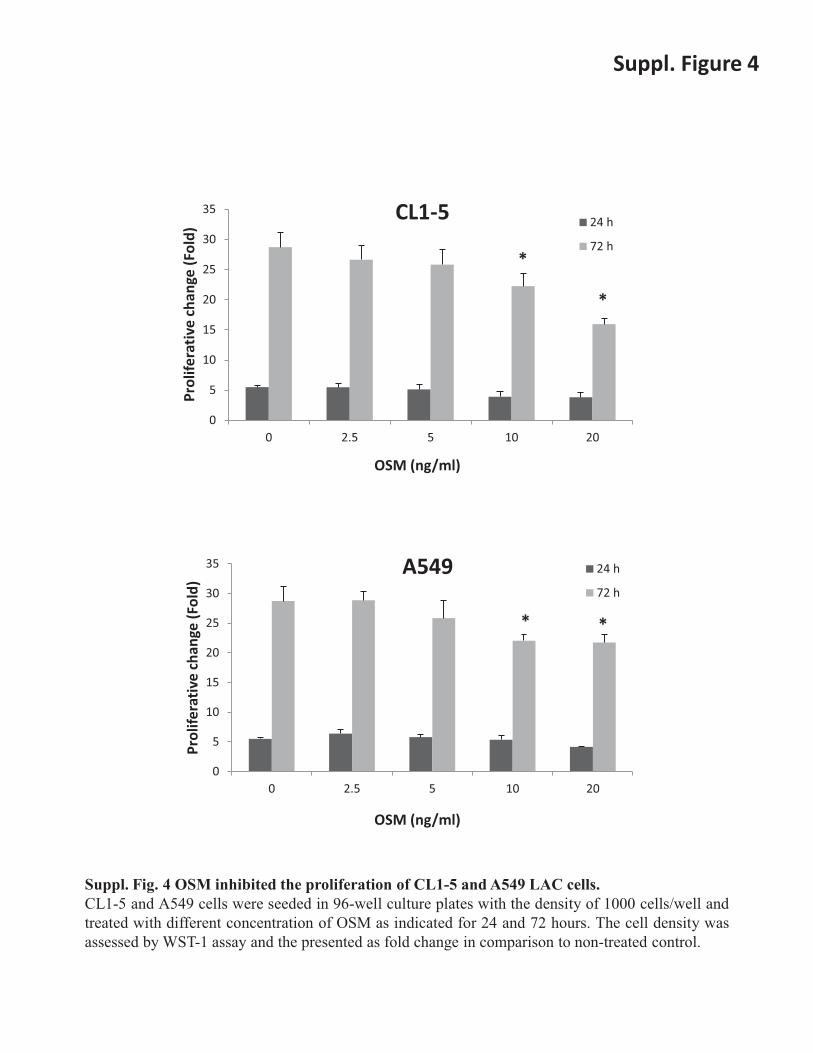
Suppl. Fig. 4 OSM inhibited the proliferation of CL1-5 and A549 LAC cells. CL1-5 and A549 cells were seeded in 96-well culture plates with the density of 1000 cells/well and treated with different concentration of OSM as indicated for 24 and 72 hours. The cell density was assessed by WST-1 assay and the presented as fold change in comparison to non-treated control.
0
20
40
60
80
100
120
140
0 5 20
% o
f mig
rato
ry c
ell
OSM (ng/ml)
H2170
0
20
40
60
80
100
120
140
0 5 20
% o
f mig
rato
ry c
ell
OSM (ng/ml)
H520
* *
*
Suppl. Figure 5
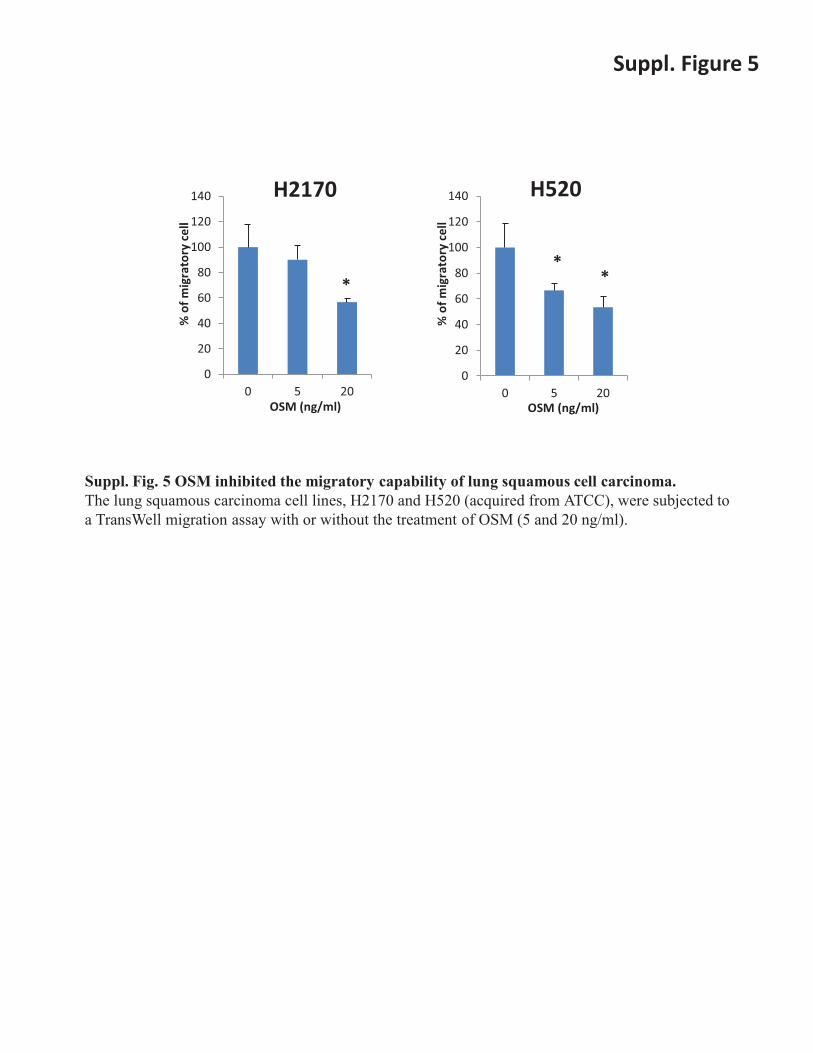
Suppl. Fig. 5 OSM inhibited the migratory capability of lung squamous cell carcinoma. The lung squamous carcinoma cell lines, H2170 and H520 (acquired from ATCC), were subjected to a TransWell migration assay with or without the treatment of OSM (5 and 20 ng/ml).
Suppl. Figure 6
Migration assay
pSTAT1(y701) Short exposure
STAT1
pSTAT1(y701) Long exposure
�TUBULIN
shSC
shST
AT1-
1
shST
AT1-
2
shSC
shST
AT1-
1
shST
AT1-
2
Control OSM 20 ng/ml
0.5 hr
STAT3
NANOG
SNAIL
SLUG
�TUBULIN
shSC
shST
AT3-
1
shST
AT3-
2
shSC
shST
AT3-
1
shST
AT3-
2
Control OSM 20 ng/ml
24 hr
A B
C
0
50
100
150
200
250
300
% o
f mig
rato
ry c
ells
A549
CL1-5
*
*
*
*
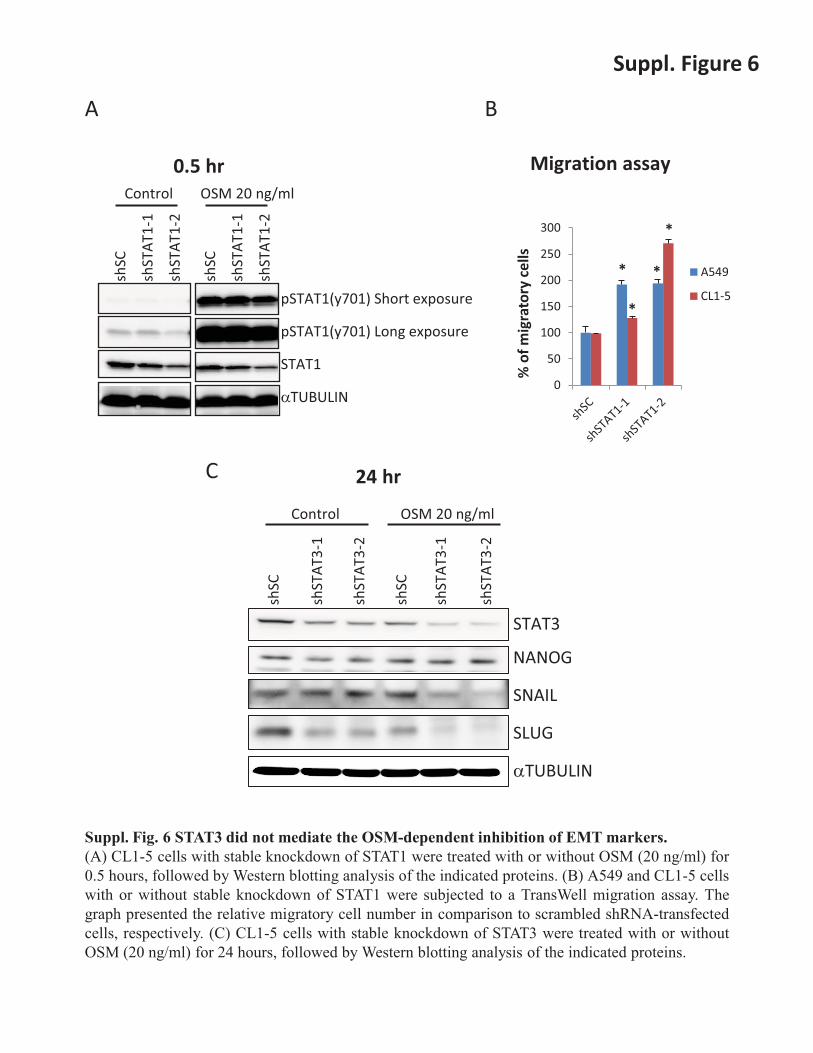
Suppl. Fig. 6 STAT3 did not mediate the OSM-dependent inhibition of EMT markers. (A) CL1-5 cells with stable knockdown of STAT1 were treated with or without OSM (20 ng/ml) for 0.5 hours, followed by Western blotting analysis of the indicated proteins. (B) A549 and CL1-5 cells with or without stable knockdown of STAT1 were subjected to a TransWell migration assay. The graph presented the relative migratory cell number in comparison to scrambled shRNA-transfected cells, respectively. (C) CL1-5 cells with stable knockdown of STAT3 were treated with or without OSM (20 ng/ml) for 24 hours, followed by Western blotting analysis of the indicated proteins.
0
0.2
0.4
0.6
0.8
1.0
Rela
tive
Ratio
of
Slug
mRN
A
0
1
2
3
4
5
Rela
tive
Ratio
of
E-ca
dher
in m
RNA
* *
*
*
*
Suppl. Figure 7
Control
CM
OSM
CM+aOSM
Control
CM
Ki67 Hoechst33258 Merge A B
D
C Control CM OSM CM+aOSM
Vimentin
Hoechst33258
Merge 20 �m 20 �m
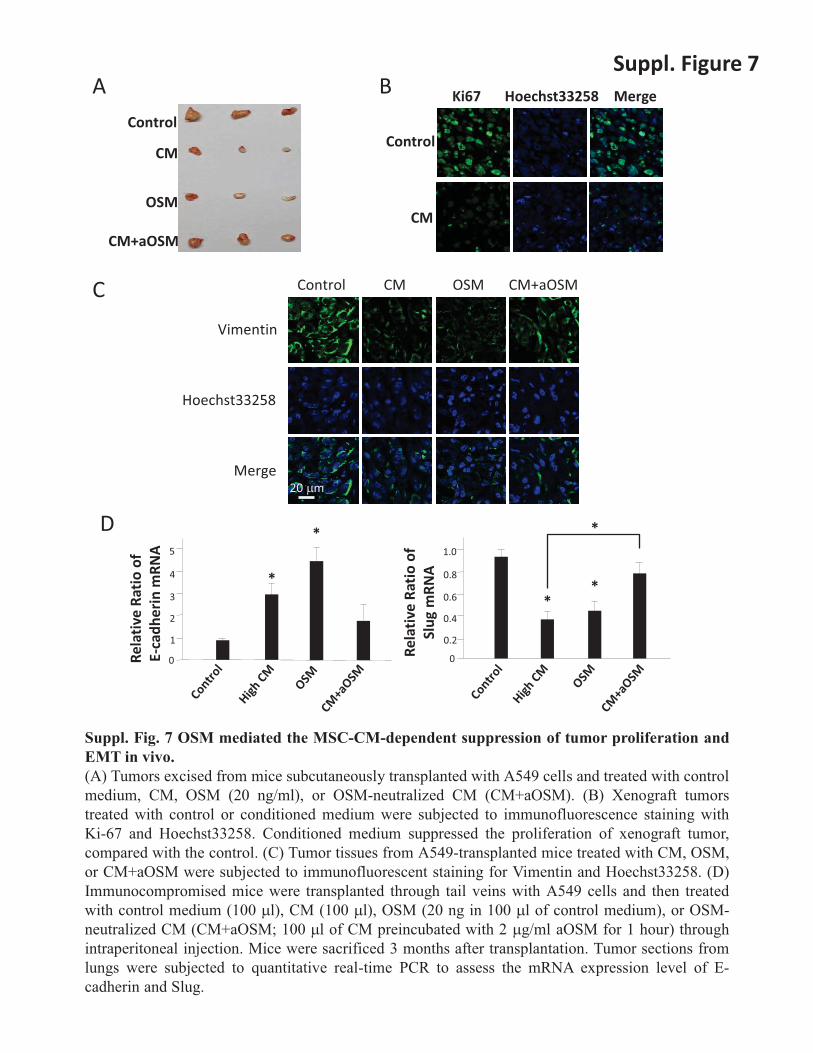
Suppl. Fig. 7 OSM mediated the MSC-CM-dependent suppression of tumor proliferation and EMT in vivo. (A) Tumors excised from mice subcutaneously transplanted with A549 cells and treated with control medium, CM, OSM (20 ng/ml), or OSM-neutralized CM (CM+aOSM). (B) Xenograft tumors treated with control or conditioned medium were subjected to immunofluorescence staining with Ki-67 and Hoechst33258. Conditioned medium suppressed the proliferation of xenograft tumor, compared with the control. (C) Tumor tissues from A549-transplanted mice treated with CM, OSM, or CM+aOSM were subjected to immunofluorescent staining for Vimentin and Hoechst33258. (D) Immunocompromised mice were transplanted through tail veins with A549 cells and then treated with control medium (100 �l), CM (100 �l), OSM (20 ng in 100 �l of control medium), or OSM-neutralized CM (CM+aOSM; 100 �l of CM preincubated with 2 �g/ml aOSM for 1 hour) through intraperitoneal injection. Mice were sacrificed 3 months after transplantation. Tumor sections from lungs were subjected to quantitative real-time PCR to assess the mRNA expression level of E-cadherin and Slug.
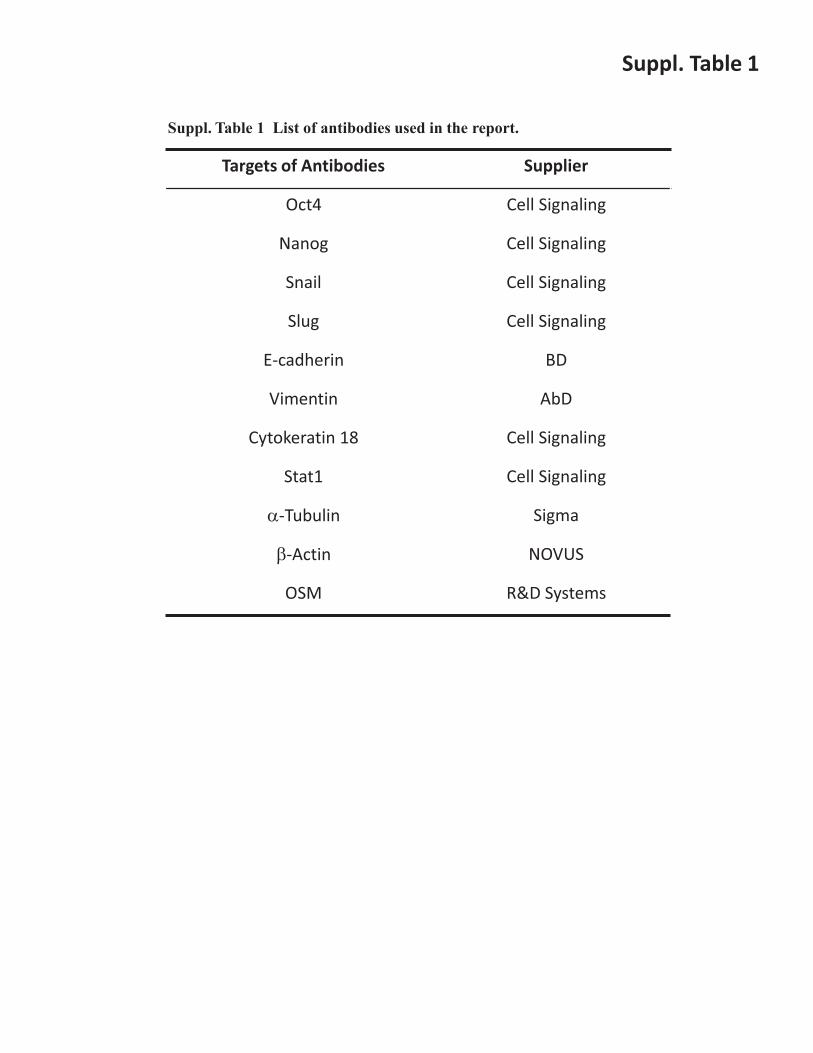
Targets of Antibodies Supplier
Oct4 Cell Signaling
Nanog Cell Signaling
Snail Cell Signaling
Slug Cell Signaling
E-cadherin BD
Vimentin AbD
Cytokeratin 18 Cell Signaling
Stat1 Cell Signaling
�-Tubulin Sigma
�-Actin NOVUS
OSM R&D Systems
Suppl. Table 1
Suppl. Table 1 List of antibodies used in the report.
Supplementary Methods
Isolation, expansion, and characterization of human MSCs
In collaboration with Dr. OK Lee, human bone marrow was obtained from 3 healthy
donors during fracture surgeries. All samples were collected with informed consent.
The MSCs were isolated following a previously reported protocol (1, 2, 5, 6) which
had been approved by the Institutional Review Board at the Taipei Veteran General
Hospital. Briefly, after negative immune-selection and limiting dilution from the
mononuclear fraction of the bone marrow aspirates, colonies obtained from signle
cells were cultured and expanded in T75 flasks with MesenPRO RS medium
(Invitrogen, Carlsbad, CA, USA). Cells were sub-cultured at the dilution of 1:3 when
reaching 60 - 70% confluence. The surface immune phenotype and multi-potency of
MSCs were confirmed as previously described (1, 2, 5, 6) prior to the commencement
of this study. The isolated BM-MSCs were maintained and applied to the experiments
for up to 12 passages of subculture. The endometrium MSCs were obtained from Dr.
SH Chiou with collaboration (3). In brief, the endometrial cells were obtained using
enzymatic digestion and by mechanical means. Single cells were separated from the
debris by a 40-�m sieve (Becton Dickinson, Franklin Lakes, NJ). MSCs were then
obtained by negative immune-selection and characterized as previous reported (3).
Immunoblotting assay
Total cell lysate extraction and immunoblotting analysis were performed as described
(7). Aliquot protein sample was boiled at 95°C for 5 min and separated on 10%
SDS-PAGE. The proteins were transferred to PVDF membrane (Pall.). Primary and
secondary antibodies were added as indicated. Reactive protein bands were detected
by the ECL detection system (Millipore). Used antibodies are listed in Supplemental
Table 1.
Flow cytometry analysis
To assess cell surface marker expression, MSCs were detached, washed, resuspended
in 100 �l PBS, and stained with fluorescein-conjugated anti-CD29, CD37, CD90,
CD105, CD166, CD14, CD31, CD34, CD45 antibodies (Biolegend) individually.
Cells were analyzed with a BD FACS Calibur apparatus (BD Biosciences).
shRNA
RNAi reagents were obtained from the National RNAi Core Facility located at the
Institute of Molecular Biology / Genomic Research Center, Academia Sinica,
supported by the National Core Facility Program for Biotechnology Grants of NSC
(NSC 100-2319-B-001-002). The target sequence of shSTAT1-1 (ID:
TRCN0000004267) and shSTAT1-2 (ID: TRCN0000280021) are
CTGGAAGATTTACAAGATGAA and CTGGAAGATTTACAAGATGAA,
respectively.
References
1. Lee KD, Kuo TK, Whang-Peng J, Chung YF, Lin CT, Chou SH, et al. In vitro
hepatic differentiation of human mesenchymal stem cells. Hepatology.
2004;40:1275-84.
2. Ho JH, Tseng TC, Ma WH, Ong WK, Chen YF, Chen MH, et al. Multiple
intravenous transplantations of mesenchymal stem cells effectively restore
long-term blood glucose homeostasis by hepatic engraftment and beta cell
differentiation in streptozosin-induced diabetic mice. Cell transplantation. 2011.
3. Chen YJ, Li HY, Chang YL, Yuan CC, Tai LK, Lu KH, et al. Suppression of
migratory/invasive ability and induction of apoptosis in adenomyosis-derived
mesenchymal stem cells by cyclooxygenase-2 inhibitors. Fertility and sterility.
2010;94:1972-9, 9 e1-4.
4. Huang TS, Hsieh JY, Wu YH, Jen CH, Tsuang YH, Chiou SH, et al. Functional
network reconstruction reveals somatic stemness genetic maps and
dedifferentiation-like transcriptome reprogramming induced by GATA2. Stem
Cells. 2008;26:1186-201.
5. Lee OK, Ko YC, Kuo TK, Chou SH, Li HJ, Chen WM, et al. Fluvastatin and
lovastatin but not pravastatin induce neuroglial differentiation in human
mesenchymal stem cells. Journal of cellular biochemistry. 2004;93:917-28.
6. Shih YR, Tseng KF, Lai HY, Lin CH, Lee OK. Matrix stiffness regulation of
integrin-mediated mechanotransduction during osteogenic differentiation of human
mesenchymal stem cells. Journal of bone and mineral research : the official journal
of the American Society for Bone and Mineral Research. 2011;26:730-8.
7. Kao CL, Huang PI, Tsai PH, Tsai ML, Lo JF, Lee YY, et al. Resveratrol-induced
apoptosis and increased radiosensitivity in CD133-positive cells derived from

atypical teratoid/rhabdoid tumor. Int J Radiat Oncol Biol Phys. 2009;74:219-28.