Sunspots - Schools' Observatory
30
Sunspots
Transcript of Sunspots - Schools' Observatory
Sunspots
The Project
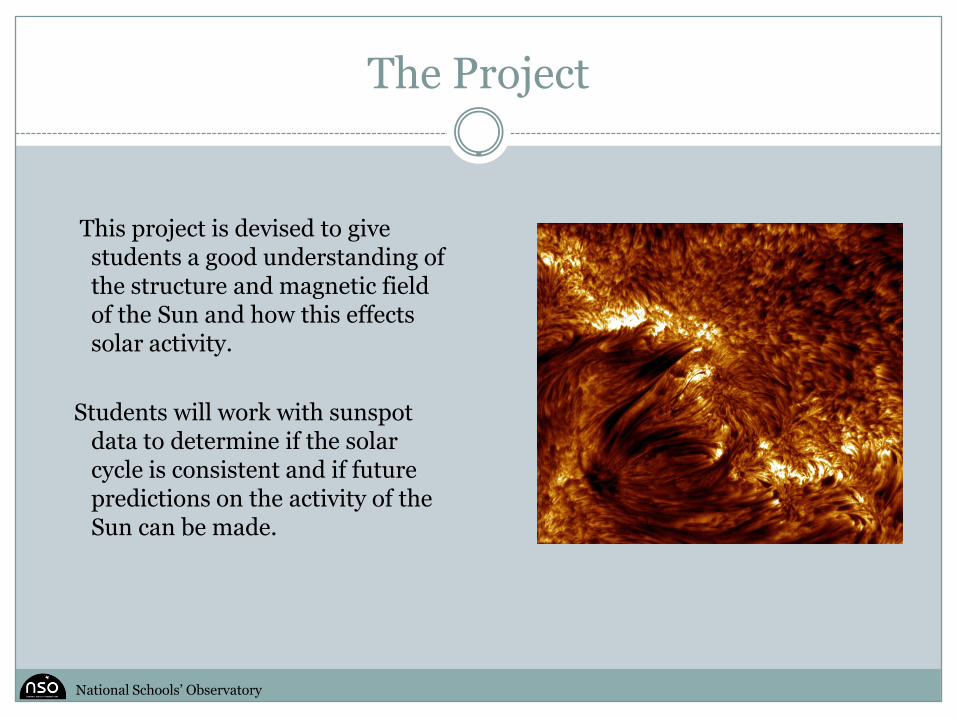
This project is devised to give students a good understanding of the structure and magnetic field of the Sun and how this effects solar activity.
Students will work with sunspot data to determine if the solar cycle is consistent and if future predictions on the activity of the Sun can be made.
National Schools’ Observatory
Theory Presentation
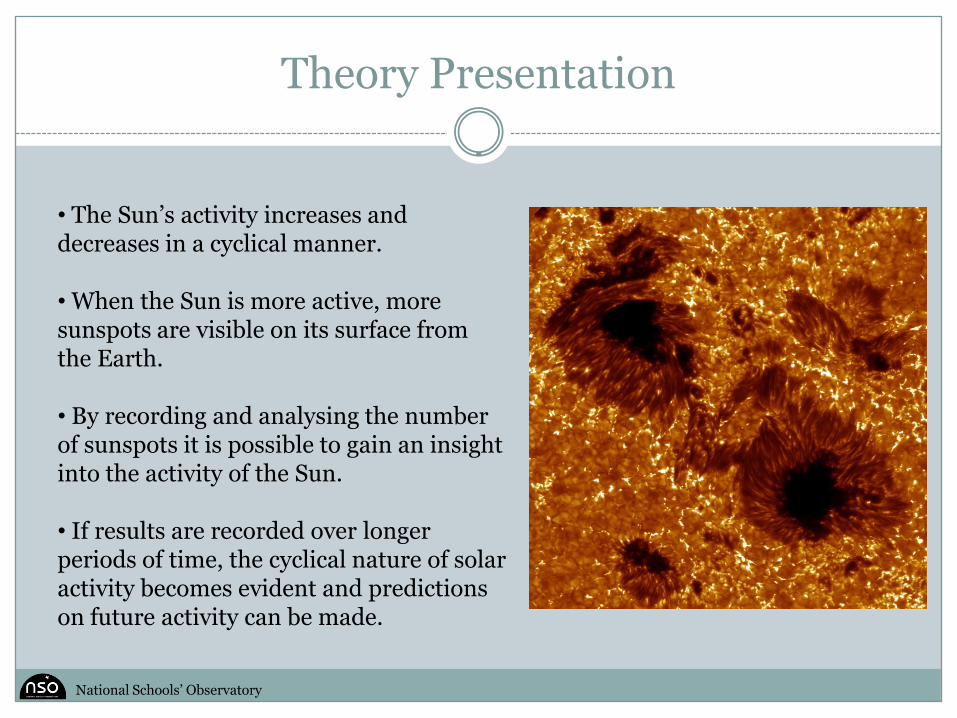
• The Sun’s activity increases and decreases in a cyclical manner.
• When the Sun is more active, more sunspots are visible on its surface from the Earth.
• By recording and analysing the number of sunspots it is possible to gain an insight into the activity of the Sun.
• If results are recorded over longer periods of time, the cyclical nature of solar activity becomes evident and predictions on future activity can be made.
National Schools’ Observatory
Alternative Theory Presentation
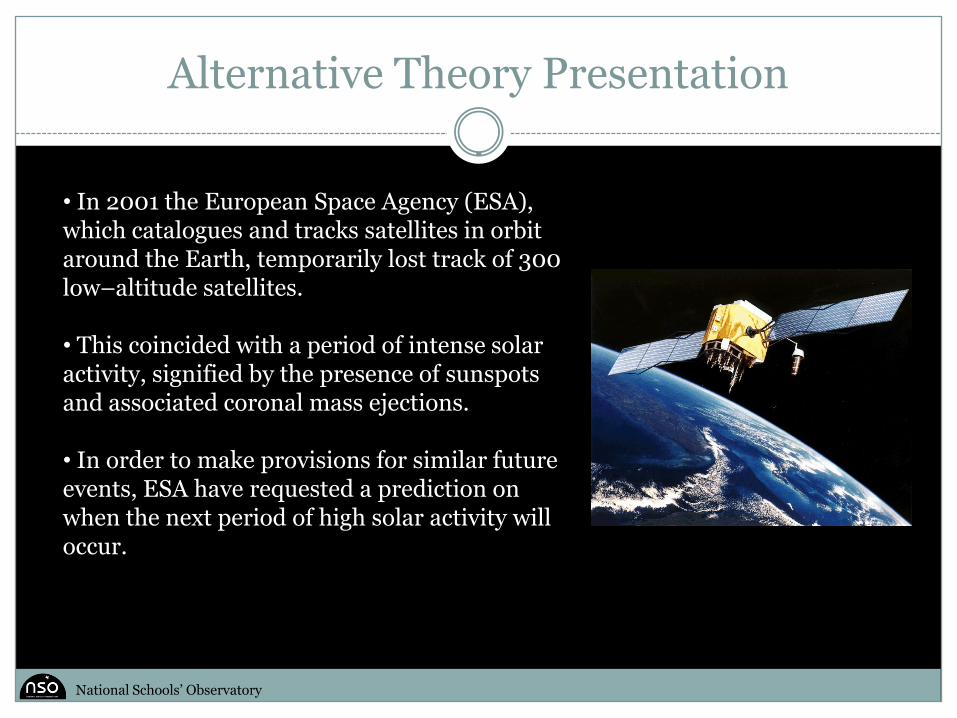
• In 2001 the European Space Agency (ESA), which catalogues and tracks satellites in orbit around the Earth, temporarily lost track of 300 low–altitude satellites.
• This coincided with a period of intense solar activity, signified by the presence of sunspots and associated coronal mass ejections.
• In order to make provisions for similar future events, ESA have requested a prediction on when the next period of high solar activity will occur.
National Schools’ Observatory
Sunspots - Discussion
The following can be used to present the theory of sunspot creation, beginning with the structure of the Sun and then the concept of a changing magnetic field.
The included data sets were acquired from http://sidc.oma.be/ and have a daily sunspot number count over varying periods of time.
By analysing the number of sunspots, initially over a small period of time and then onto longer periods of time the cyclical pattern of solar activity becomes clear.
Stimulus for discussion on the need for repeats (differing results from randomly chosen small data sets) and errors (difficulty in choosing a peak from noisy data) may arise from the included data sets.
National Schools’ Observatory
The Sun
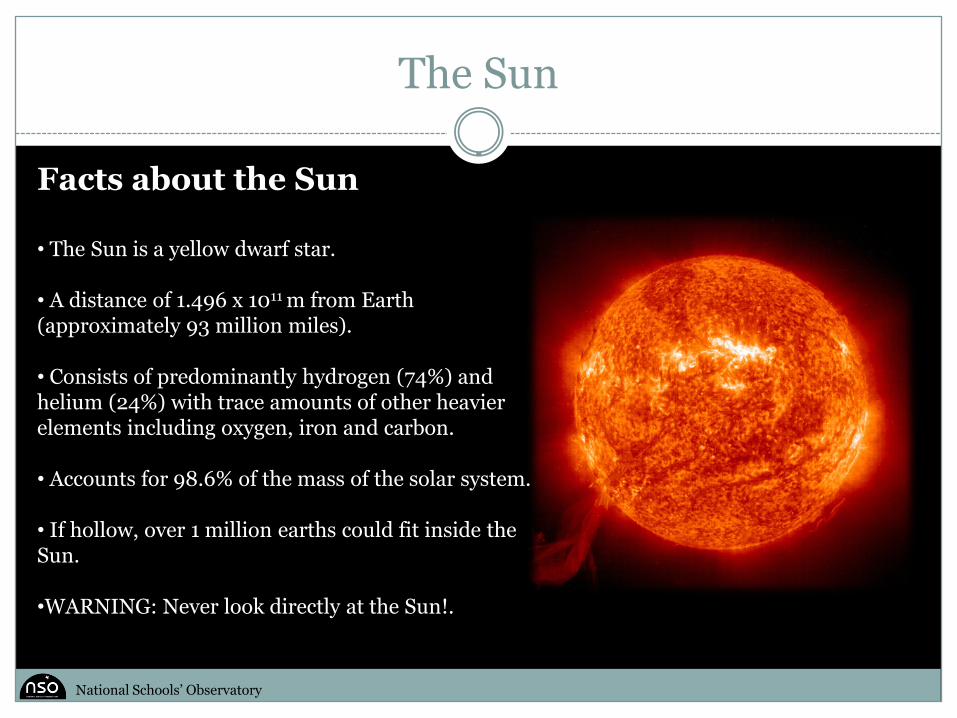
Facts about the Sun
• The Sun is a yellow dwarf star.
• A distance of 1.496 x 10¹¹ m from Earth (approximately 93 million miles).
• Consists of predominantly hydrogen (74%) and helium (24%) with trace amounts of other heavier elements including oxygen, iron and carbon.
• Accounts for 98.6% of the mass of the solar system.
• If hollow, over 1 million earths could fit inside the Sun.
•WARNING: Never look directly at the Sun!.
National Schools’ Observatory
Solar Structure
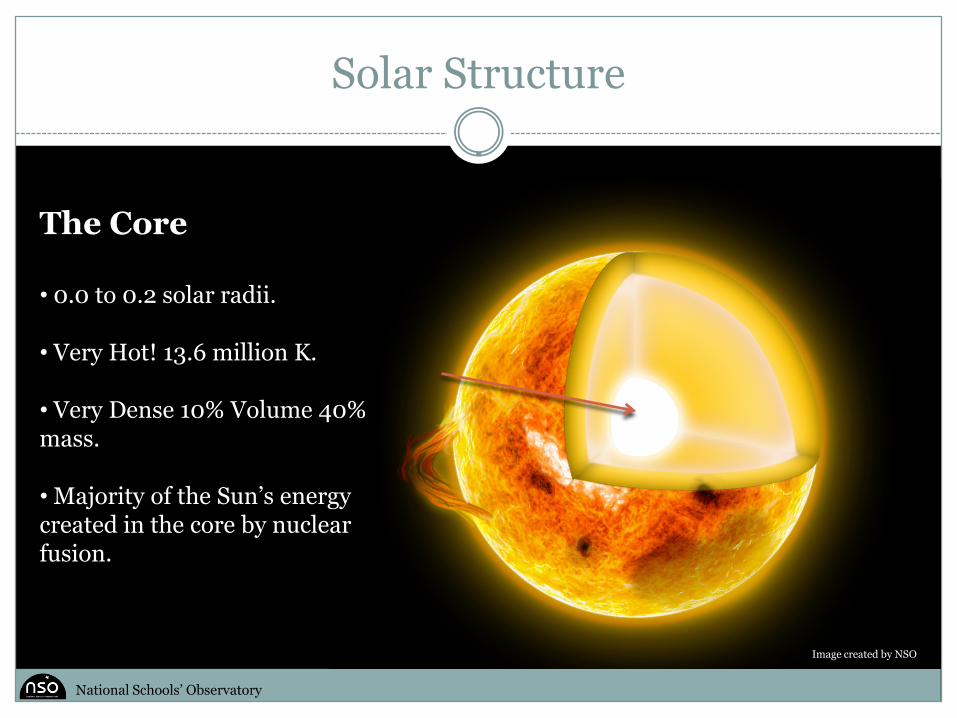
The Core
• 0.0 to 0.2 solar radii.
• Very Hot! 13.6 million K.
• Very Dense 10% Volume 40% mass.
• Majority of the Sun’s energy created in the core by nuclear fusion.
National Schools’ Observatory
Image created by NSO
Solar Structure
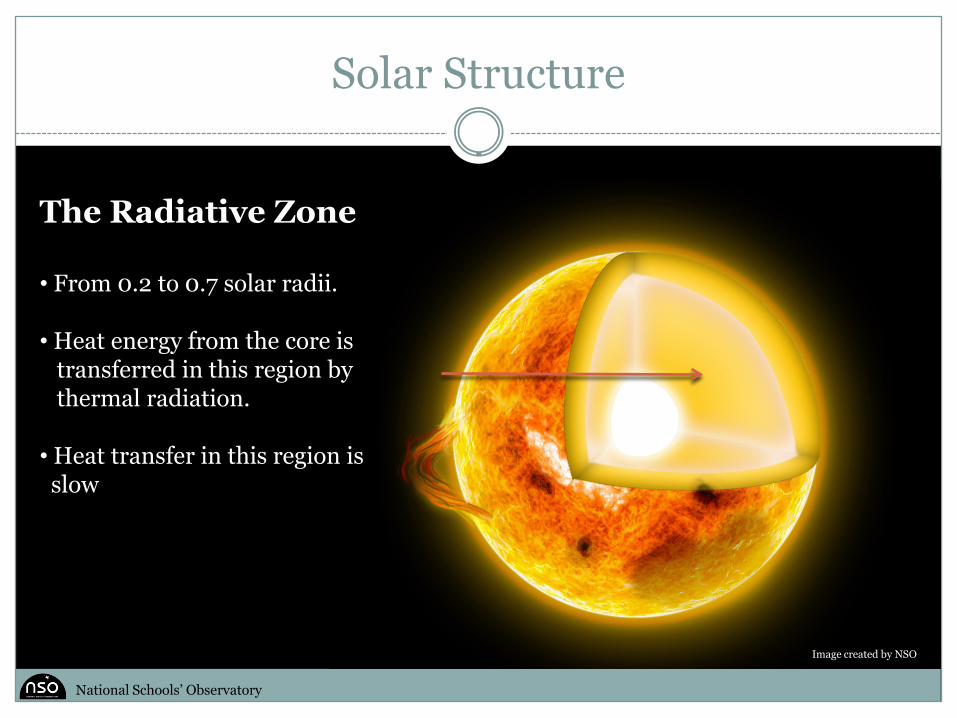
The Radiative Zone
• From 0.2 to 0.7 solar radii.
• Heat energy from the core is transferred in this region bythermal radiation.
• Heat transfer in this region is slow
National Schools’ Observatory
Image created by NSO
Solar Structure
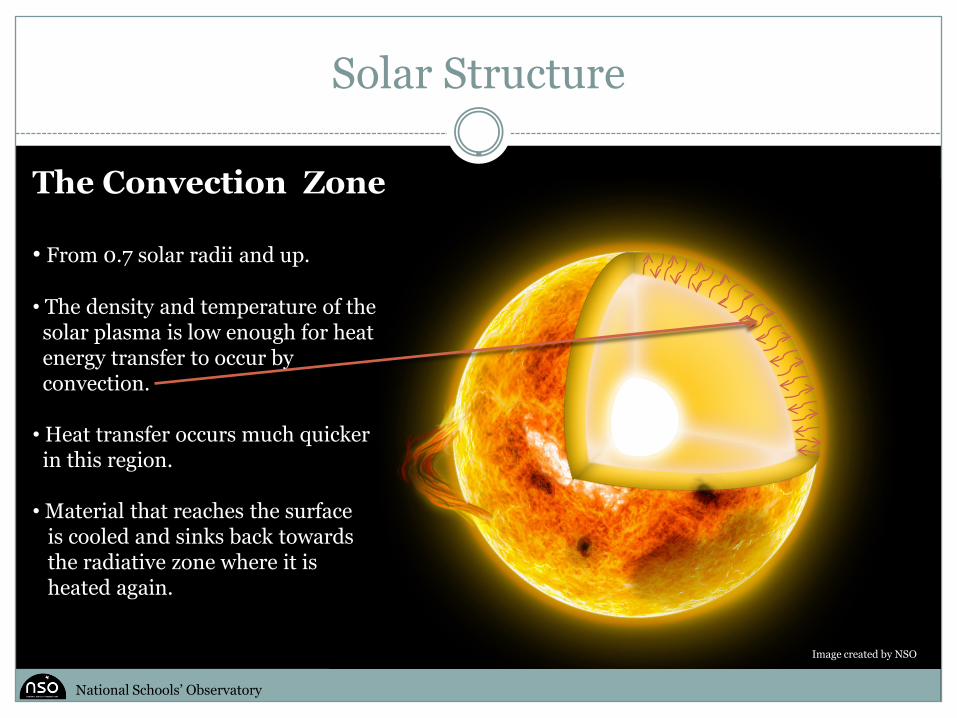
The Convection Zone
• From 0.7 solar radii and up.
• The density and temperature of the solar plasma is low enough for heatenergy transfer to occur by convection.
• Heat transfer occurs much quicker in this region.
• Material that reaches the surfaceis cooled and sinks back towards the radiative zone where it is heated again.
National Schools’ Observatory
Image created by NSO
Solar Atmosphere
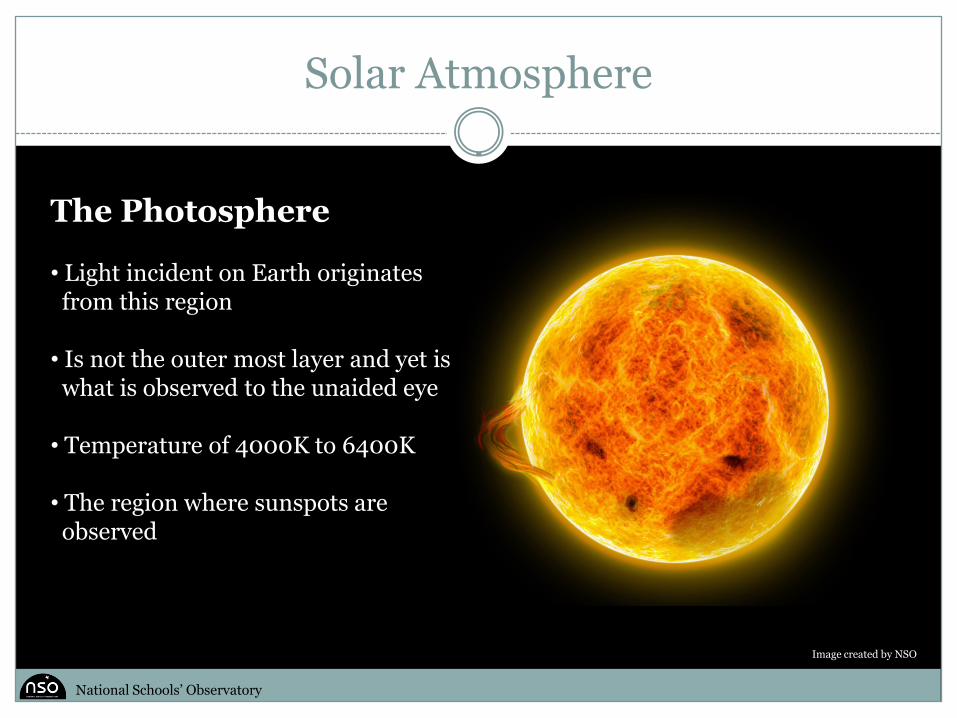
The Photosphere
• Light incident on Earth originates from this region
• Is not the outer most layer and yet is what is observed to the unaided eye
• Temperature of 4000K to 6400K
• The region where sunspots areobserved
National Schools’ Observatory
Image created by NSO
Solar Atmosphere
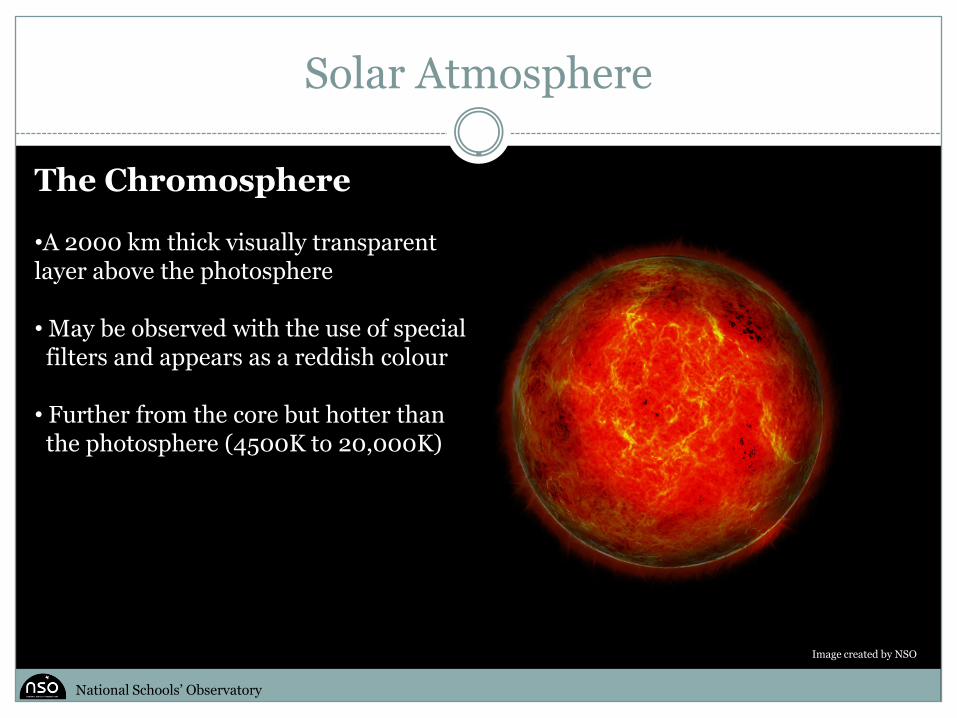
The Chromosphere
•A 2000 km thick visually transparent layer above the photosphere
• May be observed with the use of special filters and appears as a reddish colour
• Further from the core but hotter than the photosphere (4500K to 20,000K)
National Schools’ Observatory
Image created by NSO
Solar Atmosphere
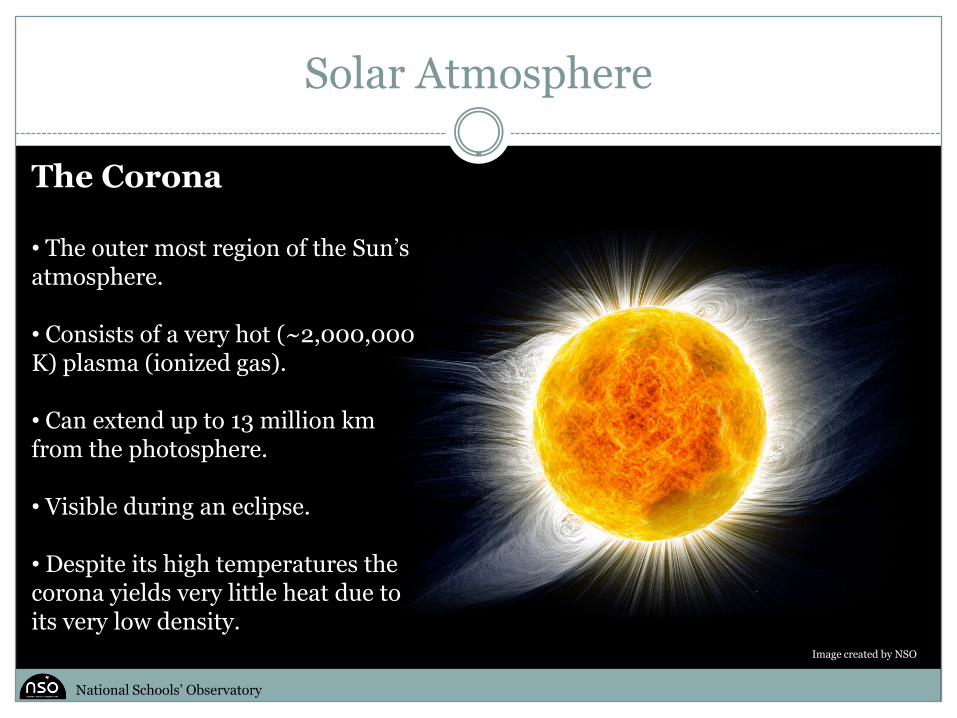
The Corona
• The outer most region of the Sun’s atmosphere.
• Consists of a very hot (~2,000,000 K) plasma (ionized gas).
• Can extend up to 13 million km from the photosphere.
• Visible during an eclipse.
• Despite its high temperatures the corona yields very little heat due to its very low density.
National Schools’ Observatory
Image created by NSO
Surface Features
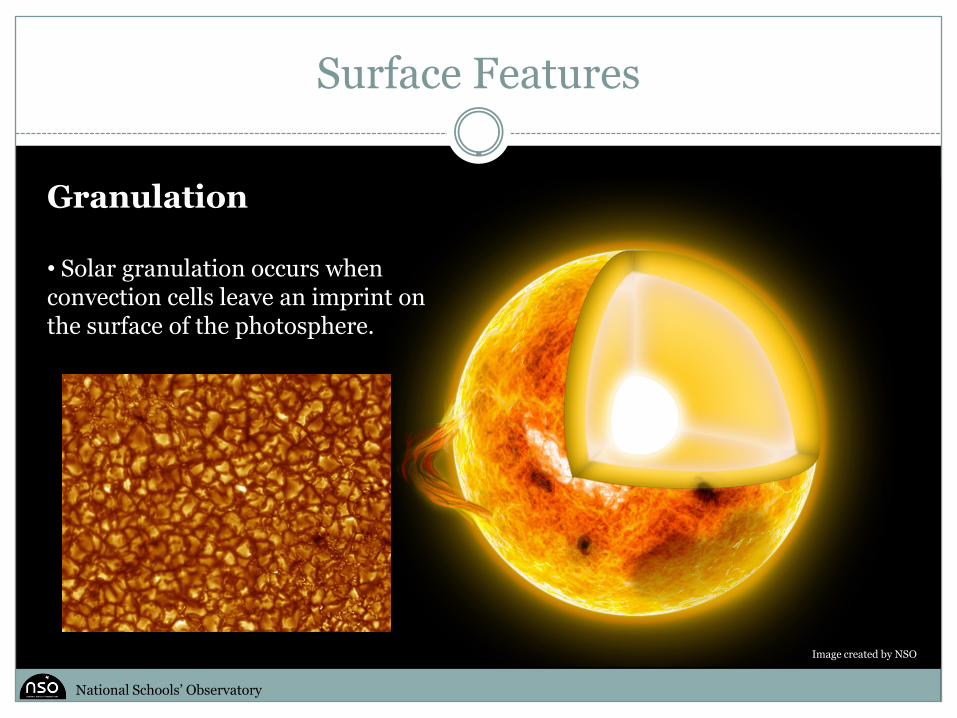
Granulation
• Solar granulation occurs when convection cells leave an imprint on the surface of the photosphere.
National Schools’ Observatory
Image created by NSO
Surface Features
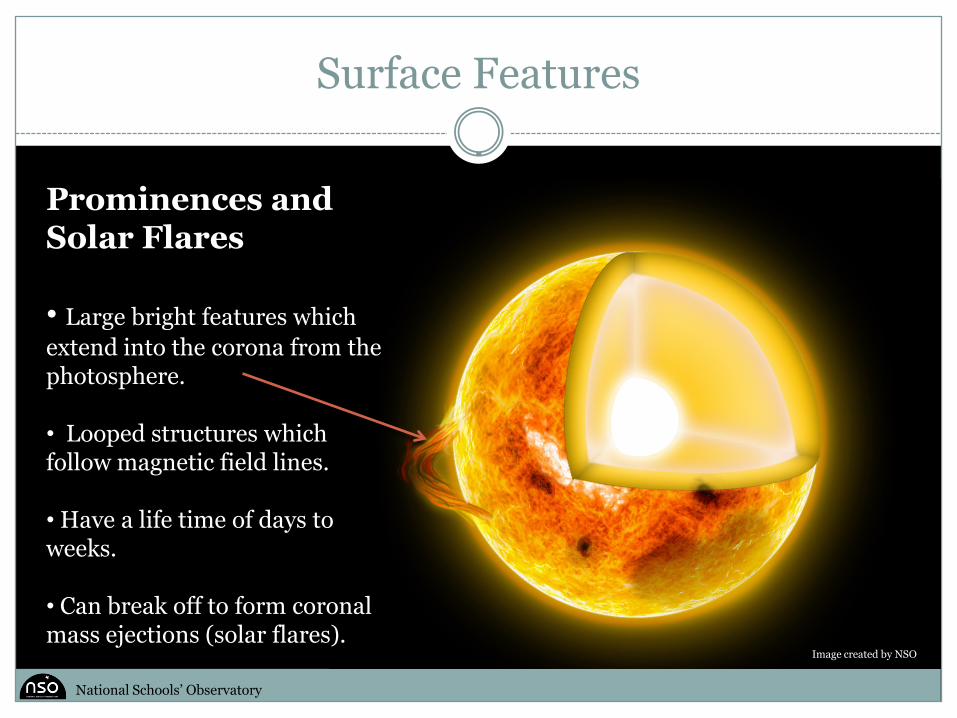
Prominences and Solar Flares
• Large bright features which extend into the corona from the photosphere.
• Looped structures which follow magnetic field lines.
• Have a life time of days to weeks.
• Can break off to form coronal mass ejections (solar flares).
National Schools’ Observatory
Image created by NSO
Surface Features
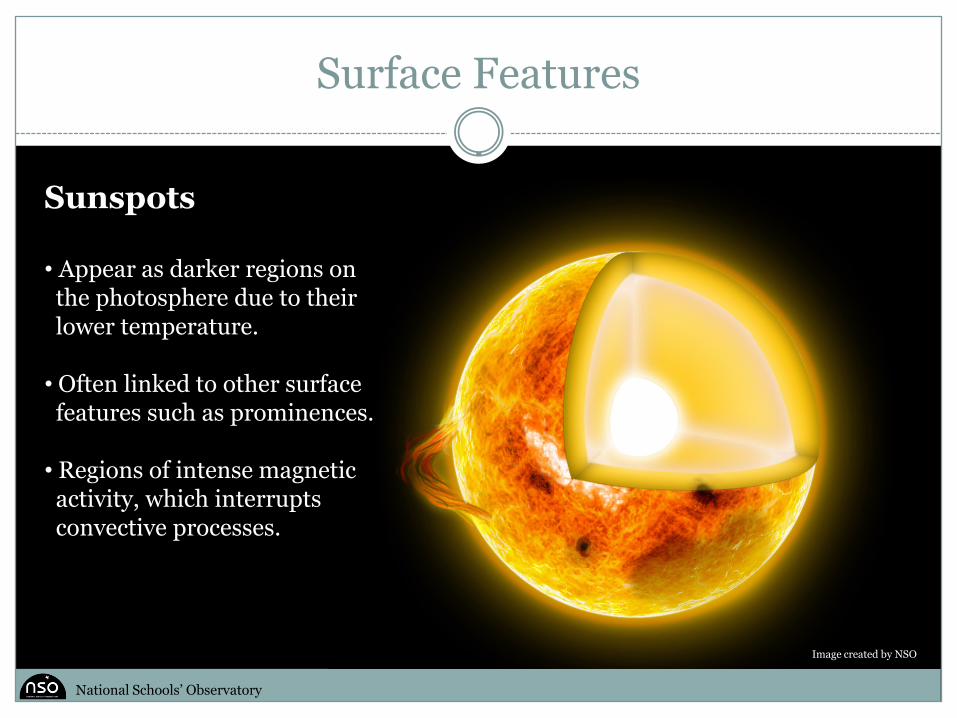
Sunspots
• Appear as darker regions on the photosphere due to their lower temperature.
• Often linked to other surface features such as prominences.
• Regions of intense magnetic activity, which interruptsconvective processes.
National Schools’ Observatory
Image created by NSO
Magnetic Fields
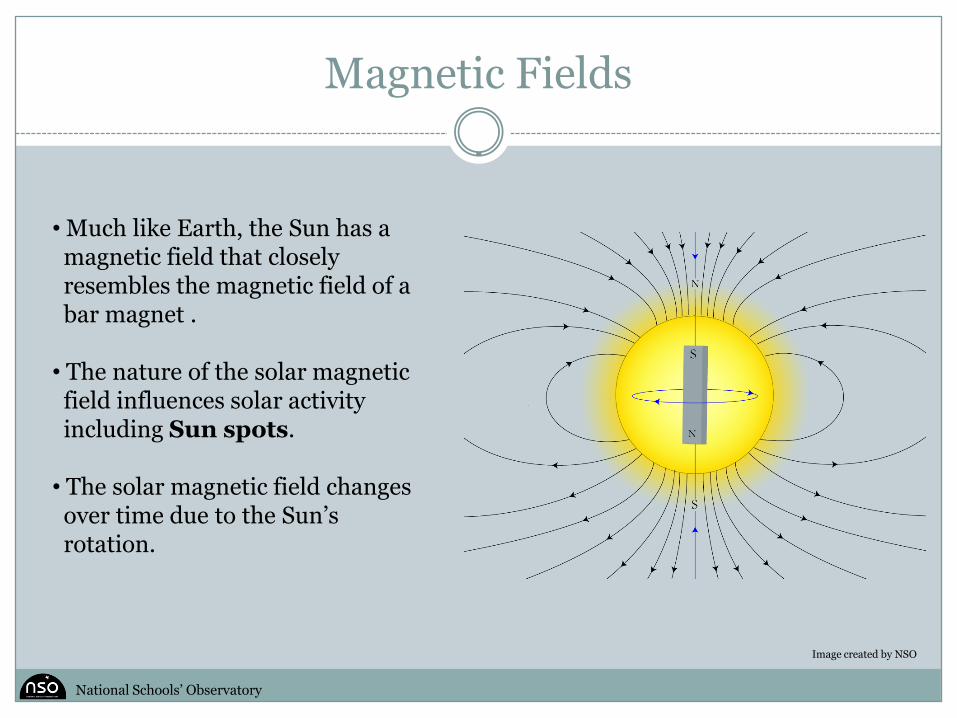
• Much like Earth, the Sun has a magnetic field that closely resembles the magnetic field of a bar magnet .
• The nature of the solar magnetic field influences solar activity including Sun spots.
• The solar magnetic field changes over time due to the Sun’s rotation.
National Schools’ Observatory
Image created by NSO
The Solar Cycle
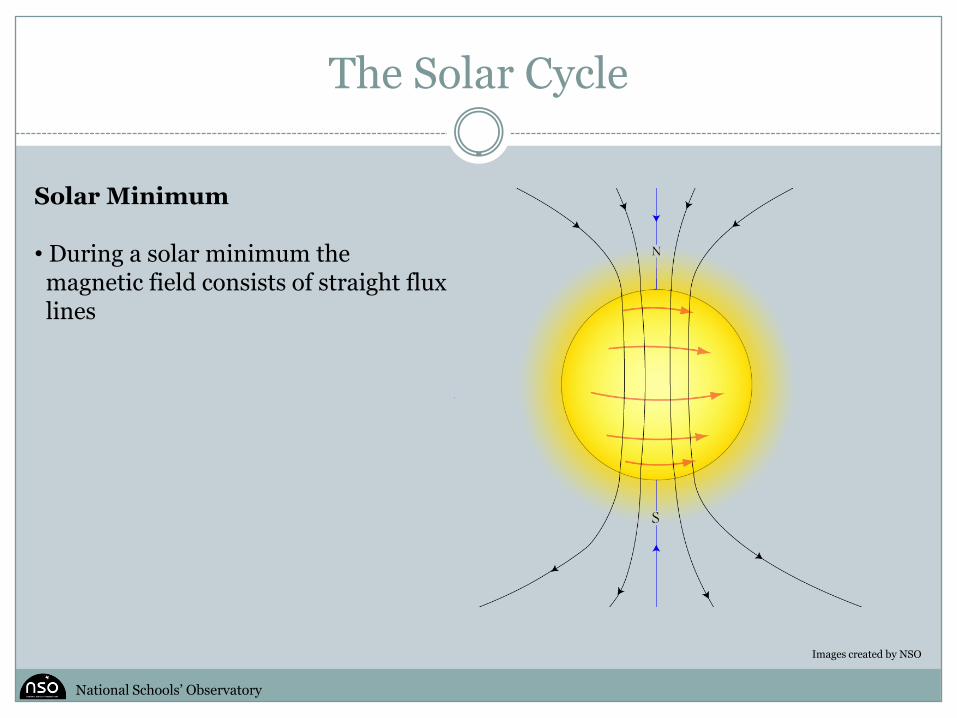
Solar Minimum
• During a solar minimum the magnetic field consists of straight flux lines
National Schools’ Observatory
Images created by NSO
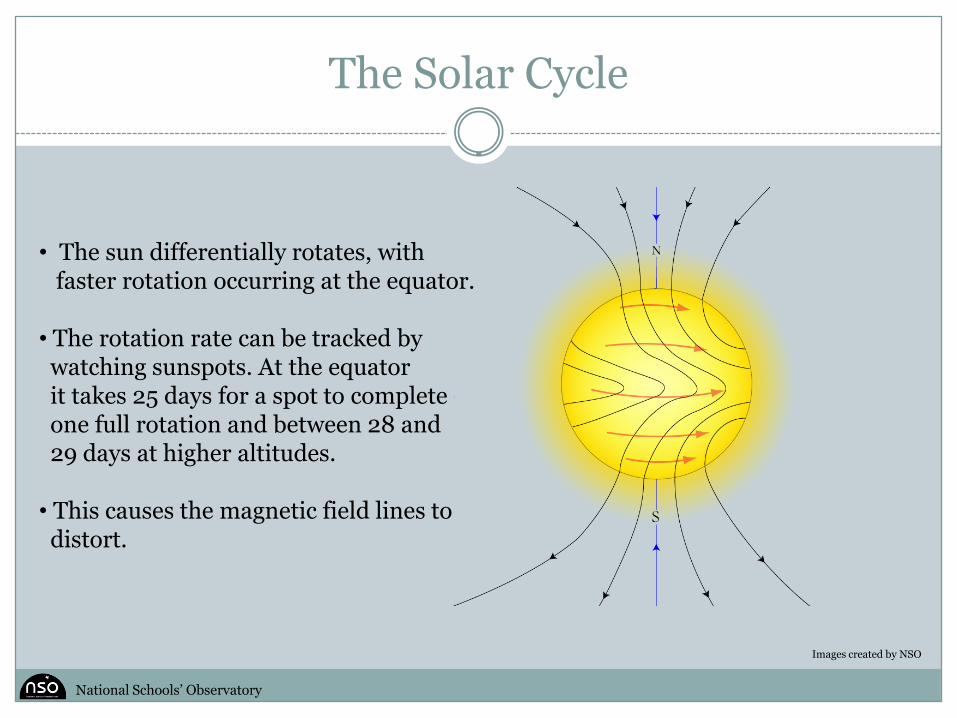
• The sun differentially rotates, with faster rotation occurring at the equator.
• The rotation rate can be tracked by watching sunspots. At the equator it takes 25 days for a spot to complete one full rotation and between 28 and 29 days at higher altitudes.
• This causes the magnetic field lines to distort.
The Solar Cycle
National Schools’ Observatory
Images created by NSO
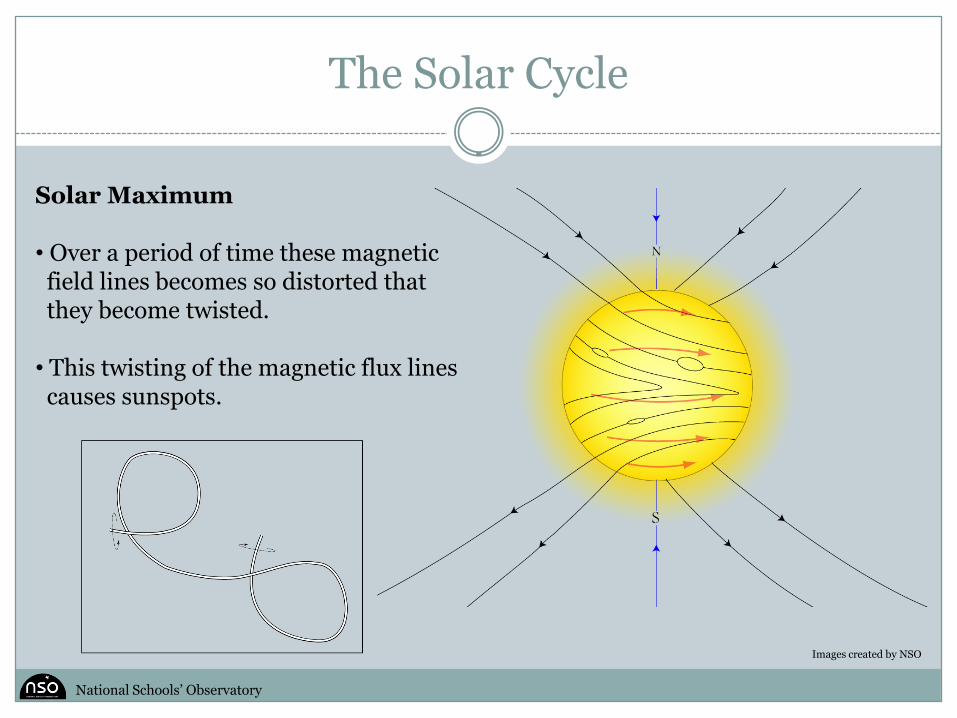
Solar Maximum
• Over a period of time these magnetic field lines becomes so distorted that they become twisted.
• This twisting of the magnetic flux lines causes sunspots.
The Solar Cycle
National Schools’ Observatory
Images created by NSO
The Solar Cycle
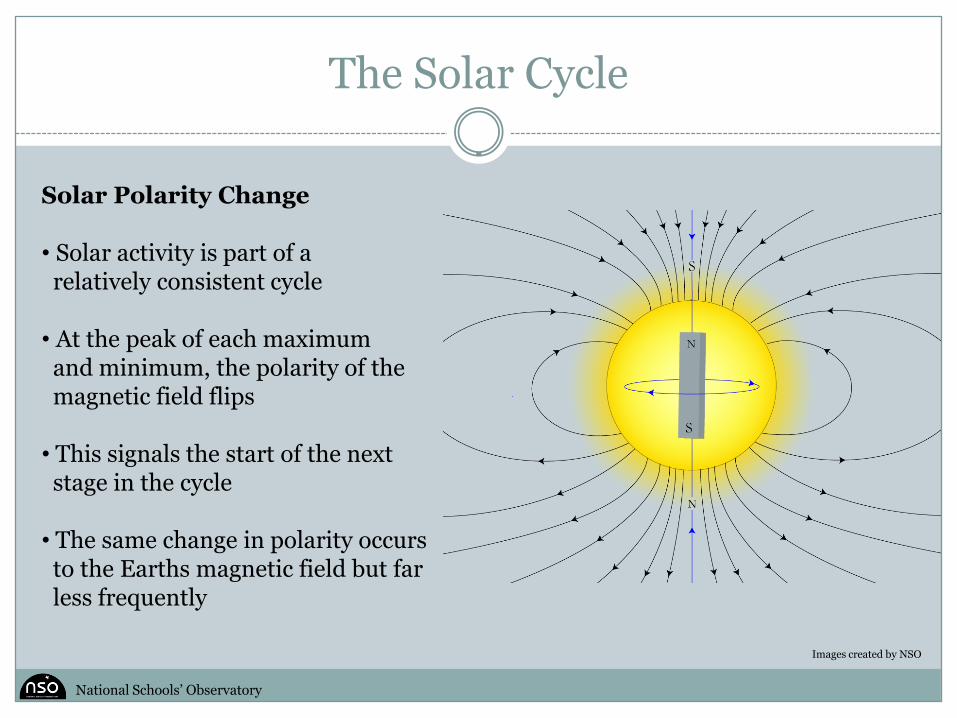
Solar Polarity Change
• Solar activity is part of a relatively consistent cycle
• At the peak of each maximum and minimum, the polarity of the magnetic field flips
• This signals the start of the next stage in the cycle
• The same change in polarity occurs to the Earths magnetic field but far less frequently
National Schools’ Observatory
Images created by NSO
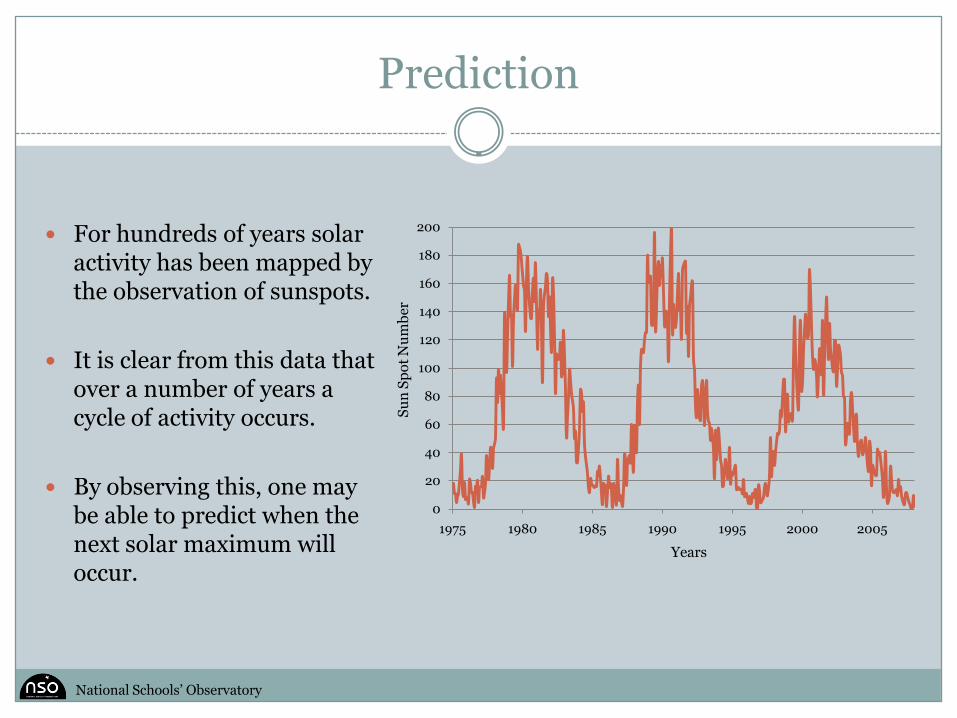
Prediction
For hundreds of years solar activity has been mapped by the observation of sunspots.
It is clear from this data that over a number of years a cycle of activity occurs.
By observing this, one may be able to predict when the next solar maximum will occur.
0
20
40
60
80
100
120
140
160
180
200
1975 1980 1985 1990 1995 2000 2005
National Schools’ Observatory
Su
n S
pot
Nu
mb
er
Years
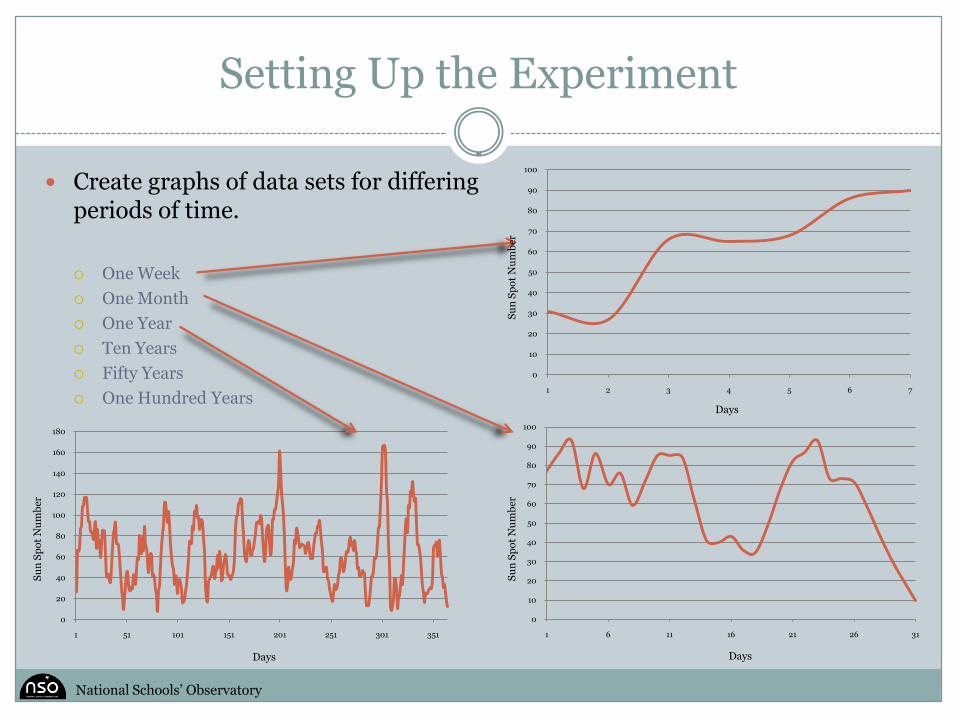
Setting Up the Experiment
Create graphs of data sets for differing periods of time.
One Week
One Month
One Year
Ten Years
Fifty Years
One Hundred Years
0
20
40
60
80
100
120
140
160
180
1 51 101 151 201 251 301 351
0
10
20
30
40
50
60
70
80
90
100
1 6 11 16 21 26 31
0
10
20
30
40
50
60
70
80
90
100
1 2 3 4 5 6 7
Days
Days
Days
Su
n S
pot
Nu
mb
er
Su
n S
pot
Nu
mb
erS
un
Sp
ot N
um
ber
National Schools’ Observatory
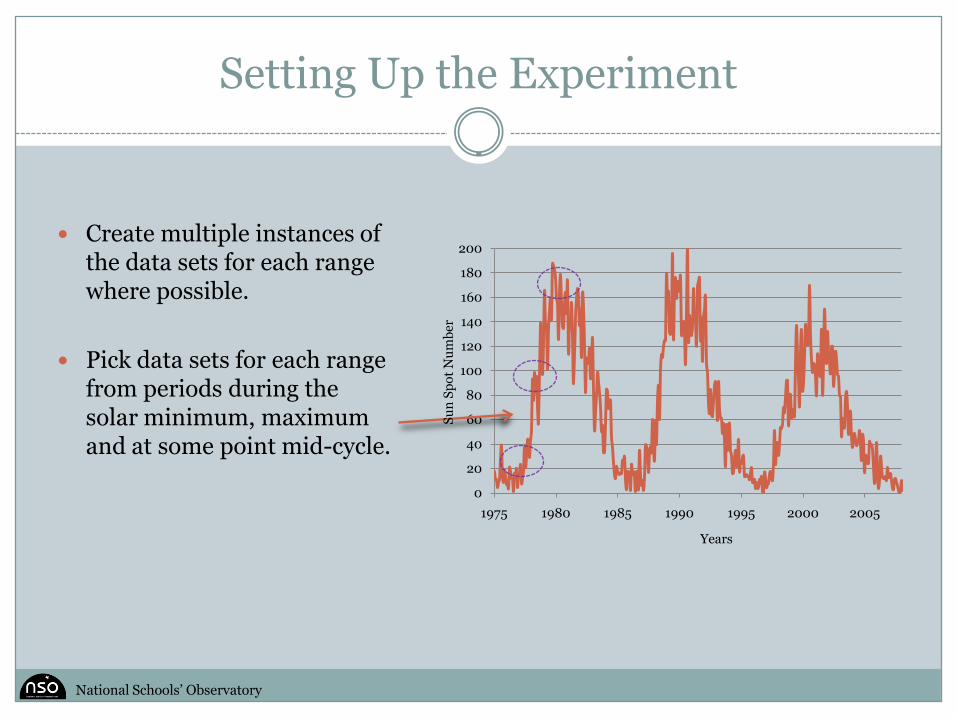
Setting Up the Experiment
Create multiple instances of the data sets for each range where possible.
Pick data sets for each range from periods during the solar minimum, maximum and at some point mid-cycle.
0
20
40
60
80
100
120
140
160
180
200
1975 1980 1985 1990 1995 2000 2005
Su
n S
pot
Nu
mbe
r
Years
National Schools’ Observatory
Measuring and Recording
One Week, One Month and One Year Data
Note the positions of any maxima and minima
Note the positions of any groups of maxima and minima
Take the average number of sun spots for that data set
Fifty Years and One Hundred Years
Ignoring smaller changes note the positions in time where solar activity is at a maximum and a minimum
Try to pinpoint the middle of the each maximum or minimum for a more accurate result
National Schools’ Observatory
Predictions Compared to Results
Can we make predictions on future solar activity on the data sets recorded over the smaller time scales (i.e. one week, one month, one year) ?
Can we make predictions on future solar activity on the data sets recorded over larger time scales (i.e. fifty years, one hundred years) ?
We predicted due to its cyclical nature that future peaks in solar activity could be predicted. Did the prediction turn out to be true?
Using data from the year 2000 and earlier, test the prediction by forecasting when the peak in the early 2000’s occurred and see if they are consistent.
Using the whole data set to predict when the next maximum will occur.
National Schools’ Observatory
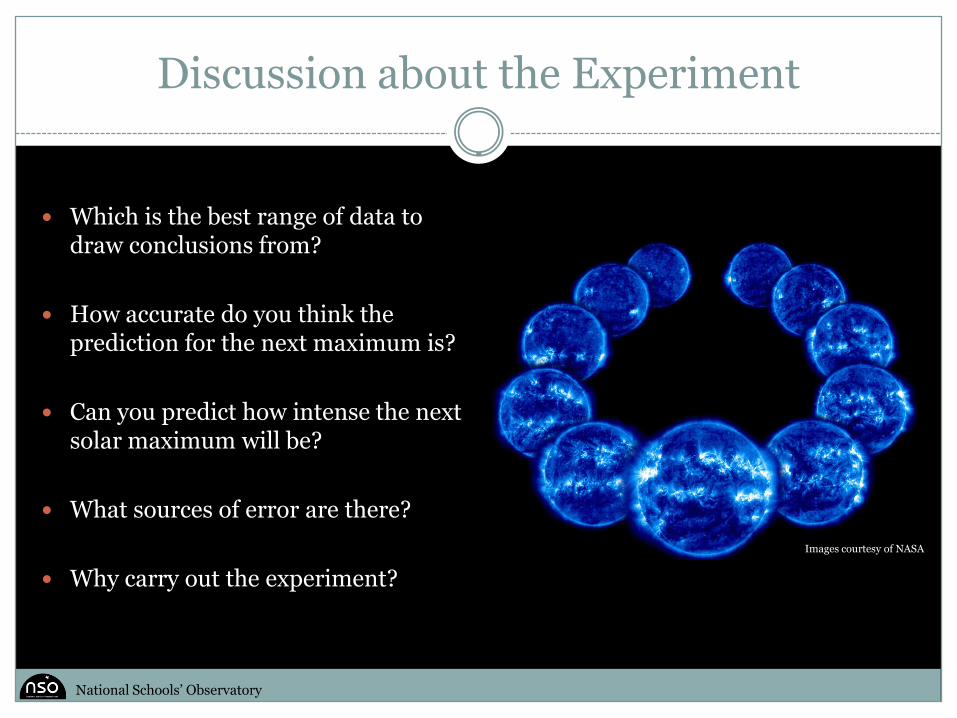
Discussion about the Experiment
Which is the best range of data to draw conclusions from?
How accurate do you think the prediction for the next maximum is?
Can you predict how intense the next solar maximum will be?
What sources of error are there?
Why carry out the experiment?
National Schools’ Observatory
Images courtesy of NASA
Why Carry Out the Experiment?
Investigating solar variability can:
Enable the prediction of space weather.
Help us understand how solar variability can effect the habitability of planets.
Protect technology such as satellites and ground based communications and power systems.
Ensure greater safety for future space exploration.
National Schools’ Observatory
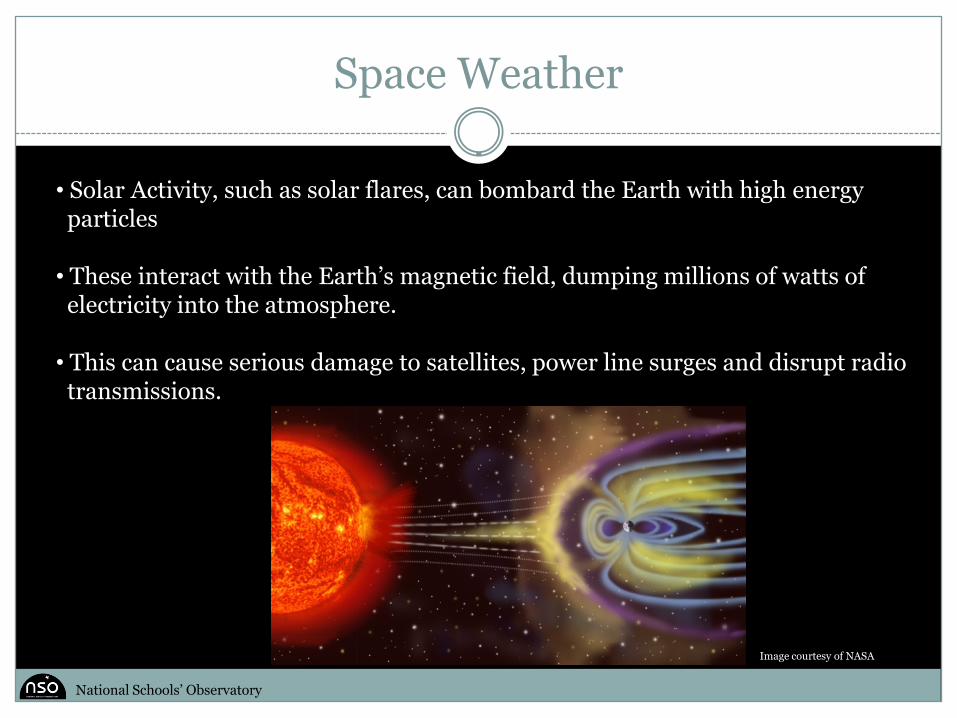
Space Weather
• Solar Activity, such as solar flares, can bombard the Earth with high energy particles
• These interact with the Earth’s magnetic field, dumping millions of watts of electricity into the atmosphere.
• This can cause serious damage to satellites, power line surges and disrupt radio transmissions.
National Schools’ Observatory
Image courtesy of NASA
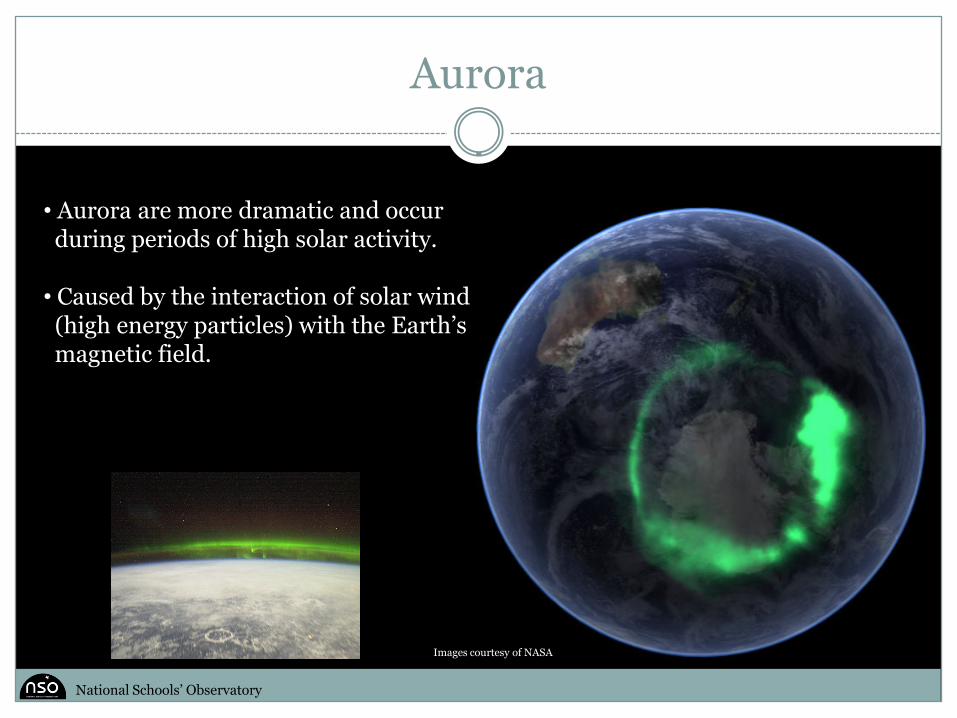
Aurora
• Aurora are more dramatic and occur during periods of high solar activity.
• Caused by the interaction of solar wind (high energy particles) with the Earth’smagnetic field.
National Schools’ Observatory
Images courtesy of NASA

Questions, Exercises and Tasks
Based on your findings, write to ESA and inform them how long they have to implement their satellite protection strategy. (If alternative presentation used)
How will solar activity effect future space exploration?
Where is the best place to view the aurora?
National Schools’ Observatory