SUEZ WATER NEW JERSEY, INC. · The second case, Hope. 2, determined a fair rate of return 9 to be...
66
SUEZ WATER NEW JERSEY, INC. PARAMUS, NEW JERSEY RATE OF RETURN DIRECT TESTIMONY OF HAROLD WALKER, III MAY 2018 Prepared by: GANNETT FLEMING VALUATION AND RATE CONSULTANTS, LLC Valley Forge, Pennsylvania Exhibit PT-9 Docket No._______
-
Upload
nguyenkhue -
Category
Documents
-
view
213 -
download
0
Transcript of SUEZ WATER NEW JERSEY, INC. · The second case, Hope. 2, determined a fair rate of return 9 to be...

SUEZ WATER NEW JERSEY, INC. PARAMUS, NEW JERSEY
RATE OF RETURN
DIRECT TESTIMONY OF
HAROLD WALKER, III
MAY 2018
Prepared by: GANNETT FLEMING
VALUATION AND RATE CONSULTANTS, LLC
Valley Forge, Pennsylvania
Exhibit PT-9 Docket No._______


i
TABLE OF CONTENTS
INTRODUCTION .......................................................................................................................... 1
SUMMARY OF RECOMMENDATION ...................................................................................... 1
PRINCIPLES OF RATE REGULATION AND FAIR RATE OF RETURN ............................... 3
INVESTMENT RISK ..................................................................................................................... 4
DESCRIPTION OF SUEZ WATER NEW JERSEY, INC. ........................................................... 5
THE INDUSTRY............................................................................................................................ 7
COMPARABLE GROUP ............................................................................................................... 9
CAPITAL STRUCTURE ............................................................................................................. 12
EMBEDDED COST RATE .......................................................................................................... 16
FINANCIAL ANALYSIS ............................................................................................................ 17
RISK ANALYSIS ......................................................................................................................... 20
CAPITAL COST RATES ............................................................................................................. 29
COMMON EQUITY COST RATE ESTIMATE ......................................................................... 33
DISCOUNTED CASH FLOW ..................................................................................................... 34
CAPITAL ASSET PRICING MODEL ........................................................................................ 44
RISK PREMIUM .......................................................................................................................... 48
SUMMARY OF COMMON EQUITY COST RATE .................................................................. 53
OVERALL RATE OF RETURN RECOMMENDATION .......................................................... 55
APPENDIX A ................................................................................................................................. 1

ii
TERMS, ABBREVIATIONS AND ACRONYMS
Defined
BPU New Jersey Board of Public UtilitiesCAPM Capital Asset Pricing Model Commission New Jersey Board of Public UtilitiesCompany Suez Water New Jersey, Inc.Comparable Companies Water Group Followed by Analysts Comparable Group Water Group Followed by Analysts Cost of Capital Investor-required cost rate DCF Discounted Cash Flow DPS Dividend per share EPA U.S. Environmental Protection Agency's EPS Earnings per share Financial Risk Leverage GICS Global Industry Classification System GO General Obligation Bonds IOU Investor Owned Utilities Leverage Fixed cost capital Long-term U.S. Treasury Securities Base Risk-Free Rate M/B Market-to-Book Ratios Moody’s Moody's Investors Service
NARUC National Association of Regulatory Utility Commissioners
Non-Systematic Risk Company-Specific Risk ROE Return on Equity RP Risk Premium S&P Standard & Poor's SIC Standard Industrial Classification SWNJ Suez Water New Jersey, Inc.SWR SUEZ Water Resources Inc.Systematic Risk Non-Diversifiable Risk Value Line Value Line Investment SurveyWater Group Water Group Followed by Analysts
Terms, Abbreviations and Acronyms
1
INTRODUCTION 1
Q. PLEASE STATE YOUR NAME AND BUSINESS ADDRESS. 2
A. My name is Harold Walker, III. My business mailing address is P. O. Box 80794, Valley 3
Forge, Pennsylvania 19484. 4
Q. BY WHOM ARE YOU EMPLOYED AND IN WHAT CAPACITY? 5
A. I am employed by Gannett Fleming Valuation and Rate Consultants, LLC as Manager, 6
Financial Studies. 7
Q. WHAT IS YOUR EDUCATIONAL BACKGROUND AND EMPLOYMENT 8
EXPERIENCE? 9
A. My educational background, business experience and qualifications are provided in 10
Appendix A. 11
SCOPE OF TESTIMONY 12
Q. WHAT IS THE PURPOSE OF YOUR TESTIMONY? 13
A. The purpose of my testimony is to recommend an appropriate overall rate of return that 14
SUEZ Water New Jersey, Inc. (“SWNJ” or the “Company”) should be afforded an 15
opportunity to earn on its water and wastewater service rate base. My testimony is 16
supported by Exhibit PT-9, which is composed of 19 Schedules. 17
SUMMARY OF RECOMMENDATION 18
Q. WHAT IS YOUR RECOMMENDED COST OF EQUITY? 19
A. My recommendation is that the SWNJ be permitted an overall rate of return of 7.68%, 20
including a 10.25% cost of common equity, based upon the Company’s capital structure at 21
January 31, 2018. My recommended cost of common equity reflects SWNJ's unique risk 22
characteristics. 23

2
Q. HOW DID YOU DETERMINE YOUR RECOMMENDED COMMON EQUITY 1
COST RATE? 2
A. I used several models to help me in formulating my recommended common equity cost 3
rate including Discounted Cash Flow ("DCF"), Capital Asset Pricing Model ("CAPM") 4
and Risk Premium ("RP"). 5
Q. IS IT IMPORTANT TO USE MORE THAN ONE MARKET MODEL? 6
A. Yes. It is necessary to estimate common equity cost rates using a number of different 7
models. At any given time, a particular model may understate or overstate the cost of 8
equity. While any single investor may rely solely upon one model, different investors rely 9
on different models and many investors use multiple models. Therefore, because the price 10
of common stock reflects a number of valuation models, it is appropriate to estimate the 11
market-required common equity cost rate by applying a broad range of analytical models. 12
Q. PLEASE SUMMARIZE YOUR COMMON EQUITY COST RATE 13
RECOMMENDATION. 14
A. There is no market data concerning the SWNJ's shares of common stock because SWNJ 15
shares of common stock are not publicly traded. Accordingly, due to the lack of market 16
data concerning the SWNJ's equity, I used a comparable group of publicly traded 17
companies to estimate the common equity cost rate. Based upon the results of my entire 18
analysis, I conclude the SWNJ's current common equity cost rate is at least 10.25%. The 19
current range of common equity cost for the SWNJ is 10.20% (DCF), 9.90% (CAPM), and 20
10.90% (RP). Value Line Investment Survey ("Value Line") is relied upon by many 21
investors and is the only investment advisory service of which I am aware that projects 22
earned return on equity. As a check on the reasonableness of my common equity cost rate 23

3
recommendation, I reviewed Value Line's projected returns on common equity for 1
comparable utilities. Value Line's projected earned returns on common equity for my 2
comparable utilities range from 10.5% to 14.0%. The range of the projected returns 3
suggests that my recommendation that SWNJ be permitted an opportunity to earn 10.25% 4
is reasonable, if not conservative. 5
PRINCIPLES OF RATE REGULATION AND FAIR RATE OF RETURN 6
Q. WHAT ARE THE PRINCIPLES GUIDING FAIR RATES OF RETURN IN THE 7
CONTEXT OF RATE REGULATION? 8
A. In a capitalistic or free market system, competition determines the price for all goods and 9
services. Utilities are permitted to operate as monopolies or near monopolies as a tradeoff 10
for a ceiling on the price of service because: (1) the services provided by utilities are 11
considered necessities by society; and (2) capital-intensive and long-lived facilities are 12
necessary to provide utility service. Generally, utilities are required to serve all customers 13
in their service territory at reasonable rates determined by regulators. As a result, 14
regulators act as a substitute for a competitive-free market system when they authorize 15
prices for utility service. 16
Although utilities operate in varying degrees as regulated monopolies, they must compete 17
with governmental bodies, non-regulated industries, and other utilities for labor, materials, 18
and capital. Capital is provided by investors who seek the highest return commensurate 19
with the perceived level of risk; the greater the perceived risk, the higher the required return 20
rate. In order for utilities to attract the capital required to provide service, a fair rate of 21
return should equal an investor-required, market-determined rate of return. 22
4
Q. WHAT CONSTITUTES A FAIR RATE OF RETURN? 1
A. Two noted Supreme Court cases define the benchmarks of a fair rate of return. In 2
Bluefield1, a fair rate of return is defined as: (1) equal to the return on investments in other 3
business undertakings with the same level of risks (the comparable earnings standard); 4
(2) sufficient to assure confidence in the financial soundness of a utility (the financial 5
integrity standard); (3) adequate to permit a public utility to maintain and support its credit, 6
enabling the utility to raise or attract additional capital necessary to provide reliable service 7
(the capital attraction standard). The second case, Hope2, determined a fair rate of return 8
to be based upon guidelines found in Bluefield as well as stating that: (1) allowed revenues 9
must cover capital costs including service on debt and dividends on stock; and (2) the 10
Commission was not bound to use any single formula or combination of formulae in 11
determining rates. Utilities are not entitled to a guaranteed return. However, the 12
regulatory-determined price for service must allow the utility a fair opportunity to recover 13
all costs associated with providing the service, including a fair rate of return. 14
INVESTMENT RISK 15
Q. PREVIOUSLY, YOU REFERRED TO RISK. PLEASE DEFINE THE TERM 16
RISK. 17
A. Risk is the uncertainty associated with a particular action; the greater the uncertainty of a 18
particular outcome, the greater the risk. Investors who invest in risky assets expose 19
themselves to investment risk particular to that investment. Investment risk is the sum of 20
business risk and financial risk. Business risk is the risk inherent in the operations of a 21
1Bluefield Water Works & Improvement Company v. P.S.C. of West Virginia, 262 U.S. 679 (1923).
2Federal Power Commission v. Hope Natural Gas Company, 320 U.S. 591 (1944).

5
business. Assuming that a Company is financed with 100% common equity, business risk 1
includes all operating factors that affect the probability of receiving expected future income 2
such as: sales volatility, management actions, availability of product substitutes, 3
technological obsolescence, regulation, raw materials, labor, size and growth of the market 4
served, diversity of the customer base, economic activity of the area served, and other 5
similar factors. 6
Q. WHAT IS FINANCIAL RISK? 7
A. Financial risk reflects the manner in which an enterprise is financed. Financial risk arises 8
from the use of fixed cost capital (leverage) such as debt and/or preferred stock, because 9
of the contractual obligations associated with the use of such capital. Because the fixed 10
contractual obligations must be serviced before earnings are available for common 11
stockholders, the introduction of leverage increases the potential volatility of the earnings 12
available for common shareholders and therefore increases common shareholder risks. 13
Although financial risk and business risk are separate and distinct, they are interrelated. 14
In order for a company to maintain a given level of investment risk, business risk and 15
financial risk should complement one another to the extent possible. For example, two 16
firms may have similar investment risks while having different levels of business risk, if 17
the business risk differences are compensated for by using more or less leverage (financial 18
risk) thereby resulting in similar investment risk. 19
DESCRIPTION OF SUEZ WATER NEW JERSEY, INC. 20
Q. PLEASE GIVE A BRIEF DESCRIPTION OF THE COMPANY. 21
A. SWNJ is a private or investor-owned company. SWNJ was formed from the merger of 22
SUEZ Water New Jersey, Inc. (Water), SUEZ Water Toms River, Inc. (Water), SUEZ 23

6
Water Matchaponix, Inc. (Water), SUEZ Water Arlington Hills, Inc. (Wastewater), SUEZ 1
Water West Milford, Inc. (Wastewater), and SUEZ Water Princeton Meadows, Inc. 2
(Wastewater). SWNJ is a regulated public utility that provides water and wastewater 3
service to approximately 257,191 (12/31/16) customers who are located in their franchise 4
territories in the State of New Jersey, in a portion of Bergen, Hudson, Passaic, Morris, 5
Hunterdon, Sussex, Ocean, Monmouth, and Middlesex Counties. The price of service of 6
SWNJ is regulated by the New Jersey Board of Public Utilities (“Commission” or “BPU”). 7
SWNJ is a wholly-owned subsidiary of SUEZ Water Resources Inc. (“SWR”). SWR is 8
the sole source of SWNJ’s external capital. SWR owns and operates water and 9
wastewater utilities, and operates municipal water and wastewater systems throughout the 10
United States through a variety of public-private partnership contract structures. SWR 11
was founded in 1869 and is based in Harrington Park, New Jersey. SWR is a subsidiary 12
of SUEZ SA. 13
SUEZ SA is a France-based holding company engaged predominantly in the area of 14
environmental services, transforming waste into resources. It provides services in the areas 15
of water and waste, including drinking water and wastewater treatment services and 16
engineering, waste collection and recovery. It operates on three business lines: Water 17
Europe; Waste Europe, and International (The United States of America, Australia, and 18
Africa). 19

7
THE INDUSTRY 1
Q. PLEASE GIVE A BRIEF OVERVIEW OF THE INDUSTRY IN WHICH THE 2
COMPANY OPERATES. 3
A. SWNJ operates in the water supply industry and wastewater utility industry. The water 4
supply industry has a Standard Industrial Classification ("SIC") code of 4941, has water 5
utilities, and includes establishments primarily engaged in distributing water for sale for 6
residential, commercial, and industrial uses. Government controlled establishments such 7
as municipal service districts and public utilities dominate the industry. Private 8
companies or investor owned utilities ("IOU") are active in the construction and 9
improvement of water supply facilities and infrastructure. There are currently 8,971 U.S. 10
Businesses with an SIC code of 4941. 11
The water supply industry is the most fragmented of the major utility industries with more 12
than 53,000 community water systems in the U.S. (83% of which serve less than 3,300 13
customers). The nation's water systems range in size from large municipally owned 14
systems, such as the New York City water system that serves approximately 9 million 15
people, to small systems, where a few customers share a common well. 16
The wastewater utility industry is another fragmented industry, although not as fragmented 17
as the water supply industry. The wastewater utility industry has a Standard Industrial 18
Classification ("SIC") code of 4952 (Sewerage Systems), has sewer utilities, and includes 19
establishments primarily engaged in the collection and disposal of wastes conducted 20
through a sewer system, including such treatment processes as may be provided. There 21
are currently 1,891 U.S. Businesses with an SIC code of 4952. 22
8
According to the U.S. Environmental Protection Agency's ("EPA") most recent survey of 1
publicly-owned wastewater treatment facilities in 2008, there are approximately 15,000 2
such facilities in the nation, serving approximately 74% of the U.S. population. Eighty 3
percent of domestic wastewater systems are government owned rather than IOUs. 4
Currently, there are no wastewater utility companies that have actively traded stock. 5
An estimated 14% of all water supplies are managed or owned by IOUs. IOUs consist of 6
companies with common stock that is either actively traded or inactively traded, as well as 7
companies that are closely held, or not publicly traded. Currently, there are only about 10 8
investor owned water utility companies with publicly traded stock in the U.S. 9
The wastewater utility industry and water utility industry’s increased compliance with state 10
and federal water purity levels and large infrastructure replacements are driving 11
consolidation of the wastewater utility and water utility industries. Because many 12
wastewater utility and water utility operations do not have the means to finance the 13
significant capital expenditures needed to comply with these requirements, many have been 14
selling their operations to larger, financially stronger operations. 15
The larger IOUs have been following an aggressive acquisition program to expand their 16
operations by acquiring smaller wastewater and water systems. Generally, they enter a 17
new market by acquiring one or several wastewater or water utilities. After their initial 18
entry into a new market, the larger investor-owned water utility companies continually seek 19
to expand their market share and services through the acquisition of wastewater and water 20
utility businesses and operations that can be integrated with their existing operations. 21
Such acquisitions may allow a company to expand market share and increase asset 22
utilization by eliminating duplicate management, administrative, and operational 23
9
functions. Acquisitions of small, independent utilities can often add earning assets 1
without necessarily incurring the costs associated with the SDWA if such acquisitions are 2
contiguous to the potential purchaser. 3
In summary, the result of increased capital spending, to meet the SDWA requirements3 4
and the replace the aging infrastructure of many systems, has moved the wastewater and 5
water industries toward consolidation. Moreover, Federal and State regulations and 6
controls concerning water quality are still in the process of being developed and it is not 7
possible to predict the scope or the enforceability of regulations or standards which may 8
be established in the future, or the cost and effect of existing and potential regulations and 9
legislation upon the Wastewater System. However, as a smaller water and wastewater 10
system, SWNJ faces the cost of compliance with less financial resources when compared 11
to larger IOU water utilities. 12
COMPARABLE GROUP 13
Q. HOW DO YOU ESTIMATE THE COST OF COMMON EQUITY FOR THE 14
SWNJ? 15
A. SWNJ's common stock is not traded since it is held by SWR. Accordingly, I employed a 16
comparable group of utility companies with actively traded stock, to determine a market-17
required cost rate of common equity capital for the SWNJ. Since no companies are 18
perfectly identical to the SWNJ, it is reasonable to determine the market-required cost rate 19
3 The SDWA, or Safe Drinking Water Act, is the principal federal law in the United States intended to ensure safe drinking water for the public. Pursuant to the act, the EPA is required to set standards for drinking water quality and oversee all states, localities, and water suppliers who implement these standards. The CWA, or Clean Water Act, is the primary federal law in the United States governing water pollution. The CWA’s objective is to restore and maintain the chemical, physical, and biological integrity of the nation's waters by preventing point and nonpoint pollution sources, providing assistance to publicly owned treatment works for the improvement of wastewater treatment, and maintaining the integrity of wetlands.
10
for a comparable group of utility companies and adjust, to the extent necessary, for 1
investment risk differences between the SWNJ and the comparable group. 2
Q. HOW DID YOU SELECT THE COMPARABLE GROUP USED TO DETERMINE 3
THE COST OF COMMON EQUITY FOR THE SWNJ? 4
A. I selected a comparable group of water utilities to determine the cost of common equity for 5
the SWNJ considering security analysts' coverage. Unlike the other utility industries, only 6
a portion of the IOU water companies with publicly traded stock in the U.S. are followed 7
by security analysts. Coverage by security analysts is important when determining a 8
market required cost of common equity. Accordingly, security analysts' coverage was 9
considered when selecting my comparable group. I selected my water utility comparable 10
group, Water Group Followed by Analysts ("Water Group"), based upon a general criteria 11
that includes: (1) all U.S. water utilities who are covered by several security analysts as 12
measured by the existence of several sources of published projected five-year growth rates 13
in earnings per share ("EPS"); (2) with a Global Industry Classification Standard 4 14
("GICS") of 55104010 (i.e., Water Utility); (3) are not the announced subject of an 15
acquisition; (4) currently pay a common dividend and have not reduced their common 16
dividend within the past four years; and (5) have market capitalization greater than $75.0 17
million. 18
4GICS is an eight-digit code that represents a company's Global Industry Classification Standard that was developed by Standard & Poor's and Morgan Stanley Capital International. The eight-digit code can be broken down according to a hierarchy of economic sectors, industry groups, industries and sub-industries: All Economic Sectors are represented by the leftmost two-digits; Industry Groups are represented by the combination of the leftmost four-digits; Industries are represented by the combination of the leftmost six-digits; and Sub-Industries are represented by the combination of the leftmost eight-digits.

11
It should be noted that the Water Group is also referred to as the Comparable Group and/or 1
the Comparable Companies. The names of the utilities that comprise the Comparable 2
Group and their bond or credit ratings are listed in Table 1. 3
Bond and Credit Ratings for The Water Group Followed by Analysts
S&P Credit Rating
Water Group Followed by Analysts American States Water Co A+ American Water Works Co Inc A Aqua America Inc * A+ California Water Service Gp ** A+ Middlesex Water Co A SJW Corp *** A York Water Co A- Average A * - The A+ bond rating is that for Aqua Pennsylvania, Inc. ** - The A+ bond rating is that for California Water Service Co., Inc. *** - The A bond rating is that for San Jose Water Co.
Table 1 4
Q. WHY DID YOU INCLUDE NOT BEING THE SUBJECT OF AN ACQUISITION 5
AS A CRITERIA FOR THE WATER GROUP? 6
A. To begin with, there are only about 10 investor owned water utility companies with 7
publicly traded stock in the U.S., and some of these companies are very small. As stated 8
previously, the IOU water industry receives only limited exposure on Wall Street. 9
Additionally, the merger activity in the water industry can resulted in abnormal or "tainted" 10
stock prices in terms of a DCF analysis because premiums are typically paid in corporate 11

12
acquisitions. That is, when a tender offer is made for the purchase of all the outstanding 1
stock of a company, the amount of that offer usually exceeds the price at which the stock 2
was previously traded in the market. These large premiums are often reflected in the 3
prices of other water utilities that are not currently the announced subject of an acquisition.5 4
CAPITAL STRUCTURE 5
Q. WHAT IS REQUIRED TO DEVELOP AN OVERALL RATE OF RETURN? 6
A. The first step in developing an overall rate of return is the selection of capital structure 7
ratios to be employed. Next, the cost rate for each capital component is determined. The 8
overall rate of return is the product of weighting each capital component by its respective 9
capital cost rate. This procedure results in SWNJ's overall rate of return being weighted 10
proportionately to the amount of capital and cost of capital of each type of capital. 11
Q. WILL SWNJ DIRECTLY RAISE OR ISSUE ITS OWN DEBT CAPITAL? 12
A. No, prospectively SWNJ will not raise its own capital; rather SWR will be the sole source 13
of SWNJ’s external capital. 14
Q. WHAT CAPITAL STRUCTURE RATIOS ARE APPROPRIATE TO BE USED TO 15
DEVELOP SWNJ’S OVERALL RATE OF RETURN? 16
A. Consistent with settled rate setting principles, I believe it is necessary to evaluate the 17
SWNJ's current cost of capital based on SWR’s January 31, 2018 capital structure, which 18
includes 45.82% debt and 54.18 common equity as reflected in Schedule 1. These ratios 19
are developed on the Company’s Exhibit __, and synchronize capitalization with rate base. 20
5Multiple publications mention these impacts including Research Magazine – April, 2010, Barron's – March 2001, Utility Business – June 2002, and Value Line Investment Survey – April 2013.
13
Q. IS THERE A SET OF REGULATORY AND FINANCIAL PRINCIPLES USED IN 1
DECIDING THE APPROPRIATE CAPITAL STRUCTURE TO USE FOR COST 2
OF CAPITAL PURPOSES? 3
A. Yes. There is a general set of regulatory and financial principles used in deciding the 4
capital structure issue for cost of capital purposes that are consistent with both regulatory 5
and financial theories: 6
1) It is generally preferable to use a utility's actual capital structure in developing its 7
rate of return. However, in deciding whether a departure from this general 8
preference is warranted in a particular case, it is appropriate to first look to the issue 9
of whether the utility is a financially independent entity. In determining whether 10
a utility is a financially independent entity or self-financing, it is important to look 11
to whether the utility: 12
• has its own bond rating; 13
• provides its own debt financing; and 14
• debt financing is not guaranteed by a parent company. 15
2) When a utility issues its own debt that is not guaranteed by the public or private 16
parent and has its own bond rating, regulatory and financial principles indicate to 17
use a utility's own capital structure, unless the utility's capital structure is not 18
representative of the utility's risk profile or where use of the actual capital structure 19
would create atypical results. Regulatory and financial principles involve 20
determining whether the actual capital structure is atypical when compared with the 21
capital structures approved by the public utility commission for other utilities that 22
14
operate in the same industry (i.e., water utility, gas distribution utility, etc.), as well 1
as those of the proxy utility companies that operate in the same industry. 2
3) For utility subsidiaries without publicly traded stock, the manner in which the utility 3
obtains its debt financing determines whether it does its own financing. Public 4
utility commissions generally determine if a subsidiary has financial, operational, 5
and managerial relationships with its parent entity. However, having such ties 6
typically has not led to use of a parent's capital structure for regulatory purposes, 7
unless the subsidiary utility issues no long-term debt, issues long-term debt only to 8
its parent, or issues long-term debt to outside investors only with the guarantee of 9
its parent. 10
4) If a utility does not provide its own financing, public utility commissions often look 11
to another entity. Generally, public utility commissions use the actual capital 12
structure of the entity that does the financing for the regulated utility if that capital 13
structure is representative of the utility's risk profile, or representative of other 14
utilities that operate in the same industry (i.e., water utility, gas distribution utility, 15
etc.) and it results in just and reasonable rates. This generally means using a parent 16
company. 17
5) If the parent's capital structure is used, because it finances the operation of the 18
utility, regulatory and financial principles require adjustments in the utility's 19
allowed rate of return on equity to adjust for risk differences, if any, between the 20
parent and the regulated subsidiary. If, however, the financing entity's capital 21
structure is inconsistent relative to the capital structures of the publicly-traded 22
proxy companies used in the cost of equity analysis and capital structures approved 23

15
for other utilities that operate in the same industry (i.e., water utility, gas 1
distribution utility, etc.), public utility commissions employ a hypothetical capital 2
structure. 3
Once the cost of equity for the proxy companies is determined, thereby establishing a range 4
of reasonable returns, public utility commissions should determine where to set the utility's 5
return in that range based upon how the utility's risk compares with that of other utilities 6
that operate in the same industry (i.e., water utility, gas distribution utility, etc.). The risk 7
analysis begins with the assumption that the utility generally falls within a broad range of 8
average risk, absent highly unusual circumstances that indicate an inconsistently high or 9
low risk as compared to other utilities that operate in the same industry (i.e., water utility, 10
gas distribution utility, etc.). Generally, financial risk is a function of the amount of debt 11
in an entity's capital structure used for cost of capital purposes. When there is more debt, 12
there is more risk. 13
Q. HOW DOES YOUR RECOMMENDED CAPITAL STRUCTURE COMPARE 14
WITH RATIOS EMPLOYED BY OTHER INVESTOR-OWNED COMPANIES? 15
A. The capital structure I recommend for SWNJ reflects a common equity ratio of 54.18% 16
which is similar to ratios employed by other investor-owned water companies as shown on 17
page 1 of Schedule 2. A comparison of my recommendation for SWNJ's capital structure 18
ratios to those recently employed and forecasted to be employed by the Comparison Group 19
is shown in Table 2. 20
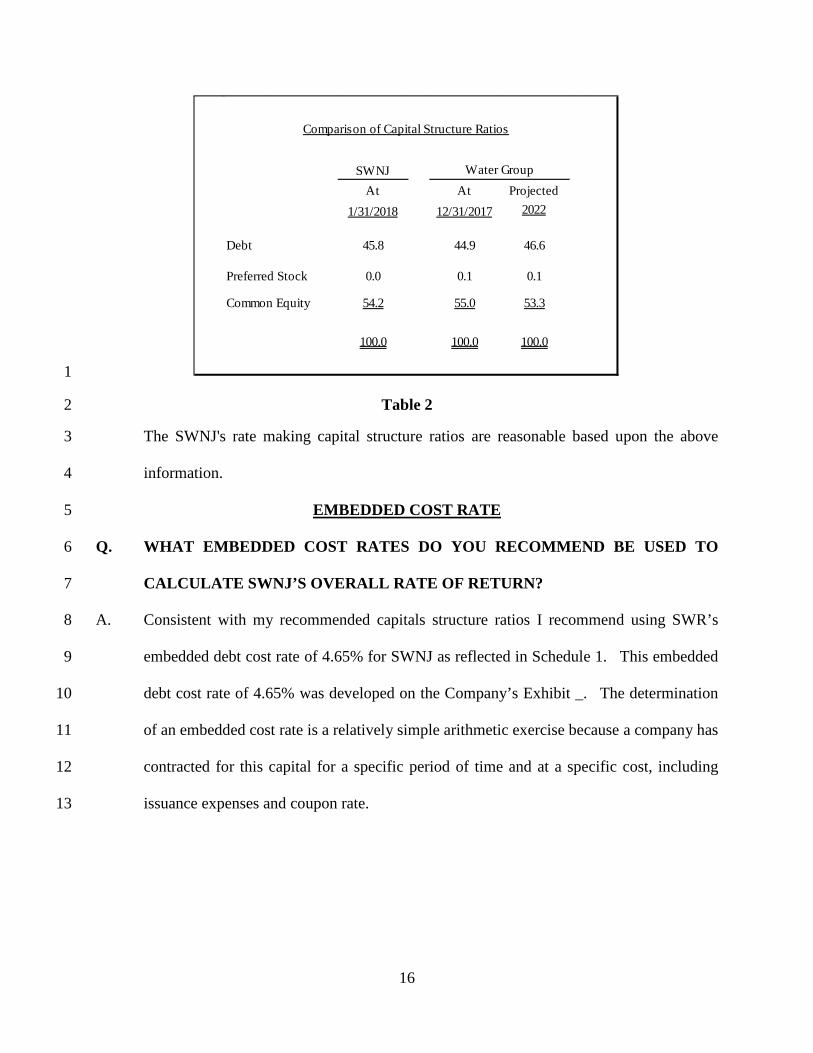
16
1
Table 2 2
The SWNJ's rate making capital structure ratios are reasonable based upon the above 3
information. 4
EMBEDDED COST RATE 5
Q. WHAT EMBEDDED COST RATES DO YOU RECOMMEND BE USED TO 6
CALCULATE SWNJ’S OVERALL RATE OF RETURN? 7
A. Consistent with my recommended capitals structure ratios I recommend using SWR’s 8
embedded debt cost rate of 4.65% for SWNJ as reflected in Schedule 1. This embedded 9
debt cost rate of 4.65% was developed on the Company’s Exhibit _. The determination 10
of an embedded cost rate is a relatively simple arithmetic exercise because a company has 11
contracted for this capital for a specific period of time and at a specific cost, including 12
issuance expenses and coupon rate. 13
Comparison of Capital Structure Ratios
Water GroupAt At Projected
1/31/2018 12/31/2017 2022
Debt 45.8 44.9 46.6
Preferred Stock 0.0 0.1 0.1
Common Equity 54.2 55.0 53.3
100.0 100.0 100.0
SWNJ

17
FINANCIAL ANALYSIS 1
Q. HAVE YOU REVIEWED HISTORICAL FINANCIAL INFORMATION OF SWNJ 2
AS PART OF YOUR ANALYSIS? 3
A. Yes. On page 1 of Schedule 3, I developed a five-year analysis, ending in 2016, detailing 4
various financial ratios for SWNJ.6 On Schedule 4, I performed a similar five-year 5
analysis for the Water Group. Schedule 5 reveals the results of operations for a large 6
broad-based group of utilities known as the S&P Utilities for the five years ending 2016. 7
This information is useful in determining relative risk differences between different types 8
of utilities. 9
Comparing SWNJ, the Comparable Group and the S&P Utilities’ coverage of fixed charges 10
and the various cash flow coverage prove that the Comparable Group have experienced a 11
higher level of coverage than the S&P Utilities. SWNJ’s coverage of fixed charges and the 12
various cash flow coverage show SWNJ’s results have been similar to the Comparable 13
Group’s. 14
Q. WHAT DO YOU CONCLUDE FROM THE COMPARISON OF ALL THE 15
INFORMATION SHOWN ON SCHEDULES 3 THROUGH 5? 16
A. Taken together, these comparisons show that SWNJ is exposed to risk that is similar in 17
nature but greater in degree compared with the Comparable Groups. This is evident in 18
particular when one considers the size and diversification of SWNJ, or lack thereof, as 19
compared to the Comparable Companies. Moreover, the evidence from the various 20
financial ratios show SWNJ’s risks as being similar to the Comparable Companies’ but 21
6 It should be noted the financials information shown for SWNJ is the result of combining the historical financial information for each of the six companies combined to form SWNJ. The six companies included are: Suez Water New Jersey, Inc.; Suez Water West Milford, Inc.; Suez Water Toms River, Inc.; Suez Water Princeton Meadows, Inc.; Suez Water Matchaponix, Inc.; and Suez Water Arlington Hills, Inc.

18
less than the larger S&P Utilities’. Prospectively, the magnitude of SWNJ’s future 1
construction expenditures will place downward pressure on SWNJ’s financial ratios as 2
measured by interest coverage and cash generation. 3
Q. WHAT INFORMATION IS SHOWN ON SCHEDULE 6? 4
A. Schedule 6 lists the names, issuer credit ratings, common stock rankings, betas and market 5
values of the companies contained in the Comparable Group and the S&P Utilities. As is 6
evident from the information shown on Table 3, the Comparable Group and the S&P 7
Utilities are similar to each other in risk. 8
S&P S&P Value Recent Market Issuer Credit Common Line Market Quartile Rating Stock Ranking Beta Value Name (Mill $)
Water Group A Above Average (A-) 0.74 1,788.410 Low-Cap
S&P Utilities BBB+ Average (B+) 0.69 23,143.256 Large-Cap
Table 3 9
The Water Group's average issuer credit ratings and common stock rankings are higher 10
than the S&P Utilities. The average beta of the Comparable Group, 0.74, is similar to the 11
average beta of the S&P Utilities, 0.69. Beta is a measure of volatility or market risk, the 12
higher the beta, the higher the market risk. The market values provide an indication of the 13
relative size of each group. As a generalization, the smaller the average sizes of a group, 14
the greater the risk. 15
Page 2 of Schedule 7 shows that SWNJ has experienced the lowest return on equity 16
("ROE") when compared to the Comparable Companies. Further, the Comparable 17
Companies' dividend payout ratio has generally been higher than SWNJ’s. 18

19
Standard & Poor's ("S&P"), the predominant bond rating agency, considers profit to be a 1
fundamental determinant of credit protection. S&P states that a firm's profit level: 2
Whether generated by the regulated or deregulated side of the business, 3 profitability is critical for utilities because of the need to fund investment-4 generating capacity, maintain access to external debt and equity capital, and 5 make acquisitions. Profit potential and stability is a critical determinant of 6 credit protection. A company that generates higher operating margins and 7 returns on capital also has a greater ability to fund growth internally, attract 8 capital externally, and withstand business adversity. Earnings power 9 ultimately attests to the value of the company's assets, as well. In fact, a 10 company's profit performance offers a litmus test of its fundamental health 11 and competitive position. 12 13 Accordingly, the conclusions about profitability should confirm the 14 assessment of business risk, including the degree of advantage provided by 15 the regulatory environment.7 16
17 Q. WHAT INFORMATION IS SHOWN ON SCHEDULE 7? 18
A. Schedule 7 reveals the capital intensity and capital recovery for the SWNJ, the Comparable 19
Companies and the S&P Utilities. Based upon the 2016 capital intensity ratio of plant to 20
revenues, the SWNJ ($5.21) is less capital intensive as compared to the Water Group 21
($5.59), but more than the S&P Utilities ($4.11). From a purely financial point of view, 22
based on current accounting practices, the rate of capital recovery or depreciation rate is an 23
indication of risk because it represents cash flow and the return of an investment. The 24
SWNJ's average rate of capital recovery is about the same as the Comparable Group's, 25
suggesting similar risk. 26
The return on equity and depreciation expense provides the margin for coverage of 27
construction expenditures. For a utility company, depreciation expense is the single 28
largest generator of cash flow. From a financial analyst's point of view, cash flow is the 29
7 Standard & Poor's Ratings Services, Criteria, Utilities: Key Credit Factors: Business And Financial Risks In The Investor-Owned Utilities Industry, Nov. 26, 2008, pgs. 8-9.

20
life blood of a utility company. Without it, a utility cannot access capital markets, it 1
cannot construct plant, and therefore, it cannot provide service to its customers. As shown 2
on Schedules 3 and 6, SWNJ level of cash flow is similar to the Comparable Companies. 3
RISK ANALYSIS 4
Q. PLEASE EXPLAIN THE INFORMATION SHOWN ON SCHEDULE 8. 5
A. Schedule 8 details the size difference between the SWNJ and the Comparable Group. 6
Company size is an indicator of business risk and is summarized in Table 4. 7
Number of Times Larger Than the SWNJ Water Group Capitalization 2.6x Revenues 2.9x Number of Customers 3.1x
Table 4 8
As shown in Table 4, SWNJ is smaller than the Water Group. The size of a company 9
affects risk. A smaller company requires the employment of proportionately less 10
financial leverage (i.e., debt and preferred capital) than a larger company to balance out 11
investment risk. If investment risk is not balanced out, then a higher cost of capital is 12
required. 13
Q. WHY IS SIZE SIGNIFICANT TO YOUR ANALYSIS? 14
A. The size of a company can be likened to ships on the ocean, since a large ship has a much 15
better chance of weathering a storm than a small ship. The loss of a large customer will 16
impact a small company much more than a large company because a large customer of a 17
small company usually accounts for a larger percentage of the small company's sales. 18

21
Moreover, a larger company is likely to have a more diverse geographic operation than a 1
smaller company, which enables it to sustain earnings fluctuations caused by abnormal 2
levels of rainfall in one portion of its service territory. A larger company operating in 3
more than one regulatory jurisdiction enjoys "regulatory diversification" which makes it 4
less susceptible to adverse regulatory developments or eminent domain claims in any single 5
jurisdiction. Further, a larger company with a more diverse customer base is less 6
susceptible to downturns associated with regional economic conditions than a small 7
company. For example, on average, the average company in the Water Group provides 8
water/sewer service in multiple states for about 786,000 customers. The average 9
population of the communities served by the average company in the Water Group is about 10
2.8 million people. These wide ranging operations provide the Water Group substantial 11
geographic, economic, regulatory, weather and customer diversification. The SWNJ 12
provided regulated water and wastewater service to about 257,000 customers (12/31/16). 13
The concentration of the SWNJ's business in northeastern New Jersey makes it very 14
susceptible to any adverse development in local regulatory, economic, demographic, 15
competitive and weather conditions. 16
Further, S&P, a major credit rating agency, recognizes the importance that diversification 17
and size play in credit ratings. S&P believes some of the critical factors include: regional 18
and cross-border market diversification (mitigates economic, demographic, and political 19
risk concentration); customer diversification; and regulatory regime diversification.8 20
8 Standard & Poor's, Corporate Ratings Criteria, Utilities: Key Credit Factors: Business And Financial Risks In The Investor-Owned Utilities Industry, Nov. 26, 2008.
22
The size of a company can be a barrier to fluid access to capital markets (i.e., liquidity 1
risk). Investors require compensation for the lack of marketability and liquidity of their 2
investments. If no compensation is provided, then investors, or at least sophisticated 3
investors, shy away. 4
Q. IS THE IMPACT OF SIZE COMMONLY RECOGNIZED? 5
A. Yes, the National Association of Regulatory Utility Commissioners ("NARUC"), as well 6
as most good financial texts, recognizes that size affects relative business risk. Liquidity 7
risk and the existence of the small firm effect relating to business risk of small firms are 8
well-documented in financial literature. 9 Investors' expectations reflect the highly-9
publicized existence of the small firm effect. For example, many mutual funds classify 10
their investment strategy as small capitalization in an attempt to profit from the existence 11
of the small firm effect. 12
As previously discussed, S&P recognizes that size plays a role in credit ratings. 13
Standard & Poor's has no minimum size criterion for any given 14 rating level. However, size turns out to be significantly correlated 15 to ratings. The reason: size often provides a measure of 16 diversification, and/or affects competitive position. . . . Small 17 companies are, almost by definition, more concentrated in terms of 18 product, number of customers, or geography. In effect, they lack 19 some elements of diversification that can benefit larger companies. 20 To the extent that markets and regional economies change, a broader 21 scope of business affords protection. This consideration is 22 balanced against the performance and prospects of a given business. 23 . . . In addition, lack of financial flexibility is usually an important 24 negative factor in the case of very small companies. Adverse 25 developments that would simply be a setback for companies with 26 greater resources could spell the end for companies with limited 27 access to funds.10 28 29
9 Banz, Rolf, W. "The Relationship Between Return and Market Value of Common Stocks," Journal of Financial Economics, 9:3-18 1981. For subsequent studies see Fama and French, etc. 10Standard & Poor's, Corporate Ratings Criteria 2006; pg. 22.
23
As shown on Schedule 9, size plays a role in the composition of investors, and hence 1
liquidity. In 2016, about 127% of the Water Group's shares traded while the larger 2
companies comprising the S&P Utilities had a much higher trading volume of 177%. 3
Insiders11 hold more than seven times more, as a percent to total, of the Water Group's 4
shares than the S&P Utilities. Currently, only about 60% of the Water Group shares are 5
held by institutions12 while the larger companies comprising the S&P Utilities had much 6
higher institutional holdings of 78%. Due to small size and less interest by financial 7
institutions, fewer security analysts follow the Comparable Group and none follow the 8
SWNJ. 9
The lack of trading activity may affect the cost of equity estimates for small entities such 10
as the SWNJ and the Water Group. When stock prices do not change because of inactive 11
trading activity, estimates of dividend yield for use in a dividend cash flow model and beta 12
estimates for use in the capital asset pricing model are affected. In a stock market that is 13
generally up, the beta estimates for the Comparable Companies may be understated due to 14
thin trading. 15
Q. DO SWNJ AND THE COMPARABLE COMPANIES HAVE SIMILAR 16
OPERATING RISKS? 17
A. Yes. From an operations standpoint, the SWNJ and the Comparable Companies have 18
similar risks and are indistinguishable. Both are required to meet Clean Water Acts and 19
11An insider is a director or an officer who has a policy-making role or a person who is directly or indirectly the beneficial owner of more than 10% of a certain company's stock. 12Institutional holders are those investment managers having a fair market value of equity assets under management of $100 million or more. Certain banks, insurance companies, investment advisers, investment companies, foundations and pension funds are included in this category.

24
Safe Drinking Water Act requirements and are also required to provide safe and reliable 1
services to their customers and comply with Commission regulations. 2
Q. IS THERE ANY SINGLE MEASURE THAT BEST SHOWS INVESTMENT RISK 3
FROM A COMMON STOCKHOLDER'S PERSPECTIVE? 4
A. No. However, from a creditor's viewpoint, the best measure of investment risk is debt 5
rating. The debt rating process generally provides a good measure of investment risk for 6
common stockholders because the factors considered in the debt rating process are usually 7
relevant factors that a common stock investor would consider in assessing the risk of an 8
investment. Credit rating agencies, such as S&P, assess the risk of an investment into two 9
categories based on: fundamental business analysis; and financial analysis. 13 The 10
business risk analysis includes assessing: Country risk; industry risk; competitive position; 11
and profitability/peer group comparisons. The financial risk analysis includes assessing: 12
accounting; financial governance and policies/risk tolerance; cash flow adequacy; capital 13
structure/asset protection; and liquidity/short-term factors. 14
Q. WHAT IS THE BOND RATING OF SWNJ AND THE COMPARABLE GROUP? 15
A. Page 1 of Schedule 10 shows the average bond/credit rating Comparable Group. The 16
Comparable Group have an A credit profile. The combined SWNJ does not have bonds 17
rated, although the former SWNJ has an A- credit profile. SWR has an A- credit profile. 18
The major bond rating/credit rating agencies append modifiers, such as +, - for S&P and 1, 19
2, and 3 for Moody's Investors Service ("Moody's") to each generic rating classification. 20
For example, an "A" credit profile is comprised of three subsets such as A+, A, A- for S&P 21
13 Standard & Poor's, Corporate Ratings Criteria, General: Criteria Methodology: Business Risk/Financial Risk Matrix Expanded, May 27, 2009 and Standard & Poor's, Criteria Corporates General: Corporate Methodology, November 19, 2013.
25
or A1, A2 or A3 for Moody's. The modifier of either "+" or "1" indicates that the obligation 1
ranks in the higher end of its generic rating category; the modifier "2" indicates a mid-range 2
ranking; and the modifier of "-" or "3" indicates a ranking in the lower end of that generic 3
rating category. 4
S&P and Moody’s publish financial benchmark criteria necessary to obtain a bond rating 5
for different types of utilities. As a generalization, the higher the perceived business risk, 6
the more stringent the financial criteria so the sum of the two, business risk and financial 7
criteria, remains the same. 8
Q. WHAT ARE SOME FINANCIAL BENCHMARKS APPLIED BY CREDIT 9
RATING AGENCIES FOR RATING PUBLIC UTILITY DEBT? 10
A. S&P describes their range of financial benchmarks as 11
Risk-adjusted ratio guidelines depict the role that financial ratios play in 12 Standard & Poor's rating process, since financial ratios are viewed in the 13 context of a firm's business risk. A company with a stronger competitive 14 position, more favorable business prospects, and more predictable cash 15 flows can afford to undertake added financial risk while maintaining the 16 same credit rating. The guidelines displayed in the matrices make explicit 17 the linkage between financial ratios and levels of business risk.14 18
19
Q. WHAT OTHER INFORMATION IS SHOWN ON SCHEDULE 10? 20
A. Page 2 of Schedule 10 summarizes the application of S&P's and Moody’s measures of 21
financial risk for SWNJ and the Comparable Group. S&P's and Moody’s measures of 22
financial risk are broader than the traditional measure of financial risk, leverage. Besides 23
reviewing amounts of leverage employed, S&P and Moody’s also focuses on earnings 24
protection and cash flow adequacy. 25
14Standard & Poor's Corporate Rating Criteria, 2000.

26
As is evident from the information shown on page 2 of Schedule 10, for the five years 1
ending in 2016 and for 2016, SWNJ’s cash flow adequacy ratios were above the 2
Comparable Companies in the majority of instances. However, when the differences in 3
the manner of capitalization was accounted for (rows 21-30), SWNJ’s cash flow adequacy 4
ratios were below the Comparable Companies. Comparing the SWNJ and the Water 5
Group's measures of cash flow adequacy show that the SWNJ has experienced a similar 6
level of cash flow adequacy as the Comparable Companies; indicating that the SWNJ is a 7
similar investment risk as the Water Group. Prospectively, based upon the Company’s 8
large construction program, the Company’s ratios are likely to be strained. Based solely 9
upon SWNJ’s historical ratios, it is my opinion that SWNJ’s credit profile is similar to the 10
Comparable Companies. 11
As S&P has stated, size is significantly correlated to credit ratings. An analysis of 12
corporate credit ratings found The York Water Company to be the smallest utility with a 13
credit rating. Their credit rating is only A- despite having a capitalization comprised of 14
more than $199 million and a common equity ratio in excess of 57%. 15
Q. HAVE YOU REVIEWED THE COMPANY’S LARGE CONSTRUCTION 16
PROGRAM? 17
A. Yes, the Company estimates their construction program to total $494.6 million from 2019 18
through 2022. At year end 2016 the Company’s total capital outstanding was $1,101.4 19
million indicating the need for a 45% increase ($494.6 million ÷ $1,101.4 million) in 20
capital through 2022. 21
Q. HOW DOES THE MAGNITUDE OF THE COMPANY’S LARGE 22
CONSTRUCTION PROGRAM COMPARE TO THE COMPARABLE GROUP’S 23

27
CONSTRUCTION PROGRAM? 1
A. The Company is forecasted to require 45% of additional capital for their construction 2
program while the Comparable Group is projected by Value Line to require 48% of 3
additional capital to finance their construction programs. Accordingly, SWNJ’s capital 4
requirements are about the same as the Comparable Group’s through 2022 indicating 5
similar risk for SWNJ. 6
In order to compete with the Comparable Group' for capital, in the future, it will be 7
necessary for the SWNJ to achieve higher returns on equity, and increased cash flow just 8
to maintain a similar credit quality. 9
S&P has stated: 10
... low authorized returns may affect the industry's ability to attract necessary 11 capital to develop new water supplies and upgrade the quality of existing 12 supplies . . . Traditional ratemaking policy has not provided sufficient credit 13 support during the construction cycle of the electric industry over the past 15 14 years. To avoid a repeat in the water industry, regulators must be aware of 15 the increased challenges the industry faces.15 (Emphasis added) 16
17
Investors will not provide the equity capital necessary for increasing the amount of 18
common equity in a capital structure unless the regulatory authority allows an adequate 19
rate of return on the equity.16 20
Q. WHAT DO YOU CONCLUDE FROM THE VARIOUS MEASURES OF 21
INVESTMENT RISK INFORMATION YOU HAVE TESTIFIED TO? 22
15Standard & Poor's CreditWeek, May 25, 1992. 16National Association of Regulatory Utility Commissioners, loc. cit.
28
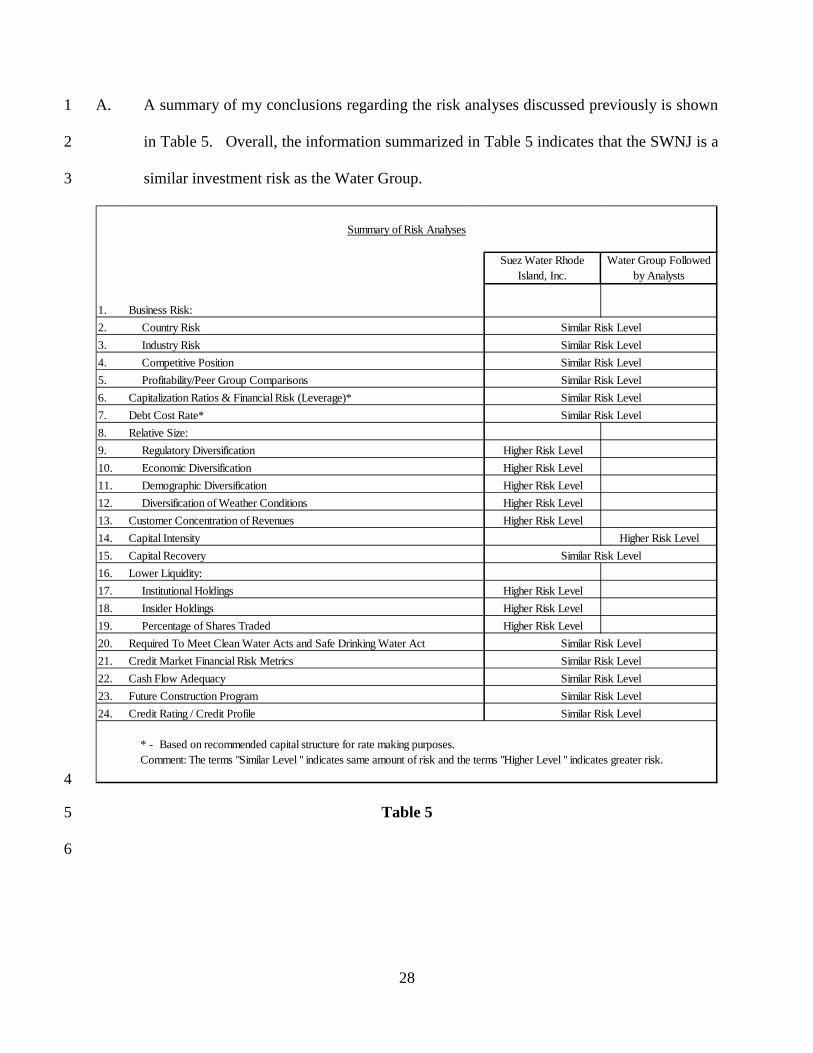
A. A summary of my conclusions regarding the risk analyses discussed previously is shown 1
in Table 5. Overall, the information summarized in Table 5 indicates that the SWNJ is a 2
similar investment risk as the Water Group. 3
4
Table 5 5
6
Summary of Risk Analyses
Suez Water Rhode Island, Inc.
Water Group Followed by Analysts
1. Business Risk:2. Country Risk Similar Risk Level3. Industry Risk Similar Risk Level4. Competitive Position Similar Risk Level5. Profitability/Peer Group Comparisons Similar Risk Level6. Capitalization Ratios & Financial Risk (Leverage)* Similar Risk Level7. Debt Cost Rate* Similar Risk Level8. Relative Size:9. Regulatory Diversification Higher Risk Level10. Economic Diversification Higher Risk Level11. Demographic Diversification Higher Risk Level12. Diversification of Weather Conditions Higher Risk Level13. Customer Concentration of Revenues Higher Risk Level14. Capital Intensity Higher Risk Level15. Capital Recovery Similar Risk Level16. Lower Liquidity:17. Institutional Holdings Higher Risk Level18. Insider Holdings Higher Risk Level19. Percentage of Shares Traded Higher Risk Level20. Required To Meet Clean Water Acts and Safe Drinking Water Act Similar Risk Level21. Credit Market Financial Risk Metrics Similar Risk Level22. Cash Flow Adequacy Similar Risk Level23. Future Construction Program Similar Risk Level24. Credit Rating / Credit Profile Similar Risk Level
* - Based on recommended capital structure for rate making purposes. Comment: The terms "Similar Level " indicates same amount of risk and the terms "Higher Level " indicates greater risk.

29
CAPITAL COST RATES 1
Q. WHAT INFORMATION IS SHOWN ON SCHEDULE 11? 2
A. Schedule 11 reviews long-term and short-term interest rate trends. Long-term and short-3
term interest rate trends are reviewed to ascertain the "sub-flooring" or "basement" upon 4
which the Comparable Companies' common equity market capitalization rate is built. 5
Based upon the settled yields implied in the Treasury Bond future contracts and the long-6
term and recent trends in spreads between long-term government bonds and A-rated public 7
utility bonds available to me at the time Schedule 11 was prepared, I conclude that the 8
market believes that if the Comparable Companies issued new long-term bonds near term, 9
they would be priced to yield about 4.4% based upon a credit profile of "A." Further, it is 10
reasonable to conclude the market anticipates that long-term government bonds will be 11
priced to yield about 3.2%, near term. 12
However, prospectively, over the next couple of years, forecasters believe capital costs 13
rates may increase substantially from their current levels. Recently, former Federal 14
Reserve Chairman Alan Greenspan warned that the bond market is on the edge of a collapse 15
that would bring much higher interest rates and may also impact stock prices. 16
In a CNBC interview, the longtime central bank chief said the prolonged 17 period of low interest rates is about to end and, with it, a bull market in fixed 18 income that has lasted more than three decades. 19 "The current level of interest rates is abnormally low and there's only one 20 direction in which they can go, and when they start they will be rather 21 rapid," Greenspan said on "Squawk Box." 22 That low interest rate environment has been the product of current monetary 23 policy at the institution he helmed from 1987-2006. The Fed took its 24 benchmark rate to near zero during the financial crisis and kept it there for 25 seven years after. 26 Since December 2015, the Fed has approved four rate hikes, but government 27 bond yields remained mired near record lows. 28

30
Greenspan did not criticize the policies of the current Fed. But he warned 1 that the low rate environment can't last forever and will have severe 2 consequences once it ends. 3 "I have no time frame on the forecast," he said. "I have a chart which goes 4 back to the 1800s and I can tell you that this particular period sticks out. But 5 you have no way of knowing in advance when it will actually trigger." 6 One point he did make about timing is it likely will be quick and take the 7 market by surprise. 8 "It looks stronger just before it isn't stronger," he said. Anyone who thinks 9 they can forecast when the bubble will break is "in for a disastrous" 10 experience." 11 In addition to his general work at the Fed, which also featured an extended 12 period of low rates though nowhere near their current position, Greenspan 13 is widely known for the "irrational exuberance" speech he gave at the 14 American Enterprise Institute in 1996. The speech warned about asset 15 prices and said it is difficult to tell when a bubble is about to burst. 16 Those remarks foreshadowed the popping of the dot-com bubble, and the 17 phrase has found a permanent place in the Wall Street lexicon. 18 "You can never be quite sure when irrational exuberance arises," he told 19 CNBC. "I was doing it as part of a much broader speech and talking about 20 the analysis of the markets and the like, and I wasn't trying to focus short 21 term. But the press loved that term."17 22
23
Since October 2008, the Federal Reserve has been monetizing US Treasury debt to 24
artificially suppress interest rates through expansionary money policies. The Federal 25
Reserve, with effectively unlimited money at its disposal, intervenes at any time it wishes, 26
in whatever volume it wishes, to make sure that Treasury bond and bill prices and yields 27
are exactly what the Federal Reserve wants them to be. The US Treasury bond market, and 28
mortgage market, has become an artificial market with no connection to objective risk and 29
interest rates. 30
In August 2011, the Federal Reserve began "Operation Twist." Under "Operation Twist," 31
the Federal Reserve began buying $400 billion of long-dated or long-term US Treasury 32
17 CNBC, Greenspan: Bond Bubble About to Break Because of 'Abnormally Low' Interest Rates, 8/4/17, https://www.cnbc.com/2017/08/04/greenspan-bond-bubble-about-to-break-because-of-abnormally-low-interest-rates.html , (8/4/17).
31
debt, financed by selling short-term US Treasury debt with three years to go or less. The 1
goal of "Operation Twist" was to try to drive long-term rates lower, which the Federal 2
Reserve thought would help the mortgage market. This process has created an artificial 3
demand for the US Treasury debt themselves, and easily drives interest rates artificially 4
lower and deceives investors into believing US Treasury debt are safe with wide demand. 5
This has resulted in the entire capital system being impacted by the Federal Reserve's 6
distortion of the price of risk. 7
In the real world of economics, the borrower pays an interest rate to a lender, 8 who makes money (interest) by taking on the risk of lending and deferring 9 gratification. The lender is willing to not spend his money now. In a free 10 market economy, interest rates are essentially a price put on money, and 11 they reflect the time preference of people. Higher interest rates reflect a high 12 demand for borrowing and lower savings. But the higher rates 13 automatically correct this situation by encouraging savings and 14 discouraging borrowing. Lower interest rates will work the opposite way. 15 When the government/central bank tampers with interest rates, savings and 16 lending are distorted, and resources are misallocated. This is evident in 17 looking back on the housing bubble. The artificially low interest rates 18 signaled that there was a high amount of savings. But it was a false signal. 19 There was also a signal for people to borrow more. Again, it was a false 20 signal. As these false signals were revealed, the housing boom turned into 21 a bust.18 22 23
When there is a crisis in the markets, such as a financial meltdown, market participants 24
usually sell off and move their money to a safer place; fleeing from illiquid, low quality 25
investments to liquid, high quality investments. This flight to quality reflects a collapse of 26
confidence in the financial system and is most evident in short-term interest rates. 27
Prospectively the capital markets will be affected by the upcoming unprecedented large 28
Treasury financings. Investors provide capital based upon risk and return opportunities 29
18 Pike, Geoffrey "The Threat of Negative Interest Rates," Wealth Daily, May 30, 2014, http://www.wealthdaily.com/articles/the-threat-of-negative-interest-rates/5185, (6/03/2014)
32
and investors will not provide common equity capital when higher risk-adjusted returns are 1
available. 2
Q. ARE THERE OTHER INDICATION THAT FORECASTERS BELIEVE CAPITAL 3
COSTS RATES MAY INCREASE SUBSTANTIALLY FROM THEIR CURRENT 4
LEVELS? 5
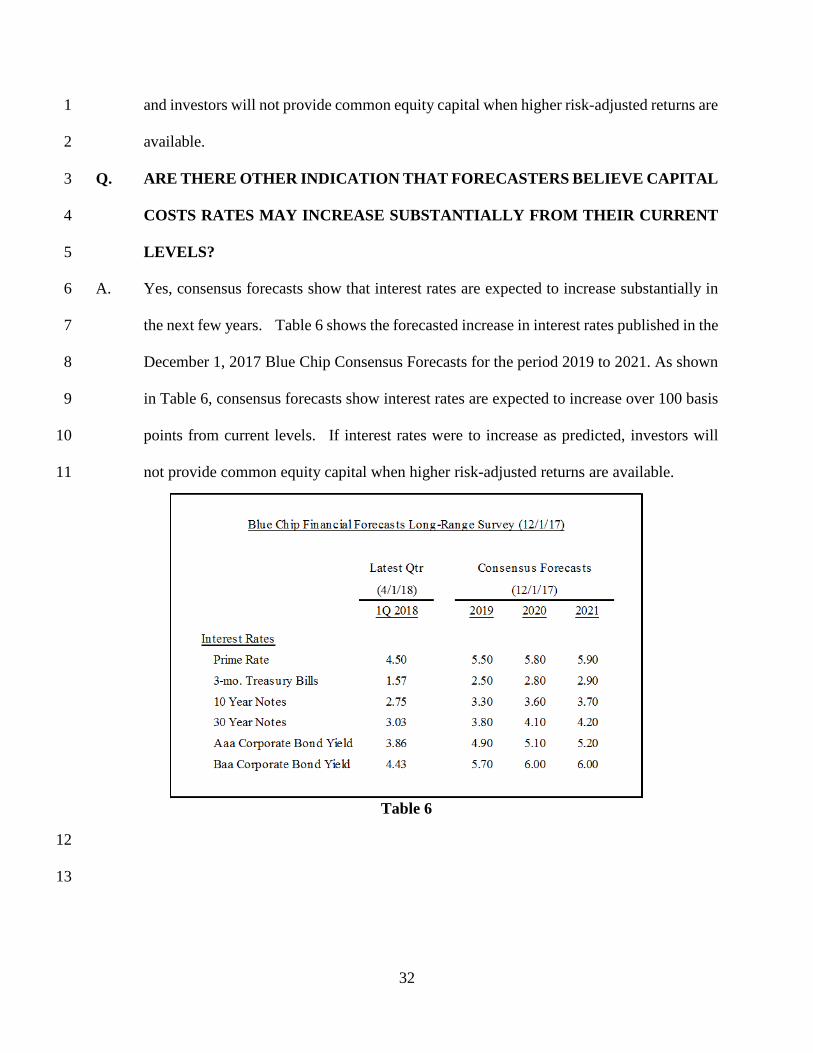
A. Yes, consensus forecasts show that interest rates are expected to increase substantially in 6
the next few years. Table 6 shows the forecasted increase in interest rates published in the 7
December 1, 2017 Blue Chip Consensus Forecasts for the period 2019 to 2021. As shown 8
in Table 6, consensus forecasts show interest rates are expected to increase over 100 basis 9
points from current levels. If interest rates were to increase as predicted, investors will 10
not provide common equity capital when higher risk-adjusted returns are available. 11
12
13
Table 6
33
COMMON EQUITY COST RATE ESTIMATE 1
Q. WHAT IS THE BEST METHOD OF ESTIMATING COMMON EQUITY COST 2
RATES? 3
A. There is no single method (model) suitable for estimating the cost rate for common equity. 4
While a single investor may rely solely upon one model in evaluating investment 5
opportunities, other investors rely on different models. Most sophisticated investors who 6
use an equity valuation model rely on many models in evaluating their common equity 7
investment alternatives. Therefore, the average price of an equity security reflects the 8
results of the application of many equity models used by investors in determining their 9
investment decisions. 10
The application of any single model to estimate common equity cost rates is not appropriate 11
because the security price for which the equity cost rate is being estimated reflects the 12
application of many models used in the valuation of the investment. That is, the price of 13
any security reflects the collective application of many models. Accordingly, if only one 14
model is used to estimate common equity cost rates, that cost rate will most likely be 15
different from the collective market's cost rates because the collective valuation in the 16
market reflects more than one method. 17
Noted financial texts, investor organizations and professional societies all endorse the use 18
of more than one valuation method. "We endorse the dividend discount model, 19
particularly when used for establishing companies with consistent earnings power and 20
when used along with other valuation models. It is our view that, in any case, an investor 21
should employ more than one model."19 (Emphasis added.) 22
19Sidney Cottle, Roger F. Murray and Frank E. Block, Graham and Dodd's Securities Analysis 5th Edition, McGraw-Hill, Inc., 1988, p. 568.

34
The American Association of Individual Investors state, "No one area of investment is 1
suitable for all investors and no single method of evaluating investment opportunities has 2
been proven successful all of the time."20 3
In their study guide, the National Society of Rate of Return Analysts state, "No cost of 4
equity model or other concept is recommended or emphasized, nor is any procedure for 5
employing any model recommended . . . it remains important to recognize that alternative 6
methods exist and have merit in cost of capital estimation. To this end, analysts should be 7
knowledgeable of a broad spectrum of cost of capital techniques and issues."21 8
Several different models should be employed to measure accurately the market-required 9
cost of equity reflected in the price of stock. Therefore, I used three recognized methods 10
including the DCF shown on Schedule 12, the CAPM shown on Schedule 17, and the RP 11
shown on Schedule 18. 12
DISCOUNTED CASH FLOW 13
Q. PLEASE EXPLAIN THE DISCOUNTED CASH FLOW MODEL. 14
A. The DCF, is based upon the assumption that the price of a share of stock is equal to a future 15
stream of cash flows to which the holder is entitled. The stream of cash flows is 16
discounted at the investor-required cost rate (cost of capital). 17
Although the traditional DCF assumes a stream of cash flow into perpetuity, a termination, 18
or sale price can be calculated at any point in time. Therefore, the return rate to the 19
stockholder consists of cash flow (earnings or dividends) received and the change in the 20
price of a share of stock. The cost of equity is defined as: 21
20Editorial Policy, AAII Journal, American Association of Individual Investors, Volume 18, No. 1, January 1996, p. 1. 21David C. Parcell, The Cost of Capital - A Practitioners Guide, National Society of Rate of Return Analysts, 1995 Edition.

35
...the minimum rate of return that must be earned on equity finance 1 and investments to keep the value of existing common equity 2 unchanged. This return rate is the rate of return that investors 3 expect to receive on the Company's common stock . . . the dividend 4 yield plus the capital gains yield . . . 22(Emphasis added) 5 6
Q. PLEASE EXPLAIN HOW YOU CALCULATED YOUR DIVIDEND YIELD IN 7
THE DCF SHOWN ON SCHEDULE 12. 8
A. As shown on page 1 of Schedule 12, I used the average dividend yield of 2.1% for the 9
Water Group. The individual dividend yields are shown on page 2 of Schedule 12 and are 10
based upon the most recent months' yield, March 2018, and the twelve-month average 11
yield, ending March 2018. The second input to a market DCF calculation is the 12
determination of an appropriate share price growth rate. 13
Q. WHAT SOURCES OF GROWTH RATES DID YOU REVIEW? 14
A. I reviewed both historical and projected growth rates. Schedule 13 shows the array of 15
projected growth rates for the Comparable Companies that are published. Specific 16
historical growth rates are not shown because I believe the meaningful historical growth 17
rates are already considered when analysts arrive at their projected growth rates. 18
Nonetheless, some investors may still rely on historical growth rates. 19
Q. PLEASE EXPLAIN THE SOURCES OF THE PROJECTED GROWTH RATES 20
SHOWN ON SCHEDULE 13. 21
A. I relied upon four sources for projected growth rates, First Call, Reuters, Zacks Investment 22
Research and Value Line.23 23
22J. Fred Weston and Eugene F. Brigham, Essentials of Managerial Finance, 3rd ed. (The Dryden Press), 1974, p. 504. 23With the exception of Value Line, the earnings growth rate projections are consensus estimates five-year EPS estimates. These consensus estimates are compiled from more than 1,700 financial analysts and brokerage firms nationwide. It should be noted that none of the consensus forecasts provides projected DPS estimates. Value Line publishes projected Cash flow, EPS and DPS five-year growth projections as well.

36
Q. DID YOU REVIEW ANY OTHER GROWTH RATES BESIDES THOSE SHOWN 1
ON SCHEDULE 13? 2
A. Yes. I reviewed EPS growth rates reflecting changes in return rates on book common 3
equity (ROE) over time. I summarized recent ROEs on page 1 of Schedule 14, and 4
compared those to the Water Group's higher levels projected to be achieved by Value Line, 5
as shown on page 2 of Schedule 14. ROEs increase when EPS grows at much 6
higher/faster rates than book value. 7
I also reviewed industry specific average projected growth rates that are published by Zacks 8
for the industries in which the Comparable Companies operate. According to Zacks, the 9
Water Group's industry is projected to have EPS growth rates that average 9.1% over the 10
next five years. 11
Q. WHAT DO YOU CONCLUDE FROM THE GROWTH RATES YOU HAVE 12
REVIEWED? 13
A. Table 7 summarizes some of the various growth rates reviewed. 14
Summary of Growth Rates
Water Group
Projected 5 Year Growth in EPS 7.2
Actual 5 Year Growth in EPS 9.3
Projected 5 Year Growth in DPS 7.8
Projected 5 Year Growth in EPS for the industry 9.1
15
Table 7 16
Academic studies suggest that growth rate conclusions should be tested for reasonableness 17
against long-term interest rate levels. Further, the minimum growth rate must at least 18

37
exceed expected inflation levels. Otherwise, investors would experience decreases in the 1
purchasing power of their investment. Finally, the combined result of adding the growth 2
rate to the market value dividend yield must provide a sufficient margin over yields of 3
public utility debt. 4
Q. WHAT METHOD DID YOU USE TO ARRIVE AT YOUR GROWTH RATE 5
CONCLUSION? 6
A. No single method is necessarily the correct method of estimating share value growth. It 7
is reasonable to assume that investors anticipate that the Water Group's current ROE will 8
expand to higher levels. The published historical earnings growth rates for the Water 9
Group averages 9.3%. Because there is not necessarily any single means of estimating 10
share value growth, I considered all of this information in determining a growth rate 11
conclusion for the Comparable Companies. 12
Moreover, while some rate of return practitioners would advocate that mathematical 13
precision should be followed when selecting a growth rate; the fact is that investors do not 14
behave in the same manner when establishing the market price for a stock. Rather, 15
investors consider both company-specific variables and overall market sentiment such as 16
inflation rates, interest rates and economic conditions when formulating their capital gains 17
expectations. This is especially true when one considers the relatively meaningless 18
negative growth rates. That is, use of a negative growth rate in a DCF implies that 19
investors invest with the expectation of losing money. 20
The range of growth rates previously summarized supports the reasonableness of an 21
expected 7.2% growth rate for the Water Group based primarily on the projected five-year 22
growth rates and the Water Group's industry projected EPS growth rates of 9.1%. Like the 23

38
projected growth rates, these investor-expected growth rate of 7.2% is based on a survey 1
of projected and historical growth rates published by established entities, including First 2
Call, Reuters, Zacks Investment Research and Value Line. Use of information from these 3
unbiased professional organizations provides an objective estimation of investor's 4
expectations of growth. Based on the aforesaid, all growth rates for the Comparison 5
Companies have been considered and have been given weight in determining a 7.2% 6
growth rate for the Water Group. 7
Q. WHAT IS YOUR MARKET VALUE DCF ESTIMATE FOR THE COMPARABLE 8
COMPANIES? 9
A. The market value DCF cost rate estimate for the Water Group is 9.4%, as detailed on page 1 10
of Schedule 12. 11
Q. ARE THERE OTHER CONSIDERATIONS THAT SHOULD BE TAKEN INTO 12
ACCOUNT IN REVIEWING A MARKET VALUE CAPITALIZATION DCF 13
COST RATE ESTIMATE? 14
A. Yes. It should be noted that although I recommend specific dividend yields for the 15
Comparable Group, I recommend that less weight be given to the resultant market value 16
DCF cost rate due to the market's current market capitalization ratios and the impact that 17
the market-to-book ratio has on the DCF results. The Comparable Companies' current 18
market-to-book ratios of 291% and low dividend yields are being affected by the 19
aforementioned policy of the Federal Reserve that has resulted in the mispricing of capital 20
due to artificial interest rates, not DCF fundamentals. 21
Although the DCF cost for common equity appears to be based upon mathematical 22
precision, the derived result does not reflect the reality of the marketplace since the model 23

39
proceeds from unconnected assumptions. The traditional DCF derived cost rate for 1
common equity will continuously understate or overstate investors' return requirements as 2
long as stock prices continually sell above or below book value. A traditional DCF model 3
implicitly assumes that stock price will be driven to book value over time. However, such 4
a proposition is not rational when viewed in the context of an investor purchasing stock 5
above book value. It is not rational to assume that an investor would expect share price to 6
decrease 66% (100%÷291%=34%-100%=66%) in value to equal book value. 7
Utility stocks do not trade in a vacuum. Utility stock prices, whether they are above or 8
below book value, reflect worldwide market sentiment and are not reflective of only one 9
element. 10
Q. WHAT DO YOU MEAN BY YOUR STATEMENT THAT UTILITY STOCKS ARE 11
NOT TRADED IN A VACUUM? 12
A. Utility stocks cannot be viewed solely by themselves. They must be viewed in the 13
context of the market environment. Table 8 summarizes recent market-to-book ratios 14
("M/B") for well-known measures of market value reported in the April 30, 2018 issue of 15
Barron's and the Water Group’s average M/B as shown on page 1 of Schedule 14. 16
M/B Ratios(%)
Dow Jones Industrials 418
Dow Jones Transportation 412
Dow Jones Utilities 206
S&P 500 323
S&P Industrials 420
Vs.
Water Group 291
Table 8 17

40
Utility stock investors view their investment decisions compared with other investment 1
alternatives, including those of the various market measures shown in Table 8. 2
Q. HOW DOES A TRADITIONAL DCF IMPLICITLY ASSUME THAT MARKET 3
PRICE WILL EQUAL BOOK VALUE? 4
A. Under traditional DCF theory, price will equal book value (M/B=1.00) only when a 5
company is earning its cost of capital. Traditional DCF theory maintains that a company 6
is under-earning its cost of capital when the market price is below book value (M/B<1.00), 7
while a company over-earning its cost of capital will have a market price above its book 8
value (M/B>1.00). If this were true, it would imply that the capitalistic free-market is not 9
efficient because the overwhelming majority of stocks would currently be earning more 10
than their cost of capital. Table 8 shows that most stocks sell at an M/B that is greater 11
than 1.0. 12
Q. PLEASE EXPLAIN WHY SUCH A PHENOMENON WOULD SHOW THAT THE 13
CAPITALISTIC FREE-MARKET IS NOT EFFICIENT. 14
A. Historically, the S&P Industrials, which represented approximately 400 companies, have 15
sold at an M/B as low as 1.0 only one time out of the past 53 years (period 1947-1999). 16
Based upon the traditional DCF assumption, which suggests that companies with M/Bs 17
greater than 1.0 earn more than their cost of capital, this data would suggest that the S&P 18
Industrial companies have earned more than their cost of capital while competing in a 19
competitive environment over the past 53 years. In a competitive market, new companies 20
would continually enter the market up to the point that the earnings rate was at least equal 21
to their cost of capital. 22
41
During this period the S&P Industrials sold at an average M/B of 223.7% while 1
experiencing a ROE of 15.7% over a period in which interest rates averaged 7.2%. It is 2
important to note that the average ROE of 14.7% is relative to a common equity ratio of 3
more than 60% for the S&P Industrials over many years. 4
Q. WHAT IS THE SIGNIFICANCE OF INDUSTRIAL COMPANIES' M/B AND THE 5
COST OF CAPITAL FOR A WATER UTILITY? 6
A. As stated previously, utility stocks do not trade in a vacuum. They must compete for 7
capital with other firms including industrial stocks. Over time, there has been a 8
relationship between M/Bs of industrial stocks and utility stocks. Although industrial 9
stocks have sold at a higher multiple of book value than utility stocks, both have tracked in 10
similar directions. Because utility 'and industrial stock' prices relative to book values' 11
move in similar directions, it is irrational to conclude that stock prices that are different 12
from book value, either higher or lower, suggests that a firm is over-or under-earning its 13
cost of capital when competitive free-markets exist. 14
Q. DOES THE MARKET VALUE DCF PROVIDE A REASONABLE ESTIMATE OF 15
THE WATER GROUP'S COMMON EQUITY COST RATE? 16
A. No, the DCF only provides a reasonable estimate of the Comparable Group's common 17
equity cost rate when their market price and book value are similar (M/B=100%).24 A 18
DCF will overstate a common equity cost rate when M/Bs are below 100% and understate 19
when they are above 100%. Since the Comparable Group's current M/Bs average 291%, 20
the DCF understates their common equity cost rate. Schedule 15 provides a numerical 21
illustration of the impact of M/Bs on investors' market returns and DCF returns. The 22
24Roger A Morin, Regulatory Finance - Utilities' Cost of Capital, Public Utility Reports, Inc., 1994, pp. 236-237.

42
reason that DCF understates or overstates investors' return requirements depending upon 1
M/B levels is because a DCF-derived equity cost rate is applied to a book value rate base 2
while investors' returns are measured relative to stock price levels. Based upon this, I 3
recommend that less weight be given to the market value DCF cost rate unless the increased 4
financial risk, resulting from applying a market value cost rate to a book value, is accounted 5
for. 6
Q. HOW DO YOU RESOLVE THE FINANCIAL RISK DIFFERENCE BETWEEN 7
MARKET VALUE COST RATES AND BOOK VALUE COST RATES? 8
A. The basic proposition of financial theory regarding the economic value of a company is 9
based on market value. That is, a company's value is based on its market value weighted 10
average cost of capital.25 Accordingly, the market value derived cost rate reflects the 11
financial risk or leverage associated with capitalization ratios based on market value, not 12
book value. As shown on page 1 of Schedule 16, for the Water Group there is a large 13
difference in leverage as a result of the average $2,446 million difference in market value 14
common equity and book value common equity. This difference in market values and 15
book values results in debt/equity ratios based on market value of 23%/77% (debt/equity) 16
verses 45%/55% (debt/equity) based on book value as shown on page 1 of Schedule 16. 17
Differences in the amount of leverage employed can be quantified based upon the 18
Comparable Group's leveraged beta being "unleveraged" through the application of the 19
"Hamada Formula". The details of the model are shown on page 2 of Schedule 16. For 20
example, the inputs to the formula for the Water Group market value capitalization consist 21
of their leveraged beta of 0.74, debt ratio of 22.5%, preferred stock ratio of 0.1%, common 22
25Shannon P. Pratt, Cost of Capital, John Wiley & Sons, Inc., 1998, pp. 45-46.

43
equity ratio of 77.4% and combined tax rate of 21.00%. The group's unleveraged beta is 1
determined to be .55 through the use of the following Hamada formula: 2
Bl = Bu (1 + (1 - t) D/E + P/E) 3
where: 4
Bl = observed, leveraged beta 5
Bu = calculated, unleveraged beta 6
t = income tax rate 7
D = debt ratio 8
P = preferred stock ratio 9
E = common equity ratio 10
Applying the unleveraged beta of 0.60 along with the Water Group’s book value 11
capitalization ratios of 44.9% long-term debt, 0.1% preferred stock and 55.0% common 12
equity and combined tax rate of 21.00% results in a leveraged beta of .84 applicable to the 13
group’s book value capitalization. Based upon the Water Group’s risk premium of 5.7% 14
and the difference between Water Group's market value leveraged beta, their book value 15
leveraged beta of 0.25 (0.99 - 0.74) indicates that the Water Group’s common equity cost 16
rate must be increased by 1.43 (0.25 x 5.7 = 1.43) in recognition of their book value’s 17
exposure to more financial risk. 18
Q. IS THERE ANOTHER WAY TO REFLECT THE FINANCIAL RISK 19
DIFFERENCE THAT EXISTS AS A RESULT OF MARKET CAPITALIZATION 20
RATIOS BEING SIGNIFICANTLY DIFFERENT FROM BOOK VALUE 21
CAPITALIZATION RATIOS? 22
A. Yes, generally speaking. Although it is possible to know the direction of a financial risk 23
adjustment on common equity cost rate, a specific quantification of financial risk 24

44
differences is very difficult. Although the end result of a financial risk adjustment is very 1
subjective and specific quantification very difficult, the direction of the adjustment is 2
clearly known. However, hypothetically if the Comparable Group's debt were rated based 3
on market value debt ratios they would command an Aaa rating. The Comparison Group 4
currently has bonds rated A based upon their book value debt ratios. The yield spread on 5
a bond rated Aaa versus A rated bonds averages 24 basis points or 0.24% as shown on page 6
3 of Schedule 16. 7
The end result of the application of the Hamada Model and the bond yield spread indicates 8
that the Water Group market value common equity cost rate equity cost rate should be 9
adjusted upward by at least 0.8% (1.4% hamada est. + 0.2% yield spread = 1.6% ÷ 2 = 10
0.8%) since it is going to be applied to a book value. 11
Accounting for the increased amount of leverage between market value derived DCF cost 12
rates and book value cost rates indicates a book value DCF cost rate of 10.2% for the Water 13
Group (9.4% + 0.8% = 10.2%). 14
CAPITAL ASSET PRICING MODEL 15
Q. PLEASE BRIEFLY DESCRIBE THE THEORY OF THE CAPITAL ASSET 16
PRICING MODEL. 17
A. The CAPM is based upon the assumption that investors hold diversified portfolios and that 18
the market only recognizes or rewards non-diversifiable (or systematic) risk when 19
determining the price of a security because company-specific risk (or non-systematic) is 20
removed through diversification. Further, investors are assumed to require additional or 21
higher returns for assuming additional or higher risk. This assumption is captured by 22
using a beta that provides an incremental cost of additional risk above the base risk-free 23

45
rate available to investors. The beta of a security reflects the market risk or systematic 1
risk of the security relative to the market. The beta for the market is always equal to 1.00; 2
therefore, a company whose stock has a beta greater than 1.00 is considered riskier than 3
the market, and a company with a beta less than 1.00 is considered less risky than the 4
market. The base risk-free rate is assumed to be a U.S. Government treasury security 5
because they are assumed to be free of default risk. 6
Q. WHAT RISK-FREE RATE AND BETA HAVE YOU USED IN YOUR CAPM 7
CALCULATION? 8
A. The risk-free rate used in CAPM should have approximately the same maturity as the life 9
of the asset for which the cost rate is being determined. Because utility assets are long-10
lived, a long-term Treasury Bond yield serves as an appropriate proxy. Previously, I 11
estimated an appropriate risk-free rate of 3.2% based upon the recent and forward long-12
term Treasury yields. I used the average beta of 0.74 for the Water Group as shown on 13
page 1 of Schedule 17. However, as stated previously, the Comparable Group's betas are 14
understated due to their small size' which affects their stock price changes. 15
Q. AFTER DEVELOPING AN APPROPRIATE BETA AND RISK-FREE RATE, 16
WHAT ELSE IS NECESSARY TO CALCULATE A CAPM DERIVED COST 17
RATE? 18
A. A market premium is necessary to determine a traditional CAPM derived cost rate. The 19
market return rate is the return expected for the entire market. The market premium is 20
then multiplied by the company specific beta to capture the incremental cost of additional 21
risk (market premium) above the base risk-free rate (long-term treasury securities) to 22
develop a risk adjusted market premium. For example, if you conclude that the expected 23

46
return on the market as a whole is 15% and further assume that the risk-free rate is 8%, 1
then the market premium is shown to be 7% (15% - 8% = 7%). 2
Further, assume there are two companies, one of which is considered less risky than the 3
market, and therefore has a beta of less than 1.00 or 0.80. The second company has a beta 4
that is greater than 1.00 or 1.20, and is therefore considered riskier than the market. By 5
multiplying the hypothetical 7.0% market premium by the respective betas of 0.80 and 6
1.20, risk adjusted market premiums of 5.6% (7.0% x 0.80) and 8.4% (7.0% x 1.20) are 7
shown for the company considered less risky than the market and for the company 8
considered more risky than the market, respectively. 9
Adding the assumed risk-free rate of 8% to the risk adjusted market premiums results in 10
the CAPM derived cost rates of 13.6% (5.6% + 8.0%) for the less risky company and 16.4% 11
(8.4% + 8.0%) for the company considered of greater risk than the market. In fact, the 12
result of this hypothetical CAPM calculation shows that: (1) the least risky company, with 13
the beta of 0.80, has a cost rate of 13.6%; (2) the market, with the beta of 1.00, has a cost 14
rate of 15.0%; and (3) that the higher risk company, with a beta of 1.20, has a cost rate of 15
16.4%. 16
Q. HOW DID YOU DEVELOP A MARKET PREMIUM FOR YOUR CAPM? 17
A. The average projected market premium of 6.3% is developed on page 2 of Schedule 17. 18
It is based upon Value Line's average projected total market return for the next three to five 19
years of 9.5% less the risk free rate of 3.2%. I also reviewed market premiums derived 20
from Ibbotson Associates' most recent publication concerning asset returns that show a 21
market premium of 6.9%. The Ibbotson Associates' market premium may be on the low 22
side reflective of the higher interest rate environment found during their study (i.e., 5.0%). 23

47
Equally, the Value Line market premium reflects the Federal Reserve’s current artificial 1
interest rate levels while the Ibbotson Associates' market premiums reflect a higher interest 2
rate environment. 3
Q. HOW DID YOU ADJUST FOR THE IMPACT THAT SIZE HAS ON THE 4
COMPARABLE GROUP'S BETA? 5
A. The adjustment is reflected in the CAPM size premium. The CAPM size premium is 6
developed on page 4 of Schedule 17. The size premium reflects the risks associated with 7
the Comparable Group's small size and its impact on the determination of their beta. This 8
adjustment is necessary because beta (systematic risk) does not capture or reflect the 9
Comparable Group's small size. I reduced the size premium by the ratio of the 10
Comparison Group's beta to their respective market quartile's beta. 11
Q. WHAT IS THE COMPARISON GROUP'S MARKET COST OF EQUITY BASED 12
UPON YOUR CAPM CALCULATION? 13
A. The CAPM based on Ibbotson Associates' historical market returns shows a market cost 14
rate of 9.3% for the Water Group. The CAPM based on Value Line's projected market 15
returns shows an 8.9% for the Water Group, as shown on page 1 of Schedule 17. The 16
historical market returns have been impacted a higher interest rate environment premium 17
the projected market return reflects the Federal Reserve’s current artificial interest rate 18
levels. The Comparable Group's average market value CAPM of 9.1% is based 50% on 19
the results of the historical market returns and 50% on the projected market returns. 20
Adjusting the market value CAPM based upon the end result of the application of the 21
Hamada Model and the bond yield spread to account for the difference in leverage between 22
48
market value capitalization ratios and book value ratios discussed previously indicates a 1
cost rate of 9.9% for the Water Group applicable to book value (9.1% + 0.8% = 9.9%). 2
RISK PREMIUM 3
Q. WHAT IS A RISK PREMIUM? 4
A. A risk premium is the common equity investors' required premium over the long-term debt 5
cost rate for the same company, in recognition of the added risk to which the common 6
stockholder is exposed versus long-term debtholders. Long-term debtholders have a 7
stated contract concerning the receipt of dividend and principal repayment whereas 8
common stock investors do not. Further, long-term debtholders have the first claim on 9
assets in case of bankruptcy. A risk premium recognizes the higher risk to which a 10
common stock investor is exposed. The risk premium-derived cost rate for common 11
equity is the simplest form of deriving the cost rate for common equity because it is nothing 12
more than a premium above the prospective level of long-term corporate debt. 13
Q. WHAT IS THE APPROPRIATE ESTIMATED FUTURE LONG-TERM 14
BORROWING RATE FOR THE COMPARABLE COMPANIES? 15
A. The estimated near term long-term borrowing rate for the Comparable Companies is 4.4% 16
based upon their credit profile that supports an A bond rating. 17
Q. WHAT IS THE APPROPRIATE RISK PREMIUM TO BE ADDED TO THE 18
FUTURE LONG-TERM BORROWING RATE? 19
A. To determine a common equity cost rate, it is necessary to estimate a risk premium to be 20
added to the Comparable Group's prospective long-term debt rate. Investors may rely 21
upon published projected premiums; they also rely upon their experiences of investing in 22
ultimately determining a probabilistic forecasted risk premium. 23
49
Projections of total market returns are shown on page 2 of Schedule 18. A projected risk 1
premium for the market can be derived by subtracting the debt cost rate from the projected 2
market return as shown on page 2 of Schedule 18. However, the derived risk premium for 3
the market is not directly applicable to the Comparable Companies because they are less 4
risky than the market. The use of 90% of the market's risk is a conservative estimation of 5
their level of risk as compared to the market. 6
The midpoint of the risk premium range is 4.7 and the average for the most recent quarter 7
is 5.1% as shown on page 2 of Schedule 18. Based on this, a reasonable estimate of a 8
longer term projected risk premium is 5.1%. 9
Q. HOW DO INVESTORS' EXPERIENCES AFFECT THEIR DETERMINATION OF 10
A RISK PREMIUM? 11
A. Returns on various assets are studied to determine a probabilistic risk premium. The most 12
noted asset return studies and resultant risk premium studies are those performed by 13
Ibbotson Associates. However, Ibbotson Associates has not performed asset return 14
studies concerning public utility common stocks. Based upon Ibbotson Associates' 15
methodology of computing asset returns, I calculated annual returns for the S&P utilities 16
and bonds for the period 1928-2016. The resultant annual returns were then compared to 17
determine a recent risk premium from a recent 20-year period, 1987-2016 and subsequent 18
periods that were each increased by ten years until the entire study period was reviewed 19
(pages 3 and 4 of Schedule 18). 20
A long-term analysis of rates of return is necessary because it assumes that investors' 21
expectations are, on average, equal to realized long-run rates of return and resultant risk 22
premium. Observing a single year's risk premium, either high or low, may not be consistent 23

50
with investors' requirements. Further, studies show a mean reversion in risk premiums. 1
In other words, over time, risk premiums revert to a longer-term average premium. 2
Moreover, since the expected rate of return is defined as "the rate of return expected to be 3
realized from an investment; the mean value of the probability distribution of possible 4
results,"26 a long-term analysis of annual returns is appropriate. 5
Q. WHAT DO YOU CONCLUDE FROM THE INFORMATION SHOWN ON 6
PAGES 3 AND 4 OF SCHEDULE 18? 7
A. The average of the absolute range of the S&P Utilities’ appropriate average risk premium 8
(i.e., bonds rated AAA to A) was 4.0% during the seven periods studied, as calculated from 9
page 3 of Schedule 18. The credit adjusted longer term risk premiums (i.e., bonds rated 10
A), 1928-2016, and averages 4.4%. The appropriate average (i.e., bonds rated AAA to A) 11
longer term risk premiums, 1928-2016, have an absolute range of 4.3% to 5.0%, and 12
averages 4.6%. 13
The aforementioned premiums are based on total returns for bonds; and reflect their price 14
risk. A bond's price risk is not related to its credit quality and is eliminated when a bond 15
is held to maturity from time of purchase. Using the income returns, page 4 of Schedule 16
18, for bonds eliminates price risk and better measures an investor's required return based 17
on credit quality. The appropriate average risk premium (i.e., bonds rated AAA to A) 18
based on income returns was 4.7% during the seven periods studied. The credit adjusted 19
longer term risk premiums (i.e., bonds rated A), 1928-2016, and averages 4.6%. The 20
appropriate average (i.e., bonds rated AAA to A) longer term risk premiums, 1928-2016, 21
have an absolute range of 4.6% to 4.9%, and averages 4.8%. 22
26Eugene F. Brigham, Fundamentals of Financial Management, Fifth Edition, The Dryden Press, 1989, p. 106.
51
Q. WHAT INFORMATION IS SHOWN ON PAGE 5 OF SCHEDULE 18? 1
A. Page 5 of Schedule 18 proves and measures the negative relationship between interest rate 2
levels and the resulting risk premium. That is, risk premiums are generally higher when 3
interest rates are low and risk premiums are generally lower when interest rates are high. 4
This was proven by sorting the 89 year period, 1928 to 2016, annual returns based on 5
interest rate level from lowest interest rate to highest interest rate and distributing the 6
results into two equal groups, a 44-year low interest rate environment group and a 45-year 7
high interest rate environment group. 8
During the period 1928 to 2016, the 44 years with the lowest interest rates had an average 9
interest rate of 3.0% and reflected a range of interest rates from 2.0% to 4.1%. This period 10
resembles the current interest rate environment of 3.2% discussed previously regarding the 11
CAPM's risk free rate. The risk premium based on total returns during this low interest 12
rate environment produced the appropriate average (i.e., bonds rated AAA to A) longer 13
term risk premium of 6.5% and a credit adjusted longer term risk premium (i.e., bonds 14
rated A) of 6.2%. The annual income return based risk premium during this low interest 15
rate environment produced the appropriate average (i.e., bonds rated AAA to A) longer 16
term risk premium of 7.2% and a credit adjusted longer term risk premium (i.e., bonds 17
rated A) of 6.8%. 18
However, during the period 1928 to 2016, the 45 years with the highest interest rates had 19
an average interest rate of 7.3% and reflected a range of interest rates from 4.2% to 13.5%. 20
This period is far different from the current interest rate environment of 3.2%. The risk 21
premium based on total returns during the highest interest rate environment produced an 22
average longer term risk premium of 2.7% over bonds rated AAA to A and a credit adjusted 23
52
longer term risk premium (i.e., bonds rated A) of only 2.6%. The annual income return 1
based risk premium during the highest interest rate environment produced the an average 2
longer term risk premium of 2.5% over bonds rated AAA to A and a credit adjusted longer 3
term risk premium (i.e., bonds rated A) of only 2.4%. 4
Over time, risk premiums are mean reverting. They constantly move toward a long-term 5
average reflecting a long-term level of interest rates. That is, an above-average risk 6
premium will decrease toward a long-term average while a below-average risk premium 7
will increase toward a long-term average. In any single year, of course, investor-required 8
rates of return may not be realized and in certain instances, a single year's risk premiums 9
may be negative. Negative risk premiums are not indicative of investors' expectations and 10
violate the basic premise of finance concerning risk and return. Negative risk premiums 11
usually occur only in the stock market's down years (i.e., the years in which the stock 12
markets' return was negative). 13
When interest rate levels are not considered the credit adjusted longer term risk premium 14
(i.e., bonds rated A), 1928-2016, averages 4.6%, discussed previously regarding page 4 of 15
Schedule 21. However, the annual income return based risk premium during the low 16
interest rate environment produced a credit adjusted longer term risk premium (i.e., bonds 17
rated A) of 6.8%. Since this period resembles the current interest rate environment of 18
3.2%, a reasonable estimate of investors risk premium based on historical returns is based 19
on a 50% weighting on the results of the entire 1928-2016 historical market returns and a 20
50% weighting on the results of the low interest rate environment to produce a 5.7% 21
historical risk premium. 22
53
A reasonable estimate of investors risk premium is 5.7%. The estimate of investors risk 1
premium is based 100% on the results of the historical market returns and 0% on the 2
projected market returns because the projections reflect the Federal Reserve’s current 3
artificial interest rate levels. Adding the risk premium of 5.7% for the Comparable Group 4
to the prospective cost of newly-issued long-term debt of 4.4% results in a market value 5
risk premium derived cost rate for common equity of 10.1% as reflected on page 1 of 6
Schedule 18. Adjusting the market value risk premium based upon the end result of the 7
application of the Hamada Model and the bond yield spread to account for the difference 8
in leverage between market value capitalization and book value ratios discussed previously 9
indicates a cost rate of 10.9% applicable to book value (10.1% + 0.8% = 10.9%). 10
SUMMARY OF COMMON EQUITY COST RATE 11
Q. WHAT IS YOUR COMPARABLE GROUP'S COMMON EQUITY COST RATE? 12
A. Based upon the results of the models employed, the Water Group's common equity cost 13
rate is in the range of 9.9% to 10.9% as reflected on Schedule 19. Based upon this data, 14
the common equity cost rate for the Water Group is at least 10.25%. My recommendation 15
is based upon the Water Group's 10.25% common equity cost rate. 16
Q. DO YOU RECOMMEND A COST OF COMMON EQUITY OF 10.25% FOR 17
SWNJ? 18
A. Yes. Based upon the financial analysis and risk analysis, I conclude that the SWNJ is 19
exposed to similar investment risk as the Comparable Group. This is evidenced by the 20
factors summarized in Table 5 discussed previously. 21

54
The results of the three models employed for the Water Group shows a current range of 1
common equity cost applicable to book value for the SWNJ of 10.20% (DCF), 9.90% 2
(CAPM), and 10.90% (RP) as shown in Table 9. 3
Summary of the SWNJ's Equity
Cost Rates
DCF 10.20 CAPM 9.90 RP 10.90
Table 9 4
Q. WHAT IS YOUR COMMON EQUITY COST RATE RECOMMENDATION FOR 5
THE SWNJ? 6
A. As discussed above and as shown in Schedule 19, I recommend a 10.25% common equity 7
cost rate for the SWNJ. 8
Q. HAVE YOU CHECKED THE REASONABLENESS OF YOUR RECOMMENDED 9
COMMON EQUITY RATE FOR THE SWNJ? 10
A. Yes. Page 2 of Schedule 14 reflects the average projected earned return on average book 11
common equity for the companies in Comparable Group for the period 2021-2023, which 12
is shown to range from 10.5% to 14.0%. Given the large degree to which regulatory lag 13
and attrition impacts water utilities earning, the range of the comparable utilities' projected 14
earned returns suggests that my recommendation that the SWNJ be permitted an 15
opportunity to earn 10.25% is reasonable, if not conservative. 16

55
OVERALL RATE OF RETURN RECOMMENDATION 1
Q. WHAT IS YOUR OVERALL FAIR RATE OF RETURN RECOMMENDATION 2
FOR THE SWNJ? 3
A. Based upon the recommended capital structure and my estimate of the SWNJ's common 4
equity cost rate, I recommend an overall fair rate of return of 7.68%. The details of my 5
recommendation are shown on Schedule 1. 6
Q. HAVE YOU TESTED THE REASONABLENESS OF YOUR OVERALL FAIR 7
RATE OF RETURN RECOMMENDATION? 8
A. Yes. If my recommended overall rate of return is actually earned, it will give the SWNJ 9
ratios that will allow the SWNJ to present a financial profile that will enable it to attract 10
capital necessary to provide safe and reliable water and wastewater service, at reasonable 11
terms. 12
Q. DOES THAT CONCLUDE YOUR DIRECT TESTIMONY? 13
A. Yes, it does. 14

1
APPENDIX A
Professional Qualifications of
Harold Walker, III Manager, Financial Studies
Gannett Fleming Valuation and Rate Consultants, LLC.
EDUCATION Mr. Walker graduated from Pennsylvania State University in 1984 with a Bachelor of Science Degree in Finance. His studies concentrated on securities analysis and portfolio management with an emphasis on economics and quantitative business analysis. He has also completed the regulation and the rate-making process courses presented by the College of Business Administration and Economics Center for Public Utilities at New Mexico State University. Additionally, he has attended programs presented by The Institute of Chartered Financial Analysts (CFA). Mr. Walker was awarded the professional designation "Certified Rate of Return Analyst" (CRRA) by the Society of Utility and Regulatory Financial Analysts. This designation is based upon education, experience and the successful completion of a comprehensive examination. He is also a member of the Society of Utility and Regulatory Financial Analysts (SURFA) and has attended numerous financial forums sponsored by the Society. The SURFA forums are recognized by the Association for Investment Management and Research (AIMR) and the National Association of State Boards of Accountancy for continuing education credits. Mr. Walker is also a licensed Municipal Advisor Representative (Series 50) by Municipal Securities Rulemaking Board (MSRB) and Financial Industry Regulatory Authority (FINRA). BUSINESS EXPERIENCE Prior to joining Gannett Fleming Valuation and Rate Consultants, LLC., Mr. Walker was employed by AUS Consultants - Utility Services. He held various positions during his eleven years with AUS, concluding his employment there as a Vice President. His duties included providing and supervising financial and economic studies on behalf of investor owned and municipally owned water, waste water, electric, natural gas distribution and transmission, oil pipeline and telephone utilities as well as resource recovery companies.

A-2
In 1996, Mr. Walker joined Gannett Fleming Valuation and Rate Consultants, LLC. In his capacity as Manager, Financial Studies and for the past twenty years, he has continuously studied rates of return requirements for regulated firms. In this regard, he supervised the preparation of rate of return studies in connection with his testimony and in the past, for other individuals. He also assisted and/or developed dividend policy studies, nuclear prudence studies, calculated fixed charge rates for avoided costs involving cogeneration projects, financial decision studies for capital budgeting purposes and developed financial models for determining future capital requirements and the effect of those requirements on investors and ratepayers, valued utility property and common stock for acquisition and divestiture, and assisted in the private placement of fixed capital securities for public utilities. Head, Gannett Fleming GASB 34 Task Force responsible for developing Governmental Accounting Standards Board (GASB) 34 services, and educating Gannett Fleming personnel and Gannett Fleming clients on GASB 34 and how it may affect them. The GASB 34 related services include inventory of assets, valuation of assets, salvage estimation, annual depreciation rate determination, estimation of depreciation reserve, asset service life determination, asset condition assessment, condition assessment documentation, maintenance estimate for asset preservation, establishment of condition level index, geographic information system (GIS) and data management services, management discussion and analysis (MD&A) reporting, required supplemental information (RSI) reporting, auditor interface, and GASB 34 compliance review. Mr. Walker was also the Publisher of C.A. Turner Utility Reports from 1988 to 1996. C.A. Turner Utility Reports is a financial publication which provides financial data and related ratios and forecasts covering the utility industry. From 1993 to 1994, he became a contributing author for the Fortnightly, a utility trade journal. His column was the Financial News column and focused mainly on the natural gas industry. In 2004, Mr. Walker was elected to serve on the Board of Directors of SURFA. Previously, he served as an ex-officio directors as an advisor to SURFA's existing President. In 2000, Mr. Walker was elected President of SURFA for the 2001-2002 term. Prior to that, he was elected to serve on the Board of Directors of SURFA during the period 1997-1998 and 1999-2000. Currently, he also serves on the Pennsylvania Municipal Authorities Association, Electric Deregulation Committee. EXPERT TESTIMONY Mr. Walker has submitted testimony or been deposed on various topics before regulatory commissions and courts in 20 states including: Arizona, California, Colorado, Connecticut, Delaware, Illinois, Indiana, Kentucky, Maryland, Michigan, Missouri, New Hampshire, New Jersey, New York, North Carolina, Oklahoma, Pennsylvania, Vermont, Virginia, and West Virginia. His testimonies covered various subjects including: appropriate capital structure and fixed capital cost rates, depreciation, fair market value, fair rate of return, purchased water adjustments, synchronization of interest charges for income tax purposes, valuation, cash working capital, lead-lag studies, financial analyses of investment alternatives, and fair value. The following tabulation provides a listing of the electric power, natural gas distribution, telephone,

A-3
wastewater, and water service utility cases in which he has been involved as a witness. Additionally, he has been involved in a number of rate proceedings involving small public utilities which were resolved by Option Orders and therefore, are not listed below.
Client Docket No. Alpena Power Company U-10020 Armstrong Telephone Company -
Northern Division 92-0884-T-42T Armstrong Telephone Company -
Northern Division 95-0571-T-42T Artesian Water Company, Inc. 90 10 Artesian Water Company, Inc. 06 158 Aqua Illinois Consolidated Water Divisions
and Consolidated Sewer Divisions 11-0436 Aqua Illinois Hawthorn Woods
Wastewater Division 07 0620/07 0621/08 0067 Aqua Illinois Hawthorn Woods Water Division 07 0620/07 0621/08 0067 Aqua Illinois Kankakee Water Division 10-0194 Aqua Illinois Kankakee Water Division 14-0419 Aqua Illinois Vermilion Division 07 0620/07 0621/08 0067 Aqua Illinois Willowbrook Wastewater Division 07 0620/07 0621/08 0067 Aqua Illinois Willowbrook
Water Division 07 0620/07 0621/08 0067 Aqua Pennsylvania Wastewater Inc A-2016-2580061 Aqua Pennsylvania Wastewater Inc A-2017-2605434 Aqua Virginia - Alpha Water Corporation Pue-2009-00059 Aqua Virginia - Blue Ridge Utility Company, Inc. Pue-2009-00059 Aqua Virginia - Caroline Utilities, Inc. (Wastewater) Pue-2009-00059 Aqua Virginia - Caroline Utilities, Inc. (Water) Pue-2009-00059 Aqua Virginia - Earlysville Forest Water Company Pue-2009-00059 Aqua Virginia - Heritage Homes of Virginia Pue-2009-00059 Aqua Virginia - Indian River Water Company Pue-2009-00059 Aqua Virginia - James River Service Corp. Pue-2009-00059 Aqua Virginia - Lake Holiday Utilities, Inc.
(Wastewater) Pue-2009-00059 Aqua Virginia - Lake Holiday Utilities, Inc. (Water) Pue-2009-00059

A-4
Aqua Virginia - Lake Monticello Services Co. (Wastewater) Pue-2009-00059
Aqua Virginia - Lake Monticello Services Co. (Water) Pue-2009-00059 Aqua Virginia - Lake Shawnee Pue-2009-00059 Aqua Virginia - Land'or Utility Company (Wastewater) Pue-2009-00059 Aqua Virginia - Land'or Utility Company (Water) Pue-2009-00059 Aqua Virginia - Mountainview Water Company, Inc. Pue-2009-00059 Aqua Virginia - Powhatan Water Works, Inc. Pue-2009-00059 Aqua Virginia - Rainbow Forest Water Corporation Pue-2009-00059 Aqua Virginia - Shawnee Land Pue-2009-00059 Aqua Virginia - Sydnor Water Corporation Pue-2009-00059 Aqua Virginia - Water Distributors, Inc. Pue-2009-00059 Borough of Hanover R-2009-2106908 Borough of Hanover R-2012-2311725 Borough of Hanover R-2014-242830 Chaparral City Water Company W 02113a 04 0616 California-American Water Company CIVCV156413 Connecticut-American Water Company 99-08-32 Connecticut Water Company 06 07 08 Citizens Utilities Company
Colorado Gas Division - Citizens Utilities Company
Vermont Electric Division 5426 Citizens Utilities Home Water Company R 901664 Citizens Utilities Water Company
of Pennsylvania R 901663 City of Bethlehem - Bureau of Water R-00984375 City of Bethlehem - Bureau of Water R 00072492 City of Bethlehem - Bureau of Water R-2013-2390244 City of Dubois – Bureau of Water R-2013-2350509 City of Dubois – Bureau of Water R-2016-2554150 City of Lancaster Sewer Fund R-00005109 City of Lancaster Sewer Fund R-00049862 City of Lancaster Sewer Fund R-2012-2310366 City of Lancaster Water Fund R-00984567 City of Lancaster Water Fund R-00016114
A-5
City of Lancaster Water Fund R 00051167 City of Lancaster Water Fund R-2010-2179103 City of Lancaster Water Fund R-2014-2418872 Consumers Pennsylvania Water Company
Roaring Creek Division R-00973869 Consumers Pennsylvania Water Company
Shenango Valley Division R-00973972 Country Knolls Water Works, Inc. 90 W 0458 East Resources, Inc. - West Virginia Utility 06 0445 G 42T Elizabethtown Water Company WR06030257 Hampton Water Works Company DW 99-057 Illinois American Water Company 16-0093 Indian Rock Water Company R-911971 Indiana Natural Gas Corporation 38891 Jamaica Water Supply Company - Kentucky American Water Company, Inc. 2007 00134 Middlesex Water Company WR 89030266J Missouri-American Water Company WR 2000-281 Missouri-American Water Company SR 2000-282 Mount Holly Water Company WR06030257 New Jersey American Water Company WR 89080702J New Jersey American Water Company WR 90090950J New Jersey American Water Company WR 03070511 New Jersey American Water Company WR-06030257 New Jersey American Water Company WR08010020 New Jersey American Water Company WR10040260 New Jersey American Water Company WR11070460 New Jersey American Water Company WR15010035 New Jersey American Water Company WR17090985 Newtown Artesian Water Company R-911977 Newtown Artesian Water Company R-00943157 Newtown Artesian Water Company R-2009-2117550 Newtown Artesian Water Company R-2011-2230259 Newtown Artesian Water Company R-2017-2624240 North Maine Utilities 14-0396 Northern Indiana Fuel & Light Company 38770 Oklahoma Natural Gas Company PUD-940000477

A-6
Pennichuck Water Works, Inc. DW 04 048 Pennichuck Water Works, Inc. DW 06 073 Pennichuck Water Works, Inc. DW 08 073 Pennsylvania Gas & Water Company (Gas) R-891261 Pennsylvania Gas & Water Co. (Water) R 901726 Pennsylvania Gas & Water Co. (Water) R-911966 Pennsylvania Gas & Water Co. (Water) R-22404 Pennsylvania Gas & Water Co. (Water) R-00922482 Pennsylvania Gas & Water Co. (Water) R-00932667 Public Service Company of North Carolina, Inc. G-5, Sub 565 Presque Isle Harbor Water Company U-9702 St. Louis County Water Company WR-2000-844 SUEZ Water Owego-Nichols, Inc. 17-W-0528 Town of North East Water Fund 9190 United Water New Rochelle W-95-W-1168 United Water Toms River WR-95050219 Valley Water Systems, Inc. 06 10 07 West Virginia-American Water Company 15-0676-W-42T West Virginia-American Water Company 15-0675-S-42T Wilmington Suburban Water Corporation 94-149 York Water Company R-901813 York Water Company R-922168 York Water Company R-943053