Subtilis Spores
25
2 Detection of Bacillus Spores by Surface-Enhanced Raman Spectroscopy Stuart Farquharson 1 , Chetan Shende 1 , Alan Gift 2 and Frank Inscore 1 1 Real-Time Analyzers, 2 University of Nebraska, Omaha, USA 1. Introduction On September 18 and October 9, 2001, two sets of letters containing Bacillus anthracis spores passed through the United States Postal Service’s Trenton, NJ, Processing and Distribution Center (Jernigan et al., 2001). The first set was destined for Florida and New York, while the second set was destined for Washington, DC. The infection of 22 people by these spores resulted in 5 deaths: a media employee in Florida, two postal workers in DC, a hospital worker in New York, and a retired woman in Connecticut (Inglesby et al., 2002). This bioterrorism event closely followed the September 11, 2001 attack on the Pentagon building and the World Trade Center towers, which added to the nation’s concern about terrorism within US borders. There was additional anxiety associated with this second attack, in that the extent of spore distribution along the east coast was unknown, and it took a long time to determine who was infected. This was even true for the letter that was mailed to Senator Tom Daschle at the Hart Senate Office (HSO) Building in DC. While the powder that fell from the letter was immediately suspected as B. anthracis, due to the previous week’s news from Florida and New York, and collection of nasal swabs from HSO personnel was initiate within 9 hours (Hsu et al., 2002), it still took several additional days to determine who was exposed and infected (Jernigan et al., 2001,). This delay was due to the fact that the spores must be germinated and grown in culture media to sufficient cell numbers so that they can be measured by standard methods. Presumptive B. anthracis was based on shape (1 to 1.5 by 3 to 5 µm rods), lack of motility, lack of a hemolysis on a sheep blood agar plate, susceptibility to -lactam antibiotics and to -phage lysis, and staining for gram-positive bacteria (Center for Disease Control and Prevention, CDC, 2001). The time consuming component of this analysis is the culture growth of cell colonies. Simply put, the fewer the initial number of spores, the less likely a sample will produce detectable colonies. Only samples collected from surfaces or individuals that had a high probability of being contaminated produced colonies that were evident in 24 hours. Furthermore, tests were initially limited to individuals within the vicinity of where the letter was opened, which proved insufficient, as three postal workers at the Brentwood, DC, Processing and Distribution Center became infected, two fatally (Jernigan et al., 2001; Sanderson et al., 2002). Upon notification of their hospitalization, the CDC initiated collection of several hundred environmental (mostly surface) samples from www.intechopen.com
Transcript of Subtilis Spores

8/19/2019 Subtilis Spores
http://slidepdf.com/reader/full/subtilis-spores 1/25
2
Detection of Bacillus Sporesby Surface-Enhanced Raman Spectroscopy
Stuart Farquharson1, Chetan Shende1, Alan Gift2 and Frank Inscore1
1Real-Time Analyzers,2University of Nebraska, Omaha,
USA
1. Introduction
On September 18 and October 9, 2001, two sets of letters containing Bacillus anthracis sporespassed through the United States Postal Service’s Trenton, NJ, Processing and DistributionCenter (Jernigan et al., 2001). The first set was destined for Florida and New York, while thesecond set was destined for Washington, DC. The infection of 22 people by these sporesresulted in 5 deaths: a media employee in Florida, two postal workers in DC, a hospitalworker in New York, and a retired woman in Connecticut (Inglesby et al., 2002). Thisbioterrorism event closely followed the September 11, 2001 attack on the Pentagon buildingand the World Trade Center towers, which added to the nation’s concern about terrorismwithin US borders. There was additional anxiety associated with this second attack, in that
the extent of spore distribution along the east coast was unknown, and it took a long time todetermine who was infected. This was even true for the letter that was mailed to SenatorTom Daschle at the Hart Senate Office (HSO) Building in DC. While the powder that fellfrom the letter was immediately suspected as B. anthracis, due to the previous week’s newsfrom Florida and New York, and collection of nasal swabs from HSO personnel was initiatewithin 9 hours (Hsu et al., 2002), it still took several additional days to determine who wasexposed and infected (Jernigan et al., 2001,).
This delay was due to the fact that the spores must be germinated and grown in culturemedia to sufficient cell numbers so that they can be measured by standard methods.Presumptive B. anthracis was based on shape (1 to 1.5 by 3 to 5 µm rods), lack of motility,
lack of a hemolysis on a sheep blood agar plate, susceptibility to -lactam antibiotics and to-phage lysis, and staining for gram-positive bacteria (Center for Disease Control andPrevention, CDC, 2001). The time consuming component of this analysis is the culturegrowth of cell colonies. Simply put, the fewer the initial number of spores, the less likely asample will produce detectable colonies. Only samples collected from surfaces orindividuals that had a high probability of being contaminated produced colonies that wereevident in 24 hours. Furthermore, tests were initially limited to individuals within thevicinity of where the letter was opened, which proved insufficient, as three postal workersat the Brentwood, DC, Processing and Distribution Center became infected, two fatally(Jernigan et al., 2001; Sanderson et al., 2002). Upon notification of their hospitalization, theCDC initiated collection of several hundred environmental (mostly surface) samples from
www.intechopen.com

8/19/2019 Subtilis Spores
http://slidepdf.com/reader/full/subtilis-spores 2/25
Bioterrorism18
associated facilities and several thousand nasal swab samples from visitors to these facilities,including first responders, and their employees. According to the team at the NationalInstitutes of Health, who processed nearly 4000 samples, current methods of culture growthand analysis were “extremely time-consuming and labor-intensive” (Kiratisin et al., 2002).
From these bioterrorist attacks, it became clear that considerably faster methods of analysisare required. This would expedite assessment of the extent of attack, including the path ofsuch letters from destination back to origination. More importantly, it would minimizefatalities, since it was learned that if exposure is detected within the first few days, themajority of victims can be treated successfully using Ciprofloxacin, doxycycline and/orpenicillin G procaine (Bell et al., 2002).
At the time of the attack two rapid methods were used, immunoassay kits and polymerasechain reaction (PCR) analyzers. Immunoassay methods use competitive binding of thebioagent (as an antigen) and its labeled conjugate for a limited number of antibodies. Thesemethods can be relatively fast (<20 minutes) with modest sensitivity. The latter was not anissue for the Senator Daschle letter, which contained billions of spores (Kennedy, 2001).However, as yet no well-defined anthrax antigen has been identified (Bell et al., 2001;Kellogg, 2010), and as a result, the false-positive rates remain unacceptably high.
Consequently, immunoassay development has shifted to detecting the B. anthracis proteinsinvolved in infection. This includes the protective antigen and lethal factor (Bell et al., 2002;Mabry et al., 2006; Tang et al., 2009). But these immunoassays require several days after theonset of infection for these proteins to reach detectable concentrations, even with the use oftime-resolved fluorescence detection, which may not provide sufficient time to substantiallyimprove the odds of successful treatment (Tang et al., 2006).
During the 2001 bioterrorism event NIH employed Applied Biosystems (Foster City, CA) to
use PCR to sequence the 16S rRNA B. anthracis gene (Kiratisin et al., 2002). However, thespecificity of this gene for B. anthracis was in doubt as Bacilli are highly homologous to theextent that B. anthracis, B. cereus and B. thuringiensis may belong to one species (Helgason etal., 2000, Sacchi et al., 2002). Since the attacks, more definitive B. anthracis gene sequenceshave been identified. Specifically, the genes within the toxin encoding pXO1 plasmid andthe capsule-encoding pXO2 plasmid are being targeted for analysis. The development of“real-time” PCR systems that combine the use of primers to separate these organism-specificnucleic acid sequences and polymerases to amplify the sequences (Bell et al., 2001 & 2002;Thayer, 2003), resulted in the installation of such systems at some 300 regional US Postaloffices through 2006 at a cost of $600 million (Shane, 2004; Leingang, 2004).
While, PCR and immunoassays continue to be developed, other methods are also beingdeveloped that rapidly assess the extent of contamination in the event of an attack, such asfluorescence, luminescence, mass spectrometry, and Raman spectroscopy (Nudelman et al.,2000; Pellegrino et al., 2002; Hathout et al., 2003; Farquharson et al., 2004, respectively).These methods focus on portability and sensitivity, rather than on specificity.
Most of these methods have been focusing on the detection of calcium dipicolinate (CaDPA)or its derivatives as a B. anthracis signature since it has been reported that CaDPA represents10 to 15% by weight of these spores (Fig. 1; Janssen et al., 1958; Murrell at al., 1969; Hindle &Hall, 1999; Ragkousi at al., 2003; Liu et al., 2004; Phillips & Strauch, 2002). This is a validapproach, first because only 13 genera of spore-forming bacteria contain CaDPA (Berkeley
www.intechopen.com
8/19/2019 Subtilis Spores
http://slidepdf.com/reader/full/subtilis-spores 3/25
Detection of Bacillus Spores by Surface-Enhanced Raman Spectroscopy 19
& Ali, 1994),
but only Bacillium and Clostridium are common (and of interest; Phillips &Strauch, 2002), and second, the most widespread, potentially interfering spores, such aspollen and mold spores, do not. Relatively fast methods have been developed to chemicallyextract the acid of CaDPA, dipicolinic acid (DPA; Pellegrino et al., 2002),
and then to detect it
directly by mass spectrometry (Beverly et al., 1996; Hathout et al., 2003),
fluorescence(Nudelman et al., 2000),
or indirectly by luminescence (Pellegrino et al., 2002; Rosen et al.,1997). Although mass spectrometry provides a relatively high degree of discrimination andsensitivity, it still requires significant time due to sample preparation. Hot dodecylamine(DDA) has been used to extract DPA and form a highly luminescent complex with terbium(Pellegrino et al., 2002). Although measurements have been performed in as little as fiveminutes, it was found that as many as three concentration-dependent complexes can form,each with different lifetimes. This, coupled with the fact that the Tb3+ cation produces thesame luminescence spectrum, makes determinations of low spore concentrationsproblematic. Furthermore, the combination of heat and the DDA surfactant severelydegrade the spore, generating cell debris. This requires sample cleanup and in this
particular case, AlCl3 has to be added to remove phosphates that would interfere with thephotoluminescent measurement.
Core
(calcium dipicolinate)
Outer CoreWall
Cortex
Exosporium
Spore Coat
DNA
RibosomesC C
O O
O O N
- -
Ca
2+
Inner CoreWall
Fig. 1. Illustration of a Bacillus spore with major components indicated, and chemicalstructure of calcium dipicolinate. Deprotonated dipicolinic acid is shown within thebrackets.
An alternative method, Raman spectroscopy (RS), is attractive in that very small samples
can be measured without preparation. The sample need only be placed at the focal spot ofthe excitation laser and measured. Moreover, the rich molecular information provided byRaman spectroscopy usually allows unequivocal identification of chemicals and biologicals.As early as 1974 the Raman spectrum of Bacillus megaterium was measured and shown to bedominated by CaDPA (Woodruff et al., 1974). However, the spectrum was collected usingpure spores and took hours to acquire. Since that time, considerable improvements inRaman instrumentation have led to laboratory measurements of single Bacillus spores andfield measurements of spores captured from a mail sorting system (Esposito et al., 2003;Farquharson et al., 2004). Unfortunately, the single spore measurements required the use ofa microscope system and time consuming efforts to locate the spores, while the fieldmeasurements required milligrams of sample.
www.intechopen.com

8/19/2019 Subtilis Spores
http://slidepdf.com/reader/full/subtilis-spores 4/25
Bioterrorism20
Two approaches are widely used to improve the sensitivity of Raman spectroscopy;resonance Raman spectroscopy and surface-enhanced Raman spectroscopy (SERS). Theformer method involves laser excitation at or near the wavelength of a molecular electronicabsorption to substantially increase the interactions between the radiation and molecular
states, and was used more than a decade ago to analyze Bacillus spores (Ghiamati, 1992).
The value of this technique is limited by the extremely low energy conversion of ultravioletlasers, which require substantial power supplies and thus confine measurements tolaboratory settings.
SERS involves the absorption of incident laser photons within nanoscale metal structures,generating surface plasmons, which couple with nearby molecules (the analyte) and therebyenhance the efficiency of Raman scattering by six orders of magnitude or more (Jeanmaire &Van Duyne, 1977; Weaver et al., 1985).
More than a decade ago, we began investigating thepotential of SERS to measure B. anthracis ssp. spores, beginning with the first measurementof the biomarker dipicolinic acid (Farquharson, 1999).
In this chapter we summarize our
efforts to develop a field portable analyzer that uses a simple digesting agent to extract DPAfrom B. anthracis spores for detection by SERS.
The approach and ultimately the success of these efforts not only depend on theinstrumentation, but also on the specific terrorist scenario being addressed. This hassignificant implications for the choice of sampling. For example, detecting a plume of sporesreleased from an airplane is very different than detecting spores in envelopes passingthrough a mail sorting machine. Here the focus is the detection of spores on surfaces toassess the extent of an attack. For this application specificity at the Bacillus spp. level issufficient, i.e. it is not critical to differentiate between the various Bacillus spp. At presentthere are no guidelines defining the required sensitivity. However, an extensive number of
surface samples were collected from the Brentwood, DC, mail Processing and DistributionCenter and their analysis can be used as a guide to estimate sensitivity requirements(Sanderson et al., 2004). This analysis determined that the highest concentrations of spores,not surprisingly, were in the immediate vicinity of delivery barcode sorter machine number17, which processed both letters. Analysis of dust above, within 30 meters, and 30-60 metersof this machine recorded average values of 310, 67, and 10 CFU/in2. Since the last averagevalue included measurements that detected “zero” spores, it lacks the certainty of the othervalues. Consequently, and somewhat subjectively, we have chosen the middle value, 67CFU/in2 (10 spores/cm2), as a minimum requirement for measurement sensitivity. Thisvalue should not be construed as a definition of lethality.
Additional measurement requirements include the ease of sampling and speed of analysis.Based on the 2001 attacks, we consider a minimum requirement of 500 measurements per 24hours as reasonable. Of course more than one analyzer could be used to accomplish this, butthe fewer the analyzers, the lower the cost and the number of operators. If one analyzer isused, then the required measurement time would be less than 3 minutes. This wouldinclude the time to collect, deliver, measure, and analyze the sample. This suggests thatsampling should involve a method or device to rapidly collect the sample (e.g. a wet swabor vacuum system) and deliver it to the measurement compartment of the analyzer. It alsosuggests that the analyzer should be portable to minimize or eliminate sample deliverytime.
www.intechopen.com

8/19/2019 Subtilis Spores
http://slidepdf.com/reader/full/subtilis-spores 5/25
Detection of Bacillus Spores by Surface-Enhanced Raman Spectroscopy 21
With these criteria in mind, we have developed a three-step method to detect dipicolinicacid extracted from surface spores by surface-enhanced Raman spectroscopy. The first stepemploys acetic acid to break apart the spores and release CaDPA into solution as DPA. Thesecond step employs single-use, disposable, sol-gel filled capillaries to separate the DPA
from other cell components and simultaneously deliver it to the SER-active metal particles.The third step employs a portable Raman analyzer to measure the SER spectrum and toidentify and quantify the spores, if present. Development of this three-step method andmeasurements of Bacillus ssp. spores on surfaces are presented.
2. Experimental
Dipicolinic acid (2,6-pyridinedicarboxylic acid), acetic acid (glacial, 99.7%), dodecylamine(DDA), and all chemicals used to produce the silver-doped sol-gels were obtained at theirpurest commercially available grade from Sigma-Aldrich (Milwaukee, WI) and used asreceived. Calcium dipicolinate was prepared from disodium dipicolinate (Na2DPA), which
was prepared from DPA according to previous publications (Ghiamati, 1992). Bacillus cereus,B. subtilis, and B. megaterium were grown on nutrient agar plates at 30ºC for 7 days(Ghiamati, 1992). The vegetative cells were placed into distilled water and lysed by osmoticpressure. The resultant spores were collected by scraping them into distilled water andpelleting them by centrifugation at 12,100 x g for 10 minutes. The spore pellet was re-suspended in distilled water and lyophilized, and scraped into glass vials for Ramanspectral measurements. Approximately 1 gram each, determined to be 99% pure bymicroscopic observation, was produced for this study. The density of the spores varied from 0.06 to 0.11 g/mL, indicating a high amount of entrained air.
Calibrated samples of B. cereus spores were prepared by weighing 1-5 mg specks, dispersing
them in 10 mL water using sonication and vortexing. Sonication was accomplished using anUltrasonik 300 (Neytech, Burlington, NJ), while vortexing was accomplished using a Vortex-Genie 1 (Scientific Industries, Bohemia, NY). The spores per volume water were calibratedby using a Brite-line, phase-contrast hemocytometer counting grid (AO ScientificInstruments, Buffalo, NY) and imaged using an Olympus BX 51 microscope (OlympusAmerica, Center Valley, PA) fit in-house with a Sony Cyber-shot 2.1 digital camera.
An initial stock solution of 20 mg of DPA in 20 mL HPLC grade water (Fischer Scientific,Fair Lawn, NJ) was prepared for the pH study. The pH of this solution was 2.45 as verifiedusing a pH electrode (Corning 314 pH/Temperature Plus, Corning, NY) that had beencalibrated with pH 4.00, 7.00, and 10.00 buffer solutions (Fischer Scientific). For all pH
measurements a single 2-mL glass vial coated with silver-doped sol-gel was used (SimpleSERS Sample Vial, Real-Time Analyzers, Inc. (RTA), Middletown, CT). The vial was nevermoved from the sample holder to ensure that the same portion of silver-doped sol-gel wasexamined. Two pH series were performed. First, 2 mL of the stock solution was added to thevial and measured. Then the 2 mL solution was returned to the stock solution and madebasic using 0.1 M KOH. Prior to re-addition of the solution to the SER-active vial, the vialwas first rinsed three times with distilled water, then twice with the new solution prior toSERS measurement. This procedure was followed to obtain spectra at pH 3.55, 4.33, 4.87,5.59, 10.69 and 11.66. Next the solution was brought to a pH of 2.00 by adding 0.1 M HNO3,and the spectrum was recorded. Again KOH was added drop wise to make the solutionmore basic. Spectra were obtained at pHs of 3.83, 5.10, 7.35 and 8.22. Next HNO3 was added
www.intechopen.com

8/19/2019 Subtilis Spores
http://slidepdf.com/reader/full/subtilis-spores 6/25
Bioterrorism22
drop wise so that spectra could be obtained at pHs of 2.19, 1.71, 1.35 and 1.17. Throughoutthis process, no more than 20 drops of acid or base were added, and therefore theconcentration was diluted by no more than 10%.
For concentration measurements, a second stock solution of DPA was prepared as aboveand used to prepare all lower concentration samples by serial dilution using HPLC gradewater. Initial spore experiments employed 78 oC, 50 mM dodecylamine to digest the sporesand release dipicolinic acid for measurement. Pre-weighed spore particles were placed on aglass plate for these measurements. Final spore measurements employed room temperatureacetic acid to digest the spores. Pre-weighed spores were used to prepare a stock solutionfor calibration using a counting grid (see below), from which a known number of sporeswere dried on a glass plate. For both digesting chemicals, after 1 min exposure, thedegraded spore sample was drawn into a SER-active capillary (Simple SERS Sample Capillary,RTA) for measurement.
The SER-active vials were prepared according to published procedures (Farquharson &Maksymiuk; 2003), using a silver amine precursor to provide the metal dopant and analkoxide precursor to provide the sol-gel matrix. The silver amine precursor consisted of a5/1 v/v ratio of 1N AgNO3 to 28% NH3OH, while the alkoxide precursor consisted of a 2/1v/v ratio of methanol to tetramethyl orthosilicate (TMOS). The alkoxide and silver amineprecursors were mixed in an 8/1 v/v ratio, then 140 µL were introduced into 2 mL glassvials, which were then spin-coated. After sol-gel formation, the incorporated silver ionswere reduced with 0.03M NaBH4. The SER-active capillaries were prepared in a similarmanner with the following modifications. The alkoxide precursor employed a combinationof methyltrimethoxysilane (MTMS) and TMOS in a v/v ratio of 6/1, which was mixed withthe amine precursor in a v/v ratio of 1/1. Approximately 15 μL of the mixed precursors
were then drawn into a 1-mm diameter glass capillary coating a 15-mm length. After sol-gelformation, the incorporated silver ions were again reduced with dilute sodium borohydride.
All Raman spectroscopy measurements were performed using 785 or 1064 nm laserexcitation and Fourier transform Raman spectrometers (RTA, model RamanID-785 and -1064; Farquharson et al., 1999). For pure Na2DPA, CaDPA, and the spore samples 1064 nmexcitation was used, for pure DPA and DPA solutions both 785 and 1064 nm laser excitationwere used, while for all DPA SERS measurements, solutions or extractions, 785 nm laserexcitation was used. Fiber optics were used to deliver the excitation beam to the sampleprobe and the scattered radiation to the interferometer (2 m lengths of 200 and 365 μm corediameter, respectively, Spectran, Avon, CT).
For 1064 nm excitation, a 24 mm diameter f/0.7 aspheric lens focused the beam to a 600 μmspot on the sample and to collect the scattered radiation back along the same axis. An f/2achromat was used to collimate laser beam exiting the source fiber optic, while a 4 mmprism was used to direct the beam through an f/0.7 aspheric lens that focused the beam to a600 micron spot on the sample. The scattered radiation was collected back along the sameoptical axis, while a second f/2 lens focused the beam into the collection fiber optic. A shortpass filter was placed in the excitation beam path to block the silicon Raman scatteringgenerated in the source fiber from reflecting off sampling optics and reaching the detector.A long pass filter was placed in the collection beam path to block the sample Rayleighscattering from reaching the detector. For 785 nm excitation, a similar optic probe was used,
www.intechopen.com
8/19/2019 Subtilis Spores
http://slidepdf.com/reader/full/subtilis-spores 7/25
Detection of Bacillus Spores by Surface-Enhanced Raman Spectroscopy 23
except a dichroic filter was used to reflect the laser light to sample and pass the Ramanscattered radiation to the collection fiber. In this case the beam was focused to a 300 μm spoton the sample. Also, appropriate short and long pass filters were used for this wavelength.All spectra presented were collected using 8 cm-1 resolution.
In the case of Raman spectral measurements of spores, the samples were placed on a glassslide with the probe aimed downward. In the case of SER-active vials or capillaries, thesamples were mounting horizontally on an XY positioning stage (Conix Research,Springfield, OR), so that the probe aimed upwards and the focal point of the aspheric lenswas just inside the vial or capillary.
For the SERS concentration and extraction measurements, nine spectra were recorded alongthe length of the capillary with 1 mm spacing. As a practical approach to minimizing thevariability associated with the SER activity as a function of sample position, the three highand three low intensity spectra were discarded, while the three median spectra wereaveraged and reported. Relative standard deviations for all concentrations are reported aspercent standard deviation in Table 2. SER spectra were collected in 1-min or less asindicated in figure captions.
3. Results and discussion
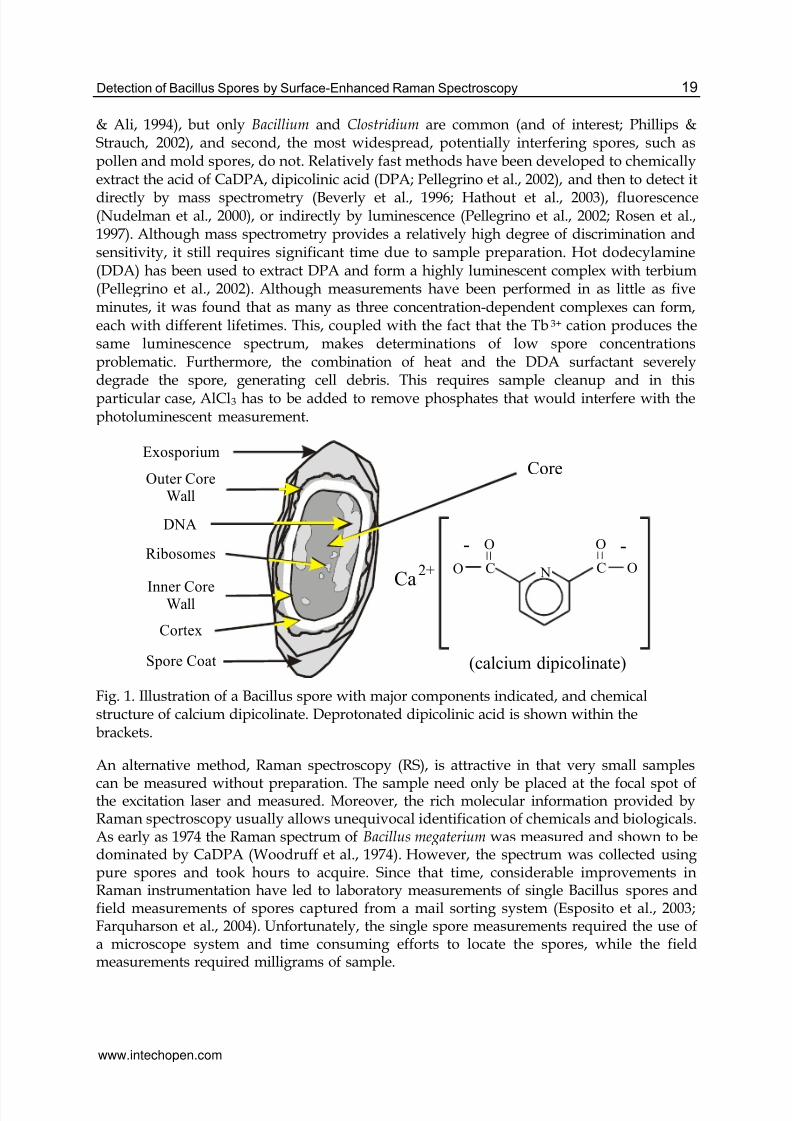
The present application begins with a Raman spectral analysis of Bacillus spores withregards to contributions from calcium dipicolinate. The primary CaDPA peaks occur at 659,821, 1014, 1391, 1446, 1573, 3062, and 3080 cm-1 in the spore spectrum (Fig. 2), and can beassigned to a ring CC bend, an out-of-plane CH bend, the symmetric pyridine ring stretch, asymmetric OCO stretch, a symmetric ring CH bend, an asymmetric OCO stretch, and the
CH symmetric and asymmetric stretches, respectively (Table 1, Farquharson et al., 2004).
Fig. 2. RS of A) Bacillus cereus spores and B) calcium dipicolinate. Spectral conditions: 500mW of 1064 nm at the sample, 5 min acquisition time, 8 cm-1 resolution.
www.intechopen.com

8/19/2019 Subtilis Spores
http://slidepdf.com/reader/full/subtilis-spores 8/25
Bioterrorism24
The remaining peaks can be assigned to protein modes associated with the peptidoglycancell wall, such as amino acids and peptide linkages (amide modes; Woodruff et al., 1974;Ghiamati, 1992; Grasselli et al., 1981; Bandekar, 1992; Austin et al., 1993). The former includepeaks with little intensity at 821, 855, 900 cm-1, which are assigned to several CC bending
modes, as well as the phenylalanine modes that appear at 1003 and 1598 cm -1. The latterinclude the amide I peak at 1666 cm-1, which is primarily a C=O stretch, and amide IIIcombination peaks at 937, 1241, and 1318 cm-1, which are various CC and CN stretchingcombinations (peak positions are given for B. cereus). In several cases, protein and CaDPAvibrational modes occur at or close to the same frequency, such as the 821 and 1446 cm-1 peaks.
Next, the amount of CaDPA available in a spore that could be measured as DPA wasconsidered. Although it is often stated that Bacillus ssp. spores contain 10-15% calciumdipicolinate by weight (Janssen et al., 1958; Liu et al., 2004), this value has been reported aslow as 1% (Halverson, 1961). Since this amount will be used to calculate the number of
spores measured, it is important to have as accurate a number as possible. For this reason,the Raman spectra of Bacillus subtilis, B. megaterium, and B. cereus were acquired (Fig. 3). Infact it was found that the most obvious differences between the spectra for the three Bacillus species are the CaDPA peaks. In particular, the 1014 cm-1 peak noticeably changes intensity,especially when compared to the neighboring phenylalanine peak at 1003 cm-1. If it can beassumed that the composition of these Bacilli is very similar, then it may be assumed that therelative phenylalanine concentration is nearly constant and its Raman peak can be used asan internal intensity standard. (The amide I peak at 1666 cm-1 could also be used.) Usingthe ratio of the CaDPA and phenylalanine peak heights suggests then that the saltconcentrations for B. megaterium and B. cereus are 1.85 and 2.05 times that of B. subtilis. In the
latter case, a recent study using resonance Raman spectroscopy of the same sample
Fig. 3. RS of A) B. subtilis, B) B. megaterium, C) B. cereus, and D) CaDPA. Spectral conditionsas in Fig. 2.
www.intechopen.com

8/19/2019 Subtilis Spores
http://slidepdf.com/reader/full/subtilis-spores 9/25
Detection of Bacillus Spores by Surface-Enhanced Raman Spectroscopy 25
concluded that the CaDPA peak intensity corresponded to 6-7 weight percent (Nelson et al.,2004).
This suggests that the CaDPA weight percent for the B. megaterium and B. cereus sporesamples are 11-13 and 12.5-14.5 wt%, respectively, or in the case of DPA, 9-11 and 10-12 wt%(based on MW). It should be noted that the differences between these Bacillus spp. does not
imply that the CaDPA concentrations are species specific. It is more likely that experimentalconditions during the original growth of the bacteria, such as time, temperature, andavailable nutrients, influenced the extent of sporulation. Consequently, any calculations ofthe number of spores based on DPA content should assume a range of at least 5-13 weightpercent of the spores. As a practical matter 10±5% will be used here.
For comparison purposes, the spectra of CaDPA and DPA are shown in Fig. 4, along withNa2DPA, while the observed spectral peaks with vibrational mode assignments are listed inTable 1. The assignments for both CaDPA and DPA, based on literature (Carmona 1980;Hameka et al., 1996),
were used to assign the peaks observed for Na2DPA. Both DPA andNa2DPA contain unique peaks with significant intensity at 760 and 1730 cm-1, respectively.
Since neither peak is observed in the spectrum of CaDPA, it can be concluded that thissample does not contain either chemical as an impurity.
Fig. 4. RS of A) dipicolinic acid B) disodium dipicolinate, and C) calcium dipicolinate.Spectral conditions as in Fig. 2.
Next, dipicolinic acid was analyzed by SERS. The assignment of SERS peaks to vibrationalmodes is less straightforward than for RS peaks due to the metal-to-molecule surfaceinteractions that shift and enhance various vibrational modes to different extents.Furthermore, it is usually found that RS spectra of analytes in solution more closely matchthe SER spectra than in the solid-state. However, it is usually beneficial to acquire andexamine both when making assignments. Since DPA dissolves in water only sparingly, 1NKOH was used to dissolve 80 mg/mL. The RS spectrum of the solution phase is largely thesame as the solid phase except for some minor changes in peak frequencies, intensities, andwidths (Table 1). Notably, the 760 cm-1 peak in the solid phase is completely absent in thesolution phase, while a new peak at 1386 cm-1 appears in the solution phase. The former
www.intechopen.com

8/19/2019 Subtilis Spores
http://slidepdf.com/reader/full/subtilis-spores 10/25
Bioterrorism26
B. Cereus CaDPA Na2DPA DPA solid DPA solution SERS Tentative Assignments403 413 405433 425 458 CC ring benda 478 499 489 C-CO2 stra
575 573 567659 661 650 646 652 657 CC ring benda 696
760 (795) HO-C=O in-plane defb 805 801
821 820 814 822 812 CC strd, CaDPA CH out-of-plane defb
855 857 856 853 858 CC strd 900 897 CC strd
925 923 CaDPA937 CC str + amide IIId 1003 phe sym ring str.c,d
1014 1015 1003 997 1001 1006 sym ring breathc 1029
1077 1086 1079 1085 1087 trigonal ring breathingb 1150 1150 1147 1153 1154 1157 CH benda
1199 1185 1179 1191 11841227 1230
1241 amide III (b)c,d 1274 1256 1271 CC strb
1293 1296 12851318 CH2 bend, amide IIId
1324 C=O str
1377sh 1383 CH benda 1391 1398 1393 1386 1381 OCO sym strc 1446 1447 1437 1445 1438 (1426) CH2 bend,d CaDPA ring CH
benda or CC strb 1466 1464 1461 1466 ring CC str
1573 1568 1569 1575 1572 1567 OCO asym str1583 1583 1589 (1590) CC ring str1598sh phe sym ring str.c,d
1643 1634 1643 carboxylatee 1666 amide Ic,d
1704/30 C=O str (doublet)
2879sh CH3 sym strf
2934 CH2 antisym strf 2968sh CH3 antisym strf
3019 30213062 3060 3070 aromatic CH sym strf 3080 3088 3084 3098 CH antisym strf
3137 3150 CH strf 3302 amide NH strc,d
Table 1. Tentative Raman vibrational mode assignments for dipicolinates. a is from Hamekaet al., 1996; b is from Carmona, 1980; c is from Woodruff et al., 1974; d is from Bendaker,1992, e is from Ghiamati et al., 1992; f is from Grasselli et al., 1981 and Austin et al., 1993.
www.intechopen.com

8/19/2019 Subtilis Spores
http://slidepdf.com/reader/full/subtilis-spores 11/25
Detection of Bacillus Spores by Surface-Enhanced Raman Spectroscopy 27
peak is likely associated with carboxylic acid groups (e.g. HO-C=O deformation), while thelatter peak is likely associated with deprotonated carboxylic acid groups (e.g. O-C-Ostretch). The latter assignment is consistent with a sample pH of 10 due to the 1N KOH. Theformer assignment is supported by the fact that the peak does not disappear when DPA is
dissolved in the aprotic solvents dimethylsulfoxide or N,N-dimethylformamide.
The SER spectrum of 1 g/L DPA in water is more like the solution than solid phase asshown in Fig. 5. The quality of this SER spectrum is considerably better than the firstreported SER spectrum of dipicolinic acid obtained on a silver electrode in an electrolyticcell (Farquharson et al., 1999). In fact, not only are most of the peaks of the solution phase RSspectrum observed in the SER spectrum, but peaks shift no more than 10 cm -1 and changelittle in relative intensity. These similarities suggest a weak molecule to silver surfaceinteraction. The RS to SERS shifts of the major peaks are: 652 to 657 cm-1, 822 to 812 cm-1,1001 to 1006 cm-1, 1386 to 1381 cm-1, 1438 to 1426 cm-1, 1572 to 1567 cm-1. The SERS peaks areassigned according to CaDPA above and literature as follows (Ghiamati et al., 1992;
Woodruff et al., 1974): the 1006 cm-1
peak
is assigned to the symmetric ring stretch, the 1381cm-1 peak to the symmetric O-C-O stretch, the 1426 cm-1 peak to the symmetric ring C-Hbend, and the 1567 cm-1 peak to the asymmetric O-C-O stretch. The greatest differencebetween the RS and SER spectra is the appearance of a new peak in the latter spectrum at795 cm-1 (see below).
Fig. 5. A) RS of 80 mg DPA in 1 mL 1N KOH in a glass capillary. B) SERS of 1 mg DPA in 1mL water in a silver-doped sol-gel filled glass capillary. Spectral conditions: A) 450 mW of785 nm, 5 min acquisition time and B) 150 mW of 785 nm, 1-minute acquisition time; both 8cm-1 resolution.
Next the pH dependence of both the measurement and analyte was considered. This couldbe significant if an acid or a base is used to digest spores and extract the CaDPA. It is widelyknown that the pH of the solution can have an effect on the SER signal (Laserna et al., 1988;Dou et al., 1999),
particularly in the case of metal colloids where pH affects the extent of
www.intechopen.com

8/19/2019 Subtilis Spores
http://slidepdf.com/reader/full/subtilis-spores 12/25
Bioterrorism28
aggregation (Laserna et al., 1988), which in turn affects the plasmon field and the Ramansignal enhancement. Other SER-active media are more tolerable to pH changes, such asmetal coated spheres and posts, or silver-doped sol-gels, as used here. Although these sol-gels may not be affected by pH, the analyte is a diprotic acid and the neutral and ionic forms
of DPA, DPA-, or DPA=, must be considered. These species may interact with the silver quitedifferently and consequently influence the amount that each vibrational mode is enhanced.For example, it might be expected that DPA= will interact more strongly with electropositivesilver increasing the chemical component of the SERS mechanism. Furthermore, addedenhancement might be expected for the vibrational modes of the deprotonated carboxylicacid groups that participate in this interaction, or for modes that are favorably alignedperpendicular to the surface due to this interaction.
The relative concentrations of DPA, DPA-, and DPA= can be determined at any pH as longas the pKas are known and the initial concentration. According to Lange's Handbook ofChemistry, the pKas are 2.16 and 6.92 (Dean 1979),
and the deprotonation reactions are:
DPA DPA- + H+ pK1a = 2.16 Reaction 1
DPA- DPA= + H+ pK2a = 6.92 Reaction 2
The relative concentrations can then be determined by expressing [DPA] and [DPA=] interms of [DPA-] using Reactions 1 and 2, and summing all three to equal the total startingconcentration, here 1 g/L, viz:
[DPA] + [DPA-] + [DPA=] = 1 g/L (1)
substituting from Reactions 1 and 2:
([H+][DPA-])/K1a + [DPA-] + (K2a[DPA-])/[H+] = 1 g/L (2)
rearranging:
[DPA-] = 1 g/L /(1+[H+]/K1a + K2a/[H+]) (3)
As shown in Fig. 6, at pH less than pK1a DPA dominates, at pH between the pKas DPA- dominates, and above pK2a DPA= dominates.
Fig. 7 shows SER spectra of DPA for pH 4.87, 5.59, 7.35, 8.22, 10.69, and 11.66 with spectra ofthe 800 cm-1 region for pH 1.35, 1.71, 2.19 and 3.83 (inset). Overall there is only a modestdecrease in intensity for most of the peaks as a function of pH. For example, the 1006 cm-1
peak assigned to the pyridine ring stretching mode decreases by ~7% from pH 2 to 11. Thegreatest changes observed, yet still modest, are in the peak intensities at 795, 812, 1567, and1590 cm-1 between pH 1.3 and 5.5. These peaks change intensity as pairs. The 795 cm -1 peakloses intensity as the pH becomes basic, while the 812 cm -1 peak gains a little intensity.Similarly, the 1567 cm-1 peak loses intensity as the pH becomes basic, while the 1590 cm-1 peak gains intensity. The intensities of the former pair are plotted as a function of pH in Fig.6. The peak heights were divided by the peak height of the 1006 cm -1 peak at each pH andthen scaled with the lowest value set to 0 and the highest to 1 g/L. As can be seen the 795cm-1 peak tracts the DPA concentration, while the 812 cm-1 peak tracts the DPA- concentration. The former peak is likely associated with carboxylic acid groups, just as in thecase of the 760 cm-1 peak in the solid phase RS spectrum of DPA.
www.intechopen.com

8/19/2019 Subtilis Spores
http://slidepdf.com/reader/full/subtilis-spores 13/25
Detection of Bacillus Spores by Surface-Enhanced Raman Spectroscopy 29
Fig. 6. DPA and its anion concentrations as a function of pH (lines). A) The 1006 cm-1 peakintensity is shown as measured, but scaled to a 0 to 1 g/L concentration range. B) The 795and 812 cm-1 peak intensities are normalized to the 1006 cm-1 peak intensity and then scaled.These two peaks appear to represent DPA and DPA=, respectively, but both with DPA- character.
Fig. 7. SERS of 1 mg/mL dipicolinic acid as a function of pH. The spectral intensities havebeen normalized to the 812 cm-1 peak. Inset: Expanded view of low wavenumber region.Spectral conditions: 100 mW of 785 nm, 44 sec acquisition time, 8 cm-1 resolution.
However, a 35 cm-1 shift is somewhat inconsistent with a weak analyte-to-surface interaction.It is also apparent in Fig. 6 that the concentrations of DPA and DPA- based on the 795 and812 cm-1 peak intensities are shifted to the basic side of the predicted curves. This shift may
www.intechopen.com

8/19/2019 Subtilis Spores
http://slidepdf.com/reader/full/subtilis-spores 14/25
Bioterrorism30
be due to the silver surface influencing the carboxylic acid dissociation energy. Or the peaksmay contain contributions from the DPA= species. Although clarifying this point willrequire further measurements, the most important conclusions from this data is that the SERintensity for most of the prominent DPA peaks change little as a function of pH, and that the
silver-doped sol-gels do not appear to influence the measurement to any significance.
Next, the response of the SER intensity for DPA as a function of concentration wasexamined. A preliminary calibration curve was prepared by measuring 100, 50, 20, 10, 5, 2,1, 0.5, 0.2, 0.1, 0.05, 0.02, and 0.01 mg/L samples. Fig. 8 shows SER spectra for 100, 1, and0.01 mg/L samples measured using 100 mW of 785 nm and 1-min acquisition time. It can beseen that even at 10 µg/L the signal-to-noise ratio is quite good. The SER intensity was takenas the peak height at 1006 cm-1 minus the value at 950 cm-1 as the baseline. For eachconcentration, a different capillary was used. Spectra were measured at nine points alongthe length of each capillary and the median values are plotted in Fig. 9. It is obvious that theresponse is not linear, in that the peak heights change from 0.2 to 1.5, while the
concentration changes over 4 orders of magnitude. This Langmuir isotherm response istypical for SERS substrates where signal intensity is a function of available silver surfacearea (Mullen & Carron, 1994).
Fig. 8. SERS of DPA in water at A) 100, B) 1, and C) 0.01 mg/L (100 pg in 10 µL sample)using the SER-active capillaries, 100 mW of 785 nm and 1 min acquisition time.
All of these values were also used to estimate limits of detection (LOD), defined as theconcentration that produces a signal three times as intense as the baseline noise. The signal
was taken as the height of the 1006 cm-1 peak, while the noise was the relative standarddeviation of baseline noise measured between 50 and 150 cm-1. The LODs are for 1-minmeasurements using 100 mW of 785 nm laser excitation and 8 cm-1 resolution. As Table 2indicates, the lower the measured concentration, in general, the lower the predicted LOD.Note that the lowest concentration sample, 10 µg/L (0.01 mg/L), suggests that 0.7 µg/L can
www.intechopen.com

8/19/2019 Subtilis Spores
http://slidepdf.com/reader/full/subtilis-spores 15/25
Detection of Bacillus Spores by Surface-Enhanced Raman Spectroscopy 31
Fig. 9. Plot of SER intensity for 1006 cm-1 peak of DPA as a function of concentration using100 mW of 785 nm and 1-min acquisition time. Line connects average value at eachconcentration. Inset includes 10 and 100 mg/L data.
be measured (S/N equaled 33 for the 1006 cm-1 peak). This is consistent with the fact thatattempted measurements of 1 µg/L samples did yield spectra, but not in every case. It is
also worth noting that only 10 µL samples were used to generate the spectra, or in the case
of the 10 µg/L sample, the actual sample was 100 pg DPA in 10 µL water.Conc spores Signal Std Dev RSD Noise S/N LOD LOD LOD
mg/L in 0.1 mL (ave) (%) factor mg/L spores/0.1 mL
0.01 1229 0.14 0.12 86.68 0.0033 41.4 13.8 7.24E-04 89
0.02 2457 0.25 0.05 20.00 0.0042 59.5 19.8 1.01E-03 124
0.05 6143 0.31 0.08 25.99 0.0043 72.9 24.3 2.06E-03 253
0.1 12,285 0.40 0.10 25.00 0.0047 85.1 28.4 3.53E-03 433
0.2 24,570 0.50 0.15 30.00 0.005 100.0 33.3 6.00E-03 737
0.5 61,425 0.56 0.14 25.17 0.006 92.8 30.9 1.62E-02 1986
1 122,850 0.74 0.15 20.24 0.0067 110.9 37.0 2.70E-02 3322
2 245,700 0.83 0.06 7.78 0.008 103.3 34.4 5.81E-02 7133
5 614,251 0.93 0.16 16.90 0.0067 138.8 46.3 1.08E-01 13276
10 1,228,501 1.02 0.17 16.75 0.0096 106.3 35.4 2.82E-01 34687
100 12,285,012 1.38 0.16 11.50 0.0122 113.1 37.7 2.65E+00 325820
~1* 100,000 0.70 0.14 20.11 0.0055 126.7 42.2 2.37E-02 2368
~0.22** 22,000 0.45 0.10 23.20 0.0159 28.3 9.4 2.33E-02 2332
* Approximate concentrations for dodecylamine surface measurements, see below.** Approximate concentrations for acetic acid surface measurements, see below.
Table 2. Estimated limits of detection in terms of mg DPA per L water and correspondingspores per 0.1mL DDA.
Finally, an enhancement factor (EF) for DPA can be estimated by comparing the
measurement conditions and signal intensities for the 10 µg/L SERS and 80 g/L RS. The
www.intechopen.com

8/19/2019 Subtilis Spores
http://slidepdf.com/reader/full/subtilis-spores 16/25
Bioterrorism32
spectra are plotted on the same scale in Fig. 10. The 1006 cm-1 peak heights are nearlyidentical at 0.20 and 0.173 (arbitrary units), while the laser power at the sample and
collection time were somewhat different at 150 and 450 mw, and 1 and 5 minutes for the
SERS and RS, respectively. In both cases, 1-mm capillaries were used to hold the samples,
and the same sample optics were used. Taking the concentration into account yields anestimated enhancement factor of 2.4x10⁷. It is difficult to determine the precise number of
molecules in the field of view for the sol-gel, and this number may represent better than
average enhancement, i.e. better than 106, or it may reflect the ability of the sol-gel toconcentrate the sample. In either case, the measurement of 10 µg/L suggests that 10 ng of
spores in a 100 µL solution of a digesting chemical can be measured; assuming all of the
CaDPA is made available as DPA (10%). Recent estimates suggest that this mass
corresponds to 1000 spores (Inglesby et al., 2002).
Fig. 10. A) SERS and B) RS of DPA plotted on the same scale, but offset. Conditions:A:B 10-5:80 g/L, 150:450 mW of 785 nm, and 1:5 min acquisition time. EF = 2.4x10⁷.
Next, methods were developed to rapidly extract CaDPA as DPA from Bacillus spores.
Initially, DPA was obtained from B. cereus spores following the procedure of Pellegrino et al.
Specifically, a 2 mg sample was placed in 2 mL of 5 mM dodecylamine in ethanol that washeated and maintained at 78 oC for 40 minutes. Approximately 10 µL of this solution wasdrawn into a SER-active capillary and measured. Since SER spectra of DPA were readily
observed, shorter heating periods, higher DDA concentrations and smaller spore masses,
were examined. In due course experiments were performed in which 100 µL of 78 oC 50 mM
DDA in ethanol was added to ~10 µg samples of spore specks (~ 1 million spores) placed on
a surface. After 1 minute exposure, approximately 10 µL of the solution were drawn into a
SER-active capillary and measured. Fig. 11 shows a representative spectrum for one of these
capillaries using a 1-min acquisition time. The primary DPA peaks at 657 cm-1, 810 cm-1,
1006 cm-1, 1382 cm-1, and 1428 cm-1 are easily observed, even in the case of a 2-sec scan.
www.intechopen.com
8/19/2019 Subtilis Spores
http://slidepdf.com/reader/full/subtilis-spores 17/25
Detection of Bacillus Spores by Surface-Enhanced Raman Spectroscopy 33
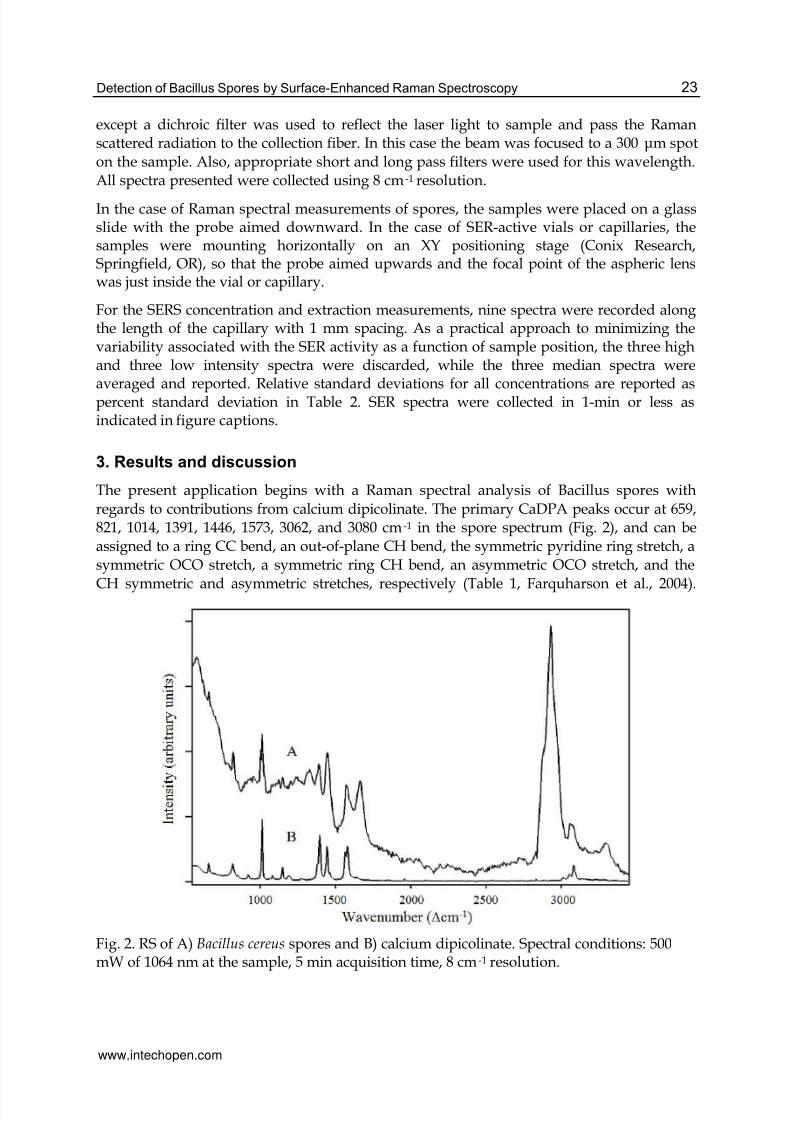
Furthermore, an attempted measurement of 50 mM DDA (without sample) did not producea spectrum that might interfere with the measurement (Fig. 11C). The amount of DPA
extracted was estimated to be between 0.5 and 5 mg/L by comparing the 0.7 signal intensity
of the 1006 cm-1 peak to that measured for DPA in water (see Table 2). In fact this intensity is
closest to that obtained for the 1 mg/L samples. This value can be used to estimate thenumber of spores in the 100 µL DDA sample. Assuming, as stated above, that a spore
contains approximately 10% DPA by weight, and that 100 spores have a mass of ~1 ng, then
this corresponds to 100,000 spores per 100 µL DDA or ~10% of the spores in the preparedparticles. This low percentage could be due to incomplete degradation of the spores by
DDA, interference from the spore cell debris, inefficient collection of the sample from the
surface, or inefficient transfer of the DPA to the silver particles.
Fig. 11. SERS of DPA extracted from ~10 µg B. cereus particle using 100 µL of 50 mM hotDDA acquired in A) 1 minute and B) 2 seconds. C) Attempted SERS of 50 mM hot DDA inethanol using silver-doped sol-gel coated glass capillary acquired in 1 minute. Spectralconditions: 150 mW of 785 nm, 8 cm-1 resolution.
Although, these initial measurements clearly demonstrated the potential of rapid sporeanalysis using SERS, the approach had two significant limitations. First, the sensitivity is
insufficient, and second the use of a hot reagent severely limits its practical use in the field.To overcome these limitations we investigated numerous acids, bases and solvents (e.g.nitric acid, potassium hydroxide, phenol, etc.), separately and as mixtures that could digestspores rapidly at room temperature, and make available all or nearly all of the DPA forSERS detection.
Eventually, it was found that glacial acetic acid had the appropriate properties. However,reactivity of acetic acid with the sol-gel and competition with DPA for the silver surface wasa concern, so a series of DPA concentration samples were prepared and measured. Fig. 12shows a SER spectrum of 100 pg DPA in 10 µL acetic acid (10 ppb) and a SER spectrum ofpure acetic acid drawn into SER-active capillaries.
www.intechopen.com

8/19/2019 Subtilis Spores
http://slidepdf.com/reader/full/subtilis-spores 18/25
Bioterrorism34
Fig. 12. A) SERS of DPA in acetic acid at 10 pg/µL, B) SERS of acetic acid, and C) differencespectrum of A-B). Spectral conditions: 85 mW of 785 nm, 1 min acquisition time, 8 cm-1 resolution.
Acetic acid produced several peaks, notably at 925, 1340, and 1405 cm-1. Subtraction of theacetic acid spectrum reveals a standard SER spectrum of DPA (Fig. 12C). The SER spectralintensity of DPA in acetic acid as a function of concentration is very similar to that previouslymeasured in water. In fact the 1006 cm-1 peak intensity, once corrected for the difference inlaser power is nearly identical for the same concentration in water (compare 0.13 in acetic acid
versus 0.14 in water, Table 2). Fig. 13 shows SER spectra of four orders of magnitude of DPA
Fig. 13. SERS of DPA in acetic acid at concentrations of A) 1, B) 10, C) 100, and D) 1000pg/µL. Spectral conditions: 85 mW of 785 nm, 1 min acquisition time, 8 cm-1 resolution.
www.intechopen.com

8/19/2019 Subtilis Spores
http://slidepdf.com/reader/full/subtilis-spores 19/25
Detection of Bacillus Spores by Surface-Enhanced Raman Spectroscopy 35
concentration in acetic acid, in which the dominant 1006 cm-1 peak intensity is held constantand the base line noise is observed to increase with decreasing concentration.
Next, experiments were performed using acetic acid to digest spore samples on a surface,
collect the DPA and detect it in SER-active capillaries. As a specific example, a 2 mg sampleof spores was weighed and dispersed in 10 mL of water by vortexing. The spores pervolume water were calibrated by placing 10 µL on a standard hemocytometer counting grid.Each grid holds 4 nL (0.2x0.2x0.1 mm). Microscope images of 10 grids were recorded and870 spores were counted, which represents ~22,000 spores per µL (Fig. 14A). The originalspore solution was diluted by a factor of 10 to produce a 2200 spore per µL. From thissolution, a 1 µL sample was placed on a glass slide and allowed to dry producing a 2200spores per ~0.2 cm2 spot (Fig. 14B). Although this represents 11,000 spores/cm2, 3-orders ofmagnitude greater than the target sensitivity, no attempt was made to spread the sporesacross the surface (i.e. identical results would likely have been obtained if the sample wasallowed to dry on a 10 cm2 area). Next, 10 µL of acetic acid was added to the spore spot (Fig.
14C). After 1 minute, 1 µL of this solution was drawn into a SER-active capillary (Fig. 14D),and a 1-minute spectrum measured (Fig. 15A). The measurement represents 220 spores/µL.The entire measurement was accomplished in less than 2.5 minutes, and at a measured pHof 2.1 the primary DPA peaks at 657 cm-1, 812 cm-1, 1006 cm-1, 1381 cm-1, and 1426 cm-1 areeasily observed.
Fig. 14. A) Microscope image of initial calibration sample containing 60 spores in a 0.2 x 0.2mm field of view (0.1 mm deep). B) 2200 spores were dried from 1 µL on the surface as (~0.2
cm2). C) 10 µL of acetic acid was added to the spores for 1 min digestion. D) 1 µL of thesolution was drawn into the chemically-selective, SER-active capillary. And E) the capillarywas mounted in Raman analyzer sample compartment and the spectrum collected.
The quantitative accuracy of the measurement was further verified by comparing this 220spores/µL spectrum to the 100 pg/µL (~100 spores/µL) solution of DPA in acetic acidspectrum. This was accomplished by using the acetic acid peak at 925 cm-1 as an internalintensity standard and normalizing both spectra to it. It was found that the primary peak at1006 cm-1 of the spore sample is ~ twice the intensity of the reference DPA sample,consistent with the 220 spore estimate. This spectral comparison also shows that the sporespectrum contains a considerable baseline offset with significant noise (background). This is
www.intechopen.com

8/19/2019 Subtilis Spores
http://slidepdf.com/reader/full/subtilis-spores 20/25
Bioterrorism36
likely due to spore debris that has not been effectively excluded from the metal-doped sol-gels, and suggests that further “cleaning” the sample could improve sensitivity. The spectralbackground results in a modest S/N of 28, and an estimated LOD of 2330 B. cereus sporesper 100 µL acetic acid or 1165 spores per cm2 for the above experiment. But, as shown in
Table 2, the LODs are consistently underestimated, and substantially better sensitivityshould be expected.
Fig. 15. SERS of A) DPA obtained from 220 Bacillus cereus spores using a 1-minute exposure
to glacial acetic acid at room temperature and B) 100 pg/µL solution of DPA in acetic acidfor comparison. Spectral conditions: 85 mW of 785 nm, 1 min acquisition time, 8 cm-1 resolution.
4. Conclusions
We have demonstrated that by combining rapid extraction of dipicolinic acid from Bacillus
cereus spores with chemical identification by surface-enhanced Raman spectroscopy,Bacillus spores on a surface can be identified in 2.5 minutes. This includes the time requiredto dispense acetic acid onto a spore contaminated surface, draw the DPA sample by syringeinto a SER-active capillary, and acquire the DPA SER spectrum. Using this method, we havemeasured 220 spores/µL from a 0.2 cm2 spot containing 2200 spores (equivalent to 11,000spores/cm2) in 2.5 minutes, using a simple, SER-active sampling capillary, syringe and aportable Raman analyzer. Although an estimated limit of detection based on the signal-to-noise ratio suggests that 1165 spores/cm2 could be measured, the LODs are consistentlyunderestimated as shown in Table 2. In fact, 1 pg/µL DPA in acetic acid was consistentlymeasured. Assuming that the B. cereus spores contained 10 wt % DPA and each spore has amass of 10-11g, this is equivalent to 10 spores/cm2 for the experiment presented here. Itcould also be argued that the same number of spores could be spread over a 10 cm2 regionand the same amount of digesting agent would produce an equivalent SER signal. Togetherthese arguments suggest that the present method is capable of measuring the goal of 10
www.intechopen.com

8/19/2019 Subtilis Spores
http://slidepdf.com/reader/full/subtilis-spores 21/25
Detection of Bacillus Spores by Surface-Enhanced Raman Spectroscopy 37
spore/cm2 and that SER-active capillaries could be used to measure surfaces and mapdistribution of anthrax endospores in mail distribution facilities or other environmentsshould another verified attack occur. This would greatly aid in determining the extent of anattack, deciding who should be tested, and possibly tracing the origin of letters if used.
Current research is aimed at extending the capability of this method to analysis of nasalswabs, and B. anthracis specific SERS-active materials.
5. Acknowledgements
The authors are grateful to Professor Jay Sperry of the University of Rhode Island forpreparing spore samples and the National Science Foundation (DMI-0215819, DMI-0214280,DMI-0349687), the U.S. Army (DAAD13-02-C-0015, Joint Service Agent Water MonitorProgram), and the Environmental Protection Agency (EP-D-06-084).
6. ReferencesAustin, J.C., Jordan, T., & Spiro, T.G., (1993), UVRR studies of proteins and related
compounds, In Biomolecular Spectroscopy, Vol 21, Clark & Hester (Eds.), John Wiley& Sons, New York, NY.
Bandekar, J., (1992), Amide modes and protein conformation, Biochim. Biophys. Acta, 1120, p.123.
Bell, C.A., Uhl, J. R., & Cockerill, F. R., (2001), Direct Detection of Bacillus anthracis using aReal-Time PCR Method, ASM 101st General Meeting, Orlando, FL, May 2001.
Bell, C.A., Uhl, J.R., Hadfield, T.L., David, J.C., Meyer, R.F., Smith, T.F., & Cockerill, F.R. III,(2002), Detection of Bacillus Anthracis DNA by Light Cycler PCR, J. Clin. Microbiol.,40, p. 2897.
Bell, D.M., Kozarsky, P.E., & Stephens, D., (2002), Clinical issues in the prophylaxis,diagnosis, and treatment of anthrax, Emerg. Infect. Dis., 8, p. 222.
Berkeley, R.C.W., & Ali, N., (1994), Classification and identification of endospore-formingbacteria, J. Appl. Bacteriol. ( Symp. Suppl.), 76, p. 1S.
Beverly, M.B., Basile, F., Voorhees, K.J., & Hadfield, T.L., (1996), A rapid approach for thedetection of dipicolinic acid in bacterial spores using pyrolysis /mass spectrometry, Rapid Commun. Mass Spectrom., 10, p. 455.
Carmona, P., (1980), Vibrational spectra and structure of crystalline dipicolinic acid andcalcium dipicolinate trihydrate, Spectrochim. Acta, A, 36, p. 705.
Centers for Disease Control & Prevention, American Society for Microbiology, &
Association of Public Health Laboratories. Basic diagnostic testing protocols forlevel A laboratories for the presumptive identification of Bacillus anthracis, (2001),American Society for Microbiology, Washington, D.C. Accessed Nov 2011,Available from: http://www.bt.cdc.gov/Agent/Anthrax/Anthracis20010417.pdf
Dean, J.L., (1979), Lange's Handbook of Chemistry, 12th Ed., McGraw-Hill, New York, NY.Dou, X., Jung, Y., Cao, Z., & Ozaki, Y., (1999), Surface-Enhanced Raman Scattering of
Biological Molecules on Metal Colloid II: Effects of Aggregation of Gold Colloidand Comparison of Effects of pH of Glycine Solutions between Gold and SilverColloids, Appl. Spectrosc., 53, p. 1440.
www.intechopen.com

8/19/2019 Subtilis Spores
http://slidepdf.com/reader/full/subtilis-spores 22/25
Bioterrorism38
Esposito, A.P., Talley, C.E., Huser, T., Hollars, C.W., Schaldach, C.M., & Lane, S.M., (2003),Analysis of single bacterial spores by micro-Raman spectroscopy, Appl. Spectrosc.,57, p. 868.
Farquharson, S., Smith, W.W., Elliott, S., & Sperry, J.F., (1999), Rapid biological agent
identification by surface-enhanced Raman spectroscopy, Proc. SPIE, 3855, p. 110.Farquharson, S., & Maksymiuk, P., (2003), Simultaneous chemical separation and surface-
enhancement Raman spectral detection using silver-doped sol-gels, Appl. Spectrosc.,57, p. 479.
Farquharson, S., Grigely, L., Khitrov, V., Smith, W.W., Sperry, J.F., & Fenerty, G., (2004),Detecting Bacillus cereus spores on a mail sorting system using RamanSpectroscopy, J. Raman Spectrosc., 35, p. 82.
Farquharson, S., Smith, W., Carangelo, R.C., & Brouillette, C., (1999), Industrial Raman:providing easy, immediate, cost effective chemical analysis anywhere, Proc. SPIE,3859, p. 14.
Ghiamati, E., Manoharan, R.S., Nelson, W.H., & Sperry, J.F., (1992), UV Resonance Raman
spectra of Bacillus spores, Appl. Spectrosc., 46, p. 357.Grasselli, J.G., Snavely, M.K., & Bulkin, B.J., (1981), Chemical Applications of Raman
Spectroscopy, John Wiley & Sons, New York, NY, Chapter 5.Hameka, H.F., Jensen, J.O., Jensen, J.L., Merrow, C.N., & Vlahacos, C.P., (1996), Theoretical
studies of the fluorescence of dipicolinic acid and its anion, J. Molec. Struct. (Theory),365, p. 131.
Hathout, Y., Setlow, B., Cabrera-Martinex, R-M., Fenselau, C., & Setlow, P., (2003), Small,acid-soluble proteins as biomarkers in mass spectrometry analysis of Bacillusspores, Appl. Environ. Microbiol., 69, p. 1100.
Halverson, H.O., Ed., (1961), Spores II , American Society for Microbiology, Washington,
D.C., p. 153.Helgason, E., Økstad, O.A., Caugant, D.A., Johansen, H.A., Fouet, A., Mock, M., Hegna, I., &Kolstø, A.B., (2000), Bacillus anthracis, Bacillus cereus, and Bacillus thuringiensis-onespecies on the basis of genetic evidence, Appl. Environ. Microbiol., 66, p. 2627.
Hindle, A.A., Hall, E.A.H., (1999), Dipicolinic acid assay revisited and appraised for sporedetection, Analyst, 124, p. 1599.
Hsu, V.P., Lukacs, S.L., Handzel, T., et al., (2002), Opening a Bacillus anthracis-containingenvelope, Capitol hill, Washington, D.C.: The Public Health Response, Emerg. Infect.Dis., 8, p. 1039.
Inglesby, T.V., Henderson, D.A., & Bartlett, J.G., (2002), Anthrax as a biological weapon:updated recommendations for management, JAMA, 287, p. 2236.
Jackson, P.J., Hugh-Jones, M.E., Adair, D.M., et al., (1998), PCR analysis of tissue samplesfrom the 1979 Sverdlovsk anthrax victims: The presence of multiple Bacillusanthracis strains in different victims, Proc. Natl. Acad. Sci., 95, p. 1224.
Janssen, F.W., Lund, A.J., & Anderson, L.E., (1958), Colorimetric assay for dipicolinic acid inbacterial spores, Science, 127, p. 26.
Jeanmaire D.L., & Van Duyne, R.P., (1977), Surface Raman Spectroelectrochemistry, J.Electroanal. Chem., 84, p. 1.
Jernigan, J.A., Stephens, D.S., Ashford, D.A, et al., (2001), Bioterrorism-Related InhalationalAnthrax: The First 10 Cases Reported in the United States, Emerg. Infect. Dis., 6, p.933.
www.intechopen.com

8/19/2019 Subtilis Spores
http://slidepdf.com/reader/full/subtilis-spores 23/25
Detection of Bacillus Spores by Surface-Enhanced Raman Spectroscopy 39
Kellogg, M., (2010), Detection of biological agents used for terrorism: Are we ready?, Clin.Chem., 56, p. 10.
Kennedy, H., (2001), Daschle letter bombshell billions of anthrax spores, New York DailyNews, October 31, 2001.
Kiratisin, P., (2002), Large-scale screening of nasal swabs for Bacillus anthracis: Descriptivesummary and discussion of the National Institute of Health’s experience, J. Clin. Microbio., 40, p. 3012.
Laserna, J.J., Berthod, A., & Winefordner, J.D., (1988 ), Evaluation and optimization ofexperimental conditions for surface-enhanced Raman detection of analytes in flowinjection analysis, Microchem. J., 38, p. 25.
Leingang, M., (2004), Post office installs anthrax detector, The Enquirer (Cincinnati), Sept. 24,2004.
Liu, H., Bergman, N.H., Thomason, B., et al., (2004), Formation and Composition of theBacillus anthracis Endospore, J. Bacteriol., 186, p. 164.
Mabry, R., Brasky, K., Geiger, R., Carrion, R. Jr., Hubbard, G. B., Leppla, S., Patterson, J. L.,
Georgiou, G., and Iverson, B.L.,(2006), Detection of anthrax toxin in the serum ofanimals infected with Bacillus anthracis by using engineered immunoassays, Clin.Vaccine Immunol. 13, p. 671.
Mullen, K., & Carron, K., (1994), Adsorption of chlorinated ethylenes at 1-octadecanethiol-modified silver surfaces, Anal. Chem., 66, p. 478.
Murrell, W.G., Gould, G.W., & Hurst, A. Eds., (1969), The Bacterial Spore, Acad. Press.,London, p. 215.
Nelson, W.H., Dasari, R., Feld, M., & Sperry, J.F., (2004), Intensities of calcium dipicolinateand Bacillus subtilis spore Raman spectra excited with 244 nm light, Appl. Spectrosc.,58, p. 1408.
Nudelman, R., Bronk, B.V., & Efrima, S., (2000), Fluorescence Emission Derived fromDipicolinate Acid, its Sodium, and its Calcium Salts, Appl. Spectrosc., 54, p. 445.Pellegrino, P.M., Fell Jr., N.F., & Gillespie, J.B., (2002), Enhanced spore detection using
dipicolinate extraction techniques, Anal. Chim. Acta., 455, p. 167.Phillips, Z.E., & Strauch, M.A., (2002), Bacillus subtilis sporulation and stationary phase gene
expression, Cell. Mol. Life Sci., 59, p. 392.Ragkousi, K., Eichenberger, P., Van Ooij, C., & Setlow, P., (2003), Identification of a New
Gene Essential for Germination of Bacillus subtilis Spores with Ca2+-Dipicolinate, J.Bacteriol., 185, p. 2315.
Rosen, D.L., Sharpless, C., & McBrown, L.B., (1997), Bacterial spore detection anddetermination by use of terbium dipicolinate photoluminescence, Anal. Chem., 69,
p. 1082.Sacchi, C.T., Whitney, A.M., Mayer, L.W., Morey, R., Steigerwalt, A., Boras, A., Weyant, R.S.,
& Popovic, T., (2002), Sequencing of 16S rRNA Gene: A Rapid Tool forIdentification of Bacillus anthracis, Emerg. Infect. Dis., 8, p. 1117.
Sanderson, W.T., Hein, M.J., & Taylor, L., (2002), Surface Sampling Methods for Bacillusanthracis Spore Contamination, Emerg. Infect. Dis., 8, p. 1145.
Sanderson, W.T., Stoddard, R.R., Echt, A.S., et al., (2004), Bacillus anthracis contaminationand inhalational anthrax in a mail processing and distribution center, J. Appl. Microbiol., 96, p. 1048.
Shane, S., (2004), Post office unveils anthrax detector, Baltimore Sun, July 23, 2004.
www.intechopen.com

8/19/2019 Subtilis Spores
http://slidepdf.com/reader/full/subtilis-spores 24/25
Bioterrorism40
Tang, S., Moayeri, M., Chen, Z., Harma, H., Zhao, J., Hu, H.,Purcell, R.H., Leppla, S.H., andHewlett, I.K.,(2009) Detection of Anthrax Toxin by an Ultrasensitive ImmunoassayUsing Europium Nanoparticles, Clin.Vacc. Immun., 16, p. 408.
Thayer, A., (2003), Homeland Security: Postal Service Readies Defense - Team will install
PCR-based systems to detect biohazards in mail facilities, C&EN , 81, p. 7.Weaver, M.J., Farquharson, S., & Tadayyoni, M.A., (1985), Surface-enhancement factors for
Raman scattering at silver electrodes: Role of adsorbate-surface interactions andelectrode structure, J. Chem. Phys., 82, p. 4867.
Woodruff, W.H., Spiro, T.G., & Gilvarg, C., (1974), Raman Spectroscopy In Vivo: Evidenceon the Structure of Dipicolinate in Intact Spores of Bacillus Megaterium, Biochem.Biophys. Res. Commun., 58, p. 197.
www.intechopen.com
8/19/2019 Subtilis Spores
http://slidepdf.com/reader/full/subtilis-spores 25/25
Bioterrorism
Edited by Dr. Stephen Morse
ISBN 978-953-51-0205-2
Hard cover, 192 pages
Publisher InTech
Published online 28, March, 2012
Published in print edition March, 2012
InTech Europe
University Campus STeP RiSlavka Krautzeka 83/A
51000 Rijeka, Croatia
Phone: +385 (51) 770 447
Fax: +385 (51) 686 166
www.intechopen.com
InTech China
Unit 405, Office Block, Hotel Equatorial ShanghaiNo.65, Yan An Road (West), Shanghai, 200040, China
Phone: +86-21-62489820
Fax: +86-21-62489821
This book consists of nine chapters, written by international authorities, discussing various aspects of
bioterrorism preparedness and response. Five of the chapters are agent-specific and highlight the
pathogenesis, prevention and treatment, and the potential of specific organisms (Rickettsia and Yersinia
pestis) or toxins (ricin, botulinum neurotoxins, and staphylococcal enterotoxins) to be used for nefarious
purposes. Four chapters discuss different aspects of detecting and responding to a bioterrorism attack. These
include methods for spatio-temporal disease surveillance, international laboratory response strategies,
detection of botulinum neurotoxins in food and other matrices, and the use of physical methods (ie Raman
spectroscopy) to detect spores.
How to reference
In order to correctly reference this scholarly work, feel free to copy and paste the following:
Stuart Farquharson, Chetan Shende, Alan Gift and Frank Inscore (2012). Detection of Bacillus Spores by
Surface-Enhanced Raman Spectroscopy, Bioterrorism, Dr. Stephen Morse (Ed.), ISBN: 978-953-51-0205-2,
InTech, Available from: http://www.intechopen.com/books/bioterrorism/detection-of-bacillus-spores-by-surface-
enhanced-raman-spectroscopy