Substantial changes in gaseous pollutants and chemical ...
16
Atmos. Chem. Phys., 21, 8677–8692, 2021 https://doi.org/10.5194/acp-21-8677-2021 © Author(s) 2021. This work is distributed under the Creative Commons Attribution 4.0 License. Substantial changes in gaseous pollutants and chemical compositions in fine particles in the North China Plain during the COVID-19 lockdown period: anthropogenic vs. meteorological influences Rui Li 1 , Yilong Zhao 1 , Hongbo Fu 1,2 , Jianmin Chen 1,2 , Meng Peng 3 , and Chunying Wang 4 1 Shanghai Key Laboratory of Atmospheric Particle Pollution and Prevention, Department of Environmental Science and Engineering, Institute of Atmospheric Sciences, Fudan University, Shanghai, 200433, PR China 2 Collaborative Innovation Center of Atmospheric Environment and Equipment Technology (CICAEET), Nanjing University of Information Science and Technology, Nanjing 210044, PR China 3 School of Law of Tsinghua University, Beijing 100084, China 4 Hebei Xianhe Environmental Protection Technology Co. Ltd, Shijiazhuang 050035, China Correspondence: Hongbo Fu ([email protected]), Jianmin Chen ([email protected]), and Meng Peng ([email protected]) Received: 20 November 2020 – Discussion started: 4 January 2021 Revised: 24 April 2021 – Accepted: 4 May 2021 – Published: 9 June 2021 Abstract. The rapid response to the COVID-19 pandemic led to unprecedented decreases in economic activities, thereby reducing the pollutant emissions. A random forest (RF) model was applied to determine the respective contributions of meteorology and anthropogenic emissions to the changes in air quality. The result suggested that the strict lockdown measures significantly decreased primary components such as Cr (-67 %) and Fe (-61 %) in PM 2.5 (p< 0.01), whereas the higher relative humidity (RH) and NH 3 level and the lower air temperature (T ) remarkably enhanced the pro- duction of secondary aerosol, including SO 2- 4 (29 %), NO - 3 (29 %), and NH + 4 (21 %) (p< 0.05). The positive matrix fac- torization (PMF) result suggested that the contribution ratios of secondary formation (SF), industrial process (IP), biomass burning (BB), coal combustion (CC), and road dust (RD) changed from 36 %, 27 %, 21 %, 12 %, and 4 % before the COVID-19 outbreak to 44 %, 20 %, 20 %, 9 %, and 7 %, re- spectively. The rapid increase in the contribution ratio de- rived from SF to PM 2.5 implied that the intermittent haze events during the COVID-19 period were characterized by secondary aerosol pollution, which was mainly contributed by the unfavorable meteorological conditions and high NH 3 level. 1 Introduction In December 2019, a cluster of pneumonia cases with un- known etiology were first reported in Wuhan and quickly spread around the world (F. Wu et al., 2020). The continu- ous global outbreak of the coronavirus disease (COVID-19), declared as a public health emergency of international con- cern by the World Health Organization, resulted in unprece- dented public health responses in many countries including lockdown, travel restrictions, and quarantines (Griffiths and Woodyatt, 2020; Horowitz and Freeman, 2020). On 23 Jan- uary 2020, the Chinese government imposed a lockdown in Wuhan and many surrounding cities in Hubei Province in or- der to prevent the spread of the epidemic. Afterwards, many similar measures including blocked roads, shutdown of fac- tories, restricted citizen mobility, and checkpoints were soon extended to other cities throughout the entire country. Dur- ing this period, energy production by coal-fired power plants only remained at two-thirds of the levels of the same peri- ods in preceding years (Chang et al., 2020). Additionally, the transport volume was reduced by more than 70 % due to the COVID-19 outbreak (Chang et al., 2020). These drastic government-enforced lockdown measures substantially de- creased the pollutant emissions and at least partly improved Published by Copernicus Publications on behalf of the European Geosciences Union.
Transcript of Substantial changes in gaseous pollutants and chemical ...
Atmos. Chem. Phys., 21, 8677–8692, 2021https://doi.org/10.5194/acp-21-8677-2021© Author(s) 2021. This work is distributed underthe Creative Commons Attribution 4.0 License.
Substantial changes in gaseous pollutants and chemicalcompositions in fine particles in the North China Plainduring the COVID-19 lockdown period: anthropogenic vs.meteorological influencesRui Li1, Yilong Zhao1, Hongbo Fu1,2, Jianmin Chen1,2, Meng Peng3, and Chunying Wang4
1Shanghai Key Laboratory of Atmospheric Particle Pollution and Prevention, Department of Environmental Science andEngineering, Institute of Atmospheric Sciences, Fudan University, Shanghai, 200433, PR China2Collaborative Innovation Center of Atmospheric Environment and Equipment Technology (CICAEET),Nanjing University of Information Science and Technology, Nanjing 210044, PR China3School of Law of Tsinghua University, Beijing 100084, China4Hebei Xianhe Environmental Protection Technology Co. Ltd, Shijiazhuang 050035, China
Correspondence: Hongbo Fu ([email protected]), Jianmin Chen ([email protected]), and Meng Peng([email protected])
Received: 20 November 2020 – Discussion started: 4 January 2021Revised: 24 April 2021 – Accepted: 4 May 2021 – Published: 9 June 2021
Abstract. The rapid response to the COVID-19 pandemic ledto unprecedented decreases in economic activities, therebyreducing the pollutant emissions. A random forest (RF)model was applied to determine the respective contributionsof meteorology and anthropogenic emissions to the changesin air quality. The result suggested that the strict lockdownmeasures significantly decreased primary components suchas Cr (−67 %) and Fe (−61 %) in PM2.5 (p < 0.01), whereasthe higher relative humidity (RH) and NH3 level and thelower air temperature (T ) remarkably enhanced the pro-duction of secondary aerosol, including SO2−
4 (29 %), NO−3(29 %), and NH+4 (21 %) (p < 0.05). The positive matrix fac-torization (PMF) result suggested that the contribution ratiosof secondary formation (SF), industrial process (IP), biomassburning (BB), coal combustion (CC), and road dust (RD)changed from 36 %, 27 %, 21 %, 12 %, and 4 % before theCOVID-19 outbreak to 44 %, 20 %, 20 %, 9 %, and 7 %, re-spectively. The rapid increase in the contribution ratio de-rived from SF to PM2.5 implied that the intermittent hazeevents during the COVID-19 period were characterized bysecondary aerosol pollution, which was mainly contributedby the unfavorable meteorological conditions and high NH3level.
1 Introduction
In December 2019, a cluster of pneumonia cases with un-known etiology were first reported in Wuhan and quicklyspread around the world (F. Wu et al., 2020). The continu-ous global outbreak of the coronavirus disease (COVID-19),declared as a public health emergency of international con-cern by the World Health Organization, resulted in unprece-dented public health responses in many countries includinglockdown, travel restrictions, and quarantines (Griffiths andWoodyatt, 2020; Horowitz and Freeman, 2020). On 23 Jan-uary 2020, the Chinese government imposed a lockdown inWuhan and many surrounding cities in Hubei Province in or-der to prevent the spread of the epidemic. Afterwards, manysimilar measures including blocked roads, shutdown of fac-tories, restricted citizen mobility, and checkpoints were soonextended to other cities throughout the entire country. Dur-ing this period, energy production by coal-fired power plantsonly remained at two-thirds of the levels of the same peri-ods in preceding years (Chang et al., 2020). Additionally,the transport volume was reduced by more than 70 % due tothe COVID-19 outbreak (Chang et al., 2020). These drasticgovernment-enforced lockdown measures substantially de-creased the pollutant emissions and at least partly improved
Published by Copernicus Publications on behalf of the European Geosciences Union.
8678 R. Li et al.: The impact of COVID-19 lockdown on air quality in Tangshan, China
local air quality. S. Feng et al. (2020) confirmed that theCOVID-19 lockdown led to more than a 70 % reduction inNOx emissions in many large cities over China. Correspond-ingly, the concentrations of PM2.5 and NO2 decreased by35 % and 60 %, respectively (Shi and Brasseur, 2020). Thenatural experiment provided an unprecedented opportunityto explore the potential for emission reduction and the corre-sponding response of air quality.
A growing body of studies assessed the response of PM2.5and gaseous pollutants to the COVID-19 lockdown andfound that these stringent restrictions resulted in significantdecreases in these pollutant (e.g., PM2.5, NO2, and CO)concentrations (Miyazaki et al., 2020; Marlier et al., 2020).However, some haze events still occurred during this period,especially in East China. Huang et al. (2020) employed thechemical transport models (CTMs) to infer that these extraor-dinary findings might be attributable to enhanced secondarypollution. Understanding that the formation mechanism ofpuzzle haze events depending on CTMs alone might not bevery robust, it was highly imperative to perform more fieldobservations to analyze the temporal variations in chemi-cal compositions, especially the secondary ions (e.g., SO2−
4 ,NO−3 ) in PM2.5 before and after the COVID-19 outbreak, andthen to validate these inferences.
To date, only several field observations analyzed thetemporal variations in chemical components in fine parti-cles during the COVID-19 lockdown period. Chang et al.(2020) observed that a remarkably enhanced nitrate forma-tion in the Yangtze River Delta (YRD) counteracted the de-creases in primary components in fine particles, which wasin good agreement with the modeling result drawn by Huanget al. (2020). In contrast, Xu et al. (2020) found that themarked decreases in fine particle concentrations in Lanzhouduring the COVID-19 lockdown period was mainly con-tributed by the lower production rate for secondary aerosols.Under the condition of similar emission control measures,the polarized conclusion might be associated with the localmeteorology. He et al. (2017) demonstrated that meteorologymight explain more than 70 % of variances in daily averagepollutant levels over China during 2014–2015. Additionally,X. Zhang et al. (2020) also revealed that the release of pri-mary pollutants and the generation of reactive semi-volatileproducts partitioned between gas and aerosol phases werestrongly dependent on the temperature and relative humidity(RH). Thus, in order to accurately assess the effects of lock-down measures on air quality and to reveal the key driver ofthe haze paradox, it was necessary to isolate the contributionof meteorology. Unfortunately, to date, the respective contri-butions of emission and meteorology to chemical composi-tions in PM2.5 during the COVID-19 period have not beenquantified yet in most pioneering studies (Chang et al., 2020;Huang et al., 2020; Xu et al., 2020). Moreover, the compar-ison of source contributions to chemical compositions be-tween pre-lockdown and post-lockdown were scarcely per-
formed. Such knowledge is critical to design effective PM2.5mitigation strategies in the near future.
As a heavily industrialized region, the North China Plain(NCP) possesses many energy-intensive industries includingcoal-fired power plants, non-ferrous smelting industries, tex-tiles, building materials, chemical engineering, and paper-making industries (Ren et al., 2011). Due to these inten-sive industrial emissions, the NCP suffered from poor airquality and frequent aerosol pollution in the past decades(Zhang et al., 2018; Luo et al., 2017). Nevertheless, thesestrict lockdown measures during the COVID-19 period in-evitably led to dramatic decreases in industrial emissions,and thus a study about the response of chemical composi-tions to emission reduction in the heavy-pollution city mightbe more sensible.
Here, we selected the typical industrial city (Tangshan) inthe NCP to determine the concentrations of gaseous pollu-tants and chemical compositions in PM2.5 during 1 January–31 March 2020 and then to analyze their temporal varia-tions before and after the COVID-19 outbreak. Addition-ally, a machine-learning approach was applied to separate thecontributions of emission reduction and meteorology to thetemporal variabilities in chemical compositions and gaseouspollutants. Finally, the source apportionment was performedbased on the meteorology-normalized datasets to comparethe source difference for these pollutants before and after theCOVID-19 lockdown.
2 Materials and methods
2.1 Field observation
Hourly gaseous pollutants and PM2.5 chemical compositionsincluding water-soluble ions and trace elements were mea-sured using online instruments during 1 January–31 March2020 at a supersite in Tangshan. The supersite is located ina commercial region without short-distance industrial emis-sions (Fig. 1). SO2, NO2, and CO concentrations were de-termined by the ultraviolet fluorescence analyzer (TEI model43i from Thermo Fisher Scientific Inc., USA), chemilumi-nescence trace gas analyzer (TEI model 42i from ThermoFisher Scientific Inc., USA), and the correlation infrared ab-sorption analyzer (TAPI model 300E, USA) (Li et al., 2017,2019). The mass concentration of PM2.5 was determinedusing an oscillating balance analyzer (TH-2000Z, China)(Wang et al., 2014). The NH3 concentration and water-soluble ions including sulfate (SO2−
4 ), nitrate (NO−3 ), am-monium (NH+4 ), sodium ion (Na+), and chloridion (Cl−)were monitored with a gas and aerosol collector combinedwith ion chromatography (GAC–IC; TH-PKU-303, China)(Wang et al., 2014; Zheng et al., 2019). Organic carbon (OC)and elemental carbon (EC) were measured using an OC–ECanalyzer (model RT-4, Sunset Laboratory Inc., Tigard, Ore-gon, USA). Nine trace elements including Hg, Pb, K, Ca,
Atmos. Chem. Phys., 21, 8677–8692, 2021 https://doi.org/10.5194/acp-21-8677-2021
R. Li et al.: The impact of COVID-19 lockdown on air quality in Tangshan, China 8679
Cr, Cu, Fe, Ni, and Zn were determined by an online multi-element analyzer (model Xact 625, Cooper Environment Ser-vice, USA). The quality assurance of SO2, NO2, CO, andPM2.5 was conducted based on HJ 630-2011 specifications.For the quality assurance of NH3 and water-soluble ions, theconcentration gradients of anion and cation standard solu-tions were set based on the pollution levels of target species,and correlation coefficients of the calibration curve must behigher than 0.99. Additionally, a standard sample was col-lected each day, and the relative standard deviation for thereproducibility test must be less than 5 %. The online de-vice agreed well with the result determined by filter samplingcoupled with inductively coupled plasma mass spectrometry(ICP-MS) and inductively coupled plasma atomic emissionspectroscopy (ICP-AES).
2.2 Deweathered model development
The air pollutants were influenced by the combined effects ofmeteorological conditions and emissions. In order to quan-tify the contributions of anthropogenic emissions, the im-pacts of meteorological conditions should be removed. In ourstudy, a random forest (RF) approach was employed to serveas the site-specific modeling platform (Chen et al., 2018).All gaseous pollutants and chemical compositions in PM2.5were regarded as the dependent variables. The meteorolog-ical parameters including wind speed (WS), wind direction(WD), air temperature (T ), relative humidity (RH), precipi-tation (Prec), air pressure (P ), and time predictors (year, dayof year (DOY), day of week (DOW), hour) served as the in-dependent variables. The original dataset was randomly clas-sified into a training dataset (90 % of input dataset) for devel-oping the RF model, and the remaining one was treated as thetest dataset. After the building of the RF model, the deweath-ered technique was applied to predict the air pollutant levelat a specific time point (e.g., 1 January 2020 at 12:00 lo-cal time). The differences in original pollutant concentrationsand deweathered pollutant concentrations were regarded asthe concentrations contributed by meteorology. Some statis-tical indicators including R2 value, RMSE, and MAE wereregarded as the major criteria to evaluate the modeling per-formance. In our study, the RF model with theR2 value lowerthan 0.50 was treated as the unreliable result and cannot re-flect the impacts of emission and meteorology on air pollu-tants accurately because more than 50 % of the variability inthe training model cannot be appropriately explained. Afterthe model evaluation, only the species with cross-validationR2 values larger than 0.50 were selected to assess the re-spective contributions of emission and meteorology to theirconcentrations.
2.3 Source apportionment
The positive matrix factorization (PMF 5.0) model versionwas used to perform the PM2.5 source apportionment. The
deweathered gaseous pollutants and chemical compositionsin PM2.5 were incorporated into the model. The objective ofPMF is to resolve the issues of chemical mass balance be-tween measured concentration of each species and its sourcecontributions by decomposing the input matrix into fac-tor contribution and factor profile. The detailed equation isshown in Eqs. (1) and (2). Briefly, the basic principle of PMFis to calculate the least object function Q when the gik mustbe a positive definite matrix based on Eq. (2) (Chen et al.,2014; Sharma et al., 2016).
xij =
p∑k=1
gikfkj + eij (1)
Q=
n∑i=1
m∑j=1
xij −
p∑k=1
gikfkj
uij
2
, (2)
where xij and eij represent the concentration and uncertaintyin the j th species, respectively; gik represents the contribu-tion ratio of the kth source to the ith sample; fkj representsthe ratio of the j th species in the kth source; and eij indicatesthe residual of the j th species in the ith sample. The uncer-tainties associated with factor profiles were evaluated usingthree error calculation methods including the bootstraps (BS)method, displacement (DISP) analysis, and the combinationmethod of DISP and BS (BS–DISP). For the BS method,100 runs were performed, and the result has been believedto be valid since all of the factors showed a mapping ofabove 90 %. DISP analysis also confirmed that the solutionwas considered to be stable because the observed drop in theQ value was less than 0.1 %, and no factor swap occurred.For the BS–DISP analysis, the solution has been verified tobe useful because the observed drop in the Q value was lessthan 0.5 %. Furthermore, both of the results from BS and BS–DISP did not suggest any asymmetry or rotational ambiguityfor all of the factors (Manousakas et al., 2017; Brown et al.,2015).
3 Results and discussion
3.1 The concentration changes in gaseous pollutantsand PM2.5 chemical compositions
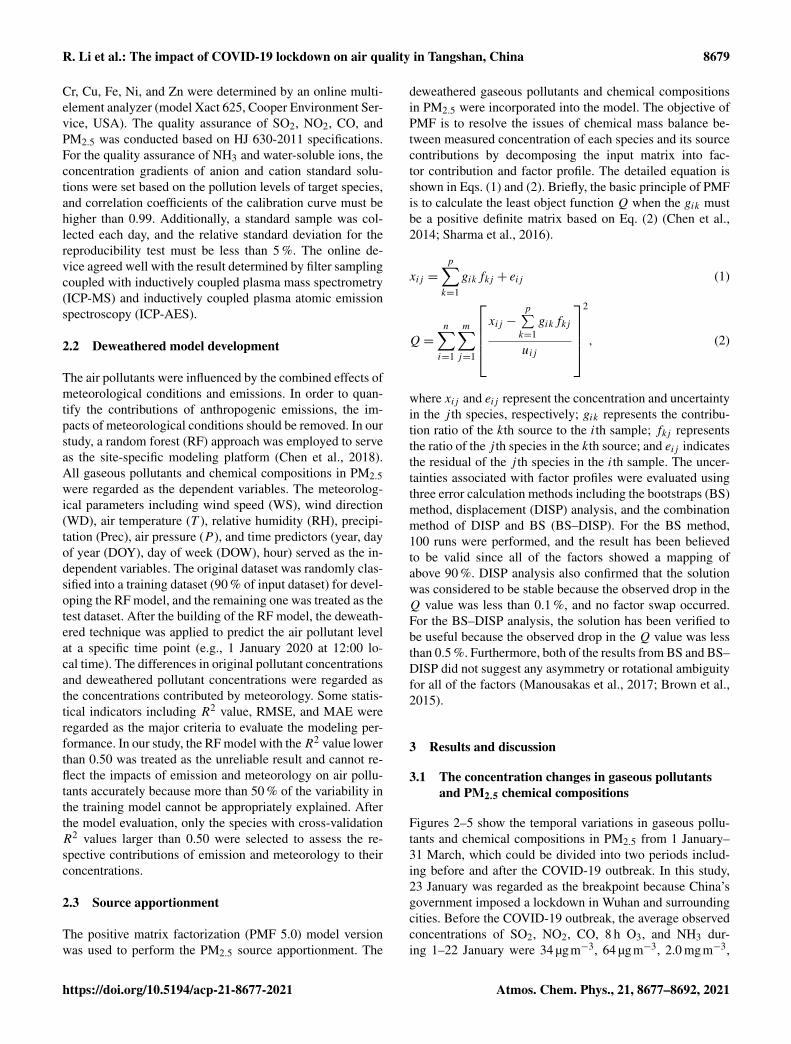
Figures 2–5 show the temporal variations in gaseous pollu-tants and chemical compositions in PM2.5 from 1 January–31 March, which could be divided into two periods includ-ing before and after the COVID-19 outbreak. In this study,23 January was regarded as the breakpoint because China’sgovernment imposed a lockdown in Wuhan and surroundingcities. Before the COVID-19 outbreak, the average observedconcentrations of SO2, NO2, CO, 8 h O3, and NH3 dur-ing 1–22 January were 34 µgm−3, 64 µgm−3, 2.0 mgm−3,
https://doi.org/10.5194/acp-21-8677-2021 Atmos. Chem. Phys., 21, 8677–8692, 2021

8680 R. Li et al.: The impact of COVID-19 lockdown on air quality in Tangshan, China
Figure 1. The topographic map of China indicating the location of Tangshan (a), sampling site (b), and some key industrial points (b). Thepopulation density of Tangshan is also depicted in (b). The red circle in (b) represents the industrial points, and the pink pentagram denotesthe sampling site.
19 µgm−3, and 14 ppb, respectively. After the COVID-19 lockdown, the mean concentrations of these gaseouspollutants changed to 25 µgm−3, 39 µgm−3, 1.6 mgm−3,49 µgm−3, and 18 ppb, respectively. Overall, CO, SO2, andNO2 concentrations decreased by 18 %, 27 %, and 39 %, re-spectively (p < 0.05). However, the NH3 and O3 concentra-tion increased by 35 % (p < 0.05) and 160 % (p < 0.01).
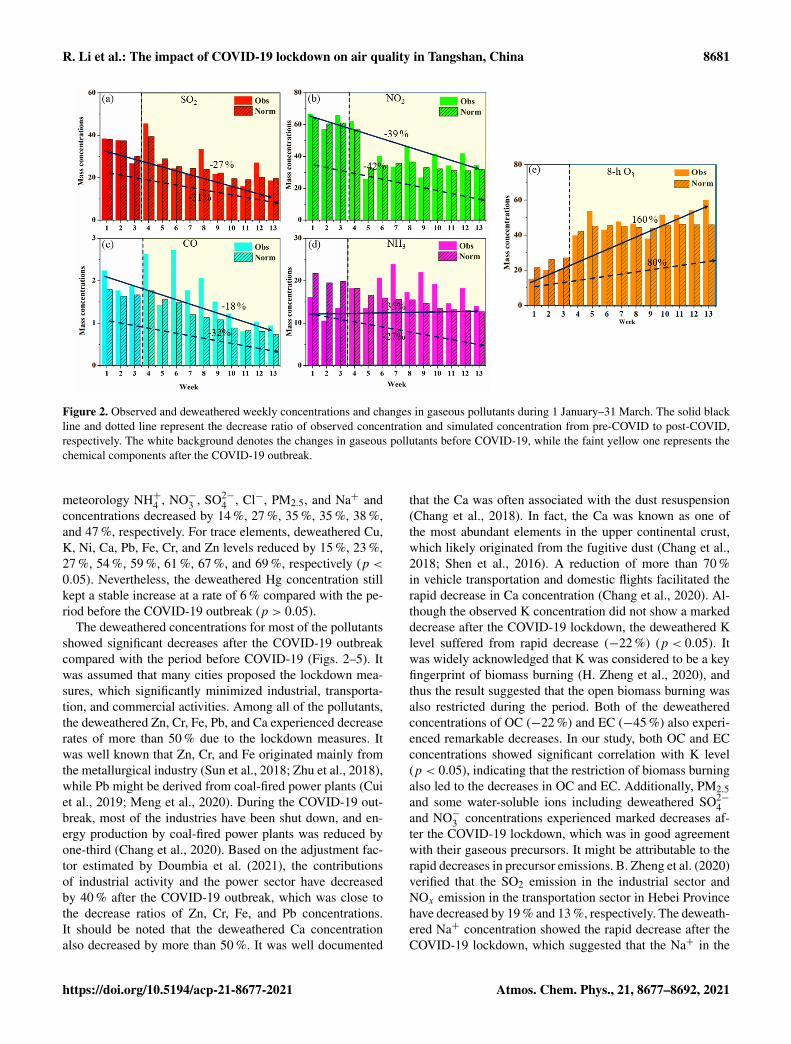
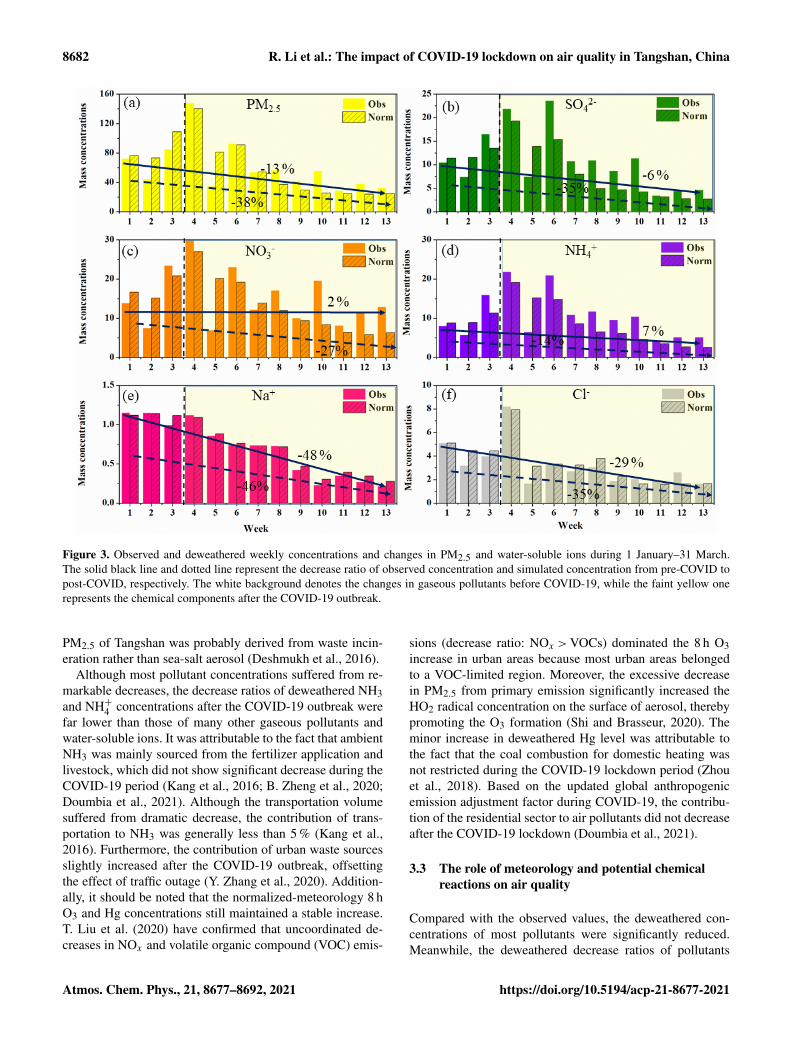
As shown in Fig. 2, the chemical compositions in PM2.5also showed dramatic changes during 1 January–31 Marchdue to the impact of the COVID-19 lockdown. The ob-served SO2−
4 , PM2.5, Na+, and Cl− concentrations decreasedby 6 % (p > 0.05), 13 % (p > 0.05), 29 % (p < 0.05), and48 % (p < 0.01), respectively, while observed NO−3 (2 %)and NH+4 (7 %) levels showed slight increases (p > 0.05).In Shanghai, Chen et al. (2020) revealed that SO2−
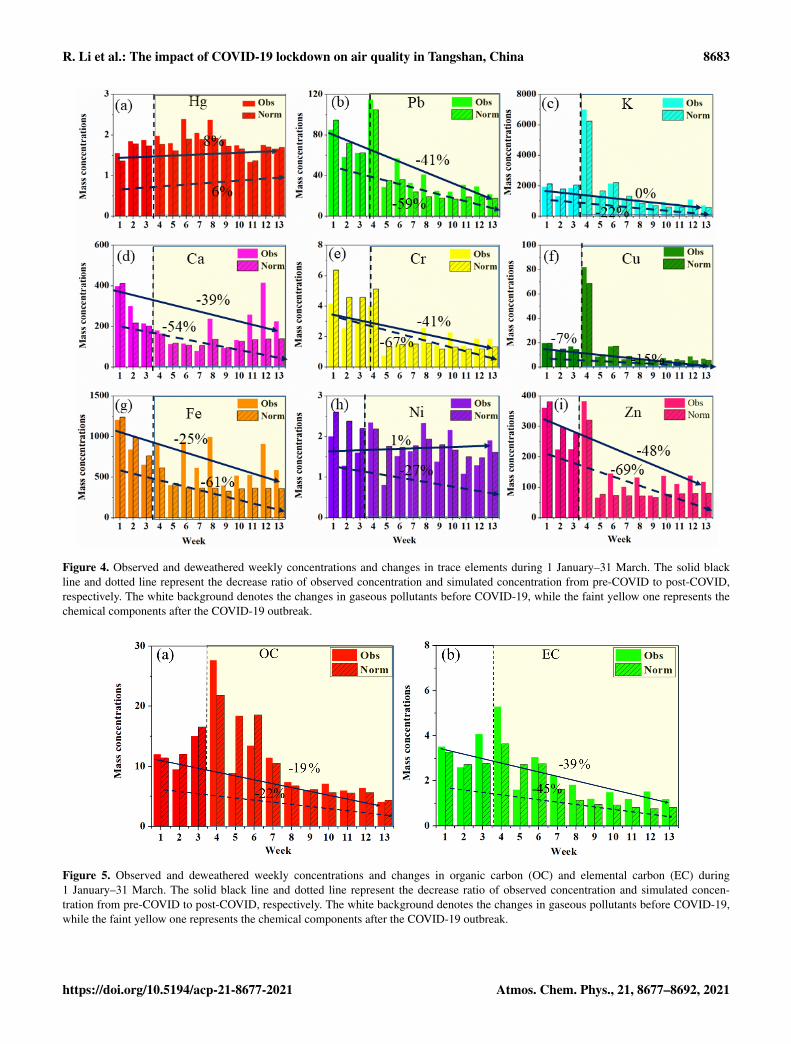
4 andNH+4 concentrations displayed significant decreases after theCOVID-19 outbreak due to the obvious decreases in precur-sor concentrations (e.g., SO2, NOx). However, both observedNO−3 and NH+4 concentrations in Tangshan even showedslight increases, though the NO2 concentration suffered froma remarkable decrease. It was assumed that the adverse mete-orological conditions might be beneficial to the pollutant ac-cumulation (Zheng et al., 2019; Y. Zhang et al., 2019). Addi-tionally, the concentrations of nine trace elements were alsodetermined. The observed values of Fe (25 %), Ca (39 %), Pb(41 %), Cr (41 %), and Zn (48 %) suffered from dramatic de-creases (p < 0.05), while the K (0 %), Ni (1 %), and Hg (8 %)concentrations still displayed slight increases (p > 0.05). Asa whole, the temporal variability in these elements in Tang-shan before and after the COVID-19 lockdown was in agree-ment with the result in Beijing (He et al., 2017). However,the K concentration in Beijing showed rapid decrease afterthe COVID-19 outbreak, which was not coincident with ourstudy (He et al., 2017). It suggested that the slight increasein K in Tangshan might be linked with the unfavorable me-teorological conditions (He et al., 2017). The observed con-
centrations of OC (−19 %) and EC (−39 %) also sufferedfrom rapid decreases after the COVID-19 lockdown (Fig. 4)(p < 0.05), which was in good agreement with the sea-saltions (e.g., Na+, Cl−) and most trace elements (e.g., Zn, Pb).
3.2 The impact of emission reduction in air quality
Although the observed concentrations of air pollutants canbe applied to analyze the impact of the COVID-19 lock-down, the role of emission reduction in air quality mightnot be clearly revealed because the meteorological factorswere also important variables influencing the air pollutantconcentrations. In order to accurately reflect the response ofair quality to emission reduction during the COVID-19 lock-down period, the meteorological conditions were isolatedby the machine-learning model. In our study, we developeda random forest model to remove the impacts of meteoro-logical conditions on air pollutants. Based on the results inFigs. S1–S5 in the Supplement, the RF models for most ofthe species showed better performance because their R2 val-ues were higher than 0.50, and the slope of all of the fittingcurves was also close to the R2 values. However, some otherspecies such as Ag, Cd, and Mg2+ showed worse predictiveperformances, and thus these data cannot be utilized to distin-guish the impacts of meteorology and emission on the con-centrations of these species. Based on the cross-validationR2 value, the species with an R2 value higher than 0.50 wereapplied to assess the contributions of meteorology and emis-sion to the concentrations. The deweathered concentrationsof gaseous pollutants and chemical compositions in PM2.5are depicted in Figs. 2–5. Compared with the period beforeCOVID-19, the deweathered NH3, SO2, CO, and NO2 con-centrations decreased by 27 %, 31 %, 32 %, and 42 % af-ter the COVID-19 lockdown period outbreak, respectively(p < 0.05), while the deweathered 8 h O3 concentration in-creased by 80 % (p < 0.01). Meanwhile, the normalized-
Atmos. Chem. Phys., 21, 8677–8692, 2021 https://doi.org/10.5194/acp-21-8677-2021
R. Li et al.: The impact of COVID-19 lockdown on air quality in Tangshan, China 8681
Figure 2. Observed and deweathered weekly concentrations and changes in gaseous pollutants during 1 January–31 March. The solid blackline and dotted line represent the decrease ratio of observed concentration and simulated concentration from pre-COVID to post-COVID,respectively. The white background denotes the changes in gaseous pollutants before COVID-19, while the faint yellow one represents thechemical components after the COVID-19 outbreak.
meteorology NH+4 , NO−3 , SO2−4 , Cl−, PM2.5, and Na+ and
concentrations decreased by 14 %, 27 %, 35 %, 35 %, 38 %,and 47 %, respectively. For trace elements, deweathered Cu,K, Ni, Ca, Pb, Fe, Cr, and Zn levels reduced by 15 %, 23 %,27 %, 54 %, 59 %, 61 %, 67 %, and 69 %, respectively (p <0.05). Nevertheless, the deweathered Hg concentration stillkept a stable increase at a rate of 6 % compared with the pe-riod before the COVID-19 outbreak (p > 0.05).
The deweathered concentrations for most of the pollutantsshowed significant decreases after the COVID-19 outbreakcompared with the period before COVID-19 (Figs. 2–5). Itwas assumed that many cities proposed the lockdown mea-sures, which significantly minimized industrial, transporta-tion, and commercial activities. Among all of the pollutants,the deweathered Zn, Cr, Fe, Pb, and Ca experienced decreaserates of more than 50 % due to the lockdown measures. Itwas well known that Zn, Cr, and Fe originated mainly fromthe metallurgical industry (Sun et al., 2018; Zhu et al., 2018),while Pb might be derived from coal-fired power plants (Cuiet al., 2019; Meng et al., 2020). During the COVID-19 out-break, most of the industries have been shut down, and en-ergy production by coal-fired power plants was reduced byone-third (Chang et al., 2020). Based on the adjustment fac-tor estimated by Doumbia et al. (2021), the contributionsof industrial activity and the power sector have decreasedby 40 % after the COVID-19 outbreak, which was close tothe decrease ratios of Zn, Cr, Fe, and Pb concentrations.It should be noted that the deweathered Ca concentrationalso decreased by more than 50 %. It was well documented
that the Ca was often associated with the dust resuspension(Chang et al., 2018). In fact, the Ca was known as one ofthe most abundant elements in the upper continental crust,which likely originated from the fugitive dust (Chang et al.,2018; Shen et al., 2016). A reduction of more than 70 %in vehicle transportation and domestic flights facilitated therapid decrease in Ca concentration (Chang et al., 2020). Al-though the observed K concentration did not show a markeddecrease after the COVID-19 lockdown, the deweathered Klevel suffered from rapid decrease (−22 %) (p < 0.05). Itwas widely acknowledged that K was considered to be a keyfingerprint of biomass burning (H. Zheng et al., 2020), andthus the result suggested that the open biomass burning wasalso restricted during the period. Both of the deweatheredconcentrations of OC (−22 %) and EC (−45 %) also experi-enced remarkable decreases. In our study, both OC and ECconcentrations showed significant correlation with K level(p < 0.05), indicating that the restriction of biomass burningalso led to the decreases in OC and EC. Additionally, PM2.5and some water-soluble ions including deweathered SO2−
4and NO−3 concentrations experienced marked decreases af-ter the COVID-19 lockdown, which was in good agreementwith their gaseous precursors. It might be attributable to therapid decreases in precursor emissions. B. Zheng et al. (2020)verified that the SO2 emission in the industrial sector andNOx emission in the transportation sector in Hebei Provincehave decreased by 19 % and 13 %, respectively. The deweath-ered Na+ concentration showed the rapid decrease after theCOVID-19 lockdown, which suggested that the Na+ in the
https://doi.org/10.5194/acp-21-8677-2021 Atmos. Chem. Phys., 21, 8677–8692, 2021
8682 R. Li et al.: The impact of COVID-19 lockdown on air quality in Tangshan, China
Figure 3. Observed and deweathered weekly concentrations and changes in PM2.5 and water-soluble ions during 1 January–31 March.The solid black line and dotted line represent the decrease ratio of observed concentration and simulated concentration from pre-COVID topost-COVID, respectively. The white background denotes the changes in gaseous pollutants before COVID-19, while the faint yellow onerepresents the chemical components after the COVID-19 outbreak.
PM2.5 of Tangshan was probably derived from waste incin-eration rather than sea-salt aerosol (Deshmukh et al., 2016).
Although most pollutant concentrations suffered from re-markable decreases, the decrease ratios of deweathered NH3and NH+4 concentrations after the COVID-19 outbreak werefar lower than those of many other gaseous pollutants andwater-soluble ions. It was attributable to the fact that ambientNH3 was mainly sourced from the fertilizer application andlivestock, which did not show significant decrease during theCOVID-19 period (Kang et al., 2016; B. Zheng et al., 2020;Doumbia et al., 2021). Although the transportation volumesuffered from dramatic decrease, the contribution of trans-portation to NH3 was generally less than 5 % (Kang et al.,2016). Furthermore, the contribution of urban waste sourcesslightly increased after the COVID-19 outbreak, offsettingthe effect of traffic outage (Y. Zhang et al., 2020). Addition-ally, it should be noted that the normalized-meteorology 8 hO3 and Hg concentrations still maintained a stable increase.T. Liu et al. (2020) have confirmed that uncoordinated de-creases in NOx and volatile organic compound (VOC) emis-
sions (decrease ratio: NOx >VOCs) dominated the 8 h O3increase in urban areas because most urban areas belongedto a VOC-limited region. Moreover, the excessive decreasein PM2.5 from primary emission significantly increased theHO2 radical concentration on the surface of aerosol, therebypromoting the O3 formation (Shi and Brasseur, 2020). Theminor increase in deweathered Hg level was attributable tothe fact that the coal combustion for domestic heating wasnot restricted during the COVID-19 lockdown period (Zhouet al., 2018). Based on the updated global anthropogenicemission adjustment factor during COVID-19, the contribu-tion of the residential sector to air pollutants did not decreaseafter the COVID-19 lockdown (Doumbia et al., 2021).
3.3 The role of meteorology and potential chemicalreactions on air quality
Compared with the observed values, the deweathered con-centrations of most pollutants were significantly reduced.Meanwhile, the deweathered decrease ratios of pollutants
Atmos. Chem. Phys., 21, 8677–8692, 2021 https://doi.org/10.5194/acp-21-8677-2021
R. Li et al.: The impact of COVID-19 lockdown on air quality in Tangshan, China 8683
Figure 4. Observed and deweathered weekly concentrations and changes in trace elements during 1 January–31 March. The solid blackline and dotted line represent the decrease ratio of observed concentration and simulated concentration from pre-COVID to post-COVID,respectively. The white background denotes the changes in gaseous pollutants before COVID-19, while the faint yellow one represents thechemical components after the COVID-19 outbreak.
Figure 5. Observed and deweathered weekly concentrations and changes in organic carbon (OC) and elemental carbon (EC) during1 January–31 March. The solid black line and dotted line represent the decrease ratio of observed concentration and simulated concen-tration from pre-COVID to post-COVID, respectively. The white background denotes the changes in gaseous pollutants before COVID-19,while the faint yellow one represents the chemical components after the COVID-19 outbreak.
https://doi.org/10.5194/acp-21-8677-2021 Atmos. Chem. Phys., 21, 8677–8692, 2021
8684 R. Li et al.: The impact of COVID-19 lockdown on air quality in Tangshan, China
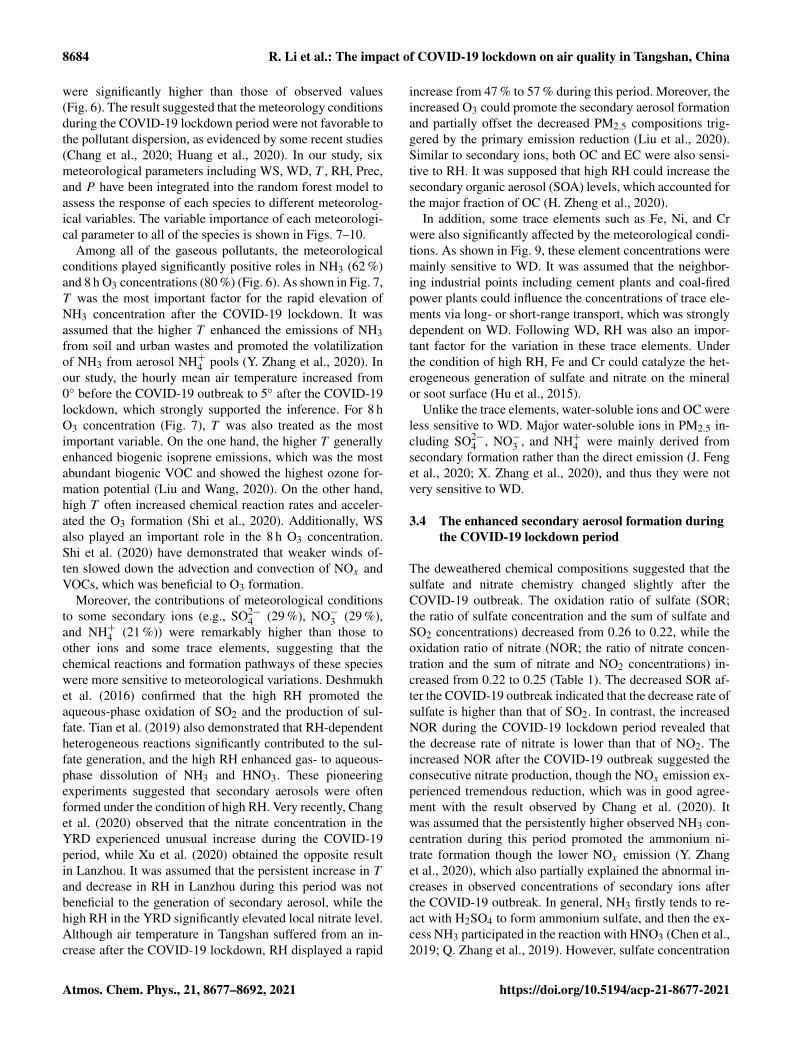
were significantly higher than those of observed values(Fig. 6). The result suggested that the meteorology conditionsduring the COVID-19 lockdown period were not favorable tothe pollutant dispersion, as evidenced by some recent studies(Chang et al., 2020; Huang et al., 2020). In our study, sixmeteorological parameters including WS, WD, T , RH, Prec,and P have been integrated into the random forest model toassess the response of each species to different meteorolog-ical variables. The variable importance of each meteorologi-cal parameter to all of the species is shown in Figs. 7–10.
Among all of the gaseous pollutants, the meteorologicalconditions played significantly positive roles in NH3 (62 %)and 8 h O3 concentrations (80 %) (Fig. 6). As shown in Fig. 7,T was the most important factor for the rapid elevation ofNH3 concentration after the COVID-19 lockdown. It wasassumed that the higher T enhanced the emissions of NH3from soil and urban wastes and promoted the volatilizationof NH3 from aerosol NH+4 pools (Y. Zhang et al., 2020). Inour study, the hourly mean air temperature increased from0◦ before the COVID-19 outbreak to 5◦ after the COVID-19lockdown, which strongly supported the inference. For 8 hO3 concentration (Fig. 7), T was also treated as the mostimportant variable. On the one hand, the higher T generallyenhanced biogenic isoprene emissions, which was the mostabundant biogenic VOC and showed the highest ozone for-mation potential (Liu and Wang, 2020). On the other hand,high T often increased chemical reaction rates and acceler-ated the O3 formation (Shi et al., 2020). Additionally, WSalso played an important role in the 8 h O3 concentration.Shi et al. (2020) have demonstrated that weaker winds of-ten slowed down the advection and convection of NOx andVOCs, which was beneficial to O3 formation.
Moreover, the contributions of meteorological conditionsto some secondary ions (e.g., SO2−
4 (29 %), NO−3 (29 %),and NH+4 (21 %)) were remarkably higher than those toother ions and some trace elements, suggesting that thechemical reactions and formation pathways of these specieswere more sensitive to meteorological variations. Deshmukhet al. (2016) confirmed that the high RH promoted theaqueous-phase oxidation of SO2 and the production of sul-fate. Tian et al. (2019) also demonstrated that RH-dependentheterogeneous reactions significantly contributed to the sul-fate generation, and the high RH enhanced gas- to aqueous-phase dissolution of NH3 and HNO3. These pioneeringexperiments suggested that secondary aerosols were oftenformed under the condition of high RH. Very recently, Changet al. (2020) observed that the nitrate concentration in theYRD experienced unusual increase during the COVID-19period, while Xu et al. (2020) obtained the opposite resultin Lanzhou. It was assumed that the persistent increase in Tand decrease in RH in Lanzhou during this period was notbeneficial to the generation of secondary aerosol, while thehigh RH in the YRD significantly elevated local nitrate level.Although air temperature in Tangshan suffered from an in-crease after the COVID-19 lockdown, RH displayed a rapid
increase from 47 % to 57 % during this period. Moreover, theincreased O3 could promote the secondary aerosol formationand partially offset the decreased PM2.5 compositions trig-gered by the primary emission reduction (Liu et al., 2020).Similar to secondary ions, both OC and EC were also sensi-tive to RH. It was supposed that high RH could increase thesecondary organic aerosol (SOA) levels, which accounted forthe major fraction of OC (H. Zheng et al., 2020).
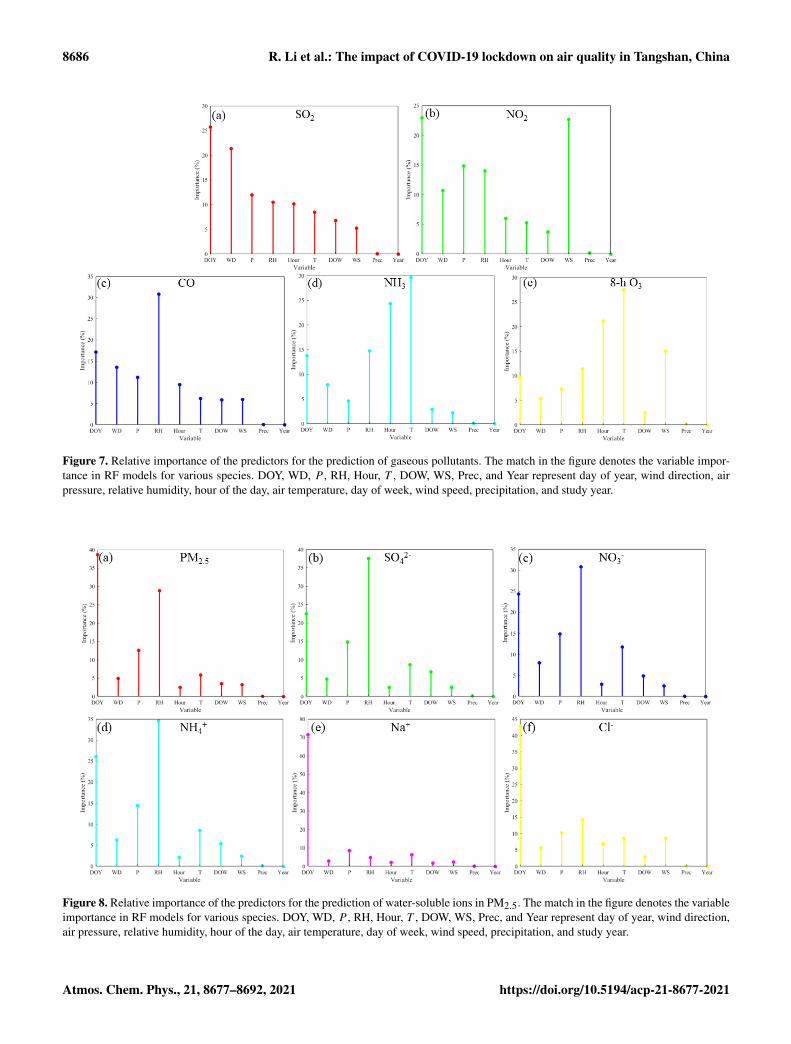
In addition, some trace elements such as Fe, Ni, and Crwere also significantly affected by the meteorological condi-tions. As shown in Fig. 9, these element concentrations weremainly sensitive to WD. It was assumed that the neighbor-ing industrial points including cement plants and coal-firedpower plants could influence the concentrations of trace ele-ments via long- or short-range transport, which was stronglydependent on WD. Following WD, RH was also an impor-tant factor for the variation in these trace elements. Underthe condition of high RH, Fe and Cr could catalyze the het-erogeneous generation of sulfate and nitrate on the mineralor soot surface (Hu et al., 2015).
Unlike the trace elements, water-soluble ions and OC wereless sensitive to WD. Major water-soluble ions in PM2.5 in-cluding SO2−
4 , NO−3 , and NH+4 were mainly derived fromsecondary formation rather than the direct emission (J. Fenget al., 2020; X. Zhang et al., 2020), and thus they were notvery sensitive to WD.
3.4 The enhanced secondary aerosol formation duringthe COVID-19 lockdown period
The deweathered chemical compositions suggested that thesulfate and nitrate chemistry changed slightly after theCOVID-19 outbreak. The oxidation ratio of sulfate (SOR;the ratio of sulfate concentration and the sum of sulfate andSO2 concentrations) decreased from 0.26 to 0.22, while theoxidation ratio of nitrate (NOR; the ratio of nitrate concen-tration and the sum of nitrate and NO2 concentrations) in-creased from 0.22 to 0.25 (Table 1). The decreased SOR af-ter the COVID-19 outbreak indicated that the decrease rate ofsulfate is higher than that of SO2. In contrast, the increasedNOR during the COVID-19 lockdown period revealed thatthe decrease rate of nitrate is lower than that of NO2. Theincreased NOR after the COVID-19 outbreak suggested theconsecutive nitrate production, though the NOx emission ex-perienced tremendous reduction, which was in good agree-ment with the result observed by Chang et al. (2020). Itwas assumed that the persistently higher observed NH3 con-centration during this period promoted the ammonium ni-trate formation though the lower NOx emission (Y. Zhanget al., 2020), which also partially explained the abnormal in-creases in observed concentrations of secondary ions afterthe COVID-19 outbreak. In general, NH3 firstly tends to re-act with H2SO4 to form ammonium sulfate, and then the ex-cess NH3 participated in the reaction with HNO3 (Chen et al.,2019; Q. Zhang et al., 2019). However, sulfate concentration
Atmos. Chem. Phys., 21, 8677–8692, 2021 https://doi.org/10.5194/acp-21-8677-2021

R. Li et al.: The impact of COVID-19 lockdown on air quality in Tangshan, China 8685
Figure 6. The changes in observed concentrations of multiple components between pre-lockdown (week 1–3) and post-lockdown (week 4–13) against the changes derived from the emission and meteorological changes. The gaseous pollutants, water-soluble ions and carbonaceousaerosols, and trace metals are shown in (a–c), respectively.
suffered from a more dramatic decrease compared with SO2,which might be associated with the aerosol acidity during theCOVID-19 lockdown period. The ratio of NH+4 and the sumof SO2−
4 , NO−3 , and Cl−, named C/A, was regarded as anindicator to reflect the aerosol acidity. In our study, the C/Avalue decreased from 0.33 to 0.28 after the COVID-19 out-break, implicating that the aerosol acidity even showed slightincrease during the COVID-19 lockdown period. It was wellknown that the higher aerosol acidity might prohibit the con-version from SO2 to sulfate (Liu et al., 2020; Shao et al.,2019), which yielded the lower SOR.
3.5 The impact of the COVID-19 lockdown on sourceapportionment
The emission control measures inevitably triggered the vari-ation in source apportionment (Liu et al., 2017; Meng et al.,2020). In the present study, positive matrix factorization(PMF 5.0) was employed to identify the major sources ofPM2.5 in Tangshan before and after the COVID-19 outbreak.
Table 1. SOR, NOR, and C/A values in pre-COVID and post-COVID (SOR= SO2−
4 /(SO2−4 +SO2), NOR= NO−3 /(NO−3 +
NO2), C/A= NH+4 /(SO2−4 +NO−3 +Cl−)).
SOR NOR C/A
Pre-COVID 0.26 0.22 0.33Post-COVID 0.22 0.25 0.28
About three- to nine-factor solutions were examined, and afive-factor solution obtained the lowest Q (robust) and Q(true) values. Additionally, the PMF analysis and error diag-nostics also suggested that the result was robust (Tables S2–S4 in the Supplement).
The source apportionment profiles pre-COVID and post-COVID resolved by PMF are depicted in Fig. 11. For pre-COVID, the first factor contributed 36 % to the total species.The factor was characterized by high levels of NH+4 (41 %),SO2−
4 (35 %), and NO−3 (33 %). SO2−4 and NO−3 were gen-
https://doi.org/10.5194/acp-21-8677-2021 Atmos. Chem. Phys., 21, 8677–8692, 2021
8686 R. Li et al.: The impact of COVID-19 lockdown on air quality in Tangshan, China
Figure 7. Relative importance of the predictors for the prediction of gaseous pollutants. The match in the figure denotes the variable impor-tance in RF models for various species. DOY, WD, P , RH, Hour, T , DOW, WS, Prec, and Year represent day of year, wind direction, airpressure, relative humidity, hour of the day, air temperature, day of week, wind speed, precipitation, and study year.
Figure 8. Relative importance of the predictors for the prediction of water-soluble ions in PM2.5. The match in the figure denotes the variableimportance in RF models for various species. DOY, WD, P , RH, Hour, T , DOW, WS, Prec, and Year represent day of year, wind direction,air pressure, relative humidity, hour of the day, air temperature, day of week, wind speed, precipitation, and study year.
Atmos. Chem. Phys., 21, 8677–8692, 2021 https://doi.org/10.5194/acp-21-8677-2021
R. Li et al.: The impact of COVID-19 lockdown on air quality in Tangshan, China 8687
Figure 9. Relative importance of the predictors for the prediction of trace elements in PM2.5. The match in the figure denotes the variableimportance in RF models for various species. DOY, WD, P , RH, Hour, T , DOW, WS, Prec, and Year represent day of year, wind direction,air pressure, relative humidity, hour of the day, air temperature, day of week, wind speed, precipitation, and study year.
erally produced by oxidation of SO2 and NOx , respectively.The NH+4 was often formed through the heterogeneous re-action of NH3 and sulfate or HNO3. Thus, the factor wasregarded as the secondary formation (SF). The second factorwas characterized by high loadings of Zn (47 %), Cr (42 %),Fe (42 %), and Pb (31 %). Cr and Fe were mainly originatedfrom fuel combustion and the metallurgical industry such aschrome plating and steel production (J. Liu et al., 2018),while Pb and Zn were derived from the roasting, sintering,and smelting process for the extraction of Pb and Zn ores(Wu et al., 2012). Therefore, the factor 2 was treated as theindustrial process (IP) source. The predominant species infactor 3 included Na+ (42 %), K (40 %), OC (35 %), and EC(33 %). K was often regarded as the fingerprint of biomassburning (BB) (Chen et al., 2017; Zheng et al., 2019), whereasthe Na+ was generally regarded as the tracer of waste in-cineration (Alam et al., 2019; Durlak et al., 1997). Hence,
factor 3 was treated as the BB source. Tangshan sufferedfrom remarkable increasing usage of biomass fuels for do-mestic heating in winter, which promoted the emissions ofK and Na+ (Chen et al., 2017). The most abundant speciesin factor 4 were Hg (75 %), Pb (68 %), K (36 %), Cu (35 %),Cl− (33 %), and SO2−
4 (27 %). Pb, Hg, and Cu were typicalmarker elements for coal combustion, and around 56 % of Pband 47 % of Hg were released from coal combustion (Chenget al., 2015; Zhu et al., 2020). In northern China, coal-baseddomestic heating was one of the most important sectors ofcoal consumption (K. Liu et al., 2018). Dai et al. (2019)also verified that the residential coal combustion was a ma-jor source of primary sulfate. Thus, factor 4 was regarded asthe coal combustion (CC) source. The last factor was dis-tinguished by high loadings of Fe (46 %), Ni (45 %), andCa (38 %). Fe and Ca were main elements enriched in up-per crust, and Ni was enriched in brake wear and tire wear
https://doi.org/10.5194/acp-21-8677-2021 Atmos. Chem. Phys., 21, 8677–8692, 2021
8688 R. Li et al.: The impact of COVID-19 lockdown on air quality in Tangshan, China
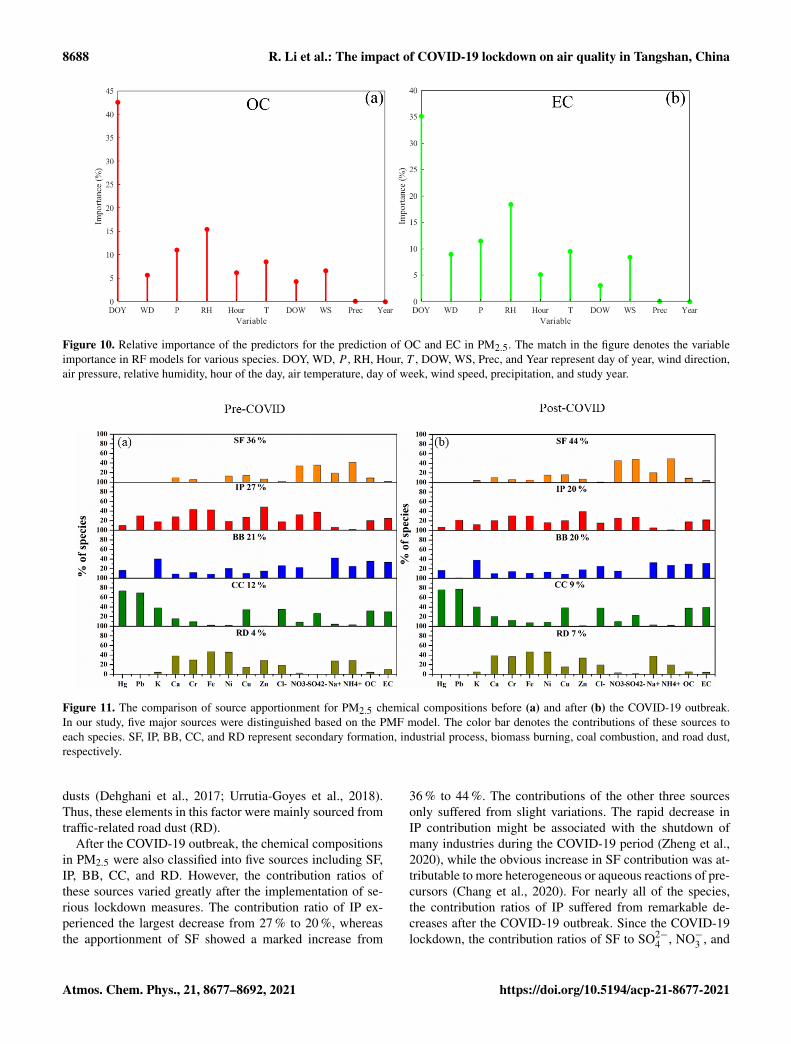
Figure 10. Relative importance of the predictors for the prediction of OC and EC in PM2.5. The match in the figure denotes the variableimportance in RF models for various species. DOY, WD, P , RH, Hour, T , DOW, WS, Prec, and Year represent day of year, wind direction,air pressure, relative humidity, hour of the day, air temperature, day of week, wind speed, precipitation, and study year.
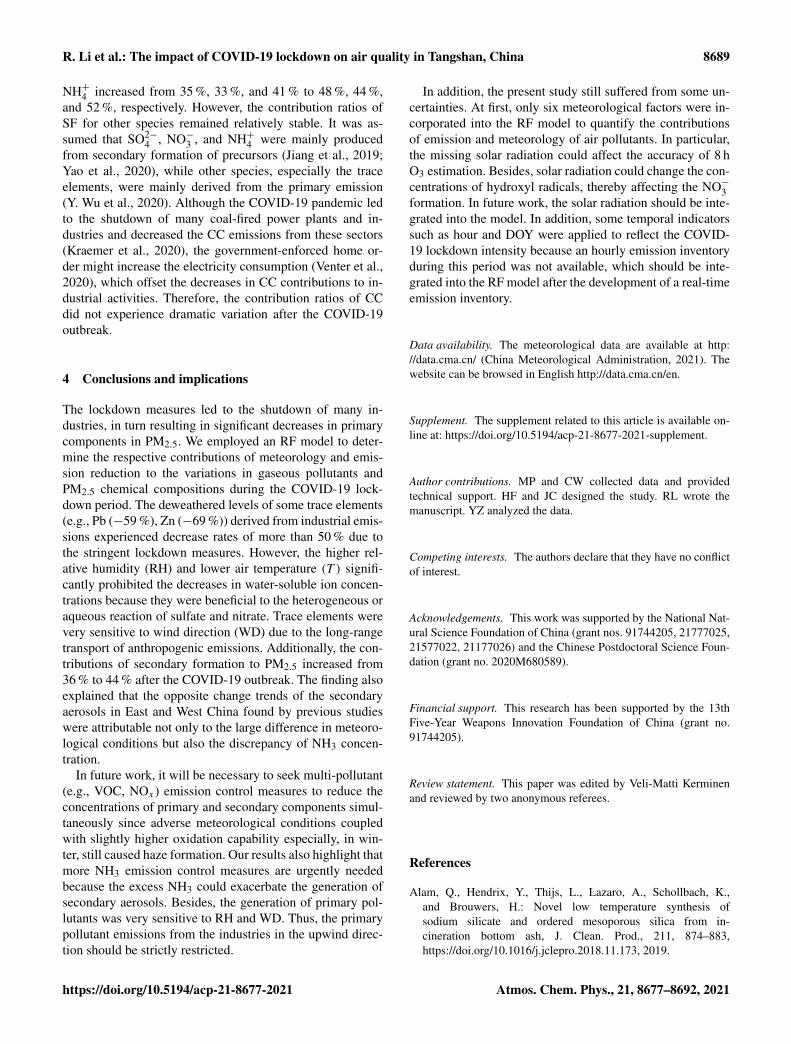
Figure 11. The comparison of source apportionment for PM2.5 chemical compositions before (a) and after (b) the COVID-19 outbreak.In our study, five major sources were distinguished based on the PMF model. The color bar denotes the contributions of these sources toeach species. SF, IP, BB, CC, and RD represent secondary formation, industrial process, biomass burning, coal combustion, and road dust,respectively.
dusts (Dehghani et al., 2017; Urrutia-Goyes et al., 2018).Thus, these elements in this factor were mainly sourced fromtraffic-related road dust (RD).
After the COVID-19 outbreak, the chemical compositionsin PM2.5 were also classified into five sources including SF,IP, BB, CC, and RD. However, the contribution ratios ofthese sources varied greatly after the implementation of se-rious lockdown measures. The contribution ratio of IP ex-perienced the largest decrease from 27 % to 20 %, whereasthe apportionment of SF showed a marked increase from
36 % to 44 %. The contributions of the other three sourcesonly suffered from slight variations. The rapid decrease inIP contribution might be associated with the shutdown ofmany industries during the COVID-19 period (Zheng et al.,2020), while the obvious increase in SF contribution was at-tributable to more heterogeneous or aqueous reactions of pre-cursors (Chang et al., 2020). For nearly all of the species,the contribution ratios of IP suffered from remarkable de-creases after the COVID-19 outbreak. Since the COVID-19lockdown, the contribution ratios of SF to SO2−
4 , NO−3 , and
Atmos. Chem. Phys., 21, 8677–8692, 2021 https://doi.org/10.5194/acp-21-8677-2021
R. Li et al.: The impact of COVID-19 lockdown on air quality in Tangshan, China 8689
NH+4 increased from 35 %, 33 %, and 41 % to 48 %, 44 %,and 52 %, respectively. However, the contribution ratios ofSF for other species remained relatively stable. It was as-sumed that SO2−
4 , NO−3 , and NH+4 were mainly producedfrom secondary formation of precursors (Jiang et al., 2019;Yao et al., 2020), while other species, especially the traceelements, were mainly derived from the primary emission(Y. Wu et al., 2020). Although the COVID-19 pandemic ledto the shutdown of many coal-fired power plants and in-dustries and decreased the CC emissions from these sectors(Kraemer et al., 2020), the government-enforced home or-der might increase the electricity consumption (Venter et al.,2020), which offset the decreases in CC contributions to in-dustrial activities. Therefore, the contribution ratios of CCdid not experience dramatic variation after the COVID-19outbreak.
4 Conclusions and implications
The lockdown measures led to the shutdown of many in-dustries, in turn resulting in significant decreases in primarycomponents in PM2.5. We employed an RF model to deter-mine the respective contributions of meteorology and emis-sion reduction to the variations in gaseous pollutants andPM2.5 chemical compositions during the COVID-19 lock-down period. The deweathered levels of some trace elements(e.g., Pb (−59 %), Zn (−69 %)) derived from industrial emis-sions experienced decrease rates of more than 50 % due tothe stringent lockdown measures. However, the higher rel-ative humidity (RH) and lower air temperature (T ) signifi-cantly prohibited the decreases in water-soluble ion concen-trations because they were beneficial to the heterogeneous oraqueous reaction of sulfate and nitrate. Trace elements werevery sensitive to wind direction (WD) due to the long-rangetransport of anthropogenic emissions. Additionally, the con-tributions of secondary formation to PM2.5 increased from36 % to 44 % after the COVID-19 outbreak. The finding alsoexplained that the opposite change trends of the secondaryaerosols in East and West China found by previous studieswere attributable not only to the large difference in meteoro-logical conditions but also the discrepancy of NH3 concen-tration.
In future work, it will be necessary to seek multi-pollutant(e.g., VOC, NOx) emission control measures to reduce theconcentrations of primary and secondary components simul-taneously since adverse meteorological conditions coupledwith slightly higher oxidation capability especially, in win-ter, still caused haze formation. Our results also highlight thatmore NH3 emission control measures are urgently neededbecause the excess NH3 could exacerbate the generation ofsecondary aerosols. Besides, the generation of primary pol-lutants was very sensitive to RH and WD. Thus, the primarypollutant emissions from the industries in the upwind direc-tion should be strictly restricted.
In addition, the present study still suffered from some un-certainties. At first, only six meteorological factors were in-corporated into the RF model to quantify the contributionsof emission and meteorology of air pollutants. In particular,the missing solar radiation could affect the accuracy of 8 hO3 estimation. Besides, solar radiation could change the con-centrations of hydroxyl radicals, thereby affecting the NO−3formation. In future work, the solar radiation should be inte-grated into the model. In addition, some temporal indicatorssuch as hour and DOY were applied to reflect the COVID-19 lockdown intensity because an hourly emission inventoryduring this period was not available, which should be inte-grated into the RF model after the development of a real-timeemission inventory.
Data availability. The meteorological data are available at http://data.cma.cn/ (China Meteorological Administration, 2021). Thewebsite can be browsed in English http://data.cma.cn/en.
Supplement. The supplement related to this article is available on-line at: https://doi.org/10.5194/acp-21-8677-2021-supplement.
Author contributions. MP and CW collected data and providedtechnical support. HF and JC designed the study. RL wrote themanuscript. YZ analyzed the data.
Competing interests. The authors declare that they have no conflictof interest.
Acknowledgements. This work was supported by the National Nat-ural Science Foundation of China (grant nos. 91744205, 21777025,21577022, 21177026) and the Chinese Postdoctoral Science Foun-dation (grant no. 2020M680589).
Financial support. This research has been supported by the 13thFive-Year Weapons Innovation Foundation of China (grant no.91744205).
Review statement. This paper was edited by Veli-Matti Kerminenand reviewed by two anonymous referees.
References
Alam, Q., Hendrix, Y., Thijs, L., Lazaro, A., Schollbach, K.,and Brouwers, H.: Novel low temperature synthesis ofsodium silicate and ordered mesoporous silica from in-cineration bottom ash, J. Clean. Prod., 211, 874–883,https://doi.org/10.1016/j.jclepro.2018.11.173, 2019.
https://doi.org/10.5194/acp-21-8677-2021 Atmos. Chem. Phys., 21, 8677–8692, 2021
8690 R. Li et al.: The impact of COVID-19 lockdown on air quality in Tangshan, China
Brown, S. G., Eberly, S., Paatero, P., and Norris, G. A.: Meth-ods for estimating uncertainty in PMF solutions: Exampleswith ambient air and water quality data and guidance onreporting PMF results, Sci. Total Environ., 518, 626–635,https://doi.org/10.1016/j.jclepro.2020.124667, 2015.
Chang, Y., Huang, K., Xie, M., Deng, C., Zou, Z., Liu, S., andZhang, Y.: First long-term and near real-time measurement oftrace elements in China’s urban atmosphere: temporal variabil-ity, source apportionment and precipitation effect, Atmos. Chem.Phys., 18, 11793–11812, https://doi.org/10.5194/acp-18-11793-2018, 2018.
Chang, Y., Huang, R. J., Ge, X., Huang, X., Hu, J., Duan, Y.,Zou, Z., Liu, X., and Lehmann, M. F.: Puzzling hazeevents in China during the coronavirus (COVID-19)shutdown, Geophy. Res. Lett., 47, e2020GL088533,https://doi.org/10.1029/2020GL088533, 2020.
Chen, G. B., Li, S. S., Knibbs, L. D., Hamm, N. A. S., Cao, W.,Li, T. T., Guo, J. P., Ren, H. Y., Abramson, M. J., andGuo, Y. M.: A machine learning method to estimate PM2.5concentrations across China with remote sensing, meteorologi-cal and land use information, Sci. Total Environ., 636, 52–60,https://doi.org/10.1016/j.scitotenv.2018.04.251, 2018.
Chen, H., Huo, J., Fu, Q., Duan, Y., Xiao, H., and Chen, J.:Impact of quarantine measures on chemical compo-sitions of PM2.5 during the COVID-19 epidemic inShanghai, China, Sci. Total Environ., 743, 140758,https://doi.org/10.1016/j.scitotenv.2020.140758, 2020.
Chen, J., Li, C., Ristovski, Z., Milic, A., Gu, Y., Islam, M. S.,Wang, S., Hao, J., Zhang, H., and He, C.: A review ofbiomass burning: Emissions and impacts on air quality, healthand climate in China, Sci. Total Environ., 579, 1000–1034,https://doi.org/10.1016/j.scitotenv.2016.11.025, 2017.
Chen, L., Gao, Y., Zhang, M., Fu, J. S., Zhu, J., Liao, H., Li, J.,Huang, K., Ge, B., Wang, X., Lam, Y. F., Lin, C.-Y., Itahashi, S.,Nagashima, T., Kajino, M., Yamaji, K., Wang, Z., and Kurokawa,J.: MICS-Asia III: multi-model comparison and evaluation ofaerosol over East Asia, Atmos. Chem. Phys., 19, 11911–11937,https://doi.org/10.5194/acp-19-11911-2019, 2019.
Chen, W. T., Shao, M., Lu, S. H., Wang, M., Zeng, L.M., Yuan, B., and Liu, Y.: Understanding primary and sec-ondary sources of ambient carbonyl compounds in Beijing us-ing the PMF model, Atmos. Chem. Phys., 14, 3047–3062,https://doi.org/10.5194/acp-14-3047-2014, 2014.
Cheng, K., Wang, Y., Tian, H., Gao, X., Zhang, Y., Wu, X., Zhu, C.,and Gao, J.: Atmospheric emission characteristics and controlpolicies of five precedent-controlled toxic heavy metals from an-thropogenic sources in China, Environ. Sci. Technol., 49, 1206–1214, 2015.
China Meteorological Administration: Hourly meteorological dataof all of the sites in China, available at: http://data.cma.cn/, lastaccess: 5 April 2021.
Cui, Y., Ji, D., Chen, H., Gao, M., Maenhaut, W., He, J.,and Wang, Y.: Characteristics and sources of hourlytrace elements in airborne fine particles in urban Bei-jing, China, J. Geophys. Res.-Atmos., 124, 11595–11613,https://doi.org/10.1029/2019JD030881, 2019.
Dai, Q., Bi, X., Song, W., Li, T., Liu, B., Ding, J., Xu, J., Song, C.,and Yang, N., Schulze, B. C.: Residential coal combustion as a
source of primary sulfate in Xi’an, China, Atmos. Environ., 196,66–76, https://doi.org/10.1016/j.atmosenv.2018.10.002, 2019.
Dehghani, S., Moore, F., Keshavarzi, B., and Beverley, A. H.:Health risk implications of potentially toxic metals in street dustand surface soil of Tehran, Iran, Ecotox. Environ. Safe., 136, 92–103, https://doi.org/10.1016/j.ecoenv.2016.10.037, 2017.
Deshmukh, D. K., Kawamura, K., and Deb, M. K.: Dicarboxylicacids, ω-oxocarboxylic acids, α-dicarbonyls, WSOC, OC, EC,and inorganic ions in wintertime size-segregated aerosols fromcentral India: Sources and formation processes, Chemosphere,161, 27–42, https://doi.org/10.1016/j.chemosphere.2016.06.107,2016.
Durlak, S. K., Biswas, P., and Shi, J.: Equilibrium analysis of the af-fect of temperature, moisture and sodium content on heavy metalemissions from municipal solid waste incinerators, J. Hazard.Mater., 56, 1–20, https://doi.org/10.1016/S0304-3894(97)00002-2, 1997.
Doumbia, T., Granier, C., Elguindi, N., Bouarar, I., Darras, S.,Brasseur, G., Gaubert, B., Liu, Y., Shi, X., Stavrakou, T., Tilmes,S., Lacey, F., Deroubaix, A., and Wang, T.: Changes in global airpollutant emissions during the COVID-19 pandemic: a datasetfor atmospheric chemistry modeling, Earth Syst. Sci. Data Dis-cuss. [preprint], https://doi.org/10.5194/essd-2020-348, in re-view, 2021.
Feng, J., Chan, E., and Vet, R.: Air quality in the easternUnited States and Eastern Canada for 1990–2015: 25 yearsof change in response to emission reductions of SO2 andNOx in the region, Atmos. Chem. Phys., 20, 3107–3134,https://doi.org/10.5194/acp-20-3107-2020, 2020.
Feng, S., Jiang, F., Wang, H., Wang, H., Ju, W., Shen, Y.,Zheng, Y., Wu, Z., and Ding, A.: NOx emission changes overChina during the COVID-19 epidemic inferred from surfaceNO2 observations, Geophys. Res. Lett., 47, e2020GL090080,https://doi.org/10.1029/2020GL088533, 2020.
Griffiths, J. and Woodyatt, A.: Wuhan coronavirus: Thousands ofcases confirmed as China goes into emergency mode, CNN,Archived from the original on 28, 2020.
He, J., Gong, S., Yu, Y., Yu, L., Wu, L., Mao, H., Song, C.,Zhao, S., Liu, H., and Li, X.: Air pollution characteristicsand their relation to meteorological conditions during 2014–2015 in major Chinese cities, Environ. Pollut., 223, 484–496,https://doi.org/10.1016/j.envpol.2017.01.050, 2017.
Horowitz, R. I. and Freeman, P. R.: Three novel prevention, diag-nostic, and treatment options for COVID-19 urgently necessitat-ing controlled randomized trials, Med. Hypotheses, 143, 109851,https://doi.org/10.1016/j.mehy.2020.109851, 2020.
Hu, Y., Lin, J., Zhang, S., Kong, L., Fu, H., and Chen, J.: Identifi-cation of the typical metal particles among haze, fog, and clearepisodes in the Beijing atmosphere, Sci. Total Environ., 511,369–380, https://doi.org/10.1016/j.scitotenv.2014.12.071, 2015.
Huang, X., Ding, A., Gao, J., Zheng, B., Zhou, D., Qi, X.,Tang, R., Wang, J., Ren, C., and Nie, W.: Enhanced sec-ondary pollution offset reduction of primary emissions duringCOVID-19 lockdown in China, Natl. Sci. Rev., 8, nwaa137,https://doi.org/10.1093/nsr/nwaa137, 2020.
Jiang, F., Liu, F., Lin, Q., Fu, Y., Yang, Y., Peng, L., Lian, X.,Zhang, G., Bi, X., and Wang, X.: Characteristics and formationmechanisms of sulfate and nitrate in size-segregated atmosphericparticles from urban Guangzhou, China, Aerosol Air Qual.
Atmos. Chem. Phys., 21, 8677–8692, 2021 https://doi.org/10.5194/acp-21-8677-2021
R. Li et al.: The impact of COVID-19 lockdown on air quality in Tangshan, China 8691
Res., 19, 1284–1293, https://doi.org/10.4209/aaqr.2018.07.0251,2019.
Kang, Y., Liu, M., Song, Y., Huang, X., Yao, H., Cai, X., Zhang,H., Kang, L., Liu, X., Yan, X., He, H., Zhang, Q., Shao, M.,and Zhu, T.: High-resolution ammonia emissions inventories inChina from 1980 to 2012, Atmos. Chem. Phys., 16, 2043–2058,https://doi.org/10.5194/acp-16-2043-2016, 2016.
Kraemer, M. U., Yang, C.-H., Gutierrez, B., Wu, C.-H., Klein, B.,Pigott, D. M., Du Plessis, L., Faria, N. R., Li, R., and Han-age, W. P.: The effect of human mobility and control measureson the COVID-19 epidemic in China, Science, 368, 493–497,https://doi.org/10.1126/science.abb4218, 2020.
Li, R., Cui, L., Li, J., Zhao, A., Fu, H., Wu, Y., Zhang, L.,Kong, L., and Chen, J.: Spatial and temporal variationof particulate matter and gaseous pollutants in Chinaduring 2014–2016, Atmos. Environ., 161, 235–246,https://doi.org/10.1016/j.atmosenv.2017.05.008, 2017.
Li, R., Wang, Z. Z., Cui, L. L., Fu, H. B., Zhang, L. W., Kong,L. D., Chen, W. D., and Chen, J. M.: Air pollution character-istics in China during 2015-2016: spatiotemporal variations andkey meteorological factors, Sci. Total Environ., 648, 902–915,https://doi.org/10.1016/j.scitotenv.2018.08.181, 2019.
Liu, B., Wu, J., Zhang, J., Wang, L., Yang, J., Liang, D., Dai, Q.,Bi, X., Feng, Y., and Zhang, Y.: Characterization and source ap-portionment of PM2.5 based on error estimation from EPA PMF5.0 model at a medium city in China, Environ. Pollut., 222, 10–22, https://doi.org/10.1016/j.envpol.2017.01.005, 2017.
Liu, J., Chen, Y., Chao, S., Cao, H., Zhang, A., andYang, Y.: Emission control priority of PM2.5-bound heavymetals in different seasons: A comprehensive analysis fromhealth risk perspective, Sci. Total Environ., 644, 20–30,https://doi.org/10.1016/j.scitotenv.2018.06.226, 2018.
Liu, K., Wang, S., Wu, Q., Wang, L., Ma, Q., Zhang, L.,Li, G., Tian, H., Duan, L., and Hao, J.: A highly re-solved mercury emission inventory of Chinese coal-firedpower plants, Environ. Sci. Technol., 52, 2400–2408,https://doi.org/10.1021/acs.est.7b06209, 2018.
Liu, P., Ye, C., Xue, C., Zhang, C., Mu, Y., and Sun, X.: Formationmechanisms of atmospheric nitrate and sulfate during the winterhaze pollution periods in Beijing: gas-phase, heterogeneous andaqueous-phase chemistry, Atmos. Chem. Phys., 20, 4153–4165,https://doi.org/10.5194/acp-20-4153-2020, 2020.
Liu, T., Wang, X. Y., Hu, J. L., Wang, Q., An, J. Y., Gong, K. J.,Sun, J. J., Li, L., Qin, M. M., Li, J. Y., Tian, J. J., Huang, Y. W.,Liao, H., Zhou, M., Hu, Q. Y., Yan, R. S., Wang, H. L.,and Huang, C.: Driving Forces of Changes in Air Qual-ity during the COVID-19 Lockdown Period in the YangtzeRiver Delta Region, China, Environ. Sci. Technol., 7, 779–786,https://doi.org/10.1021/acs.estlett.0c00511, 2020.
Liu, Y. and Wang, T.: Worsening urban ozone pollution inChina from 2013 to 2017 – Part 1: The complex and vary-ing roles of meteorology, Atmos. Chem. Phys., 20, 6305–6321,https://doi.org/10.5194/acp-20-6305-2020, 2020.
Luo, R., Han, Y., and Liu, Z.: The current status and factors of in-door PM2.5 in Tangshan, China. Procedia Engineer., 205, 3824–3829, https://doi.org/10.1016/j.proeng.2017.10.086, 2017.
Manousakas, M., Papaefthymiou, H., Diapouli, E., Migliori, A.,Karydas, A., Bogdanovic-Radovic, I., and Eleftheriadis, K.:Assessment of PM2.5 sources and their corresponding level
of uncertainty in a coastal urban area using EPA PMF5.0 enhanced diagnostics, Sci. Total Environ., 574, 155–164,https://doi.org/10.1016/j.scitotenv.2016.09.047, 2017.
Marlier, M. E., Xing, J., Zhu, Y., and Wang, S.: Im-pacts of COVID-19 response actions on air quality inChina, Environmental Research Communications, 28, 075003,https://doi.org/10.1088/2515-7620/aba425, 2020.
Meng, Y., Li, R., Zhao, Y., Cheng, H., Fu, H., Yan, Z.,and Bing, H.: Chemical characterization and sourcesof PM2.5 at a high-alpine ecosystem in the SoutheastTibetan Plateau, China, Atmos. Environ., 235, 117645,https://doi.org/10.1016/j.atmosenv.2020.117645, 2020.
Miyazaki, K., Bowman, K., Sekiya, T., Jiang, Z., Chen, X., Es-kes, H., Ru, M., Zhang, Y., and Shindell, D.: Air Quality Re-sponse in China Linked to the 2019 Novel Coronavirus (COVID-19) Lockdown, Geophys. Res. Lett., 47, e2020GL089252,https://doi.org/10.1029/2020GL089252, 2020.
Ren, Z., Zhang, B., Lu, P., Li, C., Gao, L., and Zheng, M.:Characteristics of air pollution by polychlorinated dibenzo-p-dioxins and dibenzofurans in the typical industrial areasof Tangshan City, China, J. Environ. Sci., 23, 228-235,https://doi.org/10.1016/S1001-0742(10)60425-1, 2011.
Shao, J., Chen, Q., Wang, Y., Lu, X., He, P., Sun, Y., Shah, V.,Martin, R. V., Philip, S., Song, S., Zhao, Y., Xie, Z., Zhang,L., and Alexander, B.: Heterogeneous sulfate aerosol forma-tion mechanisms during wintertime Chinese haze events: airquality model assessment using observations of sulfate oxy-gen isotopes in Beijing, Atmos. Chem. Phys., 19, 6107–6123,https://doi.org/10.5194/acp-19-6107-2019, 2019.
Sharma, S., Mandal, T., Jain, S., Sharma, A., and Sax-ena, M.: Source apportionment of PM2.5 in Delhi, India us-ing PMF model, B. Environ. Contam. Tox., 97, 286–293,https://doi.org/10.1007/s00128-016-1836-1, 2016.
Shen, Z., Sun, J., Cao, J., Zhang, L., Zhang, Q., Lei, Y.,Gao, J., Huang, R. J., Liu, S., and Huang, Y.: Chem-ical profiles of urban fugitive dust PM2.5 samples inNorthern Chinese cities, Sci. Total Environ., 569, 619–626,https://doi.org/10.1016/j.scitotenv.2016.06.156, 2016.
Shi, X. and Brasseur, G. P.: The Response in Air Quality tothe Reduction of Chinese Economic Activities during theCOVID-19 Outbreak, Geophys. Res. Lett., 47, e2020GL088070,https://doi.org/10.1029/2020GL088070, 2020.
Shi, Z., Huang, L., Li, J., Ying, Q., Zhang, H., and Hu, J.: Sensitivityanalysis of the surface ozone and fine particulate matter to mete-orological parameters in China, Atmos. Chem. Phys., 20, 13455–13466, https://doi.org/10.5194/acp-20-13455-2020, 2020.
Sun, W., Shao, M., Granier, C., Liu, Y., Ye, C., and Zheng, J.:Long-term trends of anthropogenic SO2, NOx , CO, andNMVOCs emissions in China, Earths Future, 6, 1112–1133,https://doi.org/10.1029/2018EF000822, 2018.
Tian, M., Liu, Y., Yang, F., Zhang, L., Peng, C., Chen, Y., Shi, G.,Wang, H., Luo, B., and Jiang, C.: Increasing importance of ni-trate formation for heavy aerosol pollution in two megacities inSichuan Basin, southwest China, Environ. Pollut., 250, 898–905,https://doi.org/10.1016/j.envpol.2019.04.098, 2019.
Urrutia-Goyes, R., Hernandez, N., Carrillo-Gamboa, O.,Nigam, K., and Ornelas-Soto, N.: Street dust from a heavily-populated and industrialized city: Evaluation of spatialdistribution, origins, pollution, ecological risks and human
https://doi.org/10.5194/acp-21-8677-2021 Atmos. Chem. Phys., 21, 8677–8692, 2021

8692 R. Li et al.: The impact of COVID-19 lockdown on air quality in Tangshan, China
health repercussions, Ecotox. Environ. Safe., 159, 198–204,https://doi.org/10.1016/j.ecoenv.2018.04.054, 2018.
Venter, Z. S., Aunan, K., Chowdhury, S., and Lelieveld, J.:COVID-19 lockdowns cause global air pollution declineswith implications for public health risk, 117, 18984–18990,https://doi.org/10.1073/pnas.2006853117, 2020.
Wang, Y., Ying, Q., Hu, J., and Zhang, H.: Spatial and temporalvariations of six criteria air pollutants in 31 provincial capitalcities in China during 2013–2014, Environ. Int., 73, 413–422,https://doi.org/10.1016/j.envint.2014.08.016, 2014.
Wu, F., Zhao, S., Yu, B., Chen, Y. M., Wang, W., Song, Z. G., Hu, Y.,Tao, Z. W., Tian, J. H., and Pei, Y. Y.: A new coronavirus as-sociated with human respiratory disease in China, Nature, 579,265–269, https://doi.org/10.1038/s41586-020-2008-3, 2020.
Wu, L. Y., Tong, S. R., Wang, W. G., and Ge, M. F.: Effects oftemperature on the heterogeneous oxidation of sulfur dioxide byozone on calcium carbonate, Atmos. Chem. Phys., 11, 6593–6605, https://doi.org/10.5194/acp-11-6593-2011, 2011.
Wu, Q. R., Wang, S. X., Zhang, L., Song, J. X., Yang, H.,and Meng, Y.: Update of mercury emissions from China’s pri-mary zinc, lead and copper smelters, 2000–2010, Atmos. Chem.Phys., 12, 11153–11163, https://doi.org/10.5194/acp-12-11153-2012, 2012.
Wu, Y., Lin, S., Tian, H., Zhang, K., Wang, Y., Sun, B., Liu, X.,Liu, K., Xue, Y., and Hao, J.: A quantitative assessment of at-mospheric emissions and spatial distribution of trace elementsfrom natural sources in China, Environ. Pollut., 259, 113918,https://doi.org/10.1016/j.envpol.2020.113918, 2020.
Xu, J., Ge, X., Zhang, X., Zhao, W., Zhang, R., andZhang, Y.: COVID-19 impact on the concentration and com-position of submicron particulate matter in a typical city ofNorthwest China, Geophys. Res. Lett., 47, e2020GL089035,https://doi.org/10.1029/2020GL089035, 2020.
Yao, Q., Liu, Z., Han, S., Cai, Z., Liu, J., Hao, T., Liu, J.,Huang, X., and Wang, Y.: Seasonal variation and secondary for-mation of size-segregated aerosol water-soluble inorganic ions ina coast megacity of North China Plain, Environ. Sci. Pollut. R,27, 26750–26762, https://doi.org/10.1007/s11356-020-09052-0,2020.
Zhang, K., Ma, Y., Xin, J., Liu, Z., Ma, Y., Gao, D., Wu, J.,Zhang, W., Wang, Y., and Shen, P.: The aerosol optical proper-ties and PM2.5 components over the world’s largest industrialzone in Tangshan, North China, Atmos. Res., 201, 226–234,https://doi.org/10.1016/j.atmosres.2017.10.025, 2018.
Zhang, Q., Zheng, Y., Tong, D., Shao, M., Wang, S., Zhang, Y.,Xu, X., Wang, J., He, H., and Liu, W.: Drivers of improved PM2.5air quality in China from 2013 to 2017, P. Natl. Acad. Sci. USA,116, 24463–24469, https://doi.org/10.1073/pnas.1907956116,2019.
Zhang, X., Murakami, T., Wang, J., and Aikawa, M.:Sources, species and secondary formation of atmo-spheric aerosols and gaseous precursors in the suburbof Kitakyushu, Japan, Sci. Total. Environ., 763, 143001,https://doi.org/10.1016/j.scitotenv.2020.143001, 2020.
Zhang, Y., Vu, T. V., Sun, J., He, J., Shen, X., Lin, W., Zhang, X.,Zhong, J., Gao, W., and Wang, Y.: Significant Changes in Chem-istry of Fine Particles in Wintertime Beijing from 2007 to 2017:Impact of Clean Air Actions, Environ. Sci. Technol., 54, 1344–1352, https://doi.org/10.1021/acs.est.9b04678, 2019.
Zhang, Y., Liu, X., Fang, Y., Liu, D., Tang, A., and Collett, J. L.: At-mospheric Ammonia in Beijing during the COVID-19 Outbreak:Concentrations, Sources, and Implications, Environ. Sci. Tech.Let., 8, https://doi.org/10.1021/acs.estlett.0c00756, 2020.
Zheng, B., Zhang, Q., Geng, G., Shi, Q., Lei, Y., and He,K.: Changes in China’s anthropogenic emissions during theCOVID-19 pandemic, Earth Syst. Sci. Data Discuss. [preprint],https://doi.org/10.5194/essd-2020-355, in review, 2020.
Zheng, H., Kong, S., Yan, Q., Wu, F., Cheng, Y., Zheng, S., Wu, J.,Yang, G., Zheng, M., and Tang, L.: The impacts of pollution con-trol measures on PM2.5 reduction: Insights of chemical compo-sition, source variation and health risk, Atmos. Environ., 197,103–117, https://doi.org/10.1016/j.atmosenv.2018.10.023, 2019.
Zheng, H., Kong, S., Chen, N., Yan, Y., Liu, D., Zhu, B., Xu, K.,Cao, W., Ding, Q., and Lan, B.: Significant changes in the chem-ical compositions and sources of PM2.5 in Wuhan since thecity lockdown as COVID-19, Sci. Total Environ., 739, 140000,https://doi.org/10.1016/j.scitotenv.2020.140000, 2020.
Zhou, S., Davy, P. K., Huang, M., Duan, J., Wang, X., Fan, Q.,Chang, M., Liu, Y., Chen, W., Xie, S., Ancelet, T., and Trompet-ter, W. J.: High-resolution sampling and analysis of ambientparticulate matter in the Pearl River Delta region of southernChina: source apportionment and health risk implications, At-mos. Chem. Phys., 18, 2049–2064, https://doi.org/10.5194/acp-18-2049-2018, 2018.
Zhu, C., Tian, H., Hao, Y., Gao, J., Hao, J., Wang, Y., Hua, S.,Wang, K., and Liu, H.: A high-resolution emission inven-tory of anthropogenic trace elements in Beijing-Tianjin-Hebei(BTH) region of China, Atmos. Environ., 191, 452–462,https://doi.org/10.1016/j.atmosenv.2018.08.035, 2018.
Zhu, C., Tian, H., and Hao, J.: Global anthropogenic at-mospheric emission inventory of twelve typical hazardoustrace elements, 1995–2012, Atmos. Environ., 220, 117061,https://doi.org/10.1016/j.atmosenv.2019.117061, 2020.
Atmos. Chem. Phys., 21, 8677–8692, 2021 https://doi.org/10.5194/acp-21-8677-2021