SUBSIDIARY INSURANCE COMPANY OF HALYK BANK
50
JOINT STOCK COMPANY SUBSIDIARY INSURANCE COMPANY OF HALYK BANK OF KAZAKHSTAN HALYK - KAZAKHINSTRAKH Financial Statements For the year ended 31 December 2011
Transcript of SUBSIDIARY INSURANCE COMPANY OF HALYK BANK

JOINT STOCK COMPANY SUBSIDIARY INSURANCE COMPANY OF HALYK BANK OF KAZAKHSTAN HALYK - KAZAKHINSTRAKH Financial Statements For the year ended 31 December 2011

JOINT STOCK COMPANY SUBSIDIARY INSURANCE COMPANY OF HALYK BANK OF KAZAKHSTAN HALYK-KAZAKHINSTRAKH TABLE OF CONTENTS
Page
STATEMENT OF MANAGEMENT’S RESPONSIBILITIES
FOR THE PREPARATION AND APPROVAL OF THE FINANCIAL STATEMENTS
FOR THE YEAR ENDED 31 DECEMBER 2011 1
INDEPENDENT AUDITORS’ REPORT 2-3
FINANCIAL STATEMENTS
FOR THE YEAR ENDED 31 DECEMBER 2011:
Income statement 4
Statement of comprehensive income 5
Statement of financial position 6
Statement of changes in equity 7
Statement of cash flows 8-9
Notes to the financial statements 10-48

JOINT STOCK COMPANY SUBSIDIARY INSURANCE COMPANY OF HALYK BANK OF KAZAKHSTAN HALYK-KAZAKHINSTRAKH STATEMENT OF MANAGEMENT’S RESPONSIBILITIES FOR THE PREPARATION AND APPROVAL OF THE FINANCIAL STATEMENTS FOR THE YEAR ENDED 31 DECEMBER 2011
Management is responsible for the preparation of the financial statements that present fairly the financial
position of Joint Stock Company Subsidiary Insurance Company of Halyk Bank of Kazakhstan Halyk-
Kazakhinstrakh (“the Company”) as at 31 December 2011 and the results of its operations, cash flows and
changes in shareholders’ equity for the year then ended, in compliance with International Financial Reporting
Standards (“IFRS”).
In preparing the financial statements, management is responsible for:
properly selecting and applying accounting policies;
presenting information, including accounting policies, in a manner that provides relevant, reliable,
comparable and understandable information;
providing additional disclosures when compliance with the specific requirements in IFRSs are
insufficient to enable users to understand the impact of particular transactions, other events and
conditions on the Company's financial position and financial performance; and
making an assessment of the Company's ability to continue as a going concern.
Management is also responsible for:
Designing, implementing and maintaining an effective and sound system of internal controls,
throughout the Company;
Maintaining adequate accounting records that are sufficient to show and explain the Company's
transactions and disclose with reasonable accuracy at any time the financial position of the Company,
and which enable them to ensure that the financial statements of the Company comply with IFRS;
Maintaining statutory accounting records in compliance with the Republic of Kazakhstan legislation
and accounting standards;
Taking such steps as are reasonably available to them to safeguard the assets of the Company; and
Preventing and detecting fraud and other irregularities.
The financial statements of the Company for the year ended 31 December 2011 were approved by
management on 5 March 2012.

INDEPENDENT AUDITOR’S REPORT
To Shareholders and Board of Directors of Joint Stock Company Subsidiary Insurance Company
of Halyk Bank of Kazakhstan Halyk-Kazakhinstrakh:
Report on the financial statements
We have audited the accompanying financial statements of JSC Subsidiary Insurance Company
of Halyk Bank of Kazakhstan Halyk-Kazakhinstrakh (“the Company”), which comprise the statement of
financial position as at 31 December 2011, and the income statement, statement of comprehensive income,
statement of changes in equity and cash flow statement for the year then ended, and a summary of
significant accounting policies and other explanatory information.
Management’s responsibility for the financial statements
Management is responsible for the preparation and fair presentation of these financial statements in
accordance with International Financial Reporting Standards and for such internal control as management
determines is necessary to enable the preparation of financial statements that are free from material
misstatement, whether due to fraud or error.
Auditor’s responsibility
Our responsibility is to express an opinion on these financial statements based on our audit. We conducted
our audit in accordance with International Standards on Auditing. Those standards require that we comply
with ethical requirements and plan and perform the audit to obtain reasonable assurance about whether the
financial statements are free from material misstatement.
An audit involves performing procedures to obtain audit evidence about the amounts and disclosures in the
financial statements. The procedures selected depend on the auditor’s judgment, including the assessment
of the risks of material misstatement of the financial statements, whether due to fraud or error. In making
those risk assessments, the auditor considers internal control relevant to the entity’s preparation and fair
presentation of the financial statements in order to design audit procedures that are appropriate in the
circumstances, but not for the purpose of expressing an opinion on the effectiveness of the entity’s internal
control. An audit also includes evaluating the appropriateness of accounting policies used and the
reasonableness of accounting estimates made by management, as well as evaluating the overall presentation
of the financial statements.
We believe that the audit evidence we have obtained is sufficient and appropriate to provide a basis for our
audit opinion.

3
Opinion
In our opinion, the financial statements present fairly, in all material respects, the financial position of Joint
Stock Company Subsidiary Insurance Company of Halyk Bank of Kazakhstan Halyk-Kazakhinstrakh as
at 31 December 2011, and its financial performance and its cash flows for the year then ended in accordance
with International Financial Reporting Standards.
5 March 2012
Almaty, Kazakhstan

4
JOINT STOCK COMPANY SUBSIDIARY INSURANCE COMPANY OF HALYK BANK OF KAZAKHSTAN HALYK-KAZAKHINSTRAKH
INCOME STATEMENT FOR THE YEAR ENDED 31 DECEMBER 2011 (in thousands of Kazakhstani Tenge unless otherwise indicated)
Notes Year ended
31 December
2011
Year ended
31 December
2010
Written insurance premiums 4, 27 24,324,253 14,755,435
Reinsurance premiums ceded 4 (14,437,594) (6,388,783)
PREMIUMS WRITTEN, NET OF REINSURANCE 9,886,659 8,366,652
Change in unearned premium reserve, net 4 (484,358) (88,605)
PREMIUM EARNED, NET OF REINSURANCE 9,402,301 8,278,047
Claims paid, gross 5, 27 (4,696,475) (4,502,530) Claims paid, reinsurers’ share 5 108,128 488,542
Change in reserves for claims and claims’ adjustment expenses, gross 5 3,156,683 (4,386,401)
Change in reinsurers' share of reserves for claims and claims’ adjustment expenses 5 (3,460,805) 4,095,525
CLAIMS INCURRED, NET OF REINSURANCE (4,892,469) (4,304,864)
Reimbursement of claims 142,158 278,976 Unallocated loss adjustment expenses (6,917) (9,304)
Net other insurance income 135,241 269,672
Commission income 6 154,638 99,233
Commission expense 6, 27 (665,441) (785,422) Change in deferred acquisition costs 6 (23,978) (20,334)
NET COMMISSION EXPENSE (534,781) (706,523)
Investment income 7, 27 1,087,193 989,665
Other operating expense (59,646) (65,752)
OTHER INCOME 1,027,547 923,913
Salaries and benefits 8, 27 (1,468,626) (1,304,771)
Administrative and operating expenses 8, 27 (729,753) (540,900) Provision for impairment losses on investments available-for-sale (22,403) (308,131)
Depreciation and amortization (100,717) (98,194)
Provision for impairment losses on other operations 9 (80,869) (88,986)
Net loss on foreign exchange operations (21,018) (22,698)
OPERATING EXPENSES (2,423,386) (2,363,680)
PROFIT BEFORE INCOME TAX EXPENSE 2,714,453 2,096,565
Income tax expense 10 (434,302) (378,240)
NET PROFIT 2,280,151 1,718,325
EARNINGS PER SHARE
Basic and diluted (KZT) 11 6,745.79 5,083.64

5
JOINT STOCK COMPANY SUBSIDIARY INSURANCE COMPANY OF HALYK BANK OF KAZAKHSTAN HALYK-KAZAKHINSTRAKH STATEMENT OF COMPREHENSIVE INCOME FOR THE YEAR ENDED 31 DECEMBER 2011 (in thousands of Kazakhstani Tenge)
Note Year ended
31 December
2011
Year ended
31 December
2010
NET PROFIT 2,280,151 1,718,325
OTHER COMPREHENSIVE INCOME:
Net change in fair value of investments available-for-sale (228,250) 311,372
Transfers of impairment loss reserves on investments available-for-
sale to income statement 22,403 308,131
Realized loss on disposal of investments available-for-sale 7 (78,633) -
OTHER COMPREHENSIVE (LOSS)/INCOME (284,480) 619,503
TOTAL COMPREHENSIVE INCOME 1,995,671 2,337,828

6
JOINT STOCK COMPANY SUBSIDIARY INSURANCE COMPANY OF HALYK BANK OF KAZAKHSTAN HALYK-KAZAKHINSTRAKH STATEMENT OF FINANCIAL POSITION AS AT 31 DECEMBER 2011 (in thousands of Kazakhstani Tenge)
Notes 31 December
2011
31 December
2010
ASSETS:
Cash and cash equivalents 12, 27 630,841 1,871,656
Due from banks 13, 27 1,198,207 2,551,786
Investments available-for-sale 14 13,877,244 10,686,380
Investments held-to-maturity 15, 27 910,869 594,971
Loans under reverse repurchase agreements 16 750,069 -
Insurance and reinsurance receivable 17, 27 2,996,097 1,343,666
Deferred expenses 18 282,551 204,078
Unearned premium reserve, reinsurers' share 19 8,377,184 2,537,313
Reserves for claims and claims' adjustment expenses,
reinsurers' share 20 1,684,913 5,145,718
Property and equipment 21 1,096,840 1,124,564
Intangible assets 19,324 22,038
Deferred acquisition costs 91,806 115,784
Current income tax assets - 17,871
Deferred income tax assets 10 238,355 153,055
Other assets 22 524,708 726,903
TOTAL ASSETS 32,679,008 27,095,783
LIABILITIES AND EQUITY
LIABILITIES:
Insurance and reinsurance payable 23, 27 2,710,294 1,114,893
Unearned premium reserve 19 11,894,862 5,570,633
Reserves for claims and claims' adjustment expenses 20 3,134,276 6,290,959
Current income tax liability 37,627 -
Other liabilities 24 436,057 679,635
Total liabilities 18,213,116 13,656,120
EQUITY:
Share capital 25 4,587,895 4,587,895
Additional paid-in-capital 30,558 -
Investments available-for-sale fair value reserve 123,160 407,640
Other reserves 25 869,552 217,655
Retained earnings 8,854,727 8,226,473
Total equity 14,465,892 13,439,663
TOTAL LIABILITIES AND EQUITY 32,679,008 27,095,783

7
JOINT STOCK COMPANY SUBSIDIARY INSURANCE COMPANY OF HALYK BANK OF KAZAKHSTAN HALYK-KAZAKHINSTRAKH STATEMENT OF CHANGES IN EQUITY FOR THE YEAR ENDED 31 DECEMBER 2011 (in thousands of Kazakhstani Tenge)
Share
capital
Additional
paid-in capital
Investments
available-for-
sale fair value
reserve/
(deficit)
Other
reserves
Retained
earnings
Total equity
As at 31 December 2009 4,587,895 -
(211,863) 217,655 6,508,148 11,101,835
Other comprehensive income - - 619,503 - - 619,503
Net profit - - - - 1,718,325 1,718,325
Total comprehensive income - -
619,503 - 1,718,325 2,337,828
As at 31 December 2010 4,587,895 - 407,640 217,655 8,226,473 13,439,663
Other comprehensive loss - - (284,480) - - (284,480)
Net profit - - - - 2,280,151 2,280,151
Total comprehensive income - -
(284,480) - 2,280,151 1,995,671
Contribution of shareholder in the form of rent - 30,558 - - - 30,558
Stabilization reserve (Note 25) - - - 651,897 (651,897)
Dividends paid (Note 25) - - - - (1,000,000) (1,000,000)
As at 31 December 2011 4,587,895 30,558 123,160 869,552 8,854,727 14,465,892

8
JOINT STOCK COMPANY SUBSIDIARY INSURANCE COMPANY OF HALYK BANK OF KAZAKHSTAN HALYK-KAZAKHINSTRAKH STATEMENT OF CASH FLOWS FOR THE YEAR ENDED 31 DECEMBER 2011 (in thousands of Kazakhstani Tenge)
Notes Year ended
31 December
2011
Year ended
31 December
2010
CASH FLOWS FROM OPERATING ACTIVITIES:
Profit before income tax expense 2,714,453 2,096,565
Adjustments for:
Change in unearned premium reserve 4 484,358 88,605
Change in reserves for claims and claims' adjustment expense, net 5 304,122 290,876
Change in deferred acquisition costs 6 23,978 20,334
Provision for impairment losses on other operations 80,869 88,986
Provision for impairment losses on investments available-for-sale 22,403 308,131
Depreciation and amortization 100,717 98,194
Unrealized loss on operations with foreign currency 21,018 22,698
Loss from disposal of property and equipment and write-off of
intangibles 343 4,732
Adjustments for contribution of shareholder in the form of rent 30,558 -
Net realized loss on investments available-for-sale 78,633 -
Amortization of discount on investments held-to-maturity 1,228 1,495
Change in interest accruals, net 23,343 (49,466)
Cash flows from operating activities before changes in operating
assets and liabilities 3,886,023 2,971,150
Changes in operating assets and liabilities
(Increase)/decrease in operating assets:
Insurance and reinsurance receivables (1,696,073) (45,241)
Deferred expenses (78,473) (23,863)
Other assets 200,311 166,518
Increase/(decrease) in operating liabilities:
Insurance and reinsurance payable 1,537,325 (5,555)
Other liabilities (243,752) 343,071
Cash inflow from operating activities before taxes and claims paid 3,605,361 3,406,080
Income tax paid (464,104) (386,648)
Net cash inflow from operating activities 3,141,257 3,019,432
CASH FLOWS FROM INVESTING ACTIVITIES:
Cash placed as deposits in banks (14,017,698) (4,481,733)
Cash withdrawn from deposits in banks 15,325,445 5,170,881
Purchase of investments available-for-sale (6,086,015) (3,735,252)
Investment to reverse repurchase agreements (750,000) -
Proceeds from redemption and disposal of investments available-for-
sale 2,526,171 2,561,704
Purchases of investments held-to-maturity (584,625)
Proceeds from redemption of investments held-to-maturity 290,000 -
Purchase of property and equipment (70,678) (927,643)
Proceeds from sale of property and equipment 1,480 383
Purchase of intangible assets (1,424) (11,504)
Net cash outflow from investing activities (3,367,344) (1,423,164)

9
JOINT STOCK COMPANY SUBSIDIARY INSURANCE COMPANY OF HALYK BANK OF KAZAKHSTAN HALYK-KAZAKHINSTRAKH STATEMENT OF CASH FLOWS (CONTINUED) FOR THE YEAR ENDED 31 DECEMBER 2011 (in thousands of Kazakhstani Tenge)
Notes Year ended
31 December 2011
Year ended
31 December 2010
CASH FLOWS FROM FINANCING ACTIVITIES:
Dividends paid (1,000,000) -
Net cash outflow from financing activities (1,000,000) -
NET (DECREASE)/INCREASE IN CASH AND CASH EQUIVALENTS (1,226,087) 1,596,268
Effect of changes in foreign exchange rate fluctuations on cash and
cash equivalents (14,728) 1,037
CASH AND CASH EQUIVALENTS, beginning of the year 12 1,871,656 274,351
CASH AND CASH EQUIVALENTS, end of the year 12 630,841 1,871,656
Interest received by the Company during the years ended 31 December 2011 and 2010, amounted to
KZT 1,191,024 thousand and KZT 940,199 thousand, respectively.

10
JOINT STOCK COMPANY SUBSIDIARY INSURANCE COMPANY OF HALYK BANK OF KAZAKHSTAN HALYK-KAZAKHINSTRAKH NOTES TO THE FINANCIAL STATEMENTS FOR THE YEAR ENDED 31 DECEMBER 2011 (in thousands of Kazakhstani Tenge unless otherwise indicated)
1. ORGANIZATION
Joint Stock Company Subsidiary Insurance Company of Halyk Bank of Kazakhstan Halyk-
Kazakhinstrakh (“the Company”) was initially incorporated in the Republic of Kazakhstan in 1995 as
Closed Joint Stock Company Kazakhinstrakh under the laws of the Republic of Kazakhstan. In 1998
it was registered as an Open Joint Stock Company. On 20 October 2003, due to a change in legislation
introduced in 2003, the Company was registered as a Joint Stock Company. On 20 June 2008,
the Company was registered under its current name.
The Company possesses insurance (reinsurance) license #11-12/1 dated 21 August 2008 for voluntary
and compulsory general insurance issued by the Committee for control and supervision of financial
market and financial organizations of the National Bank of Republic of Kazakhstan (“the FMSC”).
The Company offers various general insurance products in property, casualty, liability, personal
insurance and reinsurance.
The Company’s legal address is 109V, Abai Ave., Almaty, Republic of Kazakhstan.
As at 31 December 2011 and 2010, the following shareholders owned more than 5% of the
outstanding shares of the Company:
31 December
2011, %
31 December
2010, %
Shareholders
JSC Halyk Bank of Kazakhstan 99.75 99.75
Other 0.25 0.25
Total 100.00 100.00
As at 31 December 2011 and 2010, the number of employees of the Company was 593 and 534,
respectively.
As at 31 December 2011 and 2010, the Company had 18 branches in the Republic of Kazakhstan.
2. BASIS OF PRESENTATION
Accounting basis
These financial statements of the Company have been prepared in accordance with International
Financial Reporting Standards (“IFRS”) issued by the International Accounting Standards Board
(“IASB”) and Interpretations issued by the International Financial Reporting Interpretations
Committee (“IFRIC”).
These financial statements have been prepared on the assumption that the Company is a going concern and
will continue in operation for the foreseeable future. The management and shareholders have the intention
to further develop the business of the Company in the Republic of Kazakhstan both in corporate and retail
segments. The Management believes that the going concern assumption is appropriate for the Company
due to its sufficient capital adequacy ratio and based on historical experience that short-term obligations
will be refinanced in the normal course of business.

11
The Company maintains its accounting records in accordance with IFRS and requirements of law of
the Republic of Kazakhstan. These financial statements are presented in thousands of Kazakhstani
Tenge (“KZT thousand”), unless otherwise indicated. These financial statements were prepared under
the historical cost convention, except for the measurement at fair value of certain financial
instruments.
Functional currency
The functional currency of these financial statements is the Kazakhstani Tenge.
Operating environment
Emerging markets such as Kazakhstan are subject to different risks than more developed markets,
including economic, political and social, and legal and legislative risks. As has happened in the past,
actual or perceived financial problems or an increase in the perceived risks associated with investing
in emerging economies could adversely affect the investment climate in Kazakhstan and the
Kazakhstani economy in general.
Laws and regulations affecting businesses in Kazakhstan continue to change rapidly. Tax, currency
and customs legislation within Kazakhstan are subject to varying interpretations, and other legal and
fiscal impediments contribute to the challenges faced by entities currently operating in Kazakhstan.
The future economic direction of Kazakhstan is heavily influenced by the economic, fiscal and
monetary policies adopted by the government, together with developments in the legal, regulatory,
and political environment.
The global financial system continues to exhibit signs of deep stress and many economies around the
world are experiencing lesser or no growth than in prior years. Additionally there is increased
uncertainty about the creditworthiness of some sovereign states in the Eurozone and financial
institutions with exposure to the sovereign debt of such states. These conditions could slow or disrupt
the Kazakhstani economy, adversely affect the Company’s access to capital and cost of capital for the
Company and, more generally, its business, results of operations, financial condition and prospects.
Because Kazakhstan produces and exports large volumes of oil and gas, its economy is particularly
sensitive to the price of oil and gas on the world market which has fluctuated significantly
during 2011 and 2010.
3. SIGNIFICANT ACCOUNTING POLICIES
Recognition and measurement of financial instruments
The Company recognizes financial assets and liabilities in its statement of financial position when it
becomes a party to the contractual obligation of the financial instrument. Regular way purchase and
sale of the financial assets and liabilities are recognized using settlement date accounting. Regular
way purchases of financial instruments that will be subsequently measured at fair value between trade
date and settlement date are accounted for in the same way as for acquired instruments.
Financial assets and liabilities are initially recognized at fair value plus, in the case of a financial asset
or financial liability not at fair value through profit or loss transaction costs that are directly
attributable to the acquisition or issue of the financial asset or financial liability. The accounting
policies for subsequent re-measurement of these items are disclosed in the respective accounting
policies set out below.

12
Derecognition of financial assets and liabilities
Financial assets
A financial asset (or, where applicable a part of a financial asset or part of a group of similar financial
assets) is derecognized where:
the rights to receive cash flows from the asset have expired;
the Company has transferred its rights to receive cash flows from the asset, or retained the right to
receive cash flows from the asset, but has assumed an obligation to pay them in full without
material delay to a third party under a 'pass-through' arrangement; and
the Company either (a) has transferred substantially all the risks and rewards of the asset, or
(b) has neither transferred nor retained substantially all the risks and rewards of the asset, but has
transferred control of the asset.
Where the Company has transferred its rights to receive cash flows from an asset and has neither
transferred nor retained substantially all the risks and rewards of the asset nor transferred control of
the asset, the asset is recognized to the extent of the Company’s continuing involvement in the asset.
Financial liabilities
A financial liability is derecognized when the obligation under the liability is discharged or cancelled
or expires.
Where an existing financial liability is replaced by another from the same lender on substantially
different terms, or the terms of an existing liability are substantially modified, such an exchange or
modification is treated as a derecognition of the original liability and the recognition of a new
liability, and the difference in the respective carrying amounts is recognized in the income statement.
Cash and cash equivalents
Cash and cash equivalents include cash on hand, unrestricted current and deposit accounts with banks
with an original maturity of less than three months.
Due from banks
In the normal course of business, the Company maintains deposits for various periods of time with the
banks. Due from banks are initially recognized at fair value and subsequently measured at amortised
cost using the effective interest method. Due from banks are carried net of any allowance for
impairment losses.
Securities repurchase and reverse repurchase agreements
In the normal course of business, the Company enters into financial assets sale and purchase back
agreements (“repos”) and financial assets purchase and sale back agreements (“reverse repos”) in the
normal course of its business. Repos and reverse repos are utilized by the Company as an element of
its treasury management.
A repo is an agreement to transfer a financial asset to another party in exchange for cash or other
consideration and a concurrent obligation to reacquire the financial assets at a future date for an
amount equal to the cash or other consideration exchanged plus interest. These agreements are
accounted for as financing transactions. Financial assets sold under repo are retained in the financial
statements and consideration received under these agreements is recorded as collateralized loan
received.
Assets purchased under reverse repos are recorded in the financial statements as cash placed on
deposit collateralized by securities.

13
Any related income or expense arising from the pricing difference between purchase and sale of the
underlying assets is recognized as interest income or expense in the income statement.
Reinsurance
The Company cedes insurance risks in the normal course of business. Reinsurance assets represent
balances due from reinsurance companies. Recoverable amounts are estimated in a manner consistent
with the unearned premium reserve and reserves for claims and claims’ adjustment expenses and are
in accordance with the reinsurance contract.
An impairment review is performed at each reporting date or more frequently when an indication of
impairment arises during the reporting year. Impairment occurs when objective evidence exists that
the Company may not recover outstanding amounts under the terms of the contract and when the
impact on the amounts that the Company will receive from the reinsurer can be measured reliably.
The impairment loss is recorded in the income statement.
Ceded reinsurance arrangements do not relieve the Company from its obligations to policyholders.
The Company also assumes reinsurance risks in the normal course of business for certain non-life
insurance contracts. Premiums and claims on assumed reinsurance are recognized as income and
expenses in the same manner as they would be if the reinsurance were considered direct written
business, taking into account the product classification of the reinsured business.
Premiums and claims are presented on a gross basis for both ceded and assumed reinsurance.
Reinsurance assets or liabilities are derecognized when the contractual rights are extinguished or
expire or when the contract is transferred to another party.
Insurance receivables
Insurance receivables are recognized when related income is earned and measured on initial
recognition at the fair value of the consideration receivable. Subsequent to initial recognition, any
insurance receivable is measured at amortized cost, using the effective interest rate method. The
carrying value of the insurance receivable is the present value of estimated future cash flows
discounted at the original effective interest rate. The carrying value of the insurance receivable is
reviewed for impairment whenever events or circumstances indicate that the carrying amount may not
be recoverable, with the impairment loss recorded in the income statement.
Insurance receivables are derecognized when derecognition criteria for financial assets has been met.
Investments available-for-sale
Investments available-for-sale represent debt and equity securities that are intended to be held for an
indefinite period of time. Investments available-for-sale are initially recorded at fair value and
subsequently measured at fair value, with such re-measurement recognized directly in equity, except
for impairment losses, foreign exchange gains/(losses) and interest income accrued using the effective
interest method, which are recognised directly in the income statement. When sold, the gain/(loss)
previously recorded in equity is recorded in the income statement. The Company uses quoted market
prices to determine the fair value of the Company’s investments available-for-sale. Dividends
received on investments available-for-sale are included in investment income in the income statement.
Non-marketable equity securities are stated at cost, less impairment losses, if any, unless fair value
can be reliably measured.
When there is objective evidence that such securities have been impaired, the cumulative loss
previously recognized in equity is removed from equity and recognized in the income statement for
the year. These financial assets are recognized at net of impairment loss.

14
Allowance for impairment losses
The Company accounts for impairment of financial assets not recorded at fair value when there is
objective evidence of impairment of a financial asset or a group of financial assets. The impairment of
financial assets represents a difference between the carrying value of the asset and current value of
estimated future cash flows including amounts which can be received on guarantees and security
discounted using an initial effective interest rate on financial assets recorded at amortized value. If in
a subsequent period the impairment amount decreases and such a decrease can be objectively
associated with an event occurring after recognition of the impairment then the previously recognized
impairment loss is reversed with an adjustment of the provision account.
For financial instruments recorded at cost the impairment represents the difference between the
carrying value of the financial asset and current value of the estimated future cash flows discounted
using the current market interest rate for a similar financial instrument. Such impairment losses are
not reversed.
The impairment is calculated based on the analysis of assets subject to risks and reflects the amount
sufficient, in the opinion of the management, to cover relevant losses. The provisions are created as a
result of an individual evaluation of assets subject to risks regarding financial assets being material
individually and on the basis of an individual or joint evaluation of financial assets not being material
individually.
The change in the impairment is included into the income statement using the provision account
(financial assets recorded at amortized cost) or by a direct write-off (financial assets recorded at cost).
Assets recorded in the statement of financial position are reduced by the amount of the impairment.
The factors the Company evaluates in determining the presence of objective evidence of occurrence
of an impairment loss include information on liquidity of the debtor or issuer, their solvency, business
risks and financial risks, levels and tendencies of default on obligations on similar financial assets,
national and local economic tendencies and conditions, and fair value of the security and guarantees.
These and other factors individually or in the aggregate represent, to a great extent, an objective
evidence of recognition of the impairment loss on the financial asset or group of financial assets.
It should be noted that the evaluation of losses includes a subjective factor. The management of the
Company believes that the amount of recorded impairment is sufficient to cover losses incurred on
assets subject to risks at the reporting date, although it is probable that in certain periods the Company
can incur losses greater than recorded impairment.
Investments held-to-maturity
Investments held-to-maturity are debt securities with determinable or fixed payments, and where the
Company has a positive intent and the ability to hold such investments to maturity. Investments held-
to-maturity are carried at amortized cost using the effective interest method, less any allowance for
impairment. Amortized discounts and premiums are recognized in interest income over the period to
maturity using the effective interest method.
Prepayments
Prepayments include advance payments made by the Company, which are charged to expenses in the
period when services are provided. Prepayments are accounted for at historical cost.
Property, equipment and intangible assets
Property, equipment and intangible assets are carried at historical cost less accumulated depreciation
and amortization.

15
Depreciation and amortization is charged on the carrying value of property, equipment and intangible
assets and is designed to write off assets over their useful economic lives. It is calculated on a straight
line basis at the following annual prescribed rates:
Buildings and other real estate 2%
Vehicles 25%
Computers 40%
Other 15%
Intangible assets 15%
The carrying amounts of property, equipment and intangible assets are reviewed at each reporting
date to assess whether they are recorded in excess of their recoverable amounts. Where carrying
values exceed this estimated recoverable amount, assets are written down to their recoverable amount.
The gain or loss arising on the disposal or retirement of an asset is determined as the difference
between the sales proceeds and the carrying amount of the asset and is recognized in the income
statement.
Taxation
Income tax expense represents the sum of the current and deferred tax expense.
The current tax expense is based on taxable profit for the year. Taxable profit differs from net profit
as reported in the income statement because it excludes items of income or expense that are taxable or
deductible in other years and it further excludes items that are never taxable or deductible. The
Company’s current tax expense is calculated using tax rates that have been enacted during the
reporting period.
Deferred tax is the tax expected to be payable or recoverable on differences between the carrying
amounts of assets and liabilities in the financial statements and the corresponding tax bases used in
the computation of taxable profit, and is accounted for using the balance sheet liability method.
Deferred tax liabilities are generally recognized for all taxable temporary differences and deferred tax
assets are recognized to the extent that it is probable that taxable profits will be available against
which deductible temporary differences can be utilized.
The carrying amount of deferred tax assets is reviewed at each reporting date and reduced to the
extent that it is no longer probable that sufficient taxable profits will be available to allow all or part
of the asset to be recovered.
Deferred tax is calculated at the tax rates that are expected to apply in the period when the liability is
settled or the asset is realized. Deferred tax is recorded in the income statement, except when it relates
to items charged or credited directly to other comprehensive income, in which case the deferred tax is
also dealt with in other comprehensive income.
Deferred income tax assets and deferred income tax liabilities are offset and reported net in the
statement of financial position if:
The Company has a legally enforceable right to set off current income tax assets against current
income tax liabilities; and
Deferred income tax assets and the deferred income tax liabilities relate to income taxes levied by
the same taxation authority on the same taxable entity.
Kazakhstan where the Company operates also has various other taxes, which are assessed on the
Company’s activities. These taxes are included as a component of operating expenses in the income
statement.
Underwriting income and expense
Underwriting income includes net written insurance premiums and commissions earned on ceded
reinsurance reduced by the net change in the unearned premium provision, claims paid, the provision
for losses, and policy acquisition costs.

16
Net written insurance premiums represent gross written premiums less premiums ceded to reinsurers.
Upon inception of a contract, premiums are recorded as written and are earned on a pro rata basis over
the term of the related policy coverage. The unearned premium provision represents the portion of the
premiums written relating to the unexpired terms of coverage and is included as a liability in the
accompanying statement of financial position.
Claims paid and the change in provisions for losses are charged to the income statement as incurred
through the reassessment of the provision for losses.
Commissions earned on ceded reinsurance contracts are recorded as income at the date the
reinsurance contract is signed and deemed enforceable.
Acquisition costs, comprising commissions paid to insurance agents and brokers, which vary and are
directly related to the production of new business, are deferred and recorded in the accompanying
statement of financial position net provision for unearned premium, and are amortized over the period
in which the related written premiums are earned.
Liability adequacy test
The Company applies a liability adequacy test at each reporting date to ensure that the insurance
liabilities are adequate considering the estimated future cash flows. This test is performed by
comparing the carrying value of the liability and the discounted projections of future cash flows
(including premiums, claims, expenses, investment return and other items), using best estimate
assumptions.
If a deficiency is found in the liability (i.e. the carrying value amount of its insurance liabilities is less
than the future expected cash flows) that deficiency is fully recognized in the income statement.
Reserves for claims and claims’ adjustment expenses
Reserves for claims and claims’ adjustment expenses are a summary of estimates of ultimate losses,
and include both claims reported but not settled (RBNS) and claims incurred but not reported (IBNR).
RBNS is created for significant reported claims not settled at the reporting date. Estimates are made
on the basis of information received by the Company during its investigation of insured events. IBNR
is estimated by the Company based on its previous history of claims/indemnification of claims using
actuarial methods of calculation, which include loss triangulation for insurance classes for which there
is statistical data. For lines of insurance that do not have statistical data, IBNR is calculated according
to the FMSA requirements as 5% of the written premiums for the last twelve months prior reporting
date.
The reinsurers’ share in the provision for losses is calculated in accordance with the reinsurers’ share
under the reinsurance contracts. The reinsurers’ share in RBNS is recorded in reinsurance assets of
RBNS until full insurance payment by a reinsurer is received.
Insurance and reinsurance payable
Payables on insurance business comprise advances received, amounts payable to insured (claims and
premium refund payable) and amounts payable to agents and brokers, and advances received from
insurers and reinsurers.
Payables on reinsurance business comprise net amounts payable to reinsurers. Amounts payable to
reinsurers include ceded reinsurance premiums, assumed premium refunds and claims on assumed
reinsurance. Insurance and reinsurance payable are accounted for at amortized cost.

17
Commission income, broker and agent commission
Commission income, broker and agent commissions are recognized at the commencement of
insurance (reinsurance) contracts, charged to income and expenses proportionally during the term
when the insurance contract is effective and are included into calculation of the unearned premium
reserve.
Provisions
Provisions are recognized when the Company has a present legal or constructive obligation as a result
of past events, and it is probable that an outflow of resources embodying economic benefits will be
required to settle the obligation and a reliable estimate of the obligation can be made.
Share capital
Contributions to share capital are recognized at cost. Dividends on ordinary shares are recognized in
equity as a reduction in the period in which they are declared. Dividends that are declared after the
reporting date are treated as a subsequent event under IAS 10 “Events after the Balance Sheet Date”
(“IAS 10”) and disclosed accordingly.
Recognition of income
Interest income includes income earned on investment securities. Interest income is recognized on an
accrual basis calculated using the effective interest method. Commission and other income and
expenses are recognized on an accrual basis on the applicable contract.
Foreign currency translation
Monetary assets and liabilities denominated in foreign currencies are translated into KZT at the
appropriate spot rates of exchange ruling at the reporting date. Foreign currency transactions are
accounted for at the exchange rates prevailing at the date of the transaction. Profits and losses arising
from these translations are included in net gain/(loss) on foreign exchange operations.
Rates of exchange
The exchange rates at the year-end used by the Company in the preparation of the financial statements
are as follows:
31 December
2011
31 December
2010
KZT/1 US Dollar 148.40 147.50
KZT/1 Euro 191.72 196.88
KZT/1 Russian Rouble 4.61 4.83
Offset of financial assets and liabilities
Financial assets and liabilities are offset and reported net in the statement of financial position when
the Company has a legally enforceable right to offset the recognised amounts and the Company
intends either to settle on a net basis or to realise the asset and settle the liability simultaneously.
Segment reporting
Operating segments are identified on the basis of internal reports about components of the Company
that are regularly reviewed by the chief operating decision maker in order to allocate resources to the
segment and to assess its performance.

18
The Company measures information about reportable segments in accordance with IFRS. Information
about reportable operating segment meets one of the following quantitative thresholds:
its reported revenue, from both external customers and intersegment sales or transfers, is 10 per
cent or more of the combined revenue, internal and external, of all operating segments; or
the absolute measure of its reported profit or loss is 10 per cent or more of the greater, in
absolute amount, of (i) the combined reported profit of all operating segments that did not report
a loss and (ii) the combined reported loss of all operating segments that reported a loss; or
its assets are 10 per cent or more of the combined assets of all operating segments.
If the total external revenue reported by operating segments constitutes less than 75 per cent of the
Company’s revenue, additional operating segments are identified as reportable segments (even if they
do not meet the quantitative thresholds set out above) until at least 75 per cent of the Company’s
revenue is included in reportable segments (Note 28).
Adoption of new and revised standards
In the current year, the Company has adopted all of the new and revised Standards and Interpretations
issued by IASB and IFRIC of the IASB that are relevant to its operations and effective for annual
reporting periods ending on 31 December 2011. The adoption of these new and revised Standards and
Interpretations has not resulted in significant changes to the Company’s accounting policies that have
affected the amounts reported for the current or prior years.
Standards and interpretations issued and not yet adopted
The Company has not applied the following new and revised IFRSs that have been issued but are not
yet effective:
IFRS 9 Financial Instruments issued in November 2009 and amended in October 2010 introduces
new requirements for the classification and measurement of financial assets and financial liabilities
and for derecognition.
IFRS 9 requires all recognised financial assets that are within the scope of IAS 39 Financial
Instruments: Recognition and Measurement to be subsequently measured at amortised cost or
fair value. Specifically, debt investments that are held within a business model whose objective
is to collect the contractual cash flows, and that have contractual cash flows that are solely
payments of principal and interest on the principal outstanding are generally measured at
amortised cost at the end of subsequent accounting periods. All other debt investments and
equity investments are measured at their fair values at the end of subsequent accounting periods.
The most significant effect of IFRS 9 regarding the classification and measurement of financial
liabilities relates to the accounting for changes in fair value of a financial liability (designated as
at fair value through profit or loss) attributable to changes in the credit risk of that liability.
Specifically, under IFRS 9, for financial liabilities that are designated as at fair value through
profit or loss, the amount of change in the fair value of the financial liability that is attributable
to changes in the credit risk of that liability is recognised in other comprehensive income, unless
the recognition of the effects of changes in the liability's credit risk in other comprehensive
income would create or enlarge an accounting mismatch in profit or loss. Changes in fair value
attributable to a financial liability's credit risk are not subsequently reclassified to profit or loss.
Previously, under IAS 39, the entire amount of the change in the fair value of the financial
liability designated as at fair value through profit or loss was recognised in profit or loss.
IFRS 9 is effective for annual periods beginning on or after 1 January 2015, with earlier application
permitted.
The directors anticipate that IFRS 9 that will be adopted in the Company’s financial statements for the
annual period beginning 1 January 2015 and that the application of the new Standard will have a
significant impact on amounts reported in respect of the Company’s financial assets and financial
liabilities. However, it is not practicable to provide a reasonable estimate of that effect until a detailed
review has been completed.

19
The amendments to IAS 32 titled Classification of Rights Issues address the classification of certain
rights issues denominated in a foreign currency as either an equity instrument or as a financial
liability. To date, the Company has not entered into any arrangements that would fall within the scope
of the amendments. However, if the Company does enter into any rights issues within the scope of the
amendments in future accounting periods, the amendments to IAS 32 will have an impact on the
classification of those rights issues.
IFRS 13 Fair Value Measurement – aims to improve consistency and reduce complexity by providing
a precise definition of fair value and a single source of fair value measurement and disclosure
requirements to use across IFRSs. The Standard:
defines fair value;
sets out in a single IFRS a framework for measuring fair value;
requires disclosures about fair value measurements.
IFRS 13 applies when another IFRS requires or permits fair value measurements or disclosures about
fair value measurements (and measurements, such as fair value less costs to sell, based on fair value
or disclosures about those measurements), except for share-based payment transactions within the
scope of IFRS 2 “Share-based Payment”, leasing transactions within the scope of IAS 17 “Leases”,
and measurements that have some similarities to fair value but that are not fair value, such as net
realizable value in IAS 2 “Inventories” or value in use in IAS 36 “Impairment of Assets”.
The Company is currently assessing the impact of the amended standard on its consolidated financial
statements.
All other Standards and Interpretations issued are not applicable to the Company’s operations.
Management believes the adoption of these Standards and Interpretations will not have a significant
impact on the results of the Company’s operations.
20
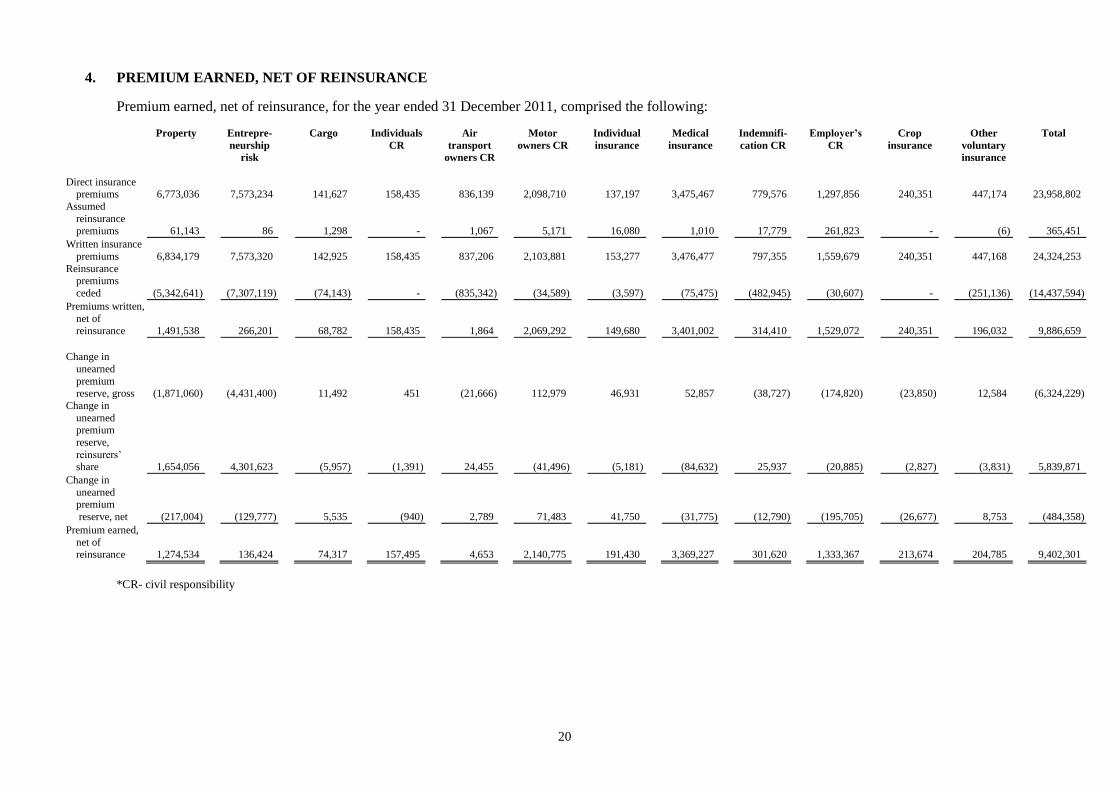
4. PREMIUM EARNED, NET OF REINSURANCE
Premium earned, net of reinsurance, for the year ended 31 December 2011, comprised the following:
Property
Entrepre-
neurship
risk
Cargo Individuals
CR
Air
transport
owners CR
Motor
owners CR
Individual
insurance
Medical
insurance
Indemnifi-
cation CR
Employer’s
CR
Crop
insurance
Other
voluntary
insurance
Total
Direct insurance premiums 6,773,036 7,573,234 141,627 158,435 836,139 2,098,710 137,197 3,475,467 779,576 1,297,856 240,351 447,174 23,958,802
Assumed
reinsurance
premiums 61,143 86 1,298 - 1,067 5,171 16,080 1,010 17,779 261,823 - (6) 365,451
Written insurance
premiums 6,834,179 7,573,320 142,925 158,435 837,206 2,103,881 153,277 3,476,477 797,355 1,559,679 240,351 447,168 24,324,253
Reinsurance premiums
ceded (5,342,641) (7,307,119) (74,143) - (835,342) (34,589) (3,597) (75,475) (482,945) (30,607) - (251,136) (14,437,594)
Premiums written,
net of reinsurance 1,491,538 266,201 68,782 158,435 1,864 2,069,292 149,680 3,401,002 314,410 1,529,072 240,351 196,032 9,886,659
Change in
unearned
premium reserve, gross (1,871,060) (4,431,400) 11,492 451 (21,666) 112,979 46,931 52,857 (38,727) (174,820) (23,850) 12,584 (6,324,229)
Change in
unearned premium
reserve,
reinsurers’ share 1,654,056 4,301,623 (5,957) (1,391) 24,455 (41,496) (5,181) (84,632) 25,937 (20,885) (2,827) (3,831) 5,839,871
Change in
unearned premium
reserve, net (217,004) (129,777) 5,535 (940) 2,789 71,483 41,750 (31,775) (12,790) (195,705) (26,677) 8,753 (484,358)
Premium earned,
net of reinsurance 1,274,534 136,424 74,317 157,495 4,653 2,140,775 191,430 3,369,227 301,620 1,333,367 213,674 204,785 9,402,301
*CR- civil responsibility

21
Premium earned, net of reinsurance, for the year ended 31 December 2010, comprised the following:
Property Entrepre-
neurship
risk
Cargo CR* of
individuals
CR of air
transport
owners
CR of motor
owners
Individual
insurance
Medical
insurance
CR for
indemnifi-
cation
Employer’s
CR
Crop
insurance
Other
voluntary
insurance
Total
Direct insurance
premiums 3,385,674 2,150,753 146,091 151,475 941,370 2,201,869 201,214 2,847,392 705,710 1,092,314 220,813 444,047 14,488,722 Assumed
reinsurance
premiums 19,028 9,069 2,442 72 6,693 14,979 24,851 152,455 5,457 17,221 - 14,446 266,713
Written insurance
premiums 3,404,702 2,159,822 148,533 151,547 948,063 2,216,848 226,065 2,999,847 711,167 1,109,535 220,813 458,493 14,755,435
Reinsurance
premiums ceded (2,423,263) (2,020,122) (68,301) - (902,574) (26,373) 2,490 (233,896) (412,363) (33,347) - (271,034) (6,388,783)
Premiums written,
net of
reinsurance 981,439 139,700 80,232 151,547 45,489 2,190,475 228,555 2,765,951 298,804 1,076,188 220,813 187,459 8,366,652
Change in
unearned premium
reserve, gross 238,805 (458,689) 8,483 1,637 (85,407) (50,794) 32,389 27,145 29,198 (55,965) 40,283 (61,276) (334,191)
Change in unearned
premium
reserve, reinsurers’
share (227,715) 429,019 (12,710) - 74,331 (6,930) (8,105) (19,979) 3,894 (2,985) - 16,766 245,586
Change in
unearned premium
reserve, net 11,090 (29,670) (4,227) 1,637 (11,076) (57,724) 24,284 7,166 33,092 (58,950) 40,283 (44,510) (88,605)
Premium earned,
net of reinsurance 992,529 110,030 76,005 153,184 34,413 2,132,751 252,839 2,773,117 331,896 1,017,238 261,096 142,949 8,278,047
*CR- civil responsibility

22
5. CLAIMS INCURRED, NET OF REINSURANCE
Claims incurred, net of reinsurance, for the year ended 31 December 2011, comprise the following:
Property Entrepre-
neurship
risk
Cargo Individuals
CR
Air
transport
owners CR
Motor
owners CR
Individual
insurance
Medical
insurance
Indemnifi-
cation CR
Employer’s
CR
Crop
insurance
Other
voluntary
insurance
Total
Claims paid on direct
insurance (248,460) (24,065) (4,133) (3,132) (1,906) (596,880) (30,173) (3,146,546) (392) (402,329) (118,798) (89,903) (4,666,717)
Claims paid on assumed
reinsurance (2,012) - - - (6,809) (1,707) - - - (19,136) - (94) (29,758)
Claims paid, gross (250,472) (24,065) (4,133) (3,132) (8,715) (598,587) (30,173) (3,146,546) (392) (421,465) (118,798) (89,997) (4,696,475)
Claims paid,
reinsurers’ share 104 - 1,210 - 1,909 24,582 - (1,251) - 22,303 - 59,271 108,128
Claims paid, net (250,368) (24,065) (2,923) (3,132) (6,806) (574,005) (30,173) (3,147,797) (392) (399,162) (118,798) (30,726) (4,588,347)
Change in reserves
for claims and
claims’
adjustment expenses, gross (787,119) 3,741,535 5,153 3,797 63,541 314,470 27,437 (17,312) (25,309) (103,383) (14,054) (52,073) 3,156,683
Change in reinsurers’
share of reserves for claims and
claims’
adjustment expenses 697,358 (4,087,741) (1,331) - (69,193) (61) - (32) - 4,887 - (4,692) (3,460,805)
Net change in
reserves for
claims and claims’
adjustment
expenses (89,761) (346,206) 3,822 3,797 (5,652) 314,409 27,437 (17,344) (25,309) (98,496) (14,054) (56,765) (304,122)
Claims incurred, net of reinsurance (340,129) (370,271) 899 665 (12,458) (259,596) (2,736) (3,165,141) (25,701) (497,658) (132,852) (87,491) (4,892,469)

23
Claims incurred, net of reinsurance, for the year ended 31 December 2010, comprise the following:
Property Entrepre-
neurship
risk
Cargo Individuals
CR
Air
transport
owners CR
Motor
owners CR
Individual
insurance
Medical
insurance
Indemnifi-
cation CR
Employer’s
CR
Crop
insurance
Other
voluntary
insurance
Total
Claims paid on direct
insurance (47,400) (486,425) (6,958) (1,405) - (563,137) (101,552) (2,323,658) (500) (444,234) (357,225) (24,679) (4,357,173)
Claims paid on assumed
reinsurance (181) - (613) - (113,822) (421) - - - (30,056) - (264) (145,357)
Claims paid, gross (47,581) (486,425) (7,571) (1,405) (113,822) (563,558) (101,552) (2,323,658) (500) (474,290) (357,225) (24,943) (4,502,530)
Claims paid,
reinsurers’ share 7,802 462,127 - - - 216 350 12,849 - 5,198 - - 488,542
Claims paid, net (39,779) (24,298) (7,571) (1,405) (113,822) (563,342) (101,202) (2,310,809) (500) (469,092) (357,225) (24,943) (4,013,988)
Change in reserves
for claims and
claims’ adjustment
expenses, gross (1,028,732) (3,570,880) (10,925) (1,096) 158,842 (162,391) 37,071 102,138 2,035 96,758 (4,977) (4,244) (4,386,401)
Change in reinsurers’ share of reserves
for claims and
claims’ adjustment
expenses 669,816 3,576,069 3,088 (20) (124,740) 2,806 (16,536) (20,000) (154) 5,646 - (450) 4,095,525
Net change in
reserves for claims and
claims’
adjustment expenses (358,916) 5,189 (7,837) (1,116) 34,102 (159,585) 20,535 82,138 1,881 102,404 (4,977) (4,694) (290,876)
Claims incurred, net
of reinsurance (398,695) (19,109) (15,408) (2,521) (79,720) (722,927) (80,667) (2,228,671) 1,381 (366,688) (362,202) (29,637) 5 (4,304,864)

24
6. NET COMMISSION EXPENSE
Net commission expense for the year ended 31 December 2011, comprises the following:
Property Entrepre-
neurship
risk
Cargo CR of
individuals
CR of air
transport
owners
CR of motor
owners
Individual
insurance
Medical
insurance
CR for
indemnifi-
cation
Employer’s
CR
Crop
insurance
Other
voluntary
insurance
Total
Commission income 76,232 16,784 8,776 - 1,975 2,341 376 15,378 4,692 2,281 - 25,803 154,638
Commission
expense (173,544) (34,011) (16,150) (8,028) (32,146) (154,838) (27,693) (9,305) (61,979) (109,275) (21,935) (16,537) (665,441) Change in
deferred
acquisition costs (5,956) (395) (304) (522) (260) (9,155) (4,526) (230) 199 (849) 1,550 (3,530) (23,978)
(103,268) (17,622) (7,678) (8,550) (30,431) (161,652) (31,843) 5,843 (57,088) (107,843) (20,385) 5,736 (534,781)
Net commission expense for the year ended 31 December 2010, comprises the following:
Property Entrepre-
neurship
risk
Cargo CR of
individuals
CR of air
transport
owners
CR of motor
owners
Individual
insurance
Medical
insurance
CR for
indemnifi-
cation
Employer’s
CR
Crop
insurance
Other
voluntary
insurance
Total
Commission
income 21,180 12,847 3,147 - 1,490 1,340 911 18,753 - 2,542 - 37,023 99,233 Commission
expense (178,990) (28,982) (11,494) (10,264) (29,841) (234,601) (31,740) (31,663) (20,158) (87,580) (23,262) (96,847) (785,422)
Change in deferred
acquisition
costs (3,527) 947 270 (684) 247 (22,085) (1,170) (15) (1,235) 6,367 (3,727) 4,278 (20,334)
(161,337) (15,188) (8,077) (10,948) (28,104) (255,346) (31,999) (12,925) (21,393) (78,671) (26,989) (55,546) (706,523)

25
7. INVESTMENT INCOME
Year ended
31 December
2011
Year ended
31 December
2010
Investment income:
Interest income 1,165,826 989,665
Net realized loss on disposal of investments available-for-sale (78,633) -
1,087,193 989,665
Interest income:
Interest income on financial assets at fair value 961,303 745,301
Interest income on financial assets recorded at amortized cost:
interest income on unimpaired financial assets 204,523 244,364
1,165,826 989,665
Interest income on financial assets recorded at amortized cost comprises:
Interest on due from banks 158,639 203,704
Interest on investments held-to-maturity 45,795 40,660
Interest on loans under reverse repurchase agreements 89 -
204,523 244,364
Interest income on financial assets at fair value comprises:
Interest income on investments available-for-sale 961,303 745,301
961,303 745,301
1,165,826 989,665
8. SALARIES AND BENEFITS, ADMINISTRATIVE AND OPERATING EXPENSES
Year ended
31 December
2011
Year ended
31 December
2010
Salaries and benefits 1,336,726 1,184,963
Social tax 131,900 119,808
1,468,626 1,304,771

26
Administrative and operating expenses comprise:
Year ended
31 December
2011
Year ended
31 December
2010
Professional services 211,935 79,723
Rent expenses 132,696 92,670
Property and equipment maintenance 52,714 52,440
Communication expenses 48,236 41,962
Payments to JSC Insurance Payments Guarantee Fund 47,345 76,644
Marketing and advertising costs 36,137 65,315
Utilities 31,263 6,591
Stationery 32,133 24,994
Bank commissions 30,391 25,017
Insurance expenses 26,585 23,575
Business trip and related expenses 25,465 22,630
Taxes other than income tax 17,368 7,611
Security expenses 6,302 6,929
Training 3,108 3,891
Other 28,075 10,908
729,753 540,900
9. PROVISION FOR IMPAIRMENT LOSSES ON OTHER OPERATIONS
Insurance and
reinsurance
receivables
Other assets Total
31 December 2009 64,645 598 65,243
Additional provisions recognized 88,986 - 88,986
Write-off of assets (27,468) - (27,468)
31 December 2010 126,163 598 126,761
Additional provisions recognized 75,135 5,734 80,869
Write-off of assets (9,935) (485) (10,420)
31 December 2011 191,363 5,847 197,210

27
10. INCOME TAXES
The Company performs its tax calculation on the basis of tax regulations in accordance with the
legislation of the Republic of Kazakhstan, which can differ from IFRS.
The Company’s permanent tax differences arise mainly due to non-tax deductibility of certain
expenses and a tax free regime for certain income.
Deferred taxes reflect the net tax effects of temporary differences between the carrying amounts of
assets and liabilities for financial reporting purposes and the amounts used for tax purposes.
As at 31 December 2011 and 2010, temporary differences relate mostly to different methods of
income and expense recognition as well as to recorded values of certain assets.
Effective 1 January 2012, an amendment to the Tax Code was enacted on the calculation of corporate
income tax for insurance companies. Due to the absence of transition rules issued by the tax
authorities, the Company calculated its deferred tax in accordance with Tax Code rules effective
during 2011. The Company has recognized a deferred tax asset in the financial statements, to the
extent that it is probable that taxable profit will be available against which the deductible temporary
difference can be utilized. Management believes the change in tax legislation will not impact their
ability to recover the deferred tax asset.
Temporary differences as at 31 December 2011 and 2010 comprise:
31 December 2011
Affiliated
insured
Non-affiliated
insured Total
Deductible temporary differences:
Unearned premium reserve 49,232 11,845,630 11,894,862
Reinsurance payable 16,158 2,484,635 2,500,793
Total deductible temporary differences 65,390 14,330,265 14,395,655
Taxable temporary differences:
Unearned premium reserve, reinsurers’
share (33,173) (8,344,011) (8,377,184)
Deferred acquisition costs - (91,806) (91,806)
Net deductible temporary differences 32,217 5,894,448 5,926,665
Net deferred tax assets at the statutory
rate (4% for non-affiliated insured
and 8% for affiliated insured) 2,577 235,778 238,355

28
31 December 2010
Affiliated
Insured
Non-affiliated
insured Total
Deductible temporary differences:
Unearned premium reserve 38,263 5,532,370 5,570,633
Reinsurance payable 27,605 768,086 795,691
Total deductible temporary differences 65,868 6,300,456 6,366,324
Taxable temporary differences:
Unearned premium reserve, reinsurers’
share (24,246) (2,513,067) (2,537,313)
Deferred acquisition costs, reinsurer’s
share - (44,260) (44,260)
Net deductible temporary differences 41,622 3,743,129 3,784,751
Net deferred tax assets at the statutory
rate (4% for non-affiliated and 8%
for affiliated insured) 3,330 149,725 153,055
Relationships between tax expenses and taxable income for the years ended 31 December 2011
and 2010 are explained as follows:
Year ended 31 December 2011
Affiliated
insured
Non-affiliated
insured
Total
Premium earned, net of reinsurance 317,793 9,084,508 9,402,301
Change in deferred acquisition costs - (23,978) (23,978)
Income from regress of claims related to
agriculture insurance - 59,331 59,331
Commission income - 154,638 154,638
Adjustments to insurance income - (1,121) (1,121)
Expense on payments to Joint Stock Company
Insurance Payments Guarantee Fund - (56,304) (56,304)
Net taxable insurance income 317,793 9,217,074 9,534,867
Tax at the statutory rate (4% for non-affiliated
and 8% for affiliated insured) 25,424 368,683 394,107
Income tax expense for non-insurance activity - 40,195 40,195
Income tax expense 25,424 408,878 434,302

29
Year ended 31 December 2010
Affiliated
insured
Non-affiliated
insured
Total
Premium earned, net of reinsurance 66,913 8,211,134 8,278,047
Change in deferred acquisition costs - (20,334) (20,334)
Income from regress of claims related to
agriculture insurance - 176,884 176,884
Commission income - 99,233 99,233
Adjustments to insurance income - 37,980 37,980
Commission paid to Joint Stock Company
Insurance Payments Guarantee Fund (148) (68,329) (68,477)
Net taxable insurance income 66,765 8,436,568 8,503,333
Tax at the statutory rate (4% for non-affiliated
and 8% for affiliated insured) 5,341 337,463 342,804
Current income tax expense for non-insurance
activity - 35,436 35,436
Income tax expense 5,341 372,899 378,240
Year ended
31 December
2011
Year ended
31 December
2010
Current income tax expense 519,602 382,091
Deferred income tax benefit (85,300) (3,851)
Income tax expense 434,302 378,240
Deferred income tax asset comprised: 2011 2010
Beginning of the year 153,055 149,204
Change in deferred income tax asset 85,300 3,851
End of the year 238,355 153,055
11. EARNINGS PER SHARE
Basic and diluted earnings per share are calculated by dividing net profit for the year attributable to
equity holders of the parent by the weighted average number of participating shares outstanding
during the year.
Year ended
31 December
2011
Year ended
31 December
2010
Net profit 2,280,151 1,718,325
Weighted average number of ordinary shares for purposes of basic and
diluted earnings per share 338,011 338,011
Earnings per share – basic and diluted (KZT) 6,745.79 5,083.64
As at 31 December 2011 and 2010, the book value of one ordinary share, calculated in accordance
with the methodology provided by KASE, amounted to KZT 43 thousand and KZT 40 thousand,
respectively.

30
12. CASH AND CASH EQUIVALENTS
31 December
2011
31 December
2010
Balances with banks in Kazakhstani tenge 561,379 787,081
Balances with banks in foreign currencies 64,608 1,078,167
Cash on hand 4,854 6,408
630,841 1,871,656
13. DUE FROM BANKS
31 December
2011
31 December
2010
Long-term deposits 755,565 -
Short-term deposits 409,672 2,542,567
Restricted deposit 32,970 9,219
1,198,207 2,551,786
As at 31 December 2011 and 2010, accrued interest income on due from banks comprised
KZT 12,704 thousand and KZT 58,537 thousand, respectively.
As at 31 December 2011 and 2010, interest rates on long-term deposits and short-term deposits were
5%-7%.
14. INVESTMENTS AVAILABLE-FOR-SALE
31 December
2011
31 December
2010
Debt securities 13,075,067 10,636,937
Equity securities 802,177 49,443
13,877,244 10,686,380
Interest to
nominal
31 December
2011
Interest to
nominal
31 December
2010
Debt securities:
Corporate bonds 5.89%-12.00% 7,451,931 6.50%-12% 5,319,305
Bonds of Kazakhstan banks 8.00%-14.00% 2,982,678 5.50%-9.30% 1,464,630
Treasury bonds of the Ministry of
Finance of the Republic of
Kazakhstan 0.06%-8.75% 2,640,458 0.06%-8.75% 3,853,002
13,075,067
10,636,937
31
Ownership
interest
31 December
2011
Ownership
interest
31 December
2010
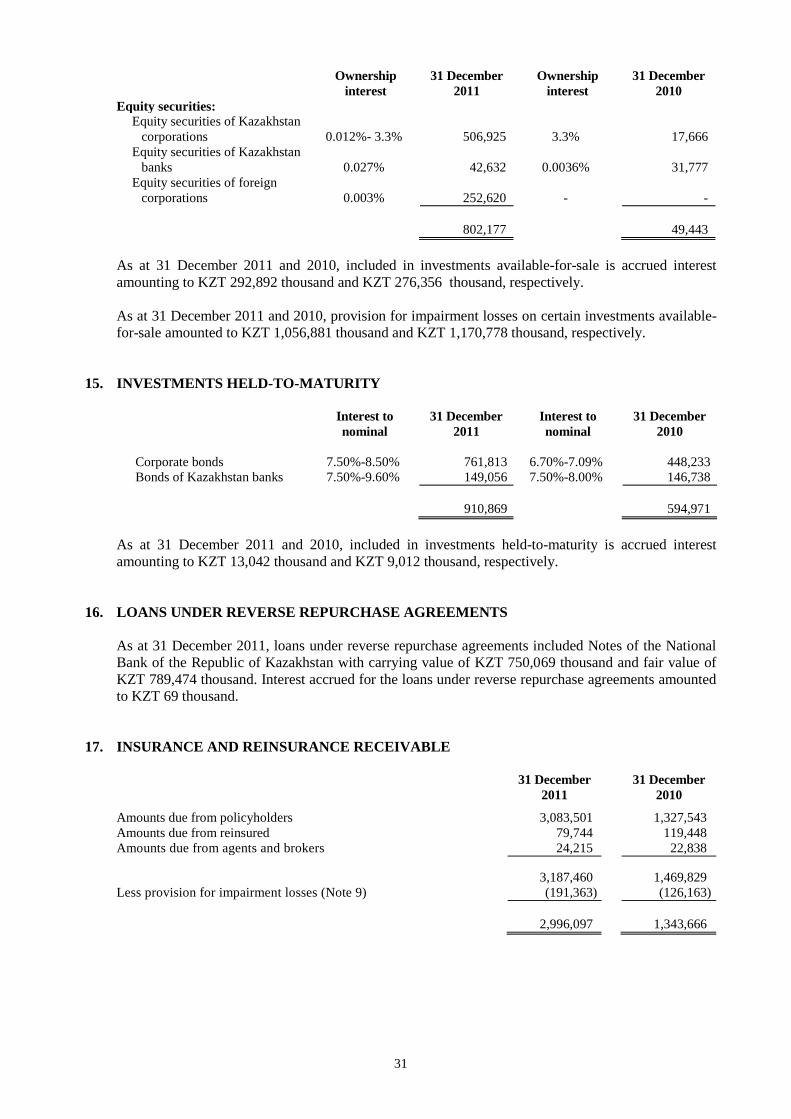
Equity securities:
Equity securities of Kazakhstan
corporations 0.012%- 3.3% 506,925 3.3% 17,666
Equity securities of Kazakhstan
banks 0.027% 42,632 0.0036% 31,777
Equity securities of foreign
corporations 0.003% 252,620 - -
802,177 49,443
As at 31 December 2011 and 2010, included in investments available-for-sale is accrued interest
amounting to KZT 292,892 thousand and KZT 276,356 thousand, respectively.
As at 31 December 2011 and 2010, provision for impairment losses on certain investments available-
for-sale amounted to KZT 1,056,881 thousand and KZT 1,170,778 thousand, respectively.
15. INVESTMENTS HELD-TO-MATURITY
Interest to
nominal
31 December
2011
Interest to
nominal
31 December
2010
Corporate bonds 7.50%-8.50% 761,813 6.70%-7.09% 448,233
Bonds of Kazakhstan banks 7.50%-9.60% 149,056 7.50%-8.00% 146,738
910,869 594,971
As at 31 December 2011 and 2010, included in investments held-to-maturity is accrued interest
amounting to KZT 13,042 thousand and KZT 9,012 thousand, respectively.
16. LOANS UNDER REVERSE REPURCHASE AGREEMENTS
As at 31 December 2011, loans under reverse repurchase agreements included Notes of the National
Bank of the Republic of Kazakhstan with carrying value of KZT 750,069 thousand and fair value of
KZT 789,474 thousand. Interest accrued for the loans under reverse repurchase agreements amounted
to KZT 69 thousand.
17. INSURANCE AND REINSURANCE RECEIVABLE
31 December
2011
31 December
2010
Amounts due from policyholders 3,083,501 1,327,543
Amounts due from reinsured 79,744 119,448
Amounts due from agents and brokers 24,215 22,838
3,187,460 1,469,829
Less provision for impairment losses (Note 9) (191,363) (126,163)
2,996,097 1,343,666

32
18. DEFERRED EXPENSES
During 2011 and 2010, the Company concluded various medical insurance contracts. In accordance
with the legislation of the Republic of Kazakhstan the Company cannot render medical services as it
does not possess the required license. In order to fulfill its obligations under the policies, the
Company signed agreements with medical assistance companies and transferred on average 80%-90%
of premiums received under the agreement to the assistance companies. Amounts transferred to
assistance companies are recognized as deferred expenses and are amortized over the term of the
policies.
As at 31 December 2011 and 2010, deferred expenses amounted to KZT 282,551 thousand and
KZT 204,078 thousand, respectively.
19. UNEARNED PREMIUM RESERVE
31 December
2011
31 December
2010
Change in
unearned
premium
reserve
Gross unearned premium reserve (Note 4) 11,894,862 5,570,633 6,324,229
Unearned premium reserve, reinsurers' share
(Note 4) (8,377,184) (2,537,313) (5,839,871)
Unearned premium reserve, net of reinsurers' share 3,517,678 3,033,320 484,358
31 December
2010
31 December
2009
Change in
unearned
premium
reserve
Gross unearned premium reserve (Note 4) 5,570,633 5,236,442 334,191
Unearned premium reserve, reinsurers' share
(Note 4) (2,537,313) (2,291,727) (245,586)
Unearned premium reserve, net of reinsurers' share 3,033,320 2,944,715 88,605
20. RESERVES FOR CLAIMS AND CLAIMS' ADJUSTMENT EXPENSES, NET OF
REINSURERS' SHARE
Reserves have been established on the basis of information currently available, including potential
outstanding loss notifications and experience with similar claims in the preceding periods. IBNR is
actuarially determined by lines of business and is based on statistical claims data for the period typical
for loss development of the classes and sub-classes of business, the Company's previous experience
and the availability of data. While management believes that the gross reserve for claims and claims'
adjustment expenses and the related reinsurance recoveries are fairly stated on the basis of the
information available to them, the ultimate liability may vary as a result of subsequent information
and events and may result in adjustments to the amounts provided. Any adjustments to the amount of
reserves will be reflected in the financial statements in the period in which the necessary adjustments
become known and estimable.

33
The movements in reserves for claims and claims' adjustment expenses during 2011 and 2010 were as
follows:
2011 2010
Gross Reinsurers'
share
Net
reserves
Gross Reinsurers'
share
Net
reserves
1 January 6,290,959 (5,145,718) 1,145,241 1,904,558 (1,050,194) 854,364
Plus claims
incurred (Note 5) 1,539,792 3,352,677 4,892,469 228 8,888,931 (4,584,066) 4,304,865
Less claims paid
(Note 5) (4,696,475) 108,128 (4,588,347) (4,502,530) 488,542 (4,013,988)
31 December 3,134,276 (1,684,913) 1,449,363 6,290,959 (5,145,718) 1,145,241
21. PROPERTY AND EQUIPMENT
Land and
buildings
Vehicles Computers
and computer
equipment
Construction
in
progress
Other Total
At cost
31 December 2009 200,442 109,022 77,156 26,217 101,392 514,229
Additions 6,352 29,766 102,096 773,132 16,297 927,643
Transfers 760,473 - - (760,473) - -
Disposals (160) (6,815) (6,730) - (12,048) (25,753)
31 December 2010 967,107 131,973 172,522 38,876 105,641 1,416,119
Additions 9,011 21,055 20,318 6,542 13,752 70,678
Transfers 150 - (41,636) (150) 41,636 -
Disposals (34) (6,797) (10,356) - (6,128) (23,315)
31 December 2011 976,234 146,231 140,848 45,268 154,901 1,463,482
Accumulated
depreciation
31 December 2009 (45,122) (60,622) (62,270) - (48,630) (216,644)
Charge for the year (19,936) (27,321) (34,579) - (13,713) (95,549)
Disposals 92 6,275 6,657 - 7,614 20,638
31 December 2010 (64,966) (81,668) (90,192) - (54,729) (291,555)
Charge for the year (18,816) (29,318) (31,595) - (16,850) (96,579)
Transfers - - 16,837 - (16,837) -
Disposals 22 6,085 10,322 - 5,063 21,492
31 December 2011 (83,760) (104,901) (94,628) - (83,353) (366,642)
Net book value
As at 31 December
2011 892,474 41,330 46,220 45,268 71,548 1,096,840
As at 31 December
2010 902,141 50,305 82,330 38,876 50,912 1,124,564
As at 31 December 2011 and 2010, construction in progress included office premises in Kostanai.
As at 31 December 2011 and 2010, included in property and equipment were fully depreciated assets
of KZT 90,626 thousand and KZT 70,290 thousand, respectively.

34
22. OTHER ASSETS
31 December
2011
31 December
2010
Other financial assets:
Receivable from reimbursement of claims 316,603 413,942
Guarantee payments to clients for participation in tenders 12,838 9,405
329,441 423,347
Less: provision for impairment losses (Note 9) (5,847) (598)
Total other financial assets 323,594 422,749
Other non-financial assets:
Advances paid for materials and services 160,891 252,104
Inventory 17,794 24,633
Prepaid insurance premiums 14,716 10,097
Broker settlements 4,427 6,119
Prepaid taxes 2,154 10,514
Other 1,132 687
Total other non-financial assets 201,114 304,154
524,708 726,903
23. INSURANCE AND REINSURANCE PAYABLE
31 December
2011
31 December
2010
Amounts payable to reinsurers 2,500,793 795,691
Amounts payable to insured 94,028 156,162
Amounts payable to agents and brokers 61,485 36,018
Advances received for the insurance activity 53,988 63,713
Amounts payable to reinsured - 63,309
2,710,294 1,114,893
24. OTHER LIABILITIES
31 December
2011
31 December
2010
Other financial liabilities:
Accrued reserves for bonuses 171,664 208,782
Amounts payable to employees 23,895 21,821
Amounts payable for materials and services 21,710 11,262
Payable to JSC Insurance Payments Guarantee Fund 10,542 19,502
Other advances received 4,107 2,871
Total other financial liabilities 231,918 264,238
Other non-financial liabilities:
Taxes payable other than income tax 75,404 29,662
Deferred income from insurance activity 66,459 329,169
Unused vacation reserves 47,245 31,806
Other 15,031 24,760
Total other non-financial liabilities 204,139 415,397
436,057 679,635
The Company accrues unused vacation reserve which represents amounts payable to employees for
unused vacation in case employees leave the Company. The amount of vacation reserve
is calculated based on the average salary and other benefits of each employee for the last
12 calendar months.

35
25. EQUITY
As at 31 December 2011 and 2010, the share capital consisted of 338,011 ordinary shares, which were
authorized, issued, and fully paid with a value of KZT 4,587,895 thousand. Each ordinary share is
entitled to one vote and shares equally in dividends. During 2011, the Company paid dividends in the
amount of KZT 1,000,000 thousand to its shareholders.
According to FMSC Regulation on formation of insurance reserves # 61 Effective from January 2011,
in accordance with the FMSC legislation on insurance reserves, insurance companies are required to
create a stabilization reserve. This reserve is in the form of a transfer of retained earnings to an equity
reserve to cover any unforeseen future losses of the Company. As at 31 December 2011, the Company
created a stabilization reserve in the amount of KZT 651,897 thousand, which was included in other
reserves.
26. COMMITMENTS AND CONTINGENCIES
Legal proceedings
From time to time and in the normal course of business, claims against the Company are received from
customers and counterparties. Management is of the opinion that no material unaccrued losses will be
incurred by the Company and accordingly no provision has been made in these financial statements.
Taxation
Kazakhstani commercial and tax legislation in particular may give rise to varying interpretations and
amendments, which may be retrospective in nature. In addition, as Management’s interpretation of tax
legislation may differ from that of the tax authorities, transactions may be challenged by the tax
authorities, and as a result the Company may be assessed additional taxes, penalties and interest. The
Management of the Company believes that it has already made all tax payments, and therefore no
allowance has been made in the financial statements. Tax years remain open to review by the tax
authorities for five years.
Pensions and retirement plans
Employees of the Company receive pension benefits from pension funds except for the agents
working under the agency contracts in accordance with the laws and regulations of the Republic of
Kazakhstan. As at 31 December 2011 and 2010, the Company was not liable for any supplementary
pensions, post-retirement health care, insurance benefits, or retirement indemnities to its current or
former employees.
Capital commitments
As at 31 December 2011 and 2010, the Company had no significant capital commitments.
Operating lease commitments
As at 31 December 2011, the Company did not have any significant operating lease commitments.
As at 31 December 2010, the future minimum lease payments under non cancellable operating leases
amounted to KZT 28,217 thousand.

36
27. TRANSACTIONS WITH RELATED PARTIES
Related parties or transactions with related parties, as defined by IAS 24 “Related party disclosures”
are presented below.
In considering each possible related party relationship, attention is directed to the substance of
the relationship, and not merely the legal form. The Company had the following transactions
outstanding as at 31 December 2011 and 2010 with related parties:
31 December 2011 31 December 2010
Related party
balances
Total category
as per financial
statements
caption
Related party
balances
Total category
as per financial
statements
caption
Cash and cash equivalents 572,173 630,841 788,409 1,871,656
- the parent company 572,173 788,409
Due from banks 26 1,198,207 26 2,551,786
- the parent company 26 26
Investments held-to-maturity 149,056 910,869 146,738 594,971
- the parent company 149,056 146,738
Insurance and reinsurance receivable 9,916 2,996,097 38,713 1,343,666
- the parent company 9,786 10,402
- other related parties 130 28,311
Insurance and reinsurance payable 598 2,710,294 22,322 1,114,893
- the parent company 485 667
- other related parties 112 21,655
The remuneration of directors and other members of key management were as follows:
Year ended
31 December 2011
Year ended
31 December 2010
Related party
transactions
Total category
as per financial
statements
caption
Related party
transactions
Total category
as per financial
statements
caption
Key management personnel
compensation:
- salaries and other employee
benefits 118,015 1,468,626 120,447 1,304,771

37
Included in the income statement for the years ended 31 December 2011 and 2010 are the following
amounts which arose due to transactions with related parties:
Year ended
31 December 2011
Year ended
31 December 2010
Related party
transactions
Total category
as per financial
statements
caption
Related party
transactions
Total category
as per financial
statements
caption
Written insurance premiums 390,423 24,324,253 134,068 14,755,435
- the parent company 66,828 61,053
- entities with joint control or
significant influence over
the entity 323,595 73,015
Claims paid, gross (397,125) (4,696,475) (319,620) (4,502,530)
- the parent company (71,881) (117,366)
- entities with joint control or
significant influence over
the entity (325,244) (202,254)
Investment income 12,487 1,087,193 14,644 989,665
- the parent company 12,487 14,644
Commission expense (40,844) (665,441) (18,510) (785,422)
- the parent company (11,450) (16,859)
- entities with joint control or
significant influence over
the entity (29,394) (1,651)
Administrative and operating
expense (94,033) (729,753) (11,995) (540,900)
- the parent company (1,150) (1,716)
- entities with joint control or
significant influence over
the entity (98,676) (4,977)
- key management personnel (5,793) (5,302)
28. SEGMENT REPORTING
The Company discloses information to enable users of its financial statements to evaluate the nature and
financial effects of the business activities in which it engages and the economic environments in which
it operates. This matter is regulated by IFRS 8 “Operating segments” and other standards that require
special disclosures in the form of segmental reporting.
The Company’s primary format for reporting segment information is business segments and the
secondary format is geographical segments.
The segment information below is presented on the basis used by the Company’s chief operating
decision maker to evaluate performance, in accordance with IFRS 8. The Management Board reviews
discrete financial information for each of its segments, including measures of operating results, assets
and liabilities. The segments are managed primarily on the basis of their results, which excludes
certain unallocated costs related to other income and expense, operating expenses other than salaries
and other employee benefits.

38
Segment information for the main reportable business segments of the Company for the years ended
31 December 2011 and 2010 is set out below:
Insurance and
reinsurance
activity
Investment
activity
All other
segments
Year ended
31 December
2011
Written insurance premiums 24,565,741 - - 24,565,741
Written insurance premiums return (241,488) - - (241,488)
Reinsurance premiums ceded (14,437,594) - - (14,437,594)
Change in unearned premium
reserve (484,358) - - (484,358)
Claims paid (4,696,475) - - (4,696,475)
Claims paid, reinsurers’ share 108,128 - - 108,128
Change in reserves for claims and
claims’ adjustment expenses 3,156,683 - - 3,156,683
Change in reinsurers' share of
reserves for claims and claims’
adjustment expenses (3,460,805) - - (3,460,805)
Change in deferred acquisition
costs (23,978) - - (23,978)
Reimbursement of claims 142,158 - - 142,158
Unallocated loss adjustment
expenses (6,917) - - (6,917)
Commission income 154,638 - - 154,638
Commission expense (665,441) - - (665,441)
Investment income - 1,359,193 - 1,359,193
Investment expense - (272,000) - (272,000)
Other operating income 225,470 - 14,765 240,235
Other operating expense (253,286) - (46,595) (299,881)
Salaries and benefits (1,468,626) - - (1,468,626)
Administrative and operating
expenses (729,753) - - (729,753)
Provision for impairment losses on
other operations (80,869) - - (80,869)
Provision for impairment losses on
investments available-for-sale - (22,403) - (22,403)
Gain on foreign exchange
operations 167,803 75,826 64,524 308,153
Loss on foreign exchange
operations (193,901) (49,727) (85,543) (329,171)
Segment result 1,777,130 1,090,889 (52,849) 2,815,170
Unallocated costs:
Depreciation and amortization (100,717)
Insurance and
reinsurance
activity
Investment
activity
All other
segments
As at
31 December
2011
Total segment assets 14,529,390 17,367,230 - 31,896,620
Unallocated assets 782,388
Total assets 32,679,008
Total segment liabilities 17,739,432 - - 17,739,432
Unallocated liabilities 473,684
Total liabilities 18,213,116

39
Insurance and
reinsurance
activity
Investment
activity
All other
segments
Year ended
31 December
2010
Written insurance premiums 14,930,803 - - 14,930,803
Written insurance premiums return (175,368) - - (175,368)
Reinsurance premiums ceded (6,388,783) - - (6,388,783)
Change in unearned premium
reserve (88,605) - - (88,605)
Claims paid (4,502,530) - - (4,502,530)
Claims paid, reinsurers’ share 488,542 - - 488,542
Change in reserves for claims and
claims’ adjustment expenses (4,386,401) - - (4,386,401)
Change in reinsurers' share of
reserves for claims and claims’
adjustment expenses 4,095,525 - - 4,095,525
Reimbursement of claims 278,976 - - 278,976
Unallocated loss adjustment
expenses (9,304) - - (9,304)
Commission income 99,233 - - 99,233
Commission expense (785,422) - - (785,422)
Investment income - 1,023,809 - 1,023,809
Investment expense - (34,144) - (34,144)
Other operating income 78,248 - 7,154 85,402
Other operating expense (132,239) - (18,915) (151,154)
Salaries and benefits (1,304,771) 771 - - (1,304,771)
Administrative and operating
expenses (540,900) -
-
(540,900)
Provision for impairment losses on
other operations (88,986) -
- (88,986)
Provision for impairment losses on
investments available-for-sale - (308,131)
-
(308,131)
Gain on foreign exchange
operations 86,193 30,121 32,256 148,570
Loss on foreign exchange
operations (79,875) (46,511) (44,882) 4 (171,268)
Segment result 1,574,336 665,144 (24,388) 2,215,092
Unallocated costs:
Unallocated administrative and
operating expenses (197,545)
Depreciation and amortization (98,194)
Insurance and
reinsurance
activity
Investment
activity
All other
segments
As at
31 December
2010
Total segment assets 10,471,123 15,704,793 - 26,175,916
Unallocated assets 919,867
Total assets 27,095,783
Total segment liabilities 12,976,485 - - 12,976,485
Unallocated liabilities 679,635
Total liabilities 13,656,120
The Company is organized on the basis of lines of business. Income and expenses related to the major
business of the Company by business segments are disclosed in Notes 4, 5 and 6.

40
Geographical segments
As at 31 December 2011 and 2010, the majority of financial assets and liabilities were concentrated in
the Republic of Kazakhstan, except for the financial assets and liabilities set out below.
Republic of
Kazakhstan
Non-OECD
countries
OECD
Countries
As at and for
the year ended
31 December
2011
Reinsurance premiums ceded 2,858,859 818,161 10,760,574 14,437,594
Insurance and reinsurance receivable 1,655,425 1,311,104 29,568 2,996,097
Insurance and reinsurance payable 837,329 633,845 1,239,120 2,710,294
Republic of
Kazakhstan
Non-OECD
countries
OECD
Countries
As at and for
the year ended
31 December
2010
Reinsurance premiums ceded 1,547,254 292,649 4,548,880 6,388,783
Insurance and reinsurance receivable 1,335,114 2,614 5,938 1,343,666
Insurance and reinsurance payable 522,903 181,892 410,098 1,114,893
29. FAIR VALUE OF FINANCIAL INSTRUMENTS
Estimated fair value disclosures of financial instruments are made in accordance with the requirements
of IAS 32 “Financial Instruments: Disclosure and Presentation” and IAS 39 “Financial Instruments:
Recognition and Measurement”. Fair value is defined as the amount at which the instrument could be
exchanged in a current transaction between knowledgeable willing parties in an arm’s length transaction,
other than in forced or liquidation sale. The estimates presented herein are not necessarily indicative
of the amounts the Company could realize in a market exchange from the sale of its full holdings of
a particular instrument.
The fair value of financial assets and liabilities approximate the corresponding carrying value in
the statement of financial position of the Company except for investments held-to-maturity which are
presented as follows:
31 December 2011 31 December 2010
Carrying value Fair value Carrying value Fair value
Investments held-to-maturity 910,868 878,554 594,971 542,759
Financial instruments recognized at fair value are broken down for disclosure purposes into a three
level fair value hierarchy based on the observability of inputs as follows:
Quoted prices in an active market (Level 1) – Valuations based on quoted prices in active
markets that the Company has the ability to access for identical assets or liabilities. Valuation
adjustments and block discounts are not applied to these financial instruments. Since valuations
are based on quoted prices that are readily and regularly available in an active market, valuations
of these products do not entail a significant amount of judgment.
Valuation techniques using observable inputs (Level 2) – Valuations based on inputs for which
all significant inputs are observable, either directly or indirectly and valuations based on one or
more observable quoted prices for orderly transactions in markets that are not considered active.
Valuation techniques incorporating information other than observable market data (Level 3) –
Valuations based on inputs that are unobservable and significant to the overall fair value
measurement.

41
The Company’s valuation approach and fair value hierarchy categorisation for certain significant
classes of financial instruments recognised at fair value is as follows:
31 December 2011
Level 1 Level 2
Investments available-for-sale 13,613,465 263,778
31 December 2010
Level 1 Level 2
Investments available-for-sale 10,511,032 157,682
As at 31 December 2011 and 2010, the investments held in the Insurance Payment Guarantee Fund
amounted to KZT 17,666 thousand classified as available-for-sale are held at historical cost.
30. RISK MANAGEMENT POLICIES
Management of risk is fundamental to the insurance business and is an essential element of
the Company's operations. The main risks inherent to the Company's operations are those related
to underwriting risk, credit risk, market risk on movements in interest and foreign exchange rates, and
liquidity risk. A summary of the Company's risk management policies in relation to those risks is as
follows.
Underwriting policies
The Company establishes underwriting guidelines and limits, which stipulate the approval process for
risks and their limits. These limits are being continuously monitored.
The Company’s direct insurance business is spread throughout Kazakhstan. The Company's
reinsurance portfolio is diversified in terms of geographical spread and in terms of lines of business.
Reinsurance
In the normal course of business the Company enters into treaty and facultative reinsurance
agreements with Kazakhstani and foreign reinsurers. Reinsurance contracts do not relieve the
Company from its obligations to policyholders. The Company evaluates the financial condition of its
reinsurers and monitors the concentration of credit risks arising from similar geographic regions,
activities, or economic characteristics of the reinsurers to minimize its exposure to significant losses
from reinsurer insolvencies.
Insurance reserves
The Company uses actuarial methods and assumptions in insurance and reinsurance liabilities
estimations. Please, see Notes 5 and 20 for discussions of reserves for claims and claims’ adjustment
expenses. The Company performs a run-off analysis of these reserves.
Investment risks
The investment policy of the Company is based on levels of income and the Company’s risk appetite
at a point in time. The investment activities of Kazakhstani insurance companies are under the strict
supervision of the FMSC and the Company does not have permission to operate as a professional
participant in the capital markets, therefore the Company hires broker companies to perform
investment operations.
The investment portfolio of the Company comprises financial instruments that are chosen according
to profitability rates, maturity and the risk level of the investment. The investment portfolio is
diversified so as to provide equal income receipts during the investing period. Investment income is
generally reinvested to increase the investment portfolio.

42
Credit risk
The Company is exposed to credit risk, which is the risk that one party to a financial instrument will
fail to discharge an obligation and cause the other party to incur a financial loss. The Company
structures the level of credit risk it undertakes by placing limits on the amount of risk accepted in
relation to one debtor, or groups of debtors and geographical segments. Limits on the level of credit
risk by a debtor and reinsurer are approved by the Management Board on a regular basis. Such risks
are monitored on a continuous basis and subject to an annual or more frequent assessment.
The Company regularly monitors the collectability of receivables from the insurance and reinsurance
businesses. All doubtful amounts due are provided for in the financial statements.
Maximum exposure
The Company’s maximum exposure to credit risk varies significantly and is dependant on both
individual risks and general market economy risks.
The following table presents the maximum exposure to credit risk of financial assets. For financial
assets the maximum exposure is equal to the carrying value of those assets prior to any offset or
collateral.
31 December 2011
Maximum
exposure
Offset Net exposure
after offset
Collateral
pledged
Net exposure
after offset
and collateral
Cash and cash equivalents 630,841 - 630,841 - 630,841
Due from banks 1,198,207 - 1,198,207 - 1,198,207
Insurance and reinsurance receivable 2,996,097 - 2,996,097 - 2,996,097
Investments available-for-sale 13,877,244 - 13,877,244 - 13,877,244
Investments held-to-maturity 910,869 - 910,869 - 910,869
Loans under reverse repurchase agreements 750,069 - 750,069 750,069 -
Other financial assets 323,594 - 323,594 - 323,594
31 December 2010
Maximum
exposure
Offset Net exposure
after offset
Collateral
pledged
Net exposure
after offset
and collateral
Cash and cash equivalents 1,871,656 - 1,871,656 - 1,871,656
Due from banks 2,551,786 - 2,551,786 - 2,551,786
Investments available-for-sale 10,686,380 - 10,686,380 - 10,686,380
Investments held-to-maturity 594,971 - 594,971 - 594,971
Insurance and reinsurance receivable 1,343,666 - 1,343,666 - 1,343,666
Other financial assets 422,749 - 422,749 - 422,749
Financial assets are graded according to the current credit ratings which have been issued by an
internationally regarded agency. The highest possible rating is AAA. Investment grade financial
assets have ratings from AAA to BBB. Financial assets which have ratings lower than BBB are
classified as speculative grade.
The following table details the credit ratings of financial assets held by the Company:
31 December 2011
<AAA <BBB Not
rated
Total
Cash and cash equivalents - 625,987 4,854 630,841
Due from banks - 1,198,207 - 1,198,207
Insurance and reinsurance receivable - 91,308 2,904,789 2,996,097
Investments available-for-sale - 12,174,630 1,702,614 13,877,244
Investments held-to-maturity - 301,539 609,330 910,869
Loans under reverse repurchase agreements - 750,069 750,069
Other financial assets - - 323,594 323,594

43
31 December 2010
<AAA <BBB Not
rated
Total
Cash and cash equivalents - 1,827,218 44,438 1,871,656
Due from banks - 2,551,786 - 2,551,786
Insurance and reinsurance receivable - 15,120 1,328,546 1,343,666
Investments available-for-sale - 8,800,732 1,885,648 10,686,380
Investments held-to-maturity - 594,971 - 594,971
Other financial assets - 2,451 420,298 422,749
The credit risk exposure of the Company is mainly concentrated within the Republic of Kazakhstan. The
exposure is monitored on a regular basis to ensure that the limits and credit worthiness guidelines
established by the Company’s risk management policy are not breached.
The following table details the carrying value of assets that are impaired and the ageing of those that are
past due but not impaired:
Financial assets past due but not
Impaired
31 December 2011
Neither past
due nor
impaired
0-3
months
3-6
months
6 months
to 1 year
Greater
than one
year
Financial
assets that
have been
impaired
Total
Cash and cash equivalents 630,841 - - - - - 630,841
Due from banks 1,198,207 - - - - - 1,198,207
Insurance and reinsurance
receivable 2,996,097 - - - - - 2,996,097
Investments available-for-sale 13,877,244 - - - - - 13,877,244
Investments held-to-maturity 910,869 - - - - - 910,869
Loans under reverse repurchase
agreements 750,069 - - - - - 750,069
Other financial assets 317,747 - - - - 5,847 323,594
Financial assets past due but not
Impaired
31 December 2010
Neither past
due nor
impaired
0-3
months
3-6
months
6 months
to 1 year
Greater
than one
year
Financial
assets that
have been
impaired
Total
Cash and cash equivalents 1,871,655 - - - - - 1,871,655
Due from banks 2,551,786 - - - - - 2,551,786
Insurance and reinsurance
receivable 1,343,666 - - - - - 1,343,666
Investments available-for-sale 10,654,285 - - - - 32,095 10,686,380
Investments held-to-maturity 594,971 - - - - - 594,971
Other financial assets 422,151 - - - - 598 422,749
Liquidity risk
Liquidity risk is the risk that an entity will encounter difficulty in raising funds to meet cash
commitments associated with financial instruments. Liquidity risk may result from either inability to sell
financial assets quickly at their fair values; or counterparty failing on repayment of a contractual
obligation; or insurance liability falling due for payment earlier than expected; or inability to generate
cash inflows as anticipated.
The major liquidity risk confronting the Company is the daily calls on its available cash resources in
respect of claims arising from insurance contracts.

44
The Company manages liquidity through a Company liquidity risk policy which determines what
constitutes liquidity risk for the Company; specifies minimum proportion of funds to meet emergency
calls; setting up of contingency funding plans; specify the sources of funding and the events that would
trigger the plan; concentration of funding sources; reporting of liquidity risk exposures and breaches
to the monitoring authority; monitoring compliance with liquidity risk policy and review of liquidity risk
policy for pertinence and changing environment.
Up to
1 month
1 month to
3 months
3 months to
1 year
1 year to
5 years
Over
5 years
Maturity
undefined
31 December
2011
Total
FINANCIAL ASSETS:
Due from banks 104,367 - 311,751 749,119 - - 1,165,237
Investments available-for-sale - - 356,033 6,436,195 4,331,416 - 11,123,644
Investments held-to-
maturity 1,800 - - 756,585 152,484 - 910,869 Loans under reverse
repurchase agreements 750,069 - - - - - 750,069
Total interest bearing
financial assets 856,236 - 667,784 7,941,899 4,483,900 - 13,949,819
Cash and cash
equivalents 630,841 - - - - - 630,841
Due from banks - 32,970 - - - - 32,970 Investments available-
for-sale - - - - 1,951,423 802,177 2,753,600
Insurance and reinsurance receivable 314,169 43,063 924,127 1,714,737 - - 2,996,096
Other financial assets 323,594 - - - - - 323,594
Total financial assets 2,124,840 76,033 1,591,911 9,656,636 6,435,323 802,177 20,686,920
FINANCIAL
LIABILITIES:
Insurance and
reinsurance payable 605,756 7,335 636,956 1,460,247 - - 2,710,294 Other financial liabilities 231,918 - - - - - - 231,918
Total financial liabilities 837,674 7,335 636,956 1,460,247 - - 2,942,212
Liquidity gap 1,287,166 68,698 954,955 8,196,389 6,435,323
Interest sensitivity gap 856,236 - 667,784 7,941,899 4,483,900
Cumulative interest
sensitivity gap 856,236 856,236 1,524,020 9,465,919 13,949,819
Cumulative interest sensitivity gap as a
percentage of total
financial assets 4.14% 4.14% 7.37% 45.76% 67.43%

45
Up to
1 month
1 month to
3 months
3 months to
1 year
1 year to
5 years
Over
5 years
Maturity
undefined
31 December
2010
Total
FINANCIAL ASSETS:
Due from banks 23,190 - 2,519,377 - - - 2,542,567 Investments available-
for-sale 576,042 - 442,489 2,780,392 5,027,023 - 8,825,946
Investments held-to-maturity - - 295,979 146,738 152,254 - 594,971
Total interest bearing
financial assets 599,232 - 3,257,845 2,927,130 5,179,277 - 11,963,484
Cash and cash equivalents 1,871,656 - - - - - 1,871,656
Due from banks - - 9,219 - - - - 9,219
Investments available-for-sale - - - - 1,810,991 49,443 1,860,434
Insurance and
reinsurance receivable 310,773 91,088 928,551 13,254 - - 1,343,666 Other financial assets 422,749 - - - - - 422,749
Total financial assets 3,204,410 91,088 4,195,615 2,940,384 6,990,268 49,443 17,471,208
FINANCIAL
LIABILITIES: Insurance and
reinsurance payable 493,141 33,639 588,112 - - - 1,114,893
Other financial liabilities 264,238 - - - - - 264,238
Total financial liabilities 757,379 33,639 588,112 - - - 1,379,131
Liquidity gap 2,447,030 57,450 3,607,502 2,940,384 6,990,268
Interest sensitivity gap 599,231 - 3,257,845 2,927,130 5,179,277
Cumulative interest sensitivity gap 599,231 599,231 3,857,076 6,784,207 11,963,484
Cumulative interest
sensitivity gap as a
percentage of total
financial assets 3.43% 3.43% 22.08% 38.83% 68.48%
The Company does not include its insurance reserves in its liquidity and maturity analysis, including
amounts due from reinsurers classified as reinsurance assets, due to the realistic maturity of such
balances being undeterminable. In addition, the actual liabilities may vary from the amount reserved
and as such these amounts are not included in the above table.
Discounted liabilities presented in the tables above are the same as contractual undiscounted liabilities
due to their short-term nature.
Market risk
The Company takes on exposure to market risks which arise from open positions in interest rates and
assets and liabilities in foreign currencies, all of which are exposed to general and specific market
movements. The Company manages market risk through periodic estimation of potential losses that
could arise from adverse changes in market conditions and establishing and maintaining appropriate
stop-loss limits and margin.
Interest rate sensitivity
The following table details the Company’s sensitivity to a 3% increase and decrease in the interest rates
in 2011 and 2010, respectively. Management of the Company believes that given the current economic
conditions in Kazakhstan 3% increase is a realistic movement in the interest rates. This is the sensitivity
rate used when reporting interest rate risk internally to key management personnel and represents
management’s assessment of the possible change in interest rates. The sensitivity analysis includes only
outstanding financial assets and liabilities.

46
Impact on net profit based on asset values as at 31 December 2011 and 2010:
31 December
2011
31 December
2010
Interest rate
+3%
Interest rate
-3%
Interest rate
+3%
Interest rate
-3%
Financial assets:
Investments available-for-sale (133,186) 146,927 (106,049) 118,477
Net impact on net profit (133,186) 146,927 (106,049) 118,477
Currency risk
Currency risk is defined as the risk that the value of a financial instrument will fluctuate due to changes
in foreign exchange rates. The Company is exposed to the effects of fluctuations in the prevailing
foreign currency exchange rates on its financial position and cash flows.
The Company’s exposure to foreign currency exchange rate risk is presented in the table below:
KZT USD
USD 1 =
148.40 KZT
EUR
EUR 1 =
191.72 KZT
RUR
RUR 1 =
4.90 KZT
GBP
GBP 1 =
228.8 KZT
31 December
2011
Total
FINANCIAL ASSETS:
Cash and cash equivalents 566,233 54,004 3,258 7,322 24 630,841
Due from banks 1,186,745 11,462 - - - 1,198,207
Loans under reverse
repurchase agreements 750,069 - - -
-
750,069
Insurance and reinsurance
receivable 2,851,196 144,597 269 35
-
2,996,097
Investments available-for-sale 11,750,709 1,871,547 254,988 - - 13,877,244
Investments held-to-maturity 910,869 - - - - 910,869
Other financial assets 322,633 - 957 4 - 323,594
TOTAL FINANCIAL
ASSETS 18,338,454 2,081,610 259,472 7,361
24
20,686,921
FINANCIAL
LIABILITIES:
Insurance and reinsurance
payable 236,150 2,348,529 125,615 -
-
2,710,294
Other financial liabilities 231,918 - - - - 231,918
TOTAL FINANCIAL
LIABILITIES 468,067 2,348,529 125,615 -
-
2,942,212
OPEN BALANCE SHEET
POSITION 17,870,388 (266,919) 133,857 7,361
24

47
KZT USD
USD 1 =
147.57 KZT
EUR
EUR 1 =
196.88 KZT
RUR
RUR 1 =
4.83 KZT
31 December
2010
Total
FINANCIAL ASSETS:
Cash and cash equivalents 940,158 903,543 11,827 16,128 1,871,656
Due from banks 1,916,258 635,528 - - 2,551,786
Insurance and reinsurance
receivable 1,254,689 80,153 240 8,584 1,343,666
Investments available-for-sale 10,380,579 305,801 - - - 10,686,380
Investments held-to-maturity 594,971 - - - 594,971
Other financial assets 422,749 - - - 422,749
TOTAL FINANCIAL ASSETS 15,509,404 1,925,025 12,067 24,712 17,471,208
FINANCIAL LIABILITIES:
Insurance and reinsurance payable 391,793 649,430 73,670 - 1,114,893
Other financial liabilities 261,574 149 2,487 28 264,238
TOTAL FINANCIAL
LIABILITIES 653,367 649,579 76,157 28 1,379,131
OPEN BALANCE SHEET
POSITION 14,856,037 1,275,446 (64,090) 24,684
Currency risk sensitivity
The following tables detail the Company’s sensitivity to a 25% increase and decrease in the
KZT/ US Dollar and KZT/ Euro exchange rates as at 31 December 2011 and 2010, respectively.
Management of the Company believes that given the current economic conditions in the Republic of
Kazakhstan that a 25% decrease is a realistic movement in the US Dollar and Euro exchange rates
against KZT. This is the sensitivity rate used when reporting foreign currency risk internally to key
management personnel of the Company and represents management’s assessment of the possible
change in foreign currency exchange rates. The sensitivity analysis includes only outstanding foreign
currency denominated monetary items and adjusts their translation at the end of the year for a 25%
change in currency rates as at 31 December 2011 and 2010 respectively.
Impact on net profit and equity based on asset values as at 31 December 2011 and 2010:
As at 31 December 2011 As at 31 December 2010
KZT/USD
+25%
KZT/USD
-25%
KZT/USD
+25%
KZT/USD
-25%
Impact on net profit and equity (66,730) 66,730 318,861 (318,861)
As at 31 December 2011 As at 31 December 2010
KZT/EUR
+25%
KZT/ EUR
-25%
KZT/EUR
+25%
KZT/ EUR
-25%
Impact on net profit and equity 33,464 (33,464) (16,023) 16,023
Limitations of sensitivity analysis
The above tables demonstrate the effect of a change in a key assumption while other assumptions
remain unchanged. In reality, there is a correlation between the assumptions and other factors.
It should also be noted that these sensitivities are non-linear, and larger or smaller impacts should not
be interpolated or extrapolated from these results.

48
The sensitivity analyses do not take into consideration that the Company’s assets and liabilities are
actively managed. Additionally, the financial position of the Company may vary at the time that any
actual market movement occurs. For example, the Company’s financial risk management strategy
aims to manage the exposure to market fluctuations. As investment markets move past various trigger
levels, management actions could include selling investments, changing investment portfolio
allocation and taking other protective action. Consequently, the actual impact of a change in
the assumptions may not have any impact on the liabilities, whereas assets are held at market value in
the statement of financial position. In these circumstances, the different measurement bases for
liabilities and assets may lead to volatility in equity.
Other limitations in the above sensitivity analyses include the use of hypothetical market movements
to demonstrate potential risk that only represent the Company’s view of possible near-term market
changes that cannot be predicted with any certainty; and the assumption that all interest rates move in
an identical fashion.
Price risk
Price risk is the risk that the value of a financial instrument will fluctuate as a result of changes in
market prices whether those changes are caused by factors specific to the individual security or its
issuer or factors affecting all securities traded in the market. The Company is exposed to price risks
of its products which are subject to general and specific market fluctuations.
Impact on equity based on asset values as at 31 December 2011 and 2010:
31 December
2011
31 December
2010
Price
+3%
Price
-3%
Price
+3%
Price
-3%
Financial assets:
Investments available-for-sale 641,082 (122,524) 303,895 (198,111)
Net impact on equity 641,082 (122,524) 303,895 (198,111)
31. SUBSEQUENT EVENTS
Up to the date of issue of these financial statements Management have not identified any significant
subsequent events which require disclosure.