Subscribe Here for $140 Annually - ASA Appraisers · standard market multiples and discounted cash...
12
Complimentary Preview Subscribe Here for $140 Annually
Transcript of Subscribe Here for $140 Annually - ASA Appraisers · standard market multiples and discounted cash...

Complimentary Preview
Subscribe Here for $140 Annually

An “Enhanced Multiple” Corporate Valuation Model:Theory and Empirical Tests
Bradford Cornell, PhD, and Rajiv Gokhale, MBA
In this article, we develop an enhanced corporate valuation model based on the
implied cost of equity capital (ICC). We argue that the enhanced method extends the
standard market multiples and discounted cash flow (DCF) methods to corporate
valuation. Specifically, it incorporates positive aspects of the market comparables and
DCF methods while mitigating the shortcomings of both. Unlike the traditional market
comparables method, the enhanced method takes account of the full-term structure of
earnings forecasts. Unlike the DCF method, it does not require estimation of the cost of
equity capital. While other applications of the ICC, such as using it to estimate the cost
of equity capital, are reported in the literature, our approach differs in that we do not treat
the ICC as a discount rate, but rather as an enhanced multiple that allows estimation of
equity value for a company based on publicly available information on projections and
market prices for comparable companies and publicly available projections for the
company being valued. As such, it avoids the complexity and uncertainty associated
with estimating the cost of equity capital. In our empirical tests, we find the enhanced
multiple method to be more accurate than either of the two traditional methods.
Introduction
Traditionally appraisers have employed two funda-
mental approaches to corporate valuation: A market
approach based on comparables (often termed the
guideline public companies) and valuation ratios and
the discounted cash flow (DCF) method. In this article we
develop an “enhanced multiple” valuation model that
uses the implied cost of capital, or ICC, to combine
elements of both of the traditional approaches. We then
discuss reasons why this enhanced multiple method is
likely to be more accurate than are either of the two
standard methods. Finally, we conduct empirical tests
designed to test this conjecture.
Throughout the article, we assume that earnings and/or
cash flow forecasts (or equivalently expected future cash
flows) are given. While the outcome of a valuation
analysis is critically dependent upon the cash flow
forecasts, the development of those forecasts is generally
separate from the financial valuation analysis. For
example, forecasts are often based on analyst reports or
on management projections. Though we take these
forecasts as given, we do analyze how possible errors
or biases in the forecasts affect the operation of valuation
methods and note how the enhanced multiple method
ameliorates the impact of such errors and biases.
To set the stage for our analysis, recall briefly the steps
taken in the traditional market comparable and DCF
methods.1 The market comparable method begins with the
identification of publicly traded companies deemed to be
comparable to the appraisal target.2 Using the observed
market values of the comparable companies, valuation
ratios, such as price/earnings and earnings before interest,
taxes, depreciation, and amortization (EBITDA)/enterprise
value, are calculated for the comparables. When the data
are available, the ratios are typically based on both forecast
future earnings and last twelve months (LTM) of historical
earnings. Of the two measures, forecast future earnings are
typically preferred because they are forward looking and
they exclude the impact of idiosyncratic one-time events.
Bradford Cornell is a professor of financial economicsat the California Institute of Technology in Pasadena,California.
Rajiv Gokhale is with Compass Lexecon in Chicago,Illinois.
1Our description of the traditional methods is very brief because they are sowell known. More detailed discussions are available in any of the leadingvaluation texts, including those of Damodaran (2014), Holthausen andZmijewski (2014), and Pratt (2008).2The approach can also use recent acquisitions, but that raises the issue ofcontrol premiums. Here we focus on publicly traded comparables to avoiddistracting complications. However, the enhanced model can also beapplied to comparable acquisitions.
Business Valuation Review
Volume 35 N Number 2
’ 2016, American Society of Appraisers
Page 52 ’ 2016, American Society of Appraisers

The individual ratios for the comparable companies are
then aggregated, often simply by taking the average or
the median. Finally, the aggregated ratio is applied to the
target company to arrive at the value indicator.
Though straightforward, the standard multiple valuation
method has two deficiencies. First, it is based exclusively
on short-term earnings, either LTM or one-year forward
forecasts. As such, it does not take into account the full-
term structure of earnings forecasts, which in most cases
are available out to five years. Second, the analysis fails to
explicitly take account of the impact of discounting.
In comparison, the DCF method uses the entire term
structure of earnings forecasts. Those forecasts are used to
produce estimates of expected future cash flows up to
a terminal horizon determined by the availability of the
forecast data, which is most typically three to five years.
When the forecasting horizon is reached, additional
assumptions are made regarding more distant cash flows
in order to estimate the continuing value at the terminal
horizon. To compute the present value of the forecast
future cash flows and the continuing value a discount rate
is required. That discount rate is typically estimated by
applying an asset pricing model, such as the CAPM or the
Fama-French three-factor model, to data for the compa-
rable companies to build up an equity cost of capital. The
target company cost of equity is then estimated by
averaging (in some fashion) the estimates for the
comparable companies with an adjustment for leverage
if deemed necessary. Finally, if the entity being valued is
a company’s operating enterprise, as opposed to its equity,
the cost of equity is incorporated into a Weighted Average
Cost of Capital (“WACC”) that includes the observed cost
of debt. The WACC serves as the discount rate.
The most significant problem with the DCF method,
other than the forecasting of the future cash flows, is that
estimation of the cost of equity is controversial. It requires,
at a minimum, (1) determining what asset pricing model to
use; (2) choosing what risk factors to include; (3) selecting
a sample of companies; (4) selecting an estimation period;
(5) choosing the observation interval; and, separately, (6)
estimating the required risk premia.
In this article we propose and test empirically an
enhanced multiple valuation model based on application
of the ICC. We argue that the enhanced multiple method
incorporates positive aspects of the market comparables
and DCF methods while mitigating the shortcomings of
both. Unlike the traditional market comparables method,
the enhanced multiple method takes account of the full-
term structure of earnings forecasts. It does so by using
the ICC calculated for the comparable companies as an
“enhanced multiple,” which acts as a discount rate to
translate cash flow forecasts into a value estimate. As
such, it avoids the complexity and uncertainty associated
with estimating the cost of equity capital. Seen in this
light, although the ICC acts like a discount rate, it need
not be equal to the cost of equity capital. In our view, it is
more appropriate to think of the ICC as an enhanced
multiple that converts the entire future stream of cash
flow forecasts, not just one year, into an estimate of value.
The reason for this interpretation is easier to appreciate
once the model has been developed.
Toward an Enhanced Multiple Valuation Model
The enhanced procedure that we suggest begins, like the
market multiples method, with identification of publicly
traded companies deemed comparable to the valuation
target. In this instance, we use companies within the same
SIC code (as discussed later) as comparables. Instead of
computing valuation ratios, however, the enhanced pro-
cedure starts with estimates of the ICC for the comparable
companies. Next, whereas the market multiple method
applies the average or median valuation multiple to the target
company to estimate its value, the enhanced approach uses
the average or median ICC as a discount rate, wherein the
value of a subject firm is estimated as the present value of
projected cash flows discounted using the ICC calculated
from the comparable companies.3
Because the target’s ICC is derived from the
comparable companies, the quality of the enhanced
multiple method, like that of the standard multiples
method, depends on the comparability of firms used to
estimate the ICC. Unlike valuations based on standard
ratios, however, the enhanced multiple method takes
account of the full-term structure of earnings forecasts
(that is, all of the forecasts out to the terminal horizon and
the continuing value) as well as the impact of discounting.
In this sense, the enhanced multiple method is similar to
the DCF method. Unlike the traditional DCF method,
though, there is no need to build up the cost of equity
using an asset pricing model. The ICCs are calculated
directly from the comparable companies.
As noted previously, one way to interpret the enhanced
multiple method is as simply a DCF method using the
ICC from the comparables as the cost of equity. But the
approach is more general than that. The ICC is better
interpreted as defining a mapping from projected cash
flows to value. Assuming that the comparable companies
are in fact sufficiently comparable, the mapping works
just like a valuation ratio (such as price to earnings ratio
3See, for example, Gebhardt, Lee, and Swaminathan (2001), who apply theOlson model based on excess earnings to compute the ICC. The choice ofmodel is largely irrelevant as long as the same model is applied to thecomparables and the target company.
An “Enhanced Multiple” Corporate Valuation Model: Theory and Empirical Tests
Business Valuation Review — Summer 2016 Page 53

[P/E]) works in standard multiple methods. What sets the
enhanced multiple method apart is that it maps the entire
term structure of forecasts, and not just one year, into value.
The interpretation of the ICC as enhanced multiple
becomes important when the possibility of bias and errors
in the forecasts are introduced. In this regard, there is a body of
work in the accounting literature that warns against using the
ICC to estimate the cost of equity capital because of biases in
the inputs. Most prominently, if the ICC calculation is based
on upward-biased (downward-biased) analyst earnings fore-
casts then it will overstate (understate) the cost of equity
capital. For example, an empirical study by Easton and
Sommers (2007) finds that the ICC is indeed an upward-
biased estimate of expected returns when it is calculated using
analyst forecasts as inputs.
The critical point to recognize is that using the ICC to
estimate the cost of capital is not the same thing as using
it as an enhanced multiple to map cash flow forecasts to
value. Surprisingly, when there are biases in forecasts, the
enhanced multiple method based on the ICC will
generally produce a more accurate value indicator even
though the ICC is a biased measure of the true cost of
equity. The best way to illustrate why this is so is to use
a simple example. Suppose, as Easton and Sommers
(2007) find, that analyst forecasts are optimistic and that
as a result the ICC overstates the cost of equity capital.
This will not produce valuation errors when applying the
enhanced approach as long as the bias is consistent across
companies. As a result of the bias, the ICC for the target
company calculated from the comparable company ICCs
will overstate the true cost of equity capital, but the
forecast earnings for the valuation target will be biased
upward as well. If the bias in the forecasts is the same for
the comparable companies and the target, the two effects
will cancel each other out. Put another way, the target
ICC overstates the cost of capital by precisely the right
amount to offset the upward bias in the target company’s
forecast earnings. As a result, the estimate of value is
more accurate than either the estimate of the cost of
capital or the forecasts of future earnings.
This result holds not only for bias in earnings forecasts
but also for other potential errors in other valuation inputs
as well. For instance, suppose that an appraiser consistently
underestimates long-term growth when calculating the
terminal value.4 The result will be a downward bias in the
appraiser’s estimates of the ICCs for the comparable
companies and, thereby, in the cost of equity for the target.
However, there will be an offsetting downward bias in the
target company’s terminal value.
Notice that in the foregoing examples, if a more accurate
estimate of the cost of equity capital had been used in place
of the ICC, the resulting valuation would have been worse
because there would be no offset to the bias in the forecasts.
To be fair, it should be noted that this self-canceling feature
is not unique to the ICC method. It also holds for
comparable company appraisals based on standard valu-
ation ratios. However, the traditional multiples method
suffers from the deficiencies discussed earlier.
The bottom line is that the accuracy of the enhanced
approach does not depend on the ICC being a better
estimate of the cost of capital than that provided by an
asset pricing model. If there are errors or biases in the
forecasts, the self-canceling aspect of the enhanced
multiple method can produce value estimates that are
more accurate than those produced by applying the DCF
method. The extent to which this occurs in the real world
is, of course, an empirical question to which we next turn.
Before that, there is one more related benefit of the
enhanced multiple method that is worth noting. As
Damodaran (2014) observes, when the cost of capital for
the comparable companies is built up using an asset pricing
model it introduces an inconsistency, because unless the
estimated cost of equity for the comparables equals their
ICCs, applying the DCF method to the comparables will
yield estimated values that differ from their observed market
prices in contradiction to the fair market value standard.
The enhanced multiple method avoids this inconsistency
because by definition the estimated value equals the market
price as long as the procedure used to discount the target
cash flows is the same as the one used to estimate the ICC.
Initial Empirical Tests of the EnhancedMultiple Method
To operationalize and test the enhanced multiple
method, the 1st step is choosing a procedure for calculating
the ICC. Here we follow the approach taken by Gebhardt,
Lee, and Swaminathan (2001) because it is apparently the
most widely adopted.5 As noted above, as long as the ICC
is estimated consistently for both the comparable compa-
nies and the valuation target, the results are not likely to be
sensitive to the precise calculation procedure.6
4This would be akin to underestimating the long-run ROE in the model weuse to estimate ICC. See Equation 1 below.
5In their annual yearbooks, Ibbotson and Duff & Phelps report estimates ofthe equity cost of capital estimated based on a three-stage DCF model. Thisis another way of using the ICC to estimate the cost of equity. Thedifference here is that we do not use the ICC as an equity discount rate butrather as an enhanced multiple. While the enhanced multiple can beinterpreted to be an equity discount rate, such an interpretation is notnecessary for our analysis.6We reiterate that if the ICC is interpreted as a discount rate, rather than asan enhanced multiple, then the method by which is calculated is likely to bemore critical.
Business Valuation Review
Page 54 ’ 2016, American Society of Appraisers

Gebhardt, Lee, and Swaminathan use a standard
residual income model (“RIM,” a version of the DCF
model) to estimate the ICC. More specifically, using
Equation 1 below (reproduced from equations 5 and 6
from Gebhardt, Lee, and Swaminathan), the authors
define the ICC as the discount rate that equates the
observed equity value of the firm with the present value
from the residual income model:
Pt~BtzFROEtz1zre
(1zre)Btz
FROEtz2zre
1zreð Þ2
|Btz1zTV ð1Þ
TV~XT{1
i~3
FROEtz1{re
1zreð ÞiBtzi{1z
FROEtzT {re
re 1zreð ÞT{1
|BtzT{1
where Bt 5 book value from the most recent financial
statement; re 5 the cost of equity; FROEt+i 5 the
forecasted return on equity (ROE) for period t+I; Bt+i 5
the forecasted dividend per share for year t+I; and TV 5
terminal value.
We employ the above formula in a manner similar to
how it is employed by Gebhardt, Lee, and Swaminathan
(with a few modifications) as follows:
N We use a three-stage model. The 1st stage covers the
1st five years of the projection, the 2nd stage covers
years 6 through 15, and the 3rd stage covers the
terminal years.
N We estimate the ROE for each company for the 1st
five years based on the projected EPS for each
company. We use the consensus analyst EPS
projections (which often go out two to three years)
as reported S&P CapitalIQ where available; other-
wise, we estimate forward EPS as equal to the most
recent EPS grown using analyst forecasts for the
long-term EPS growth for that company. We then
estimate the ROE for the 1st five years of the
projection as equal to the projected EPS divided by
projected BV, which we calculate using the starting
BV, projected EPS, and projected dividend payout
ratio (see below). Next, we assume that the long-run
ROE used in calculating the terminal value is equal
to the median industry ROE over the five years
preceding the date of analysis, wherein we define
industry as firms within the same four-digit SIC
code. When estimating the long-run ROE, we only
use firms that have positive ROE in the five years
preceding the calculation date and four-digit SIC
codes with at least five firms in the subset. We use
the four SIC codes assigned to each firm as reported
by the Center for Research in Security Prices
(CRSP) at the University of Chicago’s Booth School
of Business immediately prior to each calculation
date. In this exercise, we then control for outliers by
deleting observations when the estimated ROE in
the 1st five years of the projection is greater than
100%.
N Finally, we estimate the ROE for years 6 to 15 for
each firm by linearly interpolating between the ROE
in year 5 and the estimated long-run industry ROE.
N Similarly, we assume that the future annual dividend
payout ratio for each firm as of each valuation date
equals the median industry payout ratio over the five
years preceding the date of analysis, based on
dividend payout ratios of firms with at least three
years of data preceding the valuation date. We delete
observations wherein the historical estimated in-
dustry-average dividend payout ratio is negative,
and if the estimated payout ratio is greater than
100%, we reset it to 100% (although this happens
very rarely in our sample).
Gebhardt, Lee, and Swaminathan do not adjust their
equations for the potential effect of leverage. Although
theory implies that the cost of equity depends on the
extent of leverage, making a leverage adjustment requires
application of an asset pricing model, which reintroduces
the joint problems of choosing the asset pricing model
and precise leveraging formula to apply. Furthermore,
work by Levi and Welch (2014) suggests that leverage
adjustments do little to increase the accuracy of cost of
equity estimates. In light of this conundrum, we too
ignore the effects of leverage.
Recall that we build cash flow forecasts from industry
analyst projections and historical information, and for the
purposes of our exercise these cash flow forecasts are
taken as given. As a result, for the enhanced approach to
produce different valuation estimates than the DCF
model, it must be the case that the ICCs differ
systematically from standard estimates of the costs of
equity capital. As a 1st step, therefore, we examine
whether there are systematic differences between the
ICCs that we calculate and estimates of the cost of equity
derived from the CAPM.
Unfortunately, there is no “standard” CAPM procedure
for estimating the cost of equity. It depends on factors
such as the choice of the risk-free rate, the Beta
estimation procedure, the estimation of the market risk
premium, and the decision of whether to add an
adjustment such as a size premium. In light of this
An “Enhanced Multiple” Corporate Valuation Model: Theory and Empirical Tests
Business Valuation Review — Summer 2016 Page 55
problem, we use what in our experience has been the
most widely adopted procedure in appraisal practice.
Specifically, we use the yield on the twenty-year US
Treasury bond as the risk-free rate, a Beta estimated using
an OLS regression based on five years of monthly data,
and the supply-side equity risk premium (ERP) reported
in the most recent Ibbotson or Duff & Phelps yearbook7
available as of the estimation date. As noted by Pratt and
Grabowski (2014), valuation results can be significantly
influenced if different methods and different risk premia
are used to estimate the cost of equity.
Next, we turn to direct comparisons of the three
valuation methods: standard market multiples method,
DCF method, and the enhanced multiple method. What
makes comparative tests difficult to implement is that the
results depend on how each method is implemented. To
avoid the appearance of cherry picking, we use the well-
known article by Kaplan and Ruback (1995) as a
blueprint and attempt to make our implementations of
the market comparables and DCF techniques as “vanilla”
as possible. We implement the enhanced approach using
the method of Gebhardt, Lee, and Swaminathan de-
scribed above.
Description of the Sample
For our empirical study, we use data for the years from
2007 through 2014. The calculations on which we base
our tests are done as of September 30 for each year.
Included in the sample are all NYSE/AMEX/NASDAQ-
listed securities in CRSP. For each company in our
sample, as of the date of the calculations, we obtained
from CRSP the permno, permco, CUSIP, ticker, company
name, size decile assignment, and SIC code. Starting with
this sample, we then obtain from S&P Capital IQ the
market capitalization, shares outstanding, weighted aver-
age shares outstanding, share price, dividends per share,
book value per share, total book value, total debt, EPS for
the preceding five years, projected EPS, estimated long-
term EPS growth rate, and equity Beta.
We merge the two data sets by CUSIP and delete the
following observations, which appear to either outliers or
errors:
N Those with equity Betas greater than 100 or less
than zero, and
N Those with LTM and Forward P/E ratios greater
than 300.
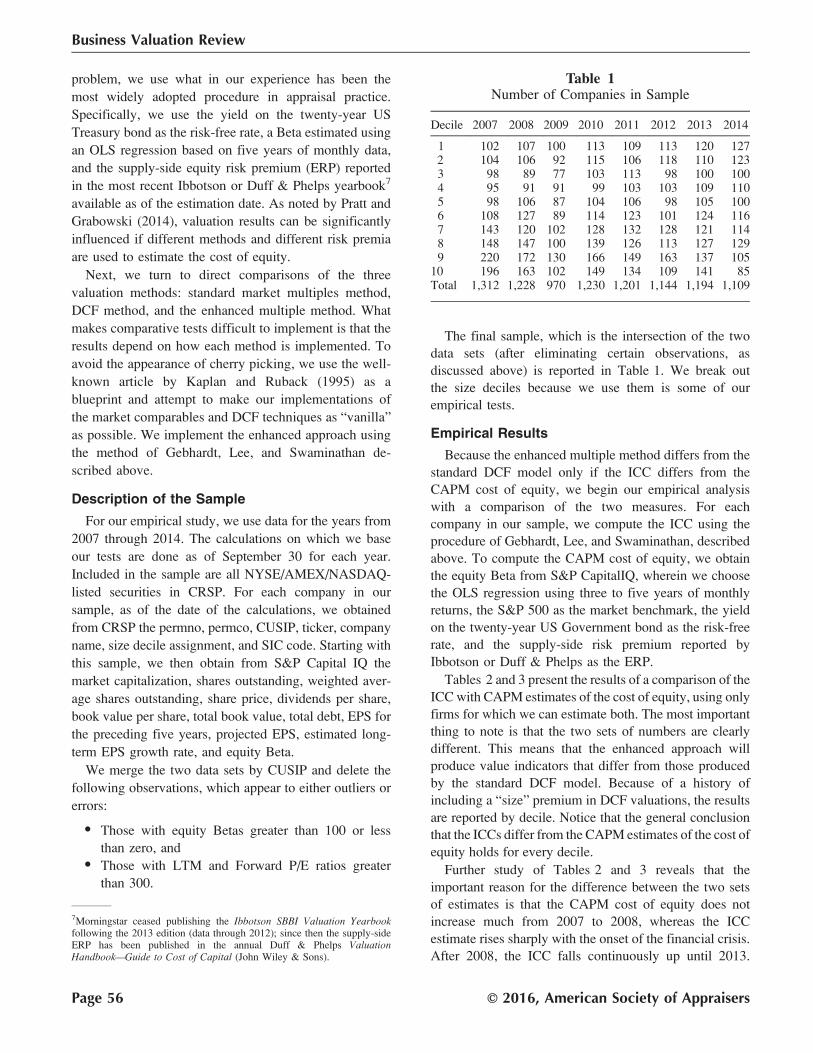
The final sample, which is the intersection of the two
data sets (after eliminating certain observations, as
discussed above) is reported in Table 1. We break out
the size deciles because we use them is some of our
empirical tests.
Empirical Results
Because the enhanced multiple method differs from the
standard DCF model only if the ICC differs from the
CAPM cost of equity, we begin our empirical analysis
with a comparison of the two measures. For each
company in our sample, we compute the ICC using the
procedure of Gebhardt, Lee, and Swaminathan, described
above. To compute the CAPM cost of equity, we obtain
the equity Beta from S&P CapitalIQ, wherein we choose
the OLS regression using three to five years of monthly
returns, the S&P 500 as the market benchmark, the yield
on the twenty-year US Government bond as the risk-free
rate, and the supply-side risk premium reported by
Ibbotson or Duff & Phelps as the ERP.
Tables 2 and 3 present the results of a comparison of the
ICC with CAPM estimates of the cost of equity, using only
firms for which we can estimate both. The most important
thing to note is that the two sets of numbers are clearly
different. This means that the enhanced approach will
produce value indicators that differ from those produced
by the standard DCF model. Because of a history of
including a “size” premium in DCF valuations, the results
are reported by decile. Notice that the general conclusion
that the ICCs differ from the CAPM estimates of the cost of
equity holds for every decile.
Further study of Tables 2 and 3 reveals that the
important reason for the difference between the two sets
of estimates is that the CAPM cost of equity does not
increase much from 2007 to 2008, whereas the ICC
estimate rises sharply with the onset of the financial crisis.
After 2008, the ICC falls continuously up until 2013.
7Morningstar ceased publishing the Ibbotson SBBI Valuation Yearbookfollowing the 2013 edition (data through 2012); since then the supply-sideERP has been published in the annual Duff & Phelps ValuationHandbook—Guide to Cost of Capital (John Wiley & Sons).
Table 1Number of Companies in Sample
Decile 2007 2008 2009 2010 2011 2012 2013 2014
1 102 107 100 113 109 113 120 1272 104 106 92 115 106 118 110 1233 98 89 77 103 113 98 100 1004 95 91 91 99 103 103 109 1105 98 106 87 104 106 98 105 1006 108 127 89 114 123 101 124 1167 143 120 102 128 132 128 121 1148 148 147 100 139 126 113 127 1299 220 172 130 166 149 163 137 105
10 196 163 102 149 134 109 141 85Total 1,312 1,228 970 1,230 1,201 1,144 1,194 1,109
Business Valuation Review
Page 56 ’ 2016, American Society of Appraisers

While the CAPM cost of equity also declines, the amount
of decline is small compared to the drop in the ICC. The
decline in the CAPM estimate is due almost entirely to the
drop in the twenty-year Treasury bond rate over that time
period. The difference between the two sets of estimates
points to a potential problem with the CAPM cost of
equity. Overall, the average CAPM cost of equity can drop
only if the equity Beta, risk-free rate, or the equity risk
premium falls. However, when historical data are used to
estimate the equity risk premium it is effectively pinned
down and can change only by small amounts from year to
year. If, in fact, the true but unobservable market risk
premium changes, the CAPM estimation using an
historical market risk premium will not pick up the change.
The ICC, on the other hand, being a forward-looking
measure calculated from market prices, will immediately
reflect any change in the risk premium. As a result, if
changes in risk premiums are an important element of the
movement in market prices, as may well have been the case
during and following the 2008/2009 financial crisis, then
the enhanced multiple valuation model is likely to produce
more accurate value indicators than does a traditional DCF
model that relies on historical return data to estimate the
discount rate.8
To test the foregoing conjecture, and more generally to
compare the enhanced multiple model with the standard
DCF and market multiples methods, we begin by
estimating the firm equity values for all the companies
in our sample using the enhanced multiple method based
on the ICC, the standard multiple method based on P/E
ratios, and the DCF model using the CAPM cost of equity.
Equity value estimates based on the ICC
For all companies in our sample for which we can
estimate ICC, we do so using Equation 1. At each annual
calculation date of September 30, we start with the most
recent consensus estimates for EPS and the long-term
EPS growth forecasts by industry analysts for each firm to
develop projections for the 1st five years of the projection
period. We use each company’s median dividend payout
ratio (after eliminating dividend payout ratios less than
zero and greater than 100%) over the previous three to
five years (depending on the availability of data) to
estimate dividend payouts for the 1st five years of the
projection period. We estimate the book value at the end
of each year for the 1st five years of the projection period
using the starting book value (i.e., as of each date of
analysis) and the EPS projection and dividend payout
ratio. From year 6 to 15 of the projection period, we
linearly interpolate between the ROE at the end of year 5
and the long-run industry ROE, which we estimate as
equal to the median ROE for the industry over the five
years preceding the date of analysis (wherein we use
firms in the same four-digit SIC code and with at least
three years of data).
Having calculated the ICCs for each firm in our
sample, we proceed as follows. For each four-digit SIC
code, we pick one company as the target and the others as
the comparables. We use the median ICC of the
comparables to value the target by applying the ICC
calculated for the comparable companies. This is our
enhanced estimate of value for the target. We then repeat
the analysis using the next firm in the same four-digit SIC
classification as the target. We continue in this fashion
until all of the firms in that SIC classification have been
used as the target. The same calculations are done for all
four-digit SIC classifications.
Equity value estimates based on P/E ratios
For all companies in our sample for which the
necessary data are available, we use the analyst consensus
8For a further discussion of this issue, see, for example, Pratt and Grabowski(2014) chapters 7 and 8.
Table 2Median ICC Estimates (%)
Decile 2007 2008 2009 2010 2011 2012 2013 2014
1 9.45 11.02 10.44 9.66 9.66 9.28 8.17 8.412 8.37 10.85 9.86 9.05 9.43 8.79 7.59 7.563 8.13 10.36 9.41 8.79 8.56 8.48 7.79 7.654 8.21 10.29 9.63 9.18 8.52 8.89 7.46 7.575 8.53 10.30 9.35 8.73 9.34 8.61 8.40 7.716 8.70 10.06 9.69 8.70 9.29 8.40 7.57 7.367 8.40 10.51 9.38 9.15 8.89 8.58 7.43 7.658 9.01 10.16 9.45 8.92 9.69 8.73 7.72 8.369 8.95 10.15 9.96 9.48 9.34 9.61 8.22 8.17
10 9.59 12.52 10.73 10.80 10.40 9.83 7.95 8.78
Table 3Median CAPM Estimates (%)
Decile 2007 2008 2009 2010 2011 2012 2013 2014
1 10.61 10.56 9.78 8.66 8.74 8.53 9.74 9.412 11.05 11.63 10.22 9.17 9.40 8.74 9.67 9.313 10.87 11.16 10.35 8.91 9.64 9.13 9.76 9.474 11.29 11.90 9.58 8.87 9.38 9.82 9.96 9.845 11.46 11.96 10.31 9.97 9.65 9.22 11.69 10.606 11.71 11.57 9.88 9.02 10.33 9.75 10.33 10.297 11.95 12.26 10.15 9.30 9.40 9.56 10.43 11.558 14.05 12.42 10.40 9.27 10.99 10.13 10.80 10.099 12.58 11.79 11.41 9.48 9.84 10.00 11.28 10.67
10 11.13 11.93 10.40 9.54 10.44 9.04 10.13 10.39
Note: Only observations with both CAPM and ICC estimatesare used in the table above.
An “Enhanced Multiple” Corporate Valuation Model: Theory and Empirical Tests
Business Valuation Review — Summer 2016 Page 57
one-year forward EPS forecasts and the market price as of
September 30 to calculate the forward P/E ratio. We then
proceed precisely as we did for the ICC value calcula-
tions. That is, for each four-digit SIC classification, we
pick a target company and use the remaining companies
as comparables. We calculate the median forward P/E
ratio for the comparables and use it to value the target.
We repeat the calculation for every firm in each four-digit
classification.
Equity value estimates based on a DCF model
using the CAPM cost of equity
For all companies in our sample for which the
necessary data are available, we use the CAPM estimates
cost of equity reported previously. Using the CAPM
discount rate, we then calculate the equity value for each
firm using Equation 1 so as to be directly comparable to
the ICC-based valuations. The DCF value indicator is
simply the present value of the terms in Equation 1
discounted at the cost of equity.
To assess the accuracy of the three competing
measures, we begin by calculating the log of the ratio
of the estimated value to the actual value for each firm as
of the observation date of September 30 for each year
from 2007 to 2014.9 The log ratio is symmetric (i.e.,
agnostic as to whether the methodology over- or under-
estimates the value) and can be interpreted as the
estimation error (presented in percentage).
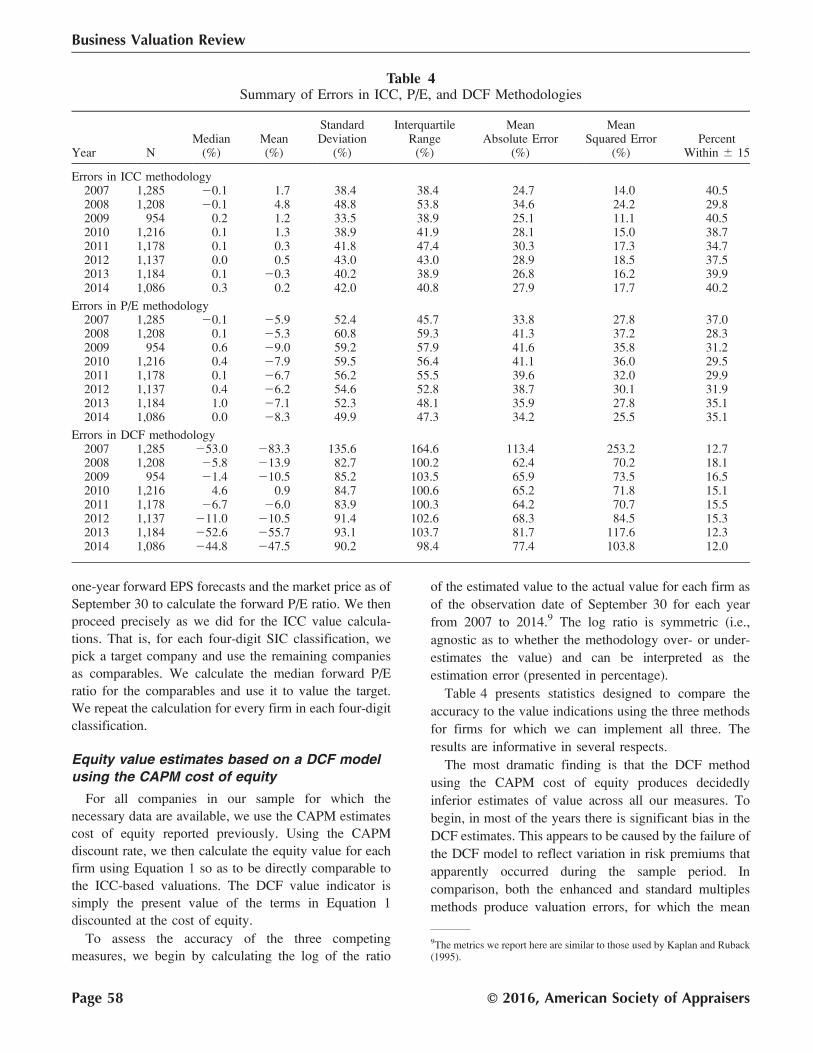
Table 4 presents statistics designed to compare the
accuracy to the value indications using the three methods
for firms for which we can implement all three. The
results are informative in several respects.
The most dramatic finding is that the DCF method
using the CAPM cost of equity produces decidedly
inferior estimates of value across all our measures. To
begin, in most of the years there is significant bias in the
DCF estimates. This appears to be caused by the failure of
the DCF model to reflect variation in risk premiums that
apparently occurred during the sample period. In
comparison, both the enhanced and standard multiples
methods produce valuation errors, for which the mean
9The metrics we report here are similar to those used by Kaplan and Ruback(1995).
Table 4Summary of Errors in ICC, P/E, and DCF Methodologies
Year NMedian
(%)Mean(%)
StandardDeviation
(%)
InterquartileRange
(%)
MeanAbsolute Error
(%)
MeanSquared Error
(%)Percent
Within 6 15
Errors in ICC methodology2007 1,285 20.1 1.7 38.4 38.4 24.7 14.0 40.52008 1,208 20.1 4.8 48.8 53.8 34.6 24.2 29.82009 954 0.2 1.2 33.5 38.9 25.1 11.1 40.52010 1,216 0.1 1.3 38.9 41.9 28.1 15.0 38.72011 1,178 0.1 0.3 41.8 47.4 30.3 17.3 34.72012 1,137 0.0 0.5 43.0 43.0 28.9 18.5 37.52013 1,184 0.1 20.3 40.2 38.9 26.8 16.2 39.92014 1,086 0.3 0.2 42.0 40.8 27.9 17.7 40.2
Errors in P/E methodology2007 1,285 20.1 25.9 52.4 45.7 33.8 27.8 37.02008 1,208 0.1 25.3 60.8 59.3 41.3 37.2 28.32009 954 0.6 29.0 59.2 57.9 41.6 35.8 31.22010 1,216 0.4 27.9 59.5 56.4 41.1 36.0 29.52011 1,178 0.1 26.7 56.2 55.5 39.6 32.0 29.92012 1,137 0.4 26.2 54.6 52.8 38.7 30.1 31.92013 1,184 1.0 27.1 52.3 48.1 35.9 27.8 35.12014 1,086 0.0 28.3 49.9 47.3 34.2 25.5 35.1
Errors in DCF methodology2007 1,285 253.0 283.3 135.6 164.6 113.4 253.2 12.72008 1,208 25.8 213.9 82.7 100.2 62.4 70.2 18.12009 954 21.4 210.5 85.2 103.5 65.9 73.5 16.52010 1,216 4.6 0.9 84.7 100.6 65.2 71.8 15.12011 1,178 26.7 26.0 83.9 100.3 64.2 70.7 15.52012 1,137 211.0 210.5 91.4 102.6 68.3 84.5 15.32013 1,184 252.6 255.7 93.1 103.7 81.7 117.6 12.32014 1,086 244.8 247.5 90.2 98.4 77.4 103.8 12.0
Business Valuation Review
Page 58 ’ 2016, American Society of Appraisers
and median values are close to zero. The valuation errors
for the enhanced multiple method in particular are tightly
clustered around zero. We note, however, that average
valuation errors clustering around zero is not necessarily
indicative of a superior approach if the method also yields
large errors in either direction.
To address the foregoing concern, Table 4 also reports
measures of central tendency: the standard deviation, the
interquartile range, the mean absolute error, the mean
square error, and the percentage of estimates with 15% of
the observed value. Because all of these measures reflect
the same underlying phenomenon they tend to be highly
correlated.
According to every measure of central tendency, the DCF
method does markedly worse than the other two. The
standard deviations of the forecast errors are uniformly
larger, as are the mean absolute errors and the mean squared
errors. Furthermore, the interquartile range is much greater
and the value estimates within 15% are much smaller.
As noted previously, the failure of the DCF method is
likely less the fault of the model and more likely due to
how it was implemented. Had the DCF model relied on
an equity risk premium computed using forward-looking
data, it likely would better reflect changes in the risk
premium that characterized this period and would,
therefore, produce more accurate valuation estimates.
This is further evidence of the point stressed by Cochrane
(2011) in his Presidential Address to the American
Finance Association that equity market risk premia
should not be treated as constant.
Moving on to a comparison of the enhanced and
standard multiples methods, the differences are smaller.
The mean and median errors are closer to zero for the
enhanced approach, but not by a large margin, as was the
case for the DCF. The measures of central tendency are
also similar, but the enhanced approach does perform
slightly better on most of them.
The bottom line is that the results confirm our
conjecture that the enhanced approach is a valuable
addition to an appraiser’s toolkit. In our empirical tests
it dramatically outperforms the DCF method and is
slightly superior to the standard multiples method.
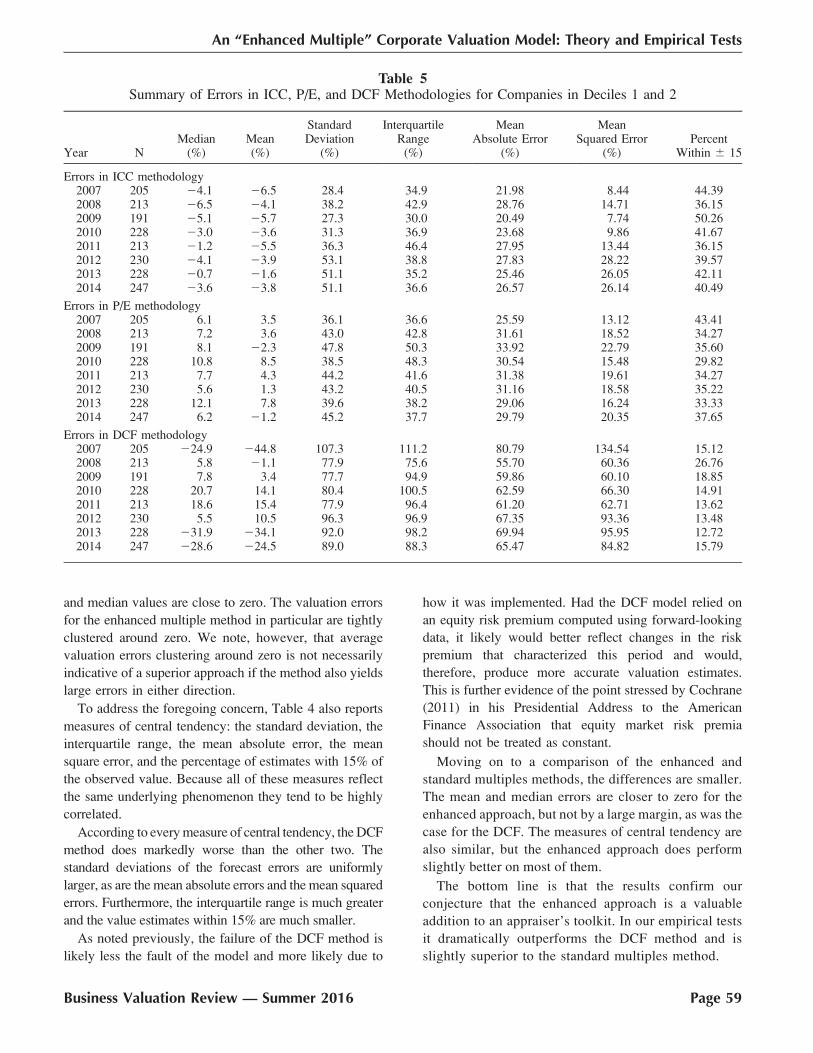
Table 5Summary of Errors in ICC, P/E, and DCF Methodologies for Companies in Deciles 1 and 2
Year NMedian
(%)Mean(%)
StandardDeviation
(%)
InterquartileRange
(%)
MeanAbsolute Error
(%)
MeanSquared Error
(%)Percent
Within 6 15
Errors in ICC methodology2007 205 24.1 26.5 28.4 34.9 21.98 8.44 44.392008 213 26.5 24.1 38.2 42.9 28.76 14.71 36.152009 191 25.1 25.7 27.3 30.0 20.49 7.74 50.262010 228 23.0 23.6 31.3 36.9 23.68 9.86 41.672011 213 21.2 25.5 36.3 46.4 27.95 13.44 36.152012 230 24.1 23.9 53.1 38.8 27.83 28.22 39.572013 228 20.7 21.6 51.1 35.2 25.46 26.05 42.112014 247 23.6 23.8 51.1 36.6 26.57 26.14 40.49
Errors in P/E methodology2007 205 6.1 3.5 36.1 36.6 25.59 13.12 43.412008 213 7.2 3.6 43.0 42.8 31.61 18.52 34.272009 191 8.1 22.3 47.8 50.3 33.92 22.79 35.602010 228 10.8 8.5 38.5 48.3 30.54 15.48 29.822011 213 7.7 4.3 44.2 41.6 31.38 19.61 34.272012 230 5.6 1.3 43.2 40.5 31.16 18.58 35.222013 228 12.1 7.8 39.6 38.2 29.06 16.24 33.332014 247 6.2 21.2 45.2 37.7 29.79 20.35 37.65
Errors in DCF methodology2007 205 224.9 244.8 107.3 111.2 80.79 134.54 15.122008 213 5.8 21.1 77.9 75.6 55.70 60.36 26.762009 191 7.8 3.4 77.7 94.9 59.86 60.10 18.852010 228 20.7 14.1 80.4 100.5 62.59 66.30 14.912011 213 18.6 15.4 77.9 96.4 61.20 62.71 13.622012 230 5.5 10.5 96.3 96.9 67.35 93.36 13.482013 228 231.9 234.1 92.0 98.2 69.94 95.95 12.722014 247 228.6 224.5 89.0 88.3 65.47 84.82 15.79
An “Enhanced Multiple” Corporate Valuation Model: Theory and Empirical Tests
Business Valuation Review — Summer 2016 Page 59

As a final check on the results we performed one added
set of tests. It is possible that the aggregate results reported
in Table 4 are driven by smaller firms. This is a potential
problem, because our tests rely on analyst forecasts,
and far fewer analysts follow such companies. In addition,
many small firms have negative predicted earnings,
which makes the estimation of the ICC more sensitive
to variation in the forecasts. Finally, SIC classification
may be less appropriate as a means of assessing com-
parability for such firms. For all these reasons, we repeat
our calculations using only those companies in deciles
1 and 2.
The results for the sample restricted to larger firms are
reported in Table 5. The table shows that once again both
the enhanced multiple method and the standard multiples
model dramatically outperform the DCF method. The
problems discussed previously that bedevil the DCF
model continue to be an issue when the sample is limited
to large firms.
When the enhanced multiple method and the compa-
rable company multiples method are compared for large
firms, the two turn out to be remarkably similar across all
of our measures. In some years and for some measures,
the enhanced approach comes out on top, while in other
years the multiples model is the winner. Overall, there is
no clear evidence that one model is superior to the other.
We find this surprising, because, as stressed earlier, the
standard multiples model uses only a one-year forecast,
whereas the enhanced approach takes account of the
entire stream of earnings forecasts. One possible
explanation for the similarity between the two methods
is that for larger firms with a long track record of earnings
the analyst projections can be approximated by extrap-
olating past growth. In that case, the full stream of
projected earnings may provide little information in
addition to that impounded in the multiple and next year’s
forecast. As a result, the enhanced approach adds little to
the standard multiples model.
Conclusions
Here we propose an enhanced multiple valuation model
that combines elements of the standard market multiple
method and the DCF method. The model uses the ICC
calculated for a sample of comparable companies as an
“enhanced” multiple, which relates the value of a company
to the entire forecast stream of future cash flows. This
extends the standard multiples analysis, which is based on
only one year of financial performance. Unlike the DCF
method, which also uses the full sequence of cash flow
forecasts, the enhanced multiple method does not require
estimation of the cost of equity capital—a difficult and
often controversial undertaking. Instead, the cost of equity
capital is replaced by the enhanced multiple, derived from
the comparable companies, which relates cash flow
forecasts to value.
Our empirical tests reveal that, at least for our sample,
the enhanced multiple method is more accurate than
either of the two standard methods, but not to the same
extent. We find that the enhanced approach performs
dramatically better than the DCF method but only slightly
better than the standard multiples method. An explanation
for this finding is that both the enhanced multiple method
and the standard multiples model allow for changes in the
risk premiums (which are impounded in the multiples),
whereas the DCF method, based on a cost of capital
estimated from historical data, holds risk premiums
effectively fixed over time. During our sample period,
when the evidence suggests there were significant
changes in risk premiums, it is not surprising that the
DCF method performed poorly.
Finally, we note that like the standard market multiples
method, the enhanced multiple method does have the
limitation that it requires the identification of comparable
companies. Because it is based on comparable compa-
nies, it cannot be used to estimate intrinsic value, as
opposed to implied stock market value. Nonetheless, the
results reported here suggest that the enhanced multiple
method provides an important addition to an appraiser’s
toolkit. In addition, it should be an interesting topic for
future research.
Acknowledgments
We would like to thank Margaret Hlebowitsch,
Constance Kelly, Alexandra Lee, Cheryl Leong, Kirupa-
karan Ramaiah, Yili Wang, and Jonathan Williams for
their assistance and comments.
References
Cochrane, John H. 2011. “Discount Rates.” Journal ofFinance 64 (1):1047–1108.
Damodaran, Aswath. 2014. The equity risk premium:
Determinants, estimation and implications—The 2014edition. Unpublished Working Paper, Stern School of
Business, New York University.
Duff & Phelps. 2014. Valuation Handbook—Guideto Cost of Capital. Hoboken, N.J.: John Wiley and
Sons.
Easton, Peter, and Greg Sommers. 2007. “Effect of
Analysts’ Optimism on Estimates of Expected Returns
Implied by Earnings Forecasts.” Journal of Accounting
Research 45 (5):983–1015.
Gebhardt, William, R., Charles M. C. Lee, and Bhaskaran
Swaminathan. 2001. “Toward an Implied Cost of
Business Valuation Review
Page 60 ’ 2016, American Society of Appraisers

Capital.” Journal of Accounting Research 39
(1):135–176.
Holthausen, Robert W., and Mark E. Zmijewski. 2014.
Corporate Valuation: Theory, Evidence and Practice.
New York: Cambridge Business Publishers.
Ibbotson Associates. 2005. Stocks, Bonds, Bills, andInflation: 2005 Yearbook—Market Results for 1926-2004. Chicago: Morningstar.
Inc. Morningstar. 2012. Ibbotson SBBI Valuation Year-book 2012: Market Results for Stocks, Bonds, Bills, andInflation 1926-2011 (Stocks, Bonds, Bills, and Inflation(Sbbi) Yearbook (Valuation Edition). Chicago: Inc.
Morningstar.
Kaplan, Steven N., and Richard S. Ruback. 1995.
“The Valuation of Cash Flow Forecasts: An
Empirical Analysis.” Journal of Finance 50 (4):
1059–1053.
Levi, Yaron, and Ivo Welch. 2014. Long-term capitalbudgeting. Unpublished Working Paper, Anderson
Graduate School of Management, University of
California–Los Angeles.
Pratt, Shannon P. 2008. Valuing a Business. 5th ed.
New York: McGraw-Hill.
Pratt, Shannon P., and Roger J. Grabowski. 2014. Cost ofCapital Application and Examples. 5th ed. Hoboken,
N.J.: John Wiley & Sons.
An “Enhanced Multiple” Corporate Valuation Model: Theory and Empirical Tests
Business Valuation Review — Summer 2016 Page 61

Business Valuation ReviewThe BV Profession’s Most Respected and
Longest-Running Academic Journal
Click here to subscribe to Business Valuation Review.
Only Business Valuation Review, published by the Business Valuation Committee of the American Society of Appraisers (ASA), provides the highest level, most intellectually challenging and thought-provoking information on the BV profession, keeping you apprised of the trends, issues, controversies, best-practices and latest thinking in the valuation arena.
Preeminent business valuation professionals seek Business Valuation Review as their primary source for on-going knowledge, with articles written by some of the most respected thought leaders in the world.
Subscribe today for $140 annually