Valuation Chapter 10. Ch 102 Valuation models –Discounted cash-flow –Market-based (multiples)...
24
Valuation Chapter 10
-
date post
20-Dec-2015 -
Category
Documents
-
view
222 -
download
3
Transcript of Valuation Chapter 10. Ch 102 Valuation models –Discounted cash-flow –Market-based (multiples)...

Valuation
Chapter 10

Ch 10 2
Valuation models
– Discounted cash-flow
– Market-based (multiples)
– Residual income Model
DCF and risidual income model are much more sophisticated valuation tools than the price multiples
– Infinite forecast horizon
– Risk and the time-value of money are taken into account (cost of capital)
Ch 10 3
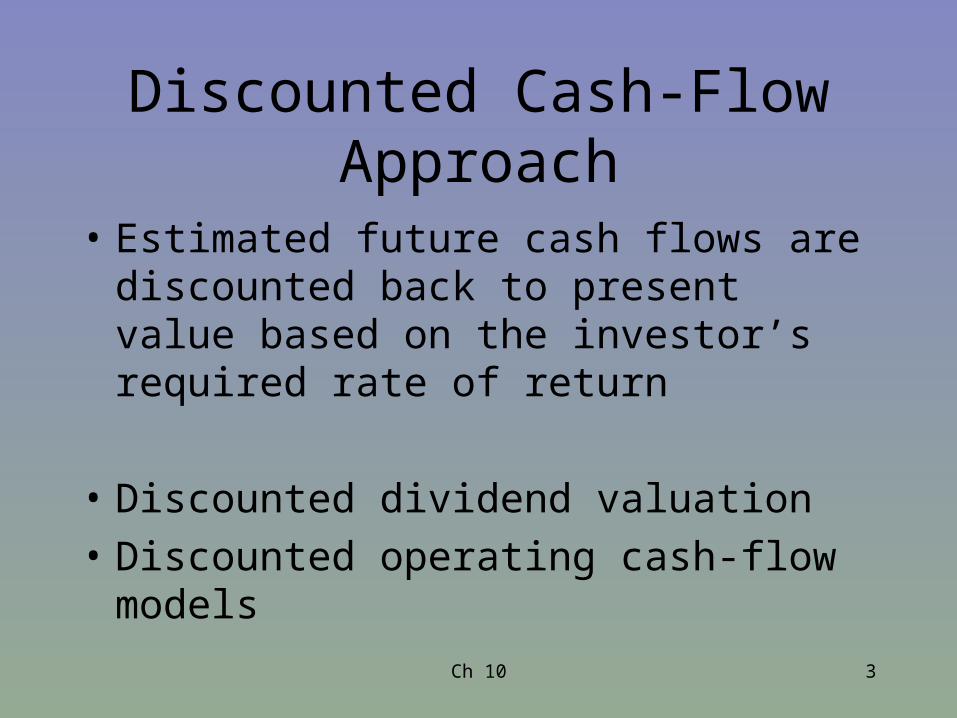
Discounted Cash-Flow Approach
• Estimated future cash flows are discounted back to present value based on the investor’s required rate of return
• Discounted dividend valuation
• Discounted operating cash-flow models
Ch 10 4
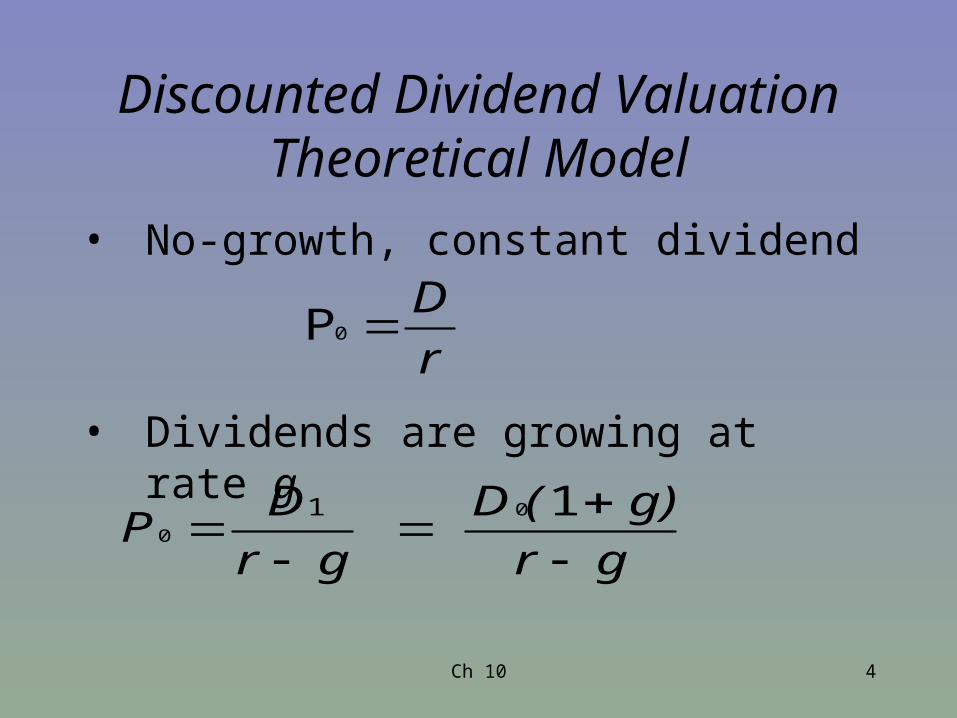
Discounted Dividend ValuationTheoretical Model
• No-growth, constant dividend
• Dividends are growing at rate g
r
D0P
gr
g)(D
gr
DP
10
0
1
Ch 10 5
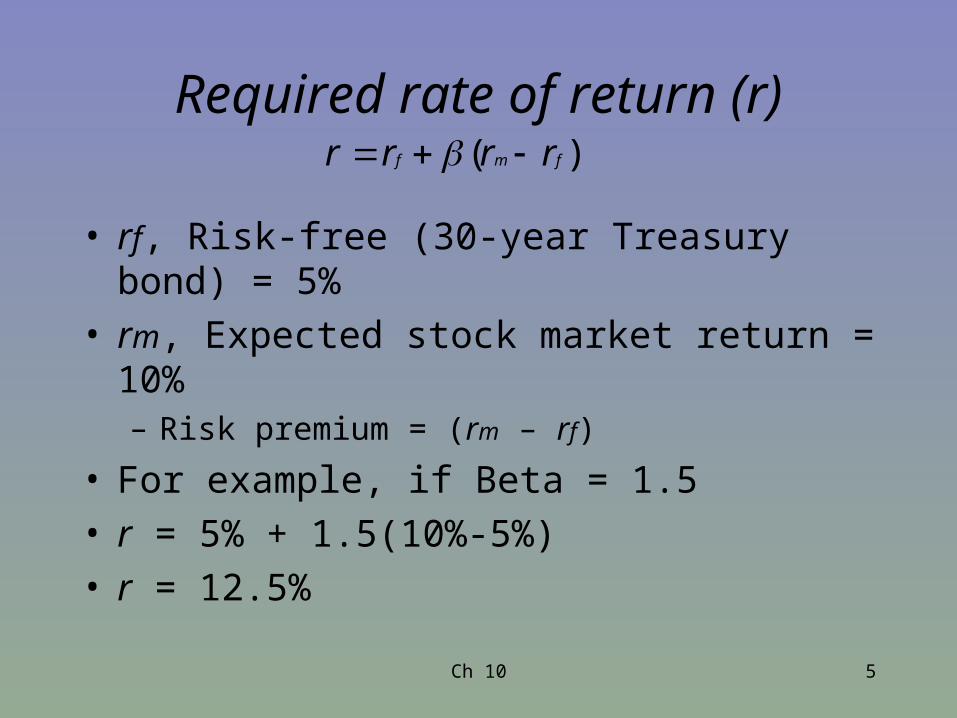
Required rate of return (r)
• rf, Risk-free (30-year Treasury bond) = 5%• rm, Expected stock market return = 10%
– Risk premium = (rm – rf)
• For example, if Beta = 1.5• r = 5% + 1.5(10%-5%)• r = 12.5%
)( fmf rrrr
Ch 10 6
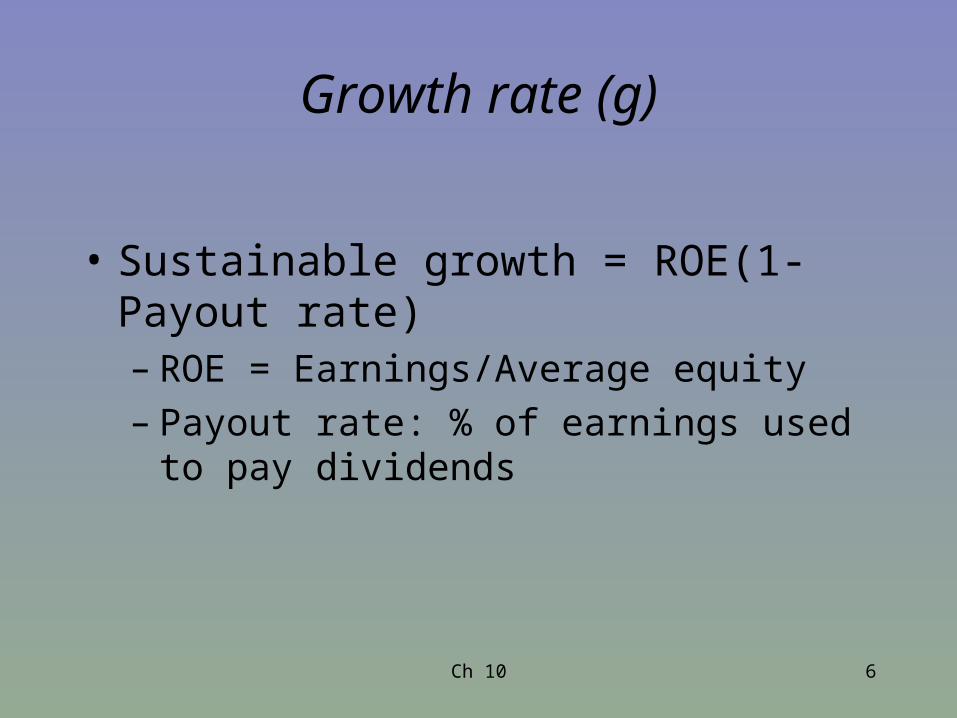
Growth rate (g)
• Sustainable growth = ROE(1-Payout rate)– ROE = Earnings/Average equity– Payout rate: % of earnings used to pay
dividends

Ch 10 7
• Motorola– Annual dividend = $0.16– Beta = 1.35– ROE = 13%– Payout ratio = 20%
• Economic– Yield on Treasury bills = 4.75%– Historical market risk premium = 5.4%
Discounted Dividend ValuationMotorola example

Ch 10 8
• r = .0475+1.35(.054) = .120
• g = .13(1-.20) = .104
• Value = $11.04
Discounted Dividend ValuationMotorola example
104.120.
)104.1(16.0$
Ch 10 9
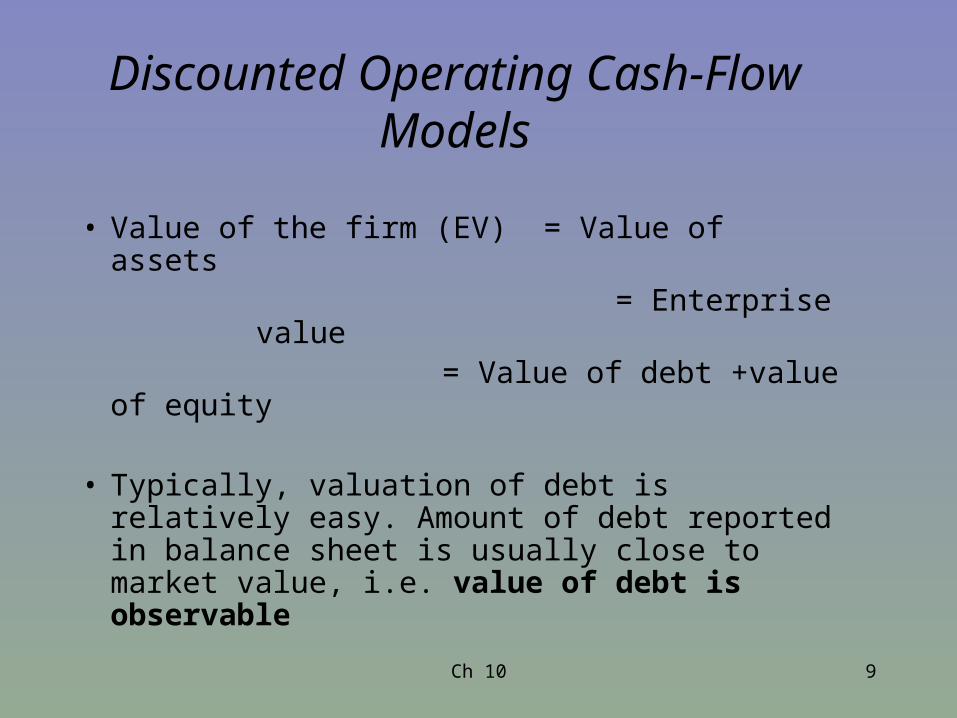
Discounted Operating Cash-Flow Models
• Value of the firm (EV) = Value of assets = Enterprise value
= Value of debt +value of equity
• Typically, valuation of debt is relatively easy. Amount of debt reported in balance sheet is usually close to market value, i.e. value of debt is observable

Ch 10 10
Discounted Operating Cash-Flow Models
• Operating cash flow
Plus: Interest Paid Times (1-tax rate)
Less: Investments in Fixed Capital
Free Cash Flow to the Firm (to all investors)
gr
FCFV
1
0

Ch 10 11
Discounted Operating Cash-Flow Models
• r = Weighted average cost of capital (WACC)– Required rate of return to all capital providers– For Motorola, 10.2%
• g = growth rate of FCFs– For Motorola, 9%
• If Motorola’s FCF = $314 million• Firm value is $26,167 million [314/(.102-.09)]• Shares outstanding is 2,299• Value per share (after debt $9,428) is $7.28

Ch 10 12
Discounted Operating Cash-Flow Models
• Growth– Can also use a multi-stage model to accommodate
rate changes
• Forecasting cash flows requires judgment– Begin with reported, historical cash flow and
earnings– Make company-appropriate adjustments– Use financial analysts’ estimates
Ch 10 13
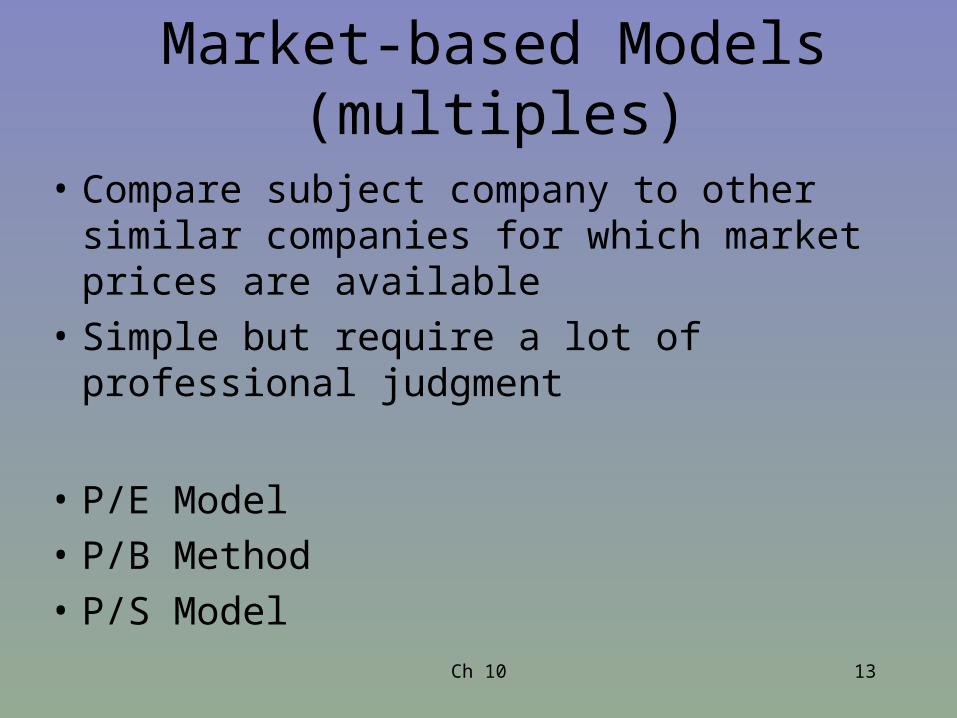
Market-based Models (multiples)
• Compare subject company to other similar companies for which market prices are available
• Simple but require a lot of professional judgment
• P/E Model
• P/B Method
• P/S Model

Ch 10 14
P/E Model
• Assumes a company is worth a certain multiple of its current earnings
• Assumes each stock is worth the same multiple of EPS
• Requires judgment regarding– Peer firms– Historical (average) P/E
Ch 10 15
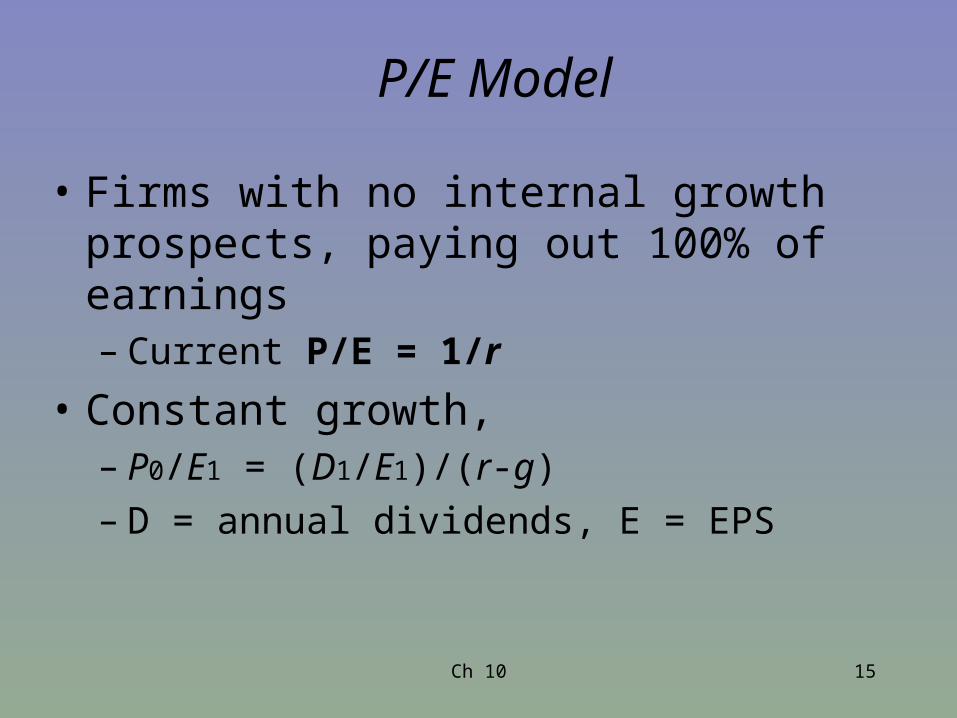
P/E Model
• Firms with no internal growth prospects, paying out 100% of earnings– Current P/E = 1/r
• Constant growth, – P0/E1 = (D1/E1)/(r-g)– D = annual dividends, E = EPS

Ch 10 16
P/E versus bond yields
http://home.golden.net/~pjponzo/PE-BondRates.htm
Ch 10 17
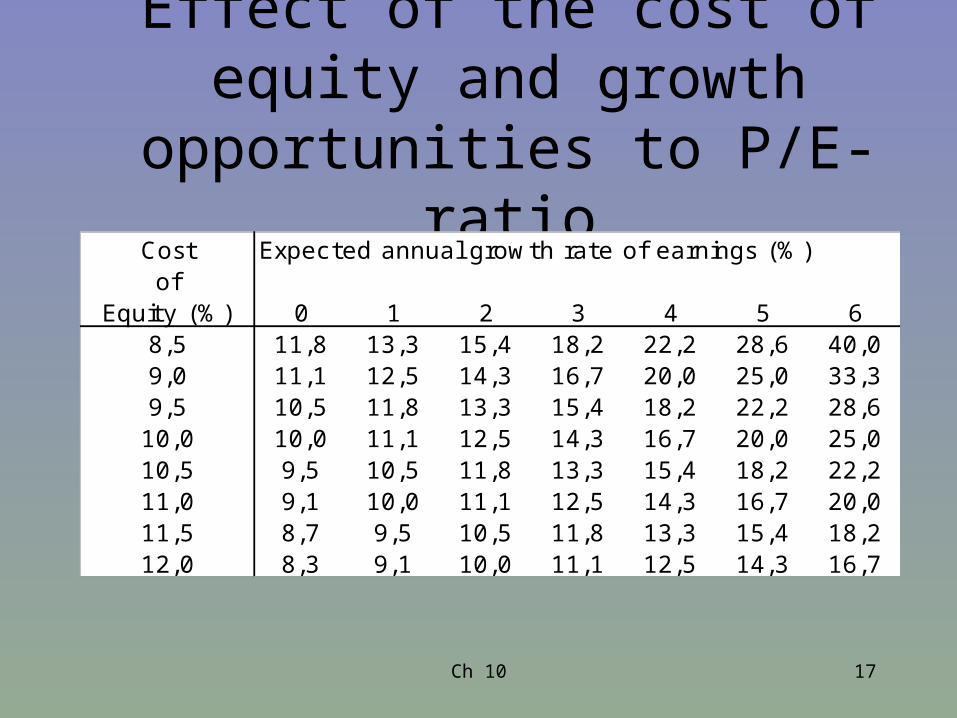
Effect of the cost of equity and growth opportunities to P/E-ratio
Cost Expected annual growth rate of earnings (%)of
Equity (%) 0 1 2 3 4 5 68,5 11,8 13,3 15,4 18,2 22,2 28,6 40,09,0 11,1 12,5 14,3 16,7 20,0 25,0 33,39,5 10,5 11,8 13,3 15,4 18,2 22,2 28,610,0 10,0 11,1 12,5 14,3 16,7 20,0 25,010,5 9,5 10,5 11,8 13,3 15,4 18,2 22,211,0 9,1 10,0 11,1 12,5 14,3 16,7 20,011,5 8,7 9,5 10,5 11,8 13,3 15,4 18,212,0 8,3 9,1 10,0 11,1 12,5 14,3 16,7
Ch 10 18
P/E Model
• Motorola example
• Consensus analyst forecast EPS = $0.46
• P/E of 23 is appropriate
• Value = 23*$0.46 = $10.58

Ch 10 19
Problems when using P/E-ratio in valuation
• It assumes that the benchmark is obtainable.
• P/E-ratios might differ accross firms or time at least for the following reasons:– growth opportunities may differ accross firms– riskiness of a firm may differ accorss firms– earnings for a given year may be temporary by
nature

Ch 10 20
P/B-ratio, price/book–ratio
• No growth– P0/B = ROE/r
• Constant growth– P0/B = (ROE- g)/(r-g)
• P/B ratios for similar firms are compared with those of the subject firm to arrive at an appropriate multiple for use in valuation

Ch 10 21
Other Price multiples
– enterprise value/EBIT–ratio– price/free cash flow–ratio– price/sales–ratio– Price/EBITDA
Method used should be appropriate considering the specific circumstances of the subject company.
Ch 10 22
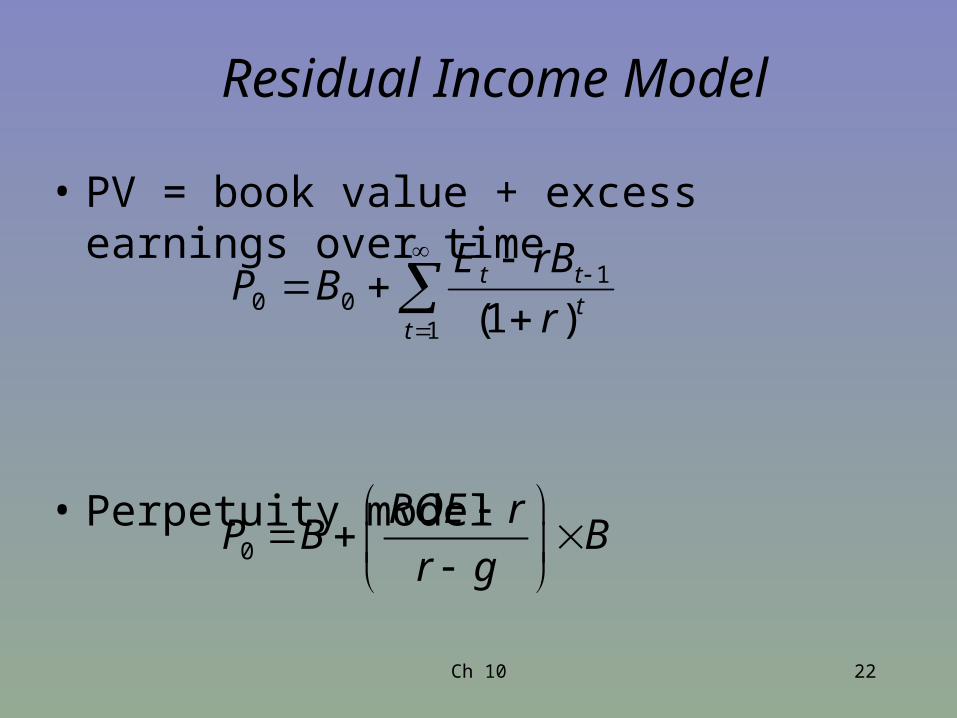
Residual Income Model
• PV = book value + excess earnings over time
• Perpetuity model
1
100 )1(t
ttt
r
rBEBP
0
ROE rP B B
r g

Ch 10 23

Ch 10 24
Valuation tools most used by analysts in Morgan Stanley European sector research teams
0
10
20
30
40
50
60
%