Sub-Pilot-Scale Hybrid Electrochemical System for...
31
199 Chapter 7 Sub-Pilot-Scale Hybrid Electrochemical System for Water Treatment and Hydrogen Production using a solar PV panel
Transcript of Sub-Pilot-Scale Hybrid Electrochemical System for...

199
Chapter 7
Sub-Pilot-Scale Hybrid Electrochemical System
for Water Treatment and Hydrogen Production
using a solar PV panel
200
Abstract
There is a clear need for environmentally-friendly alternative energy sources (without
carbon emissions) and photovoltaicelectrolysis for hydrogen production via water
splitting using organic contaminants as sacrificial electron donors can be a potential
solution This chapter demonstrates the feasibility of a sub-pilot scaled rooftop hybrid
photovoltaic-electrolysis system for wastewater treatment with simultaneous hydrogen
production Application of an anodic bias of gt 20 V to bismuth-doped TiO2 (BiOx-
TiO2)Ti metal electrode results in the electrochemical degradation of a variety of organic
contaminants (ie rhodamine B (RhB) methylene blue (MB) salicylic acid triclosan
and phenol) and real wastewater from chemical industry while molecular hydrogen is
released at the counter stainless steel (SS) electrode The kinetics of anodic substrates
oxidation is investigated as a function of the cell current (Icell) substrate concentration
and background electrolytes such as NaCl and Na2SO4 and average current efficiencies
are shown in the range of 4ndash22 Cathodic current efficiency and energy efficiency for
hydrogen production was achieved at 50ndash70 and 20ndash40 respectively
201
Introduction
In recent years there has been increasing interest in an developing electrochemical
method for wastewater treatment because of its advantages including versatility energy
efficiency amenability to automation and robustness 1-3 This technology was first
tested with various synthetic wastewaters containing specific target compounds such as
dyes and phenol 4-7 and more recently has focused on the treatment of actual
wastewaters including domestic wastewater industrial wastewater and landfill leachate
8-10 However the main drawback of electrochemical wastewater treatment is its high
operating cost due to high electric energy consumption
Hydrogen is considered as a possible alternative energy resource 11 However most
hydrogen is produced by the well-established thermal process known as steam methane
reforming (SMR) which has both supply issues and significant carbon emissions
Therefore transition to a hydrogen economy may be considered when alternative
renewable technologies to replace fossil-based hydrogen production methods are
developed In this context electrolytic production of hydrogen (ie water electrolysis) is
a potential solution to produce large amounts of hydrogen without the carbon emission
associated with fossil fuel However the primary disadvantage of water electrolysis is
also the high electric consumption especially in large-scale application
Over the past decades electrochemical applications for water splitting and for
wastewater treatment have been independently studied A dual-purpose hybrid
electrolysis system that couples wastewater treatment with hydrogen generation may
make the electrolysis system economically feasible In a hybrid system electrochemical
oxidation of organic contaminants takes place at an anode while a reduction reaction
202
simultaneously takes place at the cathode resulting in hydrogen production In previous
studies our group successfully demonstrated a hybrid electrochemical cell consisting of
BiOxndashTiO2Ti(0) anodes and stainless steel (SS) cathodes for the complete oxidation of
phenol with simultaneous hydrogen production 12-14
In this study we scaled up the hybrid electrolysis system to a sub-pilot size (a volume
of 20 L) with BiOxndashTiO2Ti(0) anodes and SS cathodes to investigate the feasibility of a
practical application The kinetics of oxidative degradation of a variety of target
substrates such as methylene blue (MB) rhodamine B (RhB) phenol salicylic acid
triclosan and waste organics in real industrial wastewater are investigated with
simultaneous hydrogen production In addition a solar-driven rooftop hybrid electrolysis
system using a commercial photovoltaic (PV) array is also investigated
Experimental
Electrode Preparation
BiOxndashTiO2Ti(0) electrode was used as an anode and stainless steel (SS Hastelloy C-
22) was used as a cathode The anode consists of a series of metal oxide coatings on a
titanium metal plate (a) a Ti metal substrate (b) an anti-passivation layer (pre-coat)
having the mixture of IrO2 and Ta2O5 (c) an intermediated layer (seal coat) of SnO2 and
Bi2O3 (d) a slurry coat containing particles of TiO2 doped with Bismuth (Bi) and (e) the
overcoat with TiO2 and Bi2O3 Slurry coat and overcoat together form the electrocatalytic
outer layer of the electrode and each coating step requires a specific heat treatment at
different temperatures and durations This electrode exhibits excellent stability and long
service life 15 More details on the anode preparation are provided elsewhere 1415 Each
203
electrode plate is about 800 cm2 and a reactor consists of 5 anodes and 6 cathodes that
face each other with an interelectrode gap of 2 mm (Figure 71)
Electrolysis Experiments
Electrolysis experiments were carried out in a sub-pilot scaled reactor with a volume
of 20 L Schematic diagram of the overall hybrid electrolysis is shown in Figure 71
The electrode couple (5 BiOxndashTiO2Ti(0) anodes and 6 SS cathodes) was immersed in 20
L of tap water NaCl (JTBaker) was used as a primary supporting electrolyte in the
range of 0ndash75 mM (typically 50 mM) and Na2SO4 (EMD) was also used to compare
electrolyte effect to NaCl Seawater which was collected from a beach area near Los
Angeles CA was used as a source of electrolyte as well For the electrochemical
oxidation the target substrates such as Methylene Blue (MB JTBaker) Rhodamine B
(RhB Aldrich) salicylic acid (SA Aldrich) phenol (PhOH Mallinckrodt) and 5-
chloro-2-(24-dichlorophenoxy)phenol (triclosan Fluka) were added in a background
electrolyte solution and the solution was continuously circulated by the pump connected
to the bottom of a reactor Most experiments were performed at circumneutral pH except
the experiment of triclosan at pH 12 adjusted with NaOH (EM Science) because of its
very low solubility in neutral pH Electrochemical degradation of highly contaminated
chemical industry wastewater which was sampled from the wastewater stream of a
manufacturing facility located in Minnesota was also investigated Original wastewater
was diluted with tap water to a proper COD concentration for laboratory experiments
(150ndash300 ppm) A constant current in a range between 75 A and 40 A (typically 25 A)
or voltage (3ndash4 V) was applied to the electrode couples by a DC power supply (HP
204
6260B) and cell voltage (Ecell) and cell current (Icell) were measured during electrolysis
by multimeters (Fluke)
Solar-Driven Electrolysis Experiment
For solar-driven electrolysis a commercial polycrystalline silicon solar photovoltaic
(PV) panel (Silicon Solar Inc) with a peak power output of 180 W (Epeak = 259 V and
Ipeak = 695 A respectively) and with surface area of 150 m2 (dimensions 095 m 157
m) was installed on the roof of the W M Keck Laboratories in Pasadena CA The solar
PV panel was directly connected to a sub-pilot reactor to drive various electrochemical
reactions such as the oxidative degradation of various organic contaminants and
wastewater with simultaneous hydrogen production Aqueous solutions of 50 mM NaCl
and 2L (10 vv ) of seawater were used as the primary electrolytes in the rooftop
experiments In addition to measurement of Ecell and Icell a real-time solar radiation was
also monitored by a pyranometer (Apogee) with a datalogger (Campbell Scientific)
Analytical Methods
Sample aliquots were withdrawn from the solution intermittently during the
electrolysis and analyzed The color removal of dyes was monitored by measuring the
absorbance at 665 nm and 550 nm for MB and RhB respectively with a UVVis
spectrophotometer The degradation of phenol salicylic acid and triclosan were
monitored using a HPLC (Agilent 1100 series) equipped with a C18 column and a UV
detector The mobile phase was composed of 45 acetonitrile and 55 Milli-Q water
containing 01 wt acetic acid For real wastewater the chemical oxygen demand
205
(COD) was measured titrimetrically with COD reagent vials (Hach) which use
dichromate as the oxidant in acidic solution at 150 oC for 2 hrs AgNO3 (Aldrich) was
added into sample solution before measuring COD to eliminate the chloride interference
in cases where NaCl was used as an electrolyte In addition COD removal of other
substrates was also measured to determine the current efficiencies for the anodic
oxidations
Molecular hydrogen (H2) produced from water during electrolysis was detected by a
quadruple mass spectrometry (MS Balzers) As shown in Figure 71 the reactor was
sealed and the headspace gas of the reactor was extracted with a peristaltic pump and
pushed into a quadruple MS with 70 eV electron ionization energy via a turbo pump
(Pfeiffer 50 10-6 Torr) The production rate of H2 was calculated from the volume
percent of H2 in the headspace gas which was measured assuming that it was directly
proportional to the percent of ion current of H2 in total ion currents measured by MS
Current Efficiency and Energy Efficiency
The instantaneous current efficiencies (ICE) for anodic oxidations were calculated
using the following equation introduced by Comninellis and Pulgarin 616
ndash8
100
where COD0 and CODt are the COD (in g O2L) before and after electrolysis
respectively F is the Faraday constant (96487 Cmol) V is volume of the electrolyte (in
L) I is the current (in A) and t is a reaction time (in s)
206
Since the ICE decreases with time during electrolysis to finally reach about zero the
electrochemical oxidation index (EOI) which expresses the average current efficiency
was also calculated from following equation
where τ is the time of electrolysis at which ICE is almost zero
For H2 production the cathodic current efficiencies (CE) were calculated by the
following
2
100
Energy efficiencies (EE) for H2 production use the higher heating value of H2 (HHV
39 Whg) and the energy consumed by the system
39
100
In solar-powered electrolysis system the energy efficiencies were calculated by the
following equations
100
100
Results and Discussion
Electrochemical Water Treatment
Figure 72(a) shows a typical EcellndashIcell curve at the BiOxndashTiO2Ti(0) anode coupled
with stainless steel cathode in a sub-pilot reactor in presence of sodium chloride or
207
sodium sulfate as a supporting electrolyte The current is generated around 20 V of
applied voltage linearly increased above 25 V of Ecell The use of Na2SO4 as a
supporting electrolyte generates higher current density than NaCl at the same applied
voltage We also measured EcellndashIcell curve in the presence of 10 vv seawater which
was sampled from a beach area near Los Angeles CA instead of adding NaCl (since
seawater typically contains 05 M NaCl) and observed that current density in the presence
of 10 vv seawater was slightly higher than that in 50 mM NaCl which may be
because of other salts present in seawater conductivity of solution adding 10 vv of
seawater was measured at 53ndash56 mScm Figure 72(b) shows the current density as a
function of the concentration of electrolytes at 3 V of applied voltage The current
density increases with the addition of electrolyte but it does not increase much at high
concentration of electrolyte (ie more than 50 mM) Therefore the concentration of
electrolytes was fixed at 50 mM (or 10 vv seawater) in the following experiments
Figure 73 shows the effect of applied current density on the electrochemical
degradation of organic substrates using NaCl or Na2SO4 as supporting electrolytes in a
sub-pilot reactor Figure 73(a) shows the electrochemical degradation (ie color
removal) of MB at different applied cell current in the presence of NaCl As expected
increasing the current density resulted in a faster decolorization of MB due to a greater
charge entering the cell and more electro-generating of oxidants such as OH radicals and
active chlorine species The decolorization follows first-order kinetics and the apparent
degradation rate constant of MB (kMB) was proportional to the current density (Figure
73a inset) Figure 73(b) also shows that the degradation rate constant of triclosan (kTCS)
is increased as higher current density is applied in the presence of 50 mM Na2SO4
208
The effect of type and concentration of electrolytes on MB degradation is investigated
in Figure 74 Figure 74(a) shows that MB degradation in the presence of NaCl was
much faster than Na2SO4 although current density in the presence of NaCl was relatively
lower than that in the presence of Na2SO4 (Figure 72) The same tendency was observed
in the degradation of other organic substrates such as Rhodamine B (RhB) and salicylic
acid (SA) as shown in Table 71 In the presence of 50 mM NaCl half-life time (t12)
for the degradation of RhB and SA was estimated less than 2 min each whereas it was
remarkably increased to 27 min and 77 min respectively in the presence of Na2SO4 It
has been frequently reported that NaCl enhances the electrochemical degradation
efficiency for various organic substrates (eg MB phenol glucose and 17 βndashestradiol)
as compared to Na2SO4 461718 The electrochemical degradation of organic substrates
can occur via direct oxidation on the anode surface (eq71) indirect oxidation mediated
by OH radicals (eq72) and indirect oxidation mediated by electro-generated oxidant
from electrolyte solution such as Cl Cl2ndash and OClndash in the presence of NaCl (eqs73ndash
77)
org rarr oxidized org + endash (71)
H2O rarr OH + H+ + endash (72)
Clndash rarr Cl + endash (73)
Clndash + Cl rarr Cl2ndash (74)
Cl2ndash + H2O rarr HOCl + Clndash + H+ + endash (75)
Cl2ndash + OH rarr HOCl + Clndash (76)
HOCl harr OClndash + H+ (pKa = 746) (77)
209
In the presence of NaCl electrolyte active chlorine species such as Cl Cl2ndash and OClndash
which are electrochemically generated at the anode surface act as powerful oxidants
during electrolysis resulting in fast substrates oxidation when compared to the use of
other electrolytes In our previous study Cl2ndash was assumed the primary oxidant among
various active chlorine species since the observed degradation rates are found to be
proportional only to the bimolecular rate constants of Cl2ndash with the substrate 13 On the
other hand indirect oxidation by OH radicals and SO4ndash radicals (eq78) can take place
in Na2SO4 solution as well However substrates oxidation rates with Na2SO4 are
observed very low implying that a lower concentration of OH radicals are produced in
Na2SO4 solution and(or) SO4ndash radicals are less determining of the reaction rates in spite
of their high redox potential It is ascribed to the generation of surface-bound SO4ndash
radicals at metal oxide electrode surface and reaction with another SO4ndash to produce
persulfate (eq79)
SO42ndash rarr SO4
ndash+ endash (78)
SO4ndash + SO4
ndash rarr S2O82ndash (79)
A substrate oxidation rate with 10 vv of seawater was even higher than that with
50 mM NaCl suggesting that the seawater could be a good alternative source of NaCl
electrolyte as shown in Figure 74(a) Figure 74(b) shows the effect of the concentration
of NaCl (SW) electrolyte on MB degradation rates In the absence of NaCl electrolyte
MB was degraded very slowly (kMB ~ 18 times 10-2 min-1) while MB degradation rates
increased by an order of magnitude (kMB= 11ndash39 times 10-1 min-1) as NaCl was added
However degradation rates do not increase at higher concentration which is similar to
the change of current density as a function of the concentration of electrolyte (Figure
210
72b) Inset of Figure 74(b) shows a linear relationship of the degradation rates and
current densities generated by adding different concentration of electrolytes suggesting
that electrolyte concentration can affect the degradation rates by a change of current
density
Table 71 summarizes the degradation rate constants of several organic substrates
under various conditions The initial concentration had no significant effect on MB
degradation rate For example kMB at [MB]0= 5 μM was faster than those at higher
concentration of MB however kMB does not decrease further over the range of 10ndash250
μM (see Figure 75(a) inset also) The half-life time (t12) for MB degradation at [MB]0=
10 μM and 250 μM was estimated at 5 min and 7 min respectively However the initial
concentration of phenol significantly affects the apparent degradation rate of phenol For
example kPhOH decreased remarkably at higher concentration which is due to production
of a large number of reaction intermediates such as chlorinated phenols Figure 75 also
compares COD removal with the substrate removal of MB and phenol For MB
degradation as expected COD removal rate was slower than color removal rate
suggesting that MB was oxidized first to colorless intermediates and then oxidized further
to CO2 However kCOD was almost similar to kosb at [MB]0= 10 μM and 2 times higher
than kobs at [MB]0= 100 μM (Table 71) For phenol degradation however substrate
degradation was completed within 2 min but COD reduction was continued for more
than 10 min (ie kCOD gtgt kobs in Figure 75b) It implies that the COD reduction and full
oxidation step of MB is simpler and(or) intermediates do not significantly interfere with
parent MB molecules as compared to the process of COD reduction and mineralization of
phenol
211
The current efficiencies (ie ICE) of anodic substrate oxidations determined from
COD measurement are shown in Figure 76 The current efficiency was higher at the
initial stages (eg 85 for MB oxidation) and decreased with time during electrolysis
(Figure 76a) Current efficiency also depends on the type of substrates and applied
current density Low initial concentration results in higher current efficiencies For
example low initial concentration of MB showed higher current efficiency than high
initial concentration In addition current efficiency increases also with low applied
current density whereas the substrate removal efficiency increases with high current
density The current efficiency of phenol at applied Icell of 8 A was higher than that with
25 A applied Figure 76(b) compares the average current efficiencies (ie EOI) for
various substrates oxidation The average current efficiencies were in the range of 10ndash20
with the order of MB gt RhB gt phenol at the same initial concentration
Figure 77 shows the electrochemical oxidation of real wastewater from chemical
industry COD decreased during electrolysis and the removal efficiency increased at high
applied voltage The average current efficiency was determined to be about 4 It is
relatively lower than current efficiencies (10ndash20 ) for the oxidation of a specific
substrate indicating that the real wastewater likely contain more persistent organic
substrates and(or) other unknown species present in wastewater may compete to desirable
substrate oxidation resulting in low current efficiency
In conclusion our sub-pilot electrochemical system is proven for complete oxidation
and mineralization of a variety of environmental organic pollutants and real wastewater
NaCl is the most effective electrolyte for fast wastewater treatment in our system which
can be replaced by seawater
212
Simultaneous H2 Production via Water Electrolysis
A significant amount of H2 is simultaneously produced from water electrolysis at the
cathode in a sub-pilot hybrid electrochemical reactor under various conditions (Table
72) For pure water splitting in the absence of organic substrates H2 production rates are
in the range of 3ndash5 Lhr and current efficiencies (CE) and energy efficiencies (EE) are
about 50ndash60 and 20ndash35 respectively As expected a sub-pilot reactor showed lower
efficiency than a small size reactor with 35ndash60 of EE The current efficiency and
energy efficiency for H2 production also decreased with increasing applied power which
showed the same tendency as substrates oxidation at the anode In addition we
compared Na2SO4 with NaCl and observed that Na2SO4 was better than NaCl for the H2
production efficiency It may be due to high current densities generated in Na2SO4
solution as compared to the same concentration of NaCl (Figure 72) and no electron
relay between the anode and the cathode via chlorine species In NaCl solution active
chlorine species produced at anode can be reduced again at the cathode and fewer
electrons are available for H2 production at cathode When 10 vv of seawater was
used as an electrolyte source H2 production rate is higher than in50 mM NaCl
In the presence of organic substrates such as MB and phenol H2 production rates
measured at 5ndash6 Lhr of with simultaneous oxidation of substrates H2 production rates
remained almost constant before and after adding organic substrates In addition a
similar H2 production rate was obtained with industrial wastewater as well suggesting
that the presence of waste organics in solution does not have a negative effect on cathodic
H2 production In previous studies we have suggested that some organic substrates can
actually increase H2 production energy efficiencies by 30ndash50 in a NaCl electrolyte
213
system by quenching active chlorine species which compete with H2 production
reactions for cathodic electrons 1314 Active chlorine species can act as an electron
shuttle by being oxidized at the anode and reduced at the cathode If organic substrates
are added however substrates are rapidly oxidized by active chlorine species and this
electron relay can be consequently inhibited resulting in increasing H2 production rates
by making more electrons available at the cathode However this synergic effect on H2
production was not observed with industrial wastewater treatment in a sub-pilot
electrolysis system which may be because a synergic effect is dependent on the type of
organic substrates 13 It may also be due to relatively low production rates of active
chlorine species as compared with H2 production rates in a sub-pilot system For
example we compared H2 production rate with hypochlorite (OClndash) production rate
which is one of the active chlorine species and easily detected using UVvis spectrometer
In a small size of electrochemical reactor H2 production rate of 100ndash300 μMmin was
comparable to OClndash production rate of 100ndash150 μMmin which can result in big
inhibition effect of active chlorine species on the H2 production reactor In a sub-pilot
reaction however H2 production rate significantly increased to 3ndash5 mMmin whereas
OCl- production rate was still remained similar (200 μMmin)
Solar-Driven Hybrid Electrolysis System
Figure 78 shows the results of solar-driven photovoltaic-electrolysis experiments with
our sub-pilot hybrid reactor which was performed on the rooftop of W M Keck
Laboratories at Caltech in August 2009 We directly connected 180 Wpeak-rated
commercial PV panel with surface area of 150 m2 to BiOxndashTiO2Ti(0) anode and SS
214
cathode Figure 78(a) shows typical time profiles of solar light radiation energy
measured by a pyranometer Ecell and Icell on sunny day The peak of solar radiation
energy was measured about 1000 Wm2 around 1230 PM and decreased to 600 Wm2 in
the late afternoon Ecell measured 33 V in the presence of 10 vv seawater as an
electrolyte and slightly decreased to 30 V in the afternoon as solar irradiation energy
decreased while Icell was measured about 7 A both in the morning and in late afternoon
Solar irradiation energy Ecell and Icell was measured for several days including a partly
cloudy day on August 2009 and remained approximately constant with Ecell of 27ndash33 V
and Icell of 6ndash7 A The actual PV output power was measured 23 W which is only 13
of PVpeak output power reported by supplier possibly due to losses from wiring heat and
coupling to the electrolyzer Solar-to-PVcell energy efficiency was determined to be 16ndash
20 whereas it was about 25 with a system consisting of a 64 Wpeakndashrated small
PV panel (the area of 013 m2) and a small electrolyzer (200 mL)
MB and industrial wastewater were effectively treated in spite of low output power as
shown in Figure 78(b) For example the apparent kinetic constant for COD reduction
(kCOD) of 3M wastewater with solar-driven system by PV array operating at 21 W (Ecell times
Icell = 30 V times 7 A) was estimated to be 90 times 10-3 min-1 which is a similar kCOD to DC-
powered oxidation operated at 45 W (Ecell times Icell = 30 V times 15 A) The average current
efficiency for industrial wastewater oxidation was increased to 15 in solar-driven
system which is almost 4 times higher than that with DC-powered oxidation This high
efficiency may be because the photo-assisted electrochemical (ie photoelectrochemical
PEC) reactions took place in solar-powered rooftop experiment A sub-pilot electrolyzer
was installed on the roof as well to connect directly to the PV panel and therefore some
215
of the solar-light could pass through the reactor and the PEC processes could be initiated
by doped TiO2 particles coated on an anode surface Preliminary results of laboratory
experiment with a medium size of electrochemical reactor and using the artificial UV
lamp shows that the electrochemical oxidation rates of phenol were increased with UV
light irradiation indicating that the PEC processes actually take place on BiOxndash
TiO2Ti(0)
In solar-driven hybrid electrolysis system it was also observed that sufficient amount
of H2 was continuously produced with simultaneous oxidation of waste organic
substrates H2 production rate was measured at 22 Lhr which was smaller than that of
the DC-powered system (Table 72) In spite of relatively low power however CE and
EE were increased to 74 and 38 respectively Like anodic oxidation high CE and
EE for H2 production in solar-driven electrolysis system can be ascribed to photocatalytic
activity of TiO2 on anode surface In DC-powered electrolysis with a medium size of
electrolyzer we also found that photoelectrochemical (PEC) H2 production rates under
UV light irradiation were almost 2 times higher than electrochemical H2 production rates
in the absence of UV light Solar-to-H2 energy efficiency was determined 08
Practical Application
The above results show an example of a sub-pilot hybrid photovoltaic-electrolysis
system which has dual purposes for both wastewater treatment and H2 production In the
solar-driven experiment solar-to-H2 energy efficiency was estimated less than 1
which was lower than other commercial PV-electrolysis systems in the range of 2ndash10
19-22 However it is difficult to compare our hybrid PV-electrolysis system with other
216
commercial PV-electrolysis systems since ours has several distinguishable advantages for
practical application First our hybrid PV-electrolysis system can be operated at mild
conditions whereas other types of PV-electrolysis systems can be only operated at much
harsher conditions For example the alkaline water electrolyzer the most
commercialized electrolyzer uses an extremely high concentration of alkaline
electrolytes (ie 6ndash7 M KOH) resulting in high pH environment which is also operated
at about 70ndash80 oC in general and under pressure is desirable to minimize energy
requirement 23 However our hybrid PV-electrolysis system can be effectively operated
at circum-neutral pH condition and relatively low concentration of electrolyte (eg 50
mM NaCl) Second our PV-electrolysis system has dual purposes for real wastewater
treatment and H2 production which can make this technology economically feasible
Other PV-electrolysis systems that previously reported generally use alkaline electrolyzer
or PEM electrolyzer (a second commercially available electrolyzer) which is impractical
for application to water treatment On the other hand our sub-pilot PV-electrolysis
system is also working for various wastewater treatments suggesting that
electrochemical water treatment can be successfully implanted with water splitting into
hydrogen
The PV-electrolysis system employed in this study can be also distinguished from
other electrochemical water treatment system in terms of using new types of anode
material and PV array for power supply For example boron-doped diamond electrode
(BOD) is known as the most promising anode for wastewater treatment because of its
high stability wide potential window of water discharge and a relatively low background
current 24-26 Jiang et al also showed that the decomposition of waste organics and
217
simultaneous hydrogen production are feasible with a boron-doped diamond (BOD)
electrode 24 However pilot scale application would be limited with BOD electrode due
to its high price and size limitation since the production typically involves chemical
vapor deposition (CVD) or high pressure-high temperature (HPHT) processes 27 On the
other hand the Bi-doped TiO2 anode employed in this study had been easily
manufactured in a pilot scale with relatively low cost 15 In addition a PV-electrolysis
system for environmental applications (ie water treatment) was proposed to reduce the
operating costndash in a way not demonstrated before to our knowledge 24 In this study we
demonstrated a sub-pilot PV-electrolysis system for water treatment and also showed a
synergic effect on water treatment as compared to DC-powered system since
photoelectrochemical processes can be possible with Bi-doped TiO2 anodes when a
photovoltaic system is combined
F
sy
Figure 71 S
ystem
Schematic diiagram of a sub-pilot eleectrochemiccal reactor annd overall h
218
ybrid
219
Ecell (V)
0 1 2 3 4
J (m
Ac
m2 )
0
2
4
6
8
10
12
NaClNa2SO4
NaCl (SW)
(a)
[Electrolyte] (mM)
0 20 40 60 80
J (m
Ac
m2 )
00
05
10
15
20
25
30
NaCl Na2SO4
(b)
Figure 72 (a) EcellndashIcell plot in the presence of 50 mM NaCl or Na2SO4 as a supporting
electrolyte NaCl (SW) indicates 10 vv of seawater as a source of NaCl electrolyte (b)
The current density (Jcell) as a function of the concentration of the electrolyte (mM) at
applied Ecell = 30 V
220
Time (min)
0 10 20 30
[MB
] t [
MB
] 0
00
02
04
06
08
10
12
Jcell (mAcm2)
0 1 2 3 4 5 6
k MB
(min
-1)
000
005
010
015
020
025(a)
75 A125 A
25 A40 A
Jcell (mAcm2)
0 1 2 3 4 5
kT
CS (
h-1
)
00
02
04
06
08
(b)
Figure 73 Electrochemical degradation of organic substrates as a function of applied
current density (a) The degradation of methylene blue ([MB]0= 10 M) in 50 mM NaCl
(b) the degradation of triclosan ([TCS]0= 100 M) in 50 mM Na2SO4
221
Time (min)
0 20 40 60 80 100
[MB
] t
[MB
] 0
00
02
04
06
08
10
12
NaCl Na2SO4
NaCl (SW)
(a)
[NaCl] (mM)
0 20 40 60 80 100
k MB
(min
-1)
00
01
02
03
04
05
(b)
Jcell (mAcm2)12 16 20 24
kM
B (
min
-1)
00
01
02
03
04
05
Figure 74 (a) Electrochemical degradation of methylene blue (MB) in the presence of
different types of electrolyte at Icell= 25A [MB]0= 10 M 50 mM NaCl 50 mM Na2SO4
and 10 vv seawater (NaCl SW) were used as background electrolytes (b) The color
removal rate constant of MB as a function of the concentration of NaCl (SW) electrolyte
at Ecell= 3 V [MB]0= 10 M
222
Time (min)
0 10 20 30 40 50 60
[MB
] t [
MB
] 0
00
02
04
06
08
10
12
COD Removal Color Removal
(a)
MB (M)
0 50 100 150 200 250 300000
005
010
015
020
025
kM
B (m
in-1
)
Time (min)
0 2 4 6 8 10
[Ph
OH
] t [
Ph
OH
] 0
00
02
04
06
08
10
12COD Removal PhOH Removal (b)
Figure 75 The electrochemical degradation of organic substrates vs COD removal for
(a) MB and (b) phenol at applied Icell= 25A in the presence of 50 mM NaCl ([MB]0= 10
or 100 μM [PhOH]0= 100 μM)
223
Time (min)
0 10 20 30 40
ICE
(
)
0
20
40
60
80
100MB (10 M)MB (100 M)PhOH (25A)PhOH (8A)
(a)
EO
I (
)
0
5
10
15
20
25
(b)
MB(10 M)
8A
MB(100 M)
RhB(10 M)
RhB(100 M)
PhOH(100 M)
PhOH(100 M)
25A
Figure 76 (a) Time profile of current efficiencies (ICE) and (b) average current
efficiencies (EOI) for various substrates oxidations [MB]0= 10 or 100 μM [RhB]0= 10
or 100μM [PhOH]0= 100 μM [NaCl(SW)]= 50 mM Icell= 25 A applied except
PhOH(8A)
224
Time (min)
0 50 100 150 200
CO
Dt C
OD
0
00
02
04
06
08
10
40 V 35 V 30 V
Time (min)0 50 100 150 200
0
5
10
15
ICE
(
)
Figure 77 Electrochemical oxidation of industrial wastewater samples (COD0= 100ndash
150 ppm) at different applied voltages 10 vv (2L) seawater was used as a source of
NaCl electrolyte Inset graph shows the current efficiencies and average current
efficiency was determined about 4
225
(a)
Ece
ll (
V)
30
33
36
I cell (
A)
5
6
7
1030AM 1230PM
Time
1030AM 1230PM 230PM 430PM
I s (K
Wm
2) 10
08
06
04
August 2009
230PM 430PM
[MB
] t [
MB
] 0
CO
D (
pp
m)
Time (min)
0 60 120 18000
02
04
06
08
10
0
20
40
60
80
100MBReal Wastewater (b)
Figure 78 Solar-powered rooftop experiment (a) solar intensity cell current and cell
voltage which are measured during daytime (b) The degradation of MB ([MB]0= 100
μM) and COD removal of industrial wastewater (COD0= 100 ppm) 10 vv (2L)
seawater was used as an electrolyte in all experiments
226
TABLE 71 The degradation rate constants for anodic oxidation of several organic
substrates 20 L sub-pilot reactor Icell = 25 A applied [electrolyte]= 005M
Substrate
Conc (μM)
Electrolyte
kobs (min-1)
t12 (min)
kCOD (min-1)
MB 5 NaCl 0192 36
10 NaCl 0146 47 0130
50 NaCl 0136 51 100 NaCl 0129 54 0056 250 NaCl 0095 73 PhOH 100 NaCl 2320 03 0124 250 NaCl 1190 06 1000 NaCl 0360 19 RhB 100 NaCl 0379 18 0259 100 Na2SO4 0026 27 SA 100 NaCl 0420 17 100 Na2SO4 0009 77
227
TABLE 72 The rate cathodic current efficiency (CE) and energy efficiency (EE) of
hydrogen production 20 L sub-pilot reactor constant current applied 005M of
electrolyte used (sw means 10 vv of seawater)
Substrate
Icell (A)
Ecell (V)
Electrolyte
H2 prod rate (Lhr)
CE ()
EE ()
water only 125 285 NaCl 32 60 31
20 300 NaCl 40 48 23 25 323 NaCl 43 42 19 25 323 sw 50 48 21 25 317 Na2SO4 52 50 23 MB 25 325 sw 53 51 23 PhOH 25 325 sw 57 55 25 wastewater 25 323 sw 50 48 22 wastewater (PV) 7 282 sw 22 74 38
228
References
(1) Juttner K Galla U Schmieder H Electrochim Acta 2000 45 2575
(2) Chen G H Sep Purif Technol 2004 38 11
(3) Anglada A Urtiaga A Ortiz I Journal of Chemical Technology amp
Biotechnology 2009 DOI 101002jctb2214
(4) Panizza M Barbucci A Ricotti R Cerisola G Sep Purif Technol 2007 54
382
(5) Shen Z M Yang J Hu X F Lei Y M Ji X L Jia J P Wang W H
Environ Sci Technol 2005 39 1819
(6) Comninellis C Nerini A J Appl Electrochem 1995 25 23
(7) Iniesta J Michaud P A Panizza M Cerisola G Aldaz A Comninellis C
Electrochim Acta 2001 46 3573
(8) Vlyssides A G Karlis P K Rori N Zorpas A A J Hazard Mater 2002
95 215
(9) Vaghela S S Jethva A D Mehta B B Dave S P Adimurthy S
Ramachandraiah G Environ Sci Technol 2005 39 2848
(10) Urtiaga A Rueda A Anglada A Ortiz I J Hazard Mater 2009 166 1530
(11) International Energy Outlook 2006 DOEEIA=0484(2008) Energy Information
Administration US Department of Energy Washington DC 2008
(12) Park H Vecitis C D Choi W Weres O Hoffmann M R J Phys Chem C
2008 112 885
(13) Park H Vecitis C D Hoffmann M R J Phys Chem C 2009 113 7935
(14) Park H Vecitis C D Hoffmann M R J Phys Chem A 2008 112 7616
229
(15) Weres O Electrode with Surface comprising Oxides of Titanium and Bismuth
and Water Purification Process Using This Electrode In United States Patent January 4
2007
(16) Comninellis C Pulgarin C J Appl Electrochem 1991 21 703
(17) Murugananthan M Yoshihara S Rakuma T Uehara N Shirakashi T
Electrochim Acta 2007 52 3242
(18) Bonfatti F Ferro S Lavezzo F Malacarne M Lodi G De Battisti A J
Electrochem Soc 2000 147 592
(19) Ahmad G E El Shenawy E T Renewable Energy 2006 31 1043
(20) Hollmuller P Joubert J M Lachal B Yvon K Int J Hydrogen Energy
2000 25 97
(21) Lehman P A Chamberlin C E Pauletto G Rocheleau M A Int J
Hydrogen Energy 1997 22 465
(22) Gibson T L Kelly N A Int J Hydrogen Energy 2008 33 5931
(23) Srinivasan S Fuel cells from fundamentals to applications Springer New
York 2006
(24) Jiang J Y Chang M Pan P Environ Sci Technol 2008 42 3059
(25) Cabeza A Urtiaga A M Ortiz I Ind Eng Chem Res 2007 46 1439
(26) Montanaro D Petrucci E Merli C ldquoAnodic cathodic and combined
treatments for the electrochemical oxidation of an effluent from the flame retardant
industryrdquo 2008
(27) Kraft A Int J Electrochem Sci 2007 2 355
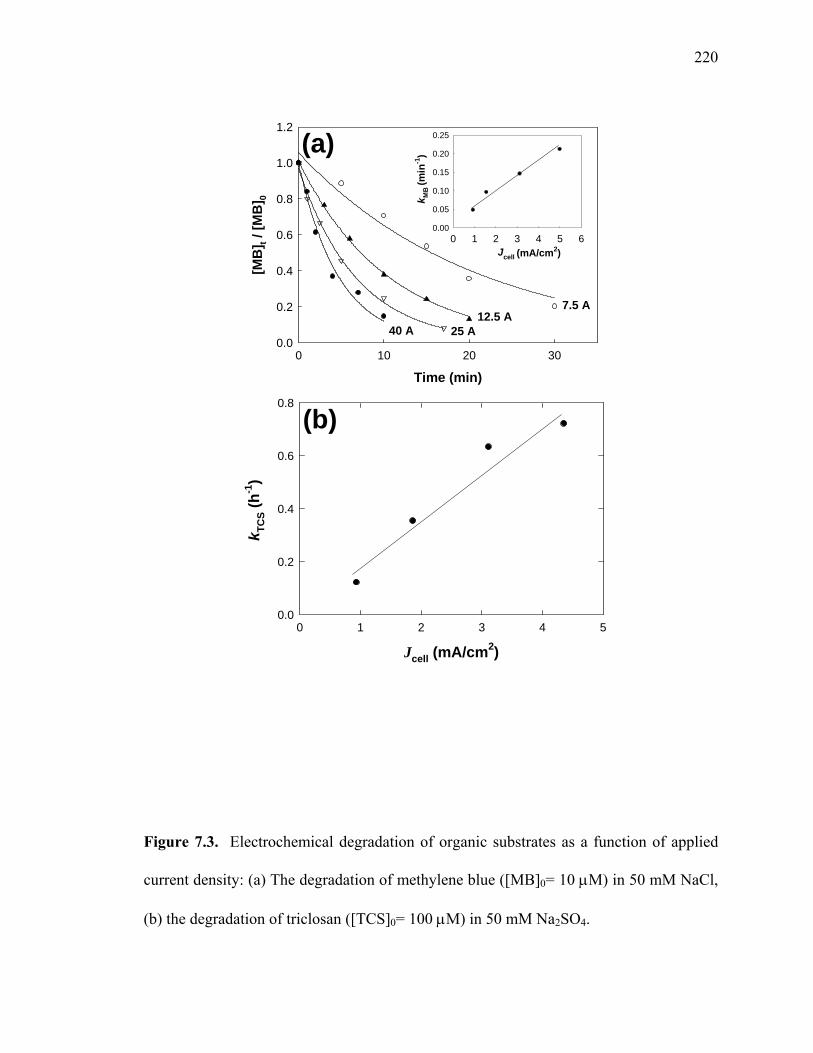


![[thesis.library.caltech.edu] - Welcome to …thesis.library.caltech.edu/7076/1/Frydman_Thesis2012.pdfTitle Microsoft Word - Frydman_Thesis2012.docx](https://static.fdocuments.us/doc/165x107/5b2f75657f8b9a55208ceae1/-welcome-to-microsoft-word-frydmanthesis2012docx.jpg)