Study on The Development of Kuala Tanjung as International Hub Port
43
Study on The Development of Kuala Tanjung as International Hub Port Final Presentation Part 4 – Transportation Analysis 2014 DIRECTORATE GENERAL OF SEA TRANSPORTATION MINISTRY OF TRANSPORTATION REPUBLIC OF INDONESIA
-
Upload
gillmar-betara -
Category
Documents
-
view
115 -
download
0
Transcript of Study on The Development of Kuala Tanjung as International Hub Port

Study on The Development of Kuala Tanjung as
International Hub PortFinal Presentation
Part 4 – Transportation Analysis
2014
DIRECTORATE GENERAL OF SEA TRANSPORTATIONMINISTRY OF TRANSPORTATION REPUBLIC OF INDONESIA

OutlineStaging
PositioningAccelerationPeak GrowthMaturity
Scenario I Existing Hubs
Scenario II Existing Hubs + Dedicated Berth
Scenario III Extended Scenario II (Shifted Export from Sumatera)
Scenario IV Market Based Hubs + Dedicated Berth
Conclusion and Recommendation
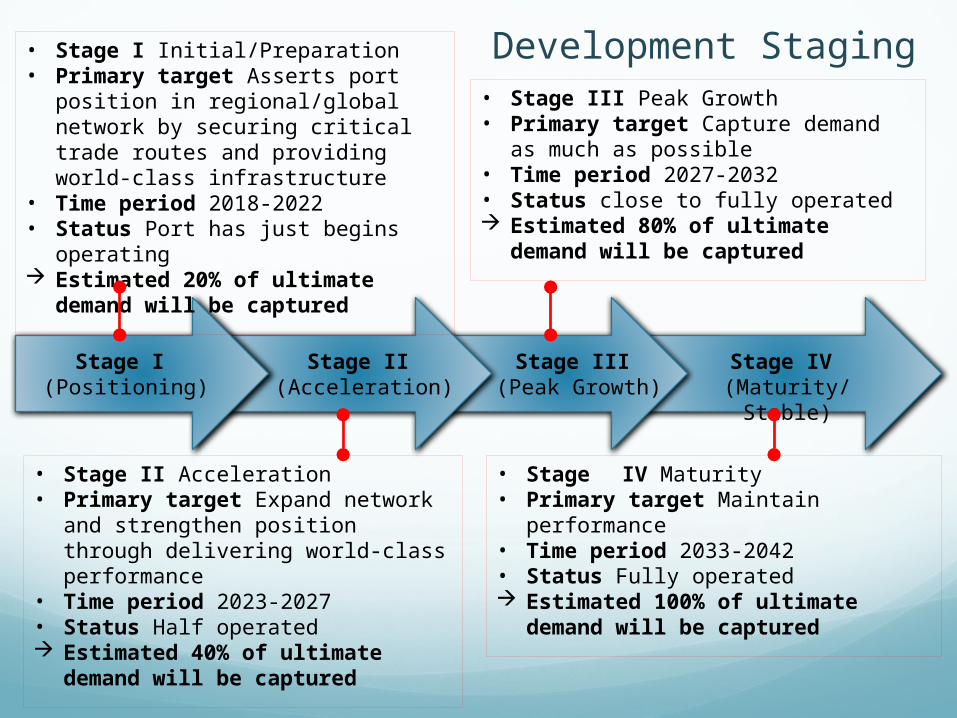
Development Staging
Stage IV (Maturity/ Stable)
Stage III (Peak Growth)
Stage II (Acceleration)
Stage I (Positioning)
• Stage I Initial/Preparation• Primary target Asserts port
position in regional/global network by securing critical trade routes and providing world-class infrastructure
• Time period 2018-2022• Status Port has just begins
operating Estimated 20% of ultimate
demand will be captured
• Stage IV Maturity• Primary target Maintain
performance• Time period 2033-2042• Status Fully operated Estimated 100% of ultimate
demand will be captured
• Stage II Acceleration• Primary target Expand network
and strengthen position through delivering world-class performance
• Time period 2023-2027• Status Half operated Estimated 40% of ultimate
demand will be captured
• Stage III Peak Growth • Primary target Capture demand as
much as possible• Time period 2027-2032• Status close to fully operated Estimated 80% of ultimate
demand will be captured

Scenario IExisting Hubs
Kuala Tanjung
Port
Generated Demand from Aceh and North Sumatera
Sei Mangkei starts operating as planned
Shifted Demand (Domestic Container) from Belawan Port
Based on Stated Preference Analysis
Existing and Shifted Export from Belawan Port
Existing and Shifted Import from critical trade routes
Export-Import
Generated Demand
Shifted Demand

Demand Commodities in North Sumatera Province
KARETSAWITKOPIKELAPACOKELATCENGKEHKEMENYANKEMIRITEMBAKAUIKANPADIJAGUNGUBI KAYUUBI JALARKACANG TANAHKACANG KEDELAIKACANG HIJAU
41%
28%
10%
12%
Demand Commodities in Aceh Province
KARET SAWIT
9%
91%
31%
62%
1%5% 1%
Komoditas Demand KEK Sei Mangkei
KARET (KRG,R.T,RSN)
SAWIT (CPO, CPKO, OLEO)
KERTAS
KAYU
PUPUK
Karet Sawit Kertas Kayu Pupuk
Generated Demand
Demand commodities in Sei Mangkei Special Economic Zone (SEZ)

North Sumatera
Generated Demand Forecast (e.g. North Sumatera)
2000
2003
2006
2009
2012
2015
2018
2021
2024
2027
2030
2033
2036
2039
2042
10,000,000
11,000,000
12,000,000
13,000,000
14,000,000
15,000,000
Population of North Sumatera Province
Data
Year
Popu
lati
on
2000
2003
2006
2009
2012
2015
2018
2021
2024
2027
2030
2033
2036
2039
2042
0.00100,000.00200,000.00300,000.00400,000.00500,000.00600,000.00700,000.00
GRDP of North Sumatera Province(billion rupiah)
Data
Year
GRD
P (b
illio
n ru
piah
)
2000
2003
2006
2009
2012
2015
2018
2021
2024
2027
2030
2033
2036
2039
2042
01,000,0002,000,0003,000,0004,000,0005,000,0006,000,0007,000,0008,000,000
Palm Oil Production in North Sumatera Province
DataPredic-tion
Year
Prod
ucti
on (
ton)

-58 -52 -46 -40 -34 -28 -22 -16 -10 -4 20.000.100.200.300.400.500.600.700.800.901.00
Demand sensitivity to Turn Round Time (TRT)
Kuala Tanjung Belawan
TRT Difference (hours)
Prob
abili
ty
TRT in Port of Tg. Priok serves as the baseline and is estimated at 48 hours. Therefore, equillibrium state will be reached when Port of Kuala Tanjung operated with 14 hours of TRT (34 hours faster than Port of Tg. Priok)
TRT in Port of Belawan is estimated at 72 hours. Thus, if Port of Kuala Tanjung is designed to operate at 14 hours of TRT (58 hours faster than Port of Belawan) then it is expected that 65% of Port of Belawan’s demand will shift to Port of Kuala Tanjung
-46 -34 -24 -13 -2 9 20 31 42 53 640.000.100.200.300.400.500.600.700.800.901.00
Demand sensitivity to Turn Round Time (TRT)
Kuala Tanjung Tanjung Priok
TRT Difference (hours)
Prob
abili
tyStated Preference

30%
Demand shift will occur gradually until the ultimate shifting probability1 (65%) is reached.
1only for Generated Demand from Aceh and North Sumatera
50%65% 65%
25% 10%45%65%
2015
2015
2039
2039Aceh
North Sumatera
Shifting Probability

Shifted Domestic Container
15% 30% 50% 65%
2015 2039
Domestic container shift from Port of Belawan to Port of Kuala Tanjung occurs gradually as the logical consequence of a better, thus, more competitive performance of Port of Kuala Tanjung compared to Port of Belawan
Shifted Demand

Existing dan Shifted Export
Existing exports grows logarithmically
Exports shift from Port of Belawan to Port of Kuala Tanjung also occurs gradually as the logical consequence of a better, thus, more competitive performance of Port of Kuala Tanjung compared to Port of Belawan
15% 30% 50% 65%
2015 2039

Existing dan Shifted ImportExisting import grows logarithmically
Imports shift from Port of Belawan to Port of Kuala Tanjung occurs gradually
Imports shift focuses on critical trade routes of major shipping lines to demonstrates the capability of Port of Kuala Tanjung to deliver a world-class performances and services
Critical Trade Routes:• From and To Singapore• From and To Port Klang• From and To PTP• From and To Ho Chi Minh• From and To Rotterdam• From and To Qatar• From and To Suez• From and To Qatar• From and To Fujairah• From and To Das Island
15% 30% 50% 65%
2015 2039

Demand Projection
2015 2016 2017 2018 2022 2027 2032 20420
500,000
1,000,000
1,500,000
2,000,000
2,500,000
3,000,000
3,500,000
4,000,000
4,500,000
5,000,000
Container Traffic Projection of Port of Kuala Tanjung
Year
Vol
ume
(TEU
s)YEAR
CONTAINER VOLUME (TON) (TEUs)
2015 0 02016 0 02017 0 02018 15,773,430 1,126,6742022 29,973,297 2,254,2832027 47,743,732 3,602,2672032 59,990,651 4,491,7132042 63,146,164 4,717,107
Construction Phase
YEAR CPO VOLUME(TON)
2015 02016 02017 02018 3,679,1052022 4,755,4592027 5,771,6682032 6,084,0962042 6,257,227
2015 2016 2017 2018 2022 2027 2032 20420
1,000,000
2,000,000
3,000,000
4,000,000
5,000,000
6,000,000
7,000,000
Liquid Bulk Traffic Pro-jection of Port of Kuala
Tanjung
Year
Vol
ume
(Ton
)
Construction Phase

Scenario IIExisting Hubs + Dedicated Berth
Export-Import
Generated DemandShifted Demand
Shifted Demand (Transshipment)
Kuala Tanjung
Generated Demand from Aceh to Jambi
Sei Mangkei starts operating as planned
Shifted Demand (Domestic Container) from Belawan Port
Based on Stated Preference Analysis
Existing and Shifted Export from Belawan Port
Existing and Shifted Import from critical trade routes
Shifted transshipment from four port competitors

30% 50%65% 65%
25% 10%45%65%
2015
2015
2039
2039
30% 10%50%65%
2015203910% 20%
65%
2015 2039
40%
15% 10%30%50%
20152039
Aceh
North Sumatera
West SumateraRiau
Jambi
Generated Demand

SingaporeSingaporePTP
Malaysia
Port KlangMalaysia
PenangMalaysia
Transshipment on Selected Ports

2005
2007
2009
2011
2013
2015
2017
2019
2021
2023
2025
2027
2029
2031
2033
2035
2037
2039
2041
15,000
5,015,000
10,015,000
15,015,000
20,015,000
25,015,000
30,015,000
35,015,000
f(x) = 18652770.6738982 x^0.139839479525195R² = 0.781753642392497
Singapore Transhipment Traffic
DataPower (Data)
Year
Vol
ume
(TEU
s)Transshipment on Selected Ports
Average 81% of total
throughput per year

2005
2007
2009
2011
2013
2015
2017
2019
2021
2023
2025
2027
2029
2031
2033
2035
2037
2039
2041
0
1,000,000
2,000,000
3,000,000
4,000,000
5,000,000
6,000,000
7,000,000
8,000,000
9,000,000
f(x) = 3948148.61843362 x^0.204786392143793R² = 0.973759662425002
PTP Transhipment Traffic
DataPower (Data)
Year
Vol
ume
(TEU
s)Transshipment on Selected Ports
Average 95% of total
throughput per year

2005
2007
2009
2011
2013
2015
2017
2019
2021
2023
2025
2027
2029
2031
2033
2035
2037
2039
2041
0
1,000,000
2,000,000
3,000,000
4,000,000
5,000,000
6,000,000
7,000,000
8,000,000
9,000,000
f(x) = 2955401.37966699 x^0.283538668837284R² = 0.908020063875345
Port Klang Transhipment Traffic
DataPower (Data)
Year
Vol
ume
(TEU
s)Transshipment on Selected Ports
Average 57% of total
throughput per year

2006
2008
2010
2012
2014
2016
2018
2020
2022
2024
2026
2028
2030
2032
2034
2036
2038
2040
2042
0
50,000
100,000
150,000
200,000
250,000
f(x) = 18903.0140878384 x^0.662483637024391R² = 0.711871132519554
Penang Transhipment Traffic
DataPower (Data)
Year
Vol
ume
(TEU
s)Transshipment on Selected Ports
Average 0.04%
of total throughput
per year

Major Problem in Malacca Strait…or potential demand?
Source: P3 Network Presentation

Major Problem in Malacca Strait…or potential demand?
Source: P3 Network Presentation, 2014

Transshipment on Selected Ports
3% 0%10%12%
20152039
SingaporeSingaporePTP
Malaysia
Port KlangMalaysia
PenangMalaysia

Demand Projection
2015 2016 2017 2018 2022 2027 2032 20420
2,000,000
4,000,000
6,000,000
8,000,000
10,000,000
12,000,000
Liquid Bulk Traffic Pro-jection of Port of Kuala
Tanjung
Year
Vol
ume
(Ton
)
2015 2016 2017 2018 2022 2027 2032 20420
2,000,000
4,000,000
6,000,000
8,000,000
10,000,000
12,000,000
Container Traffic Projection of Port of Kuala Tanjung
Year
Vol
ume
(TEU
s)YEAR
CONTAINER VOLUME (TON) (TEUs)
2015 0 02016 0 02017 0 02018 16,415,264 1,172,5192022 48,930,057 3,608,3372027 118,302,128 8,642,1522032 149,371,937 10,876,0912042 156,185,521 11,362,775
Construction Phase
YEAR CPO VOLUME(TON)
2015 02016 02017 02018 4,362,5762022 6,199,3792027 8,726,3572032 10,929,5932042 10,072,376
Construction Phase

Scenario IIIExtended Version of Scenario II
Export-Import
Generated DemandShifted Demand
Shifted Demand (Transshipment)
Kuala Tanjung
Generated Demand from Aceh to Jambi
Sei Mangkei starts operating as planned
Shifted Demand (Domestic Container) from Belawan Port
Based on Stated Preference Analysis
Existing and Shifted Export from Belawan Port
Existing and Shifted Import from critical trade routes
Shifted transshipment from four port competitors

Demand Projection
2015 2016 2017 2018 2022 2027 2032 20420
5,000,000
10,000,000
15,000,000
20,000,000
25,000,000
Container Traffic Projection of Port of Kuala Tanjung
Year
Vol
ume
(TEU
s)
2015 2016 2017 2018 2022 2027 2032 20420
2,000,000
4,000,000
6,000,000
8,000,000
10,000,000
12,000,000
Liquid Bulk Traffic Pro-jection of Port of Kuala
Tanjung
Year
Vol
ume
(Ton
)
YEARCONTAINER VOLUME(TON) (TEUs)
2015 0 02016 0 02017 0 02018 46,127,912 3,294,8512022 111,826,075 8,100,9102027 228,670,805 16,525,6292032 298,618,759 21,536,5782042 314,464,758 22,668,435
Construction Phase
YEAR CPO VOLUME(TON)
2015 02016 02017 02018 4,362,5762022 6,199,3792027 8,726,3572032 10,929,5932042 10,072,376
Construction Phase

Scenario IVMarket Based Hubs + Dedicated Berth
Hubs determined by Port Centrality Index
Generated Demand from Aceh to Jambi
Sei Mangkei starts operating as planned
Shifted Demand (Domestic Container) from Belawan Port
Based on Stated Preference Analysis
Export-Import only allowed in Kuala Tanjung International
Hub Port
Shifted transshipment from four port competitors

What is Port Centrality Index…
Port Centrality Index is a measure of level of importance (centrality) of a port within its network
Port Centrality Index is computed based on port’s connectivity, i.e routes connecting a port
with another ports… therefore, it is also known as
Port Connectivity IndexThe centrality of a port is not only defined by the number of routes served but also to which other ports it connects with
Ports that serves many routes to relatively small ports has lower centrality index than
ports that serves fewer routes to major ports

What is Port Centrality Index…
Port Centrality Index could also used to measure the network structure
Generally, there are 3 basic network structures, i.e Fully Connected Network, Point-to-Point
Network, and Hub-and-Spoke Network
Hub-and-Spoke System is considered to be the best structure in terms of capacity utilization
Hub-and-Spoke system formed when the Port Centrality Index follows power law distribution

Ilustrasi Perhitungan Port Centrality Index…
λ x = A x(A – λI) x = 0
Adjacency Matrix (A)

JakartaCGK
SurabayaSUB
DenpasarDPS
MakassarUPG
MDCManado
BPNBalikpapan
MedanKNO
BatamBTH
Example: Airport Centrality Index in Indonesia

Facts finding
Statistical analysis demonstrates that the Airport Centrality Index follows power law distribution with exponents ~ 2,235.
The result provides a solid prove that the aviation system in Indonesia operates under hub-and-spoke structure.
Note:If the Airport Centrality Index follows normal distribution, then the aviation system in Indonesia operates under point-to-point structure.
0.1110.2220.3330.4440.5560.6670.7780.8891.0000%
10%
20%
30%
40%
50%
60%
70%
80%
f(x) = 0.618077372258355 x^-2.23518653144993R² = 0.913395447532059
Airport Centrality Index in Indonesia
Airport Centrality Index
Per
cen
tage
of A
irp
ort
s
Airport Centrality Index confirms Hub-and-Spoke System in Aviation Network

Why Power Law…
There is a higher probability that a node with high connectivity exist in a Power Law distribution compared to Normal
distribution
Gauss/ Normal Distribution
Power Law Distribution

BanjarmasinKalimantan Timur
MakassarMakassar
Tg. PerakSurabaya
Tg. PriokJakarta
BelawanMedan
Based on Domestic Cargo Volume
Port Centrality Index in Indonesia

Tg. PriokJakarta Tg. Perak
Surabaya
JayapuraPapua
MakassarMakassar
SorongPapua Barat
Based on Domestic Connectivity
Port Centrality Index in Indonesia
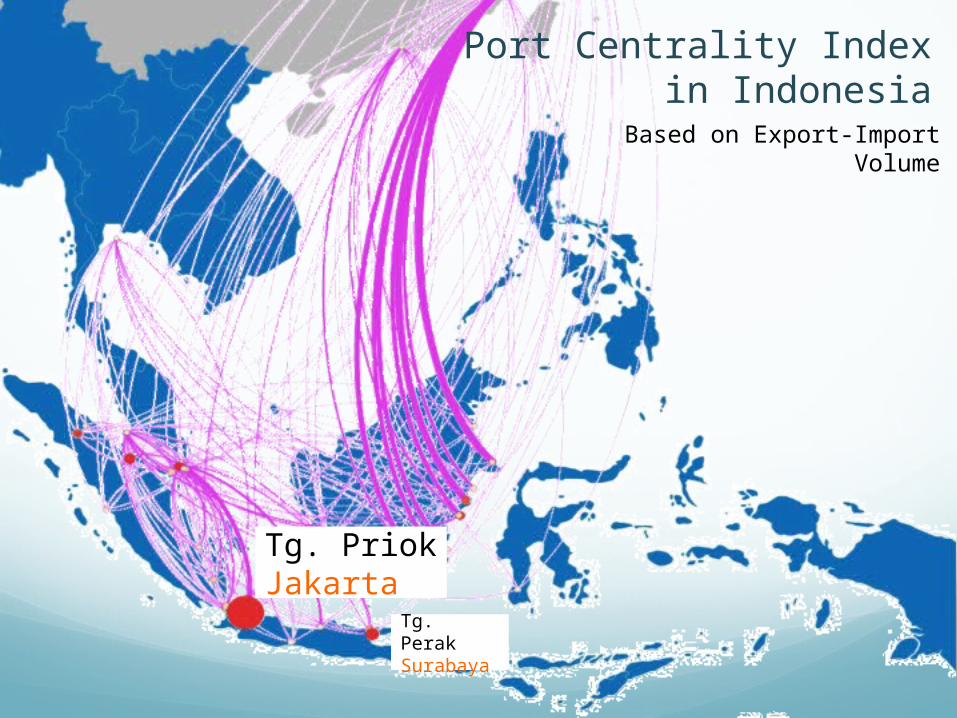
Based on Export-Import Volume
Tg. PriokJakarta
Tg. PerakSurabaya
Port Centrality Index in Indonesia

Based on Export-Import Connectivity
Tg. PriokJakarta
Tg. PerakSurabaya
Port Centrality Index in Indonesia

0.1460.288
0.4300.573
0.7150.858
1.0000%
5%
10%
15%
20%
25%
30%
35%
40%
45%
50%
Centrality Index Distribution of Container Ports in Indonesia
Centrality Index
Freq
uenc
y (%
)
0.091
0.182
0.273
0.364
0.455
0.545
0.636
0.727
0.818
0.909 1
0.00%
10.00%
20.00%
30.00%
40.00%
50.00%
60.00%
70.00%
80.00%
90.00%
Centrality Index Distribution of Export Import Ports in In-
donesia
Centrality Index
Freq
uenc
y (%
)
NOT Hub-and-Spoke
Port Centrality Index Distribution in Indonesia

Selected Market-Based HubsPort Centrality Index Hub Ports
Domestic Volume Tg. Priok
Tg. Perak
Makassar
Belawan
Banjarmasin Domestic Connectivity Tg. Perak
Tg. Priok Jayapura Sorong Makassar
Export Import Volume Tg. Priok Tg. Perak
Export Import Connectivity Tg. Priok Tg. Perak
Tg. PriokTg. PerakKuala TanjungBitung
1
2
3
4
Hubs:
Note:Port of Kuala Tanjung and Port of Bitung are included to satisfy the MP3EI Program issued by the Government of Indonesia (GoI)

Tg. PriokJakarta Tg. Perak
Surabaya
Kuala TanjungMedan Bitung
Manado
New Hub
Existing Hub
Selected Market-Based Hubs

Demand Projection
2015 2016 2017 2018 2022 2027 2032 20420
2,000,000
4,000,000
6,000,000
8,000,000
10,000,000
12,000,000
Liquid Bulk Traffic Projection of Port of Kuala Tanjung
Year
Vol
ume
(Ton
)
2015 2016 2017 2018 2022 2027 2032 20420
5,000,000
10,000,000
15,000,000
20,000,000
25,000,000
30,000,000
35,000,000
Container Traffic Projection of Port of Kuala Tanjung
Year
Vol
ume
(TEU
s)YEAR
CONTAINER VOLUME(TON) (TEUs)
2015 0 02016 0 02017 0 02018 46,127,912 3,294,8512022 111,826,075 8,100,9102027 288,823,610 20,822,2582032 407,795,650 29,334,9272042 429,794,737 30,906,291
Construction Phase
YEAR CPO VOLUME(TON)
2015 02016 02017 02018 4,362,5762022 6,199,3792027 8,726,3572032 10,929,5932042 10,072,376
Construction Phase
Conclusion
2015 2016 2017 2018 2022 2027 2032 20420
5,000,000
10,000,000
15,000,000
20,000,000
25,000,000
30,000,000
35,000,000
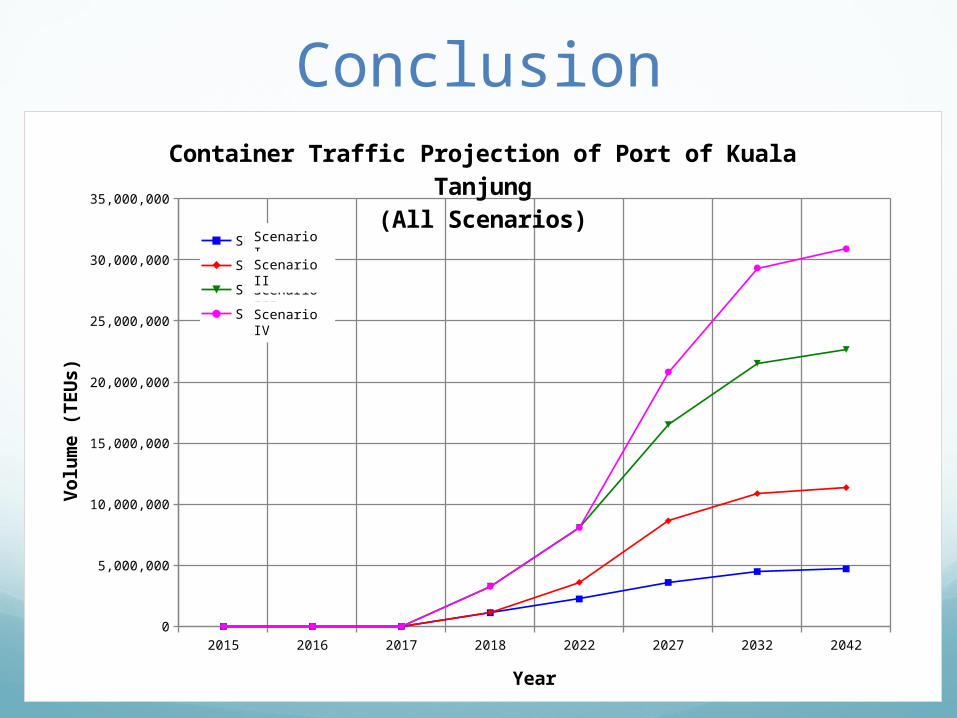
Container Traffic Projection of Port of Kuala Tanjung(All Scenarios)
Skenario ISkenario IISkenario IIISkenario IV
Year
Vol
ume
(TEU
s)
Scenario I
Scenario III
Scenario II
Scenario IV

ConclusionScenario II is considered as the best alternative because of the following:• Empirical evidence shows that dedicating a berth to
private parties, such as major shipping lines, will have significant positive impact in ensuring the port’s demand
• Export-import restriction policy is a challenging and problematic issue to be implemented
• The quality of the land transport system plays an important role in the demand shifting. With the high degree of uncertainty surrounding the land transport system development in Sumatera (such as TransSumatera Toll Road, TransSumatera Railways, etc.), the assumption of shifted generated demand from the entire Sumatera is considered unrealistic

Thank you…