Study of Massive Timber Walls based on NLT and …...ASTM D2395-17, based on oven dried weight and...
35
UBC TEAM REPORT: TEAM 2017-07 Timber Engineering and Applied Mechanics (TEAM) Laboratory #1901 - 2424 Main Mall, Vancouver, B.C. Canada V6T 1Z4; Tel: (604) 822-8137 Fax: (604) 822-9159 Study of Massive Timber Walls based on NLT and Post Laminated LVL by Chao (Tom) Zhang George Lee Dr. Frank Lam Prepared for Forestry Innovation Investment 1130 W Pender St, Vancouver BC V6E 4A4 Timber Engineering and Applied Mechanics (TEAM) Laboratory Department of Wood Science Faculty of Forestry University of British Columbia Vancouver, B.C., Canada April 6, 2018 TL-333
Transcript of Study of Massive Timber Walls based on NLT and …...ASTM D2395-17, based on oven dried weight and...

UBC TEAM REPORT: TEAM 2017-07
Timber Engineering and Applied Mechanics (TEAM) Laboratory
#1901 - 2424 Main Mall, Vancouver, B.C. Canada V6T 1Z4; Tel: (604) 822-8137 Fax: (604) 822-9159
Study of Massive Timber Walls based on NLT and Post
Laminated LVL
by
Chao (Tom) Zhang
George Lee
Dr. Frank Lam
Prepared for
Forestry Innovation Investment
1130 W Pender St, Vancouver
BC V6E 4A4
Timber Engineering and Applied Mechanics
(TEAM) Laboratory
Department of Wood Science
Faculty of Forestry
University of British Columbia
Vancouver, B.C., Canada
April 6, 2018 TL-333

UBC TEAM REPORT: TEAM 2017-07
UBC TEAM REPORT: TEAM 2017-07 PAGE 2/35
EXECUTIVE SUMMARY
Currently the massive timber shear walls are mainly made from Cross Laminated Timber
(CLT), which possesses a high in-plane shear strength and rigidity. But only part of its
elements (mainly the vertically aligned laminae) are engaged in carrying the vertical load
and that could be a limitation when designing taller timber structures or wherever higher
vertical load is present. This project studied alternative solutions to massive timber shear
wall system, based on Nailed Laminated Timber (NLT) and post laminated LVL
(Laminated Veneer Lumber).
The test was conducted on three levels: shear test on glue/nail line, bending-shear test on a
small element, and full size wall test under lateral loading. The former two tests
investigated the properties of basic elements in NLT and post laminated LVL. The results
were used to design and predict the performance of full size shear walls.
The NLT walls were tested under two conditions: without sheathing and with plywood
sheathing. The wall without sheathing had the lowest load-carrying capacity and lowest
stiffness. Adding plywood sheathing significantly increased its strength and stiffness. The
failure in the wall with sheathing was at the sheathing connections, in the forms of nail
withdrawal, nail head pull through, and nail breakage. The NLT wall with sheathing had a
peak load up to 60% higher than the comparable light wood frame wall, also with a higher
stiffness and better ductility. NLT shear walls have an internal energy dissipating capacity
which CLT and post laminated LVL walls lack.
The post laminated LVL walls behaved as a rigid plate under lateral loading, with little
internal deformation. The failure occurred at the holdowns not within the wall. The size
effect of its shear strength was studied and an equation was developed to calculate the shear
strength of a large size wall plate.
Both products have efficient vertical load bearing mechanism by arranging all elements in
the vertical direction. They may serve as alternative to light wood frame walls or CLT
walls. Some guidelines for the application and design of NLT shear walls and post
laminated LVL shear walls were proposed.
Reported by: Reviewed by:
____________________ __________________ _________________________
Chao (Tom) Zhang George Lee Frank C.F. Lam, Ph.D., P. Eng.
Research Engineer Wood Engineering Scientist Professor

UBC TEAM REPORT: TEAM 2017-07
UBC TEAM REPORT: TEAM 2017-07 PAGE 3/35
TABLE OF CONTENTS
EXECUTIVE SUMMARY .............................................................................................. 2
Table of Contents ................................................................................................................ 3
List of Tables ...................................................................................................................... 5
List of Figures ..................................................................................................................... 6
1 Introduction ................................................................................................................. 8
2 Material and Methods ................................................................................................. 8
2.1 Nail Laminated Timber ............................................................................................ 9
2.1.1 Nail connection test....................................................................................... 9
2.1.2 NLT bending-shear test................................................................................. 9
2.1.3 Full size NLT wall test ................................................................................ 11
2.2 Post Laminated LVL .............................................................................................. 13
2.2.1 Block shear test and bending shear test ...................................................... 13
2.2.2 Full size post laminated LVL wall test ....................................................... 15
3 Results and Discussions ............................................................................................ 16
3.1 Nail Laminated Timber .......................................................................................... 16
3.1.1 Nail connection test..................................................................................... 16
3.1.2 Bending shear test ....................................................................................... 17
3.1.3 Full size NLT wall test ................................................................................ 19
3.2 Post laminated LVL ............................................................................................... 19
3.2.1 Block shear and bending shear tests ........................................................... 19
3.2.2 Full size post laminated LVL wall test ....................................................... 21
3.3 Further discussions................................................................................................. 25
3.3.1 Application and design of NLT shear wall ................................................. 25
3.3.2 Application and design of post laminated LVL shear wall......................... 26
4 Conclusions ............................................................................................................... 27
5 Acknowledgements ................................................................................................... 27

UBC TEAM REPORT: TEAM 2017-07
UBC TEAM REPORT: TEAM 2017-07 PAGE 4/35
6 References ................................................................................................................. 27
Appendix A Specifications of specimens in NLT test ................................................. 29
Appendix B CUREE basic loading protocol ............................................................... 34

UBC TEAM REPORT: TEAM 2017-07
UBC TEAM REPORT: TEAM 2017-07 PAGE 5/35
LIST OF TABLES
Table 1 Material list ............................................................................................................ 8
Table 2 Experimental design for NLT tests ........................................................................ 9
Table 3 Experimental design for post laminated LVL tests ............................................. 13
Table 4 Summary statistics of nail connection test ........................................................... 16
Table 5 Summary of NLT bending shear test results ....................................................... 17
Table 6 Block shear and bending shear test results .......................................................... 19
Table 7 Distribution fitting parameters for shear strength test data .................................. 21
Table 8 Full size wall test results ...................................................................................... 21
Table B- 1 Amplitudes of CUREE basic loading protocol ............................................... 34

UBC TEAM REPORT: TEAM 2017-07
UBC TEAM REPORT: TEAM 2017-07 PAGE 6/35
LIST OF FIGURES
Figure 1 Specimens for nail connection test ..................................................................... 10
Figure 2 Test setup for nail connection test ...................................................................... 10
Figure 3 Specimens for NLT bending-shear test .............................................................. 10
Figure 4 Test setup for NLT Bending shear ..................................................................... 11
Figure 5 NLT wall specimen during manufacturing ......................................................... 12
Figure 6 NLT wall test setup ............................................................................................ 12
Figure 7 Test assembly for NLT wall tests ....................................................................... 13
Figure 8 Block shear test setup ......................................................................................... 14
Figure 9 Post laminated LVL bending-shear test setup .................................................... 14
Figure 10 Post laminated LVL shear wall test setup ........................................................ 15
Figure 11 Failure mode in nail connection test ................................................................. 16
Figure 12 Load-displacement relationship of specimens in nail connection test ............. 17
Figure 13 Load-displacement relationship in NLT bending shear test ............................. 18
Figure 14 Failure of specimens in NLT bending shear test .............................................. 19
Figure 15 Horizontal shear failure in bending shear test .................................................. 20
Figure 16 Cumulative probability plots for shear strength test results ............................. 20
Figure 18 Monotonic test for full size walls ..................................................................... 22
Figure 19 Failure mode of post laminated LVL wall ....................................................... 22
Figure 20 Failure of NLT wall without sheathing ............................................................ 23
Figure 21 Failure of NLT walls with sheathing ................................................................ 24
Figure 22 CUREE reverse cyclic loading test results ....................................................... 24
Figure 23 Reverse cyclic loading backbone curves .......................................................... 25

UBC TEAM REPORT: TEAM 2017-07
UBC TEAM REPORT: TEAM 2017-07 PAGE 7/35
Figure A- 1 Nail connection test specimen with nails parallel to wood grain .................. 29
Figure A- 2 Nail connection test specimen with nails perpendicular to wood grain ........ 29
Figure A- 3 Nail locations for specimens with nails parallel to wood grain .................... 30
Figure A- 4 Nail locations for specimens with nails perpendicular to wood grain .......... 30
Figure A- 5 NLT bending-shear test specimen: nail locations front view ........................ 31
Figure A- 6 NLT bending-shear test specimen: nail locations top view .......................... 31
Figure A- 7 NLT bending-shear test specimen: nail locations for plywood sheathing .... 32
Figure A- 8 NLT wall specimen nailing pattern ............................................................... 32
Figure A- 9 Nailing pattern for plywood sheathing (dotted lines) .................................... 33
Figure B- 1 Loading history for CUREE basic loading protocol .................................................. 34

UBC TEAM REPORT: TEAM 2017-07
UBC TEAM REPORT: TEAM 2017-07 PAGE 8/35
1 INTRODUCTION
Massive timber technology has been widely used in modern timber construction. The shear
wall system in massive timber construction is typically made from Cross Laminated
Timber (CLT). Due to the orthotropic properties of CLT, the in-plane shear strength and
rigidity of the panel tends to be very high, but only the longitudinal plies aligned vertically
are mostly engaged to carry the vertical load. One can argue that this might not be the most
efficient way to handle vertical loads in walls especially for tall timber buildings.
There are alternative massive timber concepts that can be used for shear wall applications,
such as post laminated LVL (Laminated Veneer Lumber), Nailed Laminated Timber
(NLT), Dowel Laminated Timber, post laminated GLT (Glue-Laminated Timber), and
LVL panels. Currently there is little technical information available for designers if they
want to consider using these systems as shear walls. This project studied the feasibility and
performance of massive timber walls based on Nail Laminated Timber (NLT) and post
laminated LVL, in order to identify the potential as well as limitation of these systems.
Both products bear the vertical load more efficiently by aligning all the wood elements in
the vertical direction.
2 MATERIAL AND METHODS
The test was conducted on three levels: shear test on glue/nail line, bending-shear test on a
small element, and full size wall test under lateral loading. The material used in the
manufacturing and testing of the products is shown in Table 1.
Table 1 Material list
Test Item Material
NLT test
Lumber Kiln dried SPF No. 1 & Better 2 by 4 (38 mm by 89 mm)
Nail for connection and
bending-shear test
28° wire weld nails with smooth shank, nominal length 89
mm (3.5 in), nominal diameter 3.3 mm (0.13 in), head offset
Nail for NLT wall test 28° wire weld nails with smooth shank, nominal length 76
mm (3.0 in), nominal diameter 3.0 mm (0.12 in) , head offset
Plywood panel 12.6 mm (0.5 in) thick, Canadian spruce
Nail for plywood 28° wire weld framing nails, nominal length 50 mm (2 in),
nominal diameter 2.9 mm (0.113 in), head offset
Holdowns Simpson Strong-Tie HTT5
Angle brackets Simpson Strong-Tie AE116-R
Post
laminated
LVL test
Post laminated LVL Brisco Fine LineTM Panels, 83 mm (3.25 in) thick
Holdowns Simpson Strong-Tie HTT5
Angle brackets Simpson Strong-Tie AE116-R
Nails for holdowns and
angle brackets 76 mm (3 in) common nail, 3.76 mm (0.148 in) in diameter
UBC TEAM REPORT: TEAM 2017-07
UBC TEAM REPORT: TEAM 2017-07 PAGE 9/35
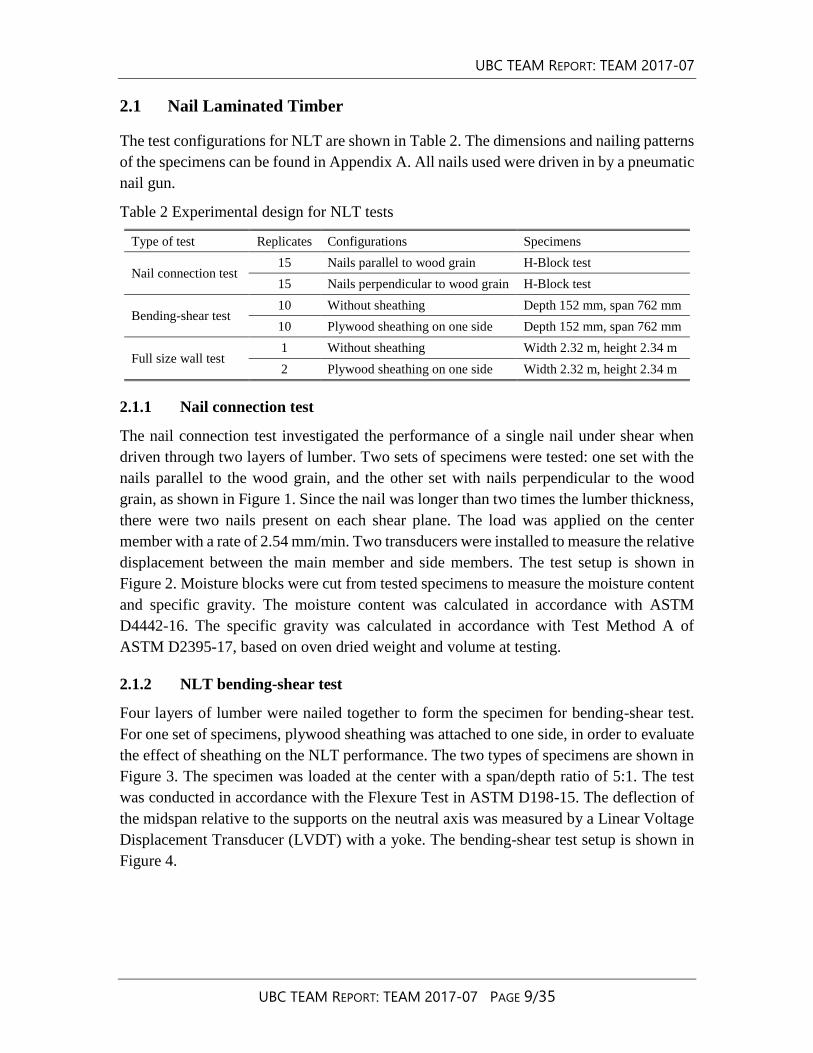
2.1 Nail Laminated Timber
The test configurations for NLT are shown in Table 2. The dimensions and nailing patterns
of the specimens can be found in Appendix A. All nails used were driven in by a pneumatic
nail gun.
Table 2 Experimental design for NLT tests
Type of test Replicates Configurations Specimens
Nail connection test 15 Nails parallel to wood grain H-Block test
15 Nails perpendicular to wood grain H-Block test
Bending-shear test 10 Without sheathing Depth 152 mm, span 762 mm
10 Plywood sheathing on one side Depth 152 mm, span 762 mm
Full size wall test 1 Without sheathing Width 2.32 m, height 2.34 m
2 Plywood sheathing on one side Width 2.32 m, height 2.34 m
2.1.1 Nail connection test
The nail connection test investigated the performance of a single nail under shear when
driven through two layers of lumber. Two sets of specimens were tested: one set with the
nails parallel to the wood grain, and the other set with nails perpendicular to the wood
grain, as shown in Figure 1. Since the nail was longer than two times the lumber thickness,
there were two nails present on each shear plane. The load was applied on the center
member with a rate of 2.54 mm/min. Two transducers were installed to measure the relative
displacement between the main member and side members. The test setup is shown in
Figure 2. Moisture blocks were cut from tested specimens to measure the moisture content
and specific gravity. The moisture content was calculated in accordance with ASTM
D4442-16. The specific gravity was calculated in accordance with Test Method A of
ASTM D2395-17, based on oven dried weight and volume at testing.
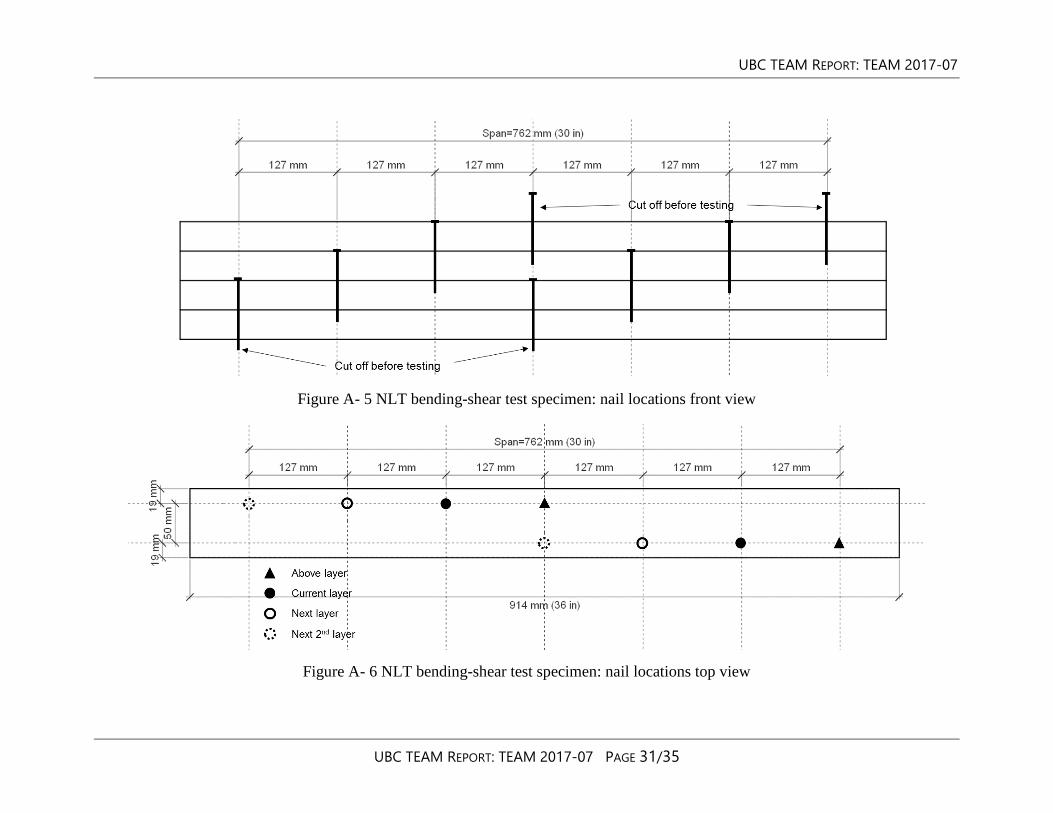
2.1.2 NLT bending-shear test
Four layers of lumber were nailed together to form the specimen for bending-shear test.
For one set of specimens, plywood sheathing was attached to one side, in order to evaluate
the effect of sheathing on the NLT performance. The two types of specimens are shown in
Figure 3. The specimen was loaded at the center with a span/depth ratio of 5:1. The test
was conducted in accordance with the Flexure Test in ASTM D198-15. The deflection of
the midspan relative to the supports on the neutral axis was measured by a Linear Voltage
Displacement Transducer (LVDT) with a yoke. The bending-shear test setup is shown in
Figure 4.

UBC TEAM REPORT: TEAM 2017-07
UBC TEAM REPORT: TEAM 2017-07 PAGE 10/35
Figure 1 Specimens for nail connection test
Figure 2 Test setup for nail connection test
Figure 3 Specimens for NLT bending-shear test
UBC TEAM REPORT: TEAM 2017-07
UBC TEAM REPORT: TEAM 2017-07 PAGE 11/35
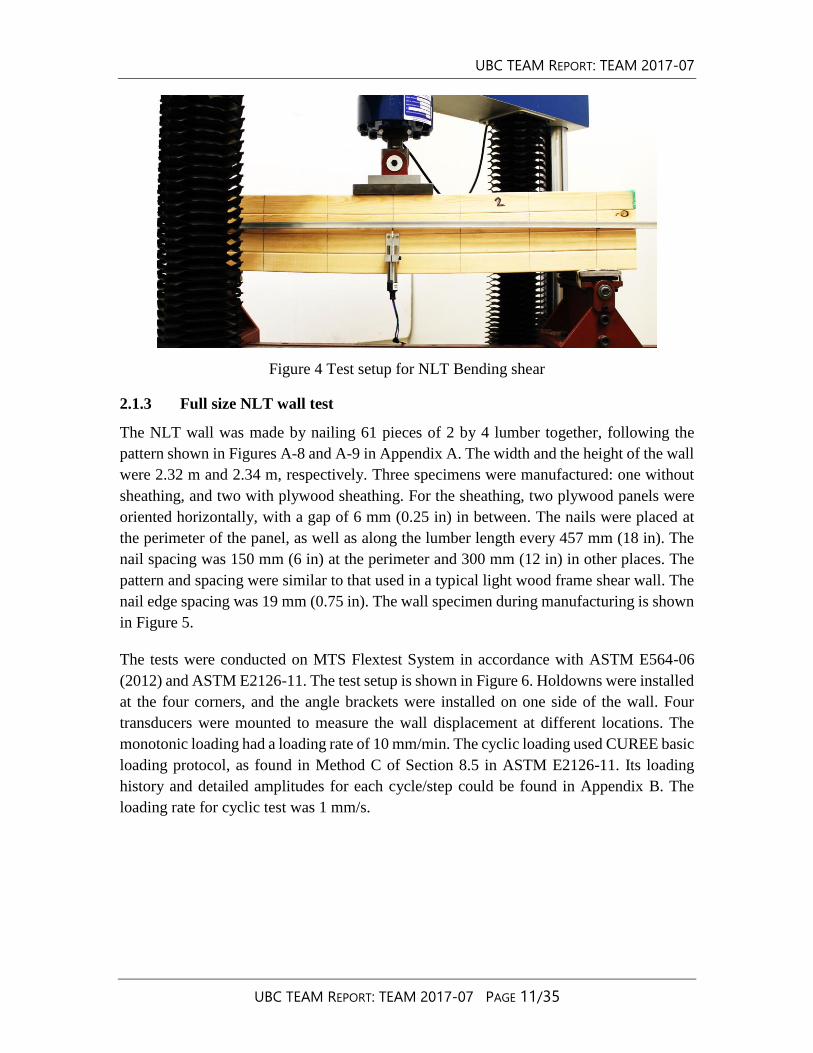
Figure 4 Test setup for NLT Bending shear
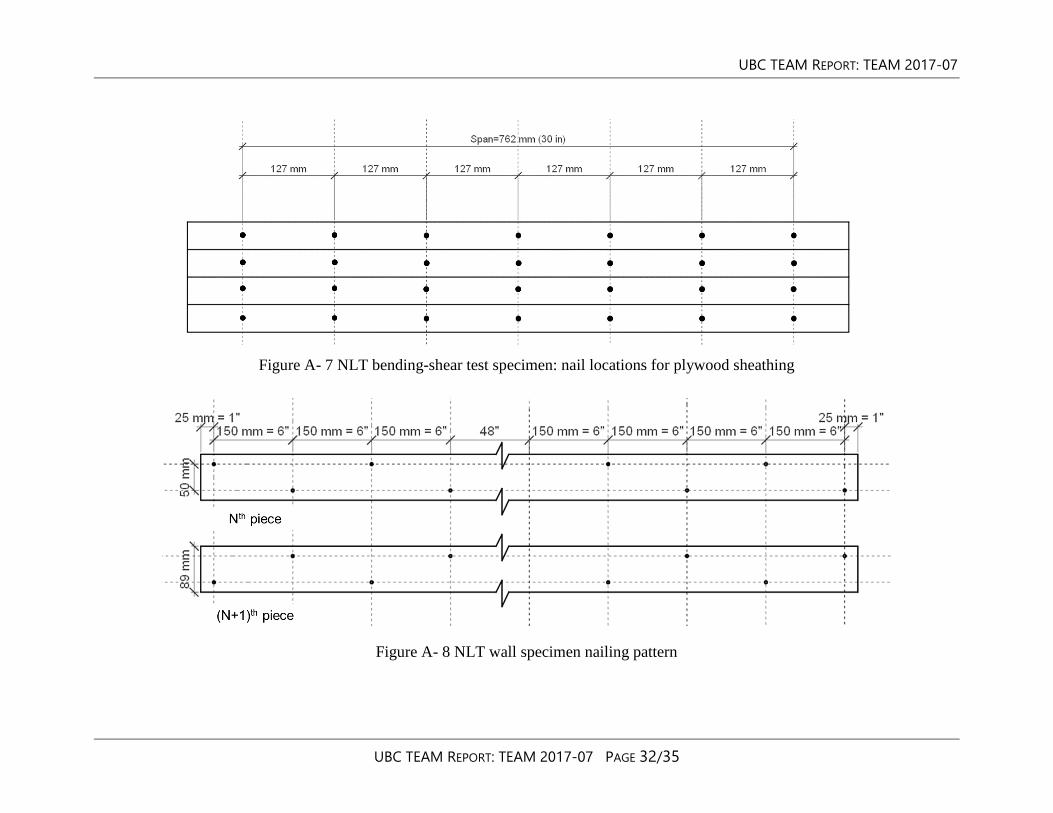
2.1.3 Full size NLT wall test
The NLT wall was made by nailing 61 pieces of 2 by 4 lumber together, following the
pattern shown in Figures A-8 and A-9 in Appendix A. The width and the height of the wall
were 2.32 m and 2.34 m, respectively. Three specimens were manufactured: one without
sheathing, and two with plywood sheathing. For the sheathing, two plywood panels were
oriented horizontally, with a gap of 6 mm (0.25 in) in between. The nails were placed at
the perimeter of the panel, as well as along the lumber length every 457 mm (18 in). The
nail spacing was 150 mm (6 in) at the perimeter and 300 mm (12 in) in other places. The
pattern and spacing were similar to that used in a typical light wood frame shear wall. The
nail edge spacing was 19 mm (0.75 in). The wall specimen during manufacturing is shown
in Figure 5.
The tests were conducted on MTS Flextest System in accordance with ASTM E564-06
(2012) and ASTM E2126-11. The test setup is shown in Figure 6. Holdowns were installed
at the four corners, and the angle brackets were installed on one side of the wall. Four
transducers were mounted to measure the wall displacement at different locations. The
monotonic loading had a loading rate of 10 mm/min. The cyclic loading used CUREE basic
loading protocol, as found in Method C of Section 8.5 in ASTM E2126-11. Its loading
history and detailed amplitudes for each cycle/step could be found in Appendix B. The
loading rate for cyclic test was 1 mm/s.

UBC TEAM REPORT: TEAM 2017-07
UBC TEAM REPORT: TEAM 2017-07 PAGE 12/35
Figure 5 NLT wall specimen during manufacturing
Figure 6 NLT wall test setup

UBC TEAM REPORT: TEAM 2017-07
UBC TEAM REPORT: TEAM 2017-07 PAGE 13/35
Figure 7 Test assembly for NLT wall tests
2.2 Post Laminated LVL
The test configurations for post laminated LVL are shown in Table 3.
Table 3 Experimental design for post laminated LVL tests
Type of test Replicates Configurations Specimens
Glueline shear test 28 ASTM D143-14 Block shear test
Bending-shear test 30 Depth/span ratio 5:1 Depth 76 mm, length 456 mm
Full size wall test 2 Holdowns at four corners Width 1.27 m, height 2.44 m
2.2.1 Block shear test and bending shear test
The block shear test was conducted in accordance with Section 14 of ASTM D143-14, with
a loading speed of 0.6 mm/min. The test setup is shown in Figure 8.
The bending shear test was conducted in accordance with the Flexure Test in ASTM D198-
15. The span/depth ratio was set at 5:1 in order to create shear failure. The specimen was
loaded at the center with a loading rate of 1.4 mm/min. The deflection of the midspan

UBC TEAM REPORT: TEAM 2017-07
UBC TEAM REPORT: TEAM 2017-07 PAGE 14/35
relative to the supports on the neutral axis was measured by a Linear Voltage Displacement
Transducer (LVDT) with a yoke. The nominal dimension of the specimen was 80 mm by
75 mm by 456 mm (width by depth by length). The span was 381 mm. The test setup is
shown in Figure 9. Moisture blocks were cut from tested specimens to measure the
moisture content and specific gravity. The moisture content was calculated in accordance
with ASTM D4442-16. The specific gravity was calculated in accordance with Test
Method A of ASTM D2395-17, based on oven dried weight and volume at testing.
Figure 8 Block shear test setup
Figure 9 Post laminated LVL bending-shear test setup

UBC TEAM REPORT: TEAM 2017-07
UBC TEAM REPORT: TEAM 2017-07 PAGE 15/35
2.2.2 Full size post laminated LVL wall test
The post laminated LVL shear walls had a width of 1.27 m (50 in) and a height of 2.44 m
(96 in). The test configuration was similar to that shown in Figure 6, only with a different
size. One angle bracket was installed on one side of the wall due to its limited width. The
test assembly is shown in Figure 10. Two replicates were tested under monotonic loading.
The loading rate was 10 mm/min.
Figure 10 Post laminated LVL shear wall test setup

UBC TEAM REPORT: TEAM 2017-07
UBC TEAM REPORT: TEAM 2017-07 PAGE 16/35
3 RESULTS AND DISCUSSIONS
3.1 Nail Laminated Timber
The average moisture content of the lumber used in the NLT test was 12.2% (CV 3%), and
the average specific gravity was 0.446 (CV 9%).
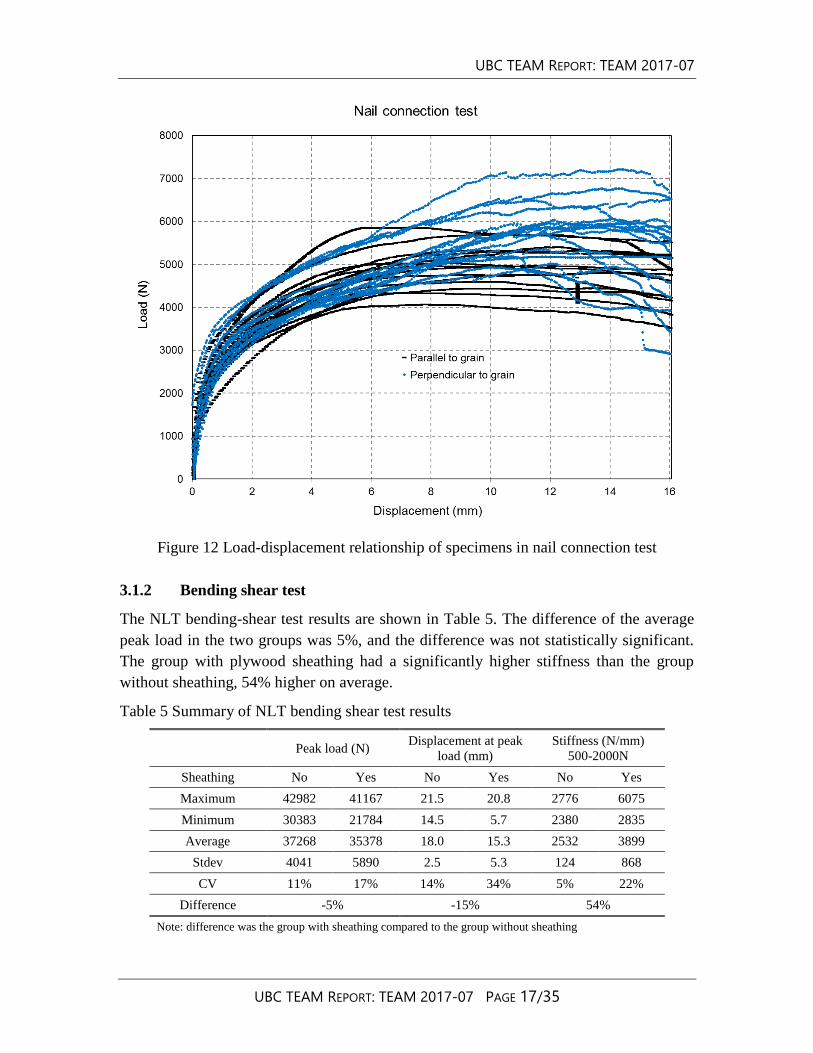
3.1.1 Nail connection test
The nail connection test results are shown in Table 4. The load-displacement relationship
of every specimen is plotted in Figure 12. The specimens with nails perpendicular to grain
had a higher average peak load, and also a higher displacement at peak load. Due to the
high variation of stiffness results, the difference of stiffness between the two groups was
not statistically significant. The nails were bent under lateral load, and at the same time
were pulled out from the wood, as shown in Figure 11. The bending of the nails also
compressed the wood to make the nail pulling out increasingly easier.
Table 4 Summary statistics of nail connection test
Peak load (N)
Displacement at
peak load (mm)
Stiffness (N/mm)
500-2000N
Stiffness (N/mm)
500-4000N
Para Perp Para Perp Para Perp Para Perp
Maximum 5855 7218 14.6 20.6 20920 11678 1867 2677
Minimum 4064 4933 6.3 10.3 2217 3098 540 744
Average 4982 5958 10.0 13.2 7273 6089 1088 1420
Stdev 498 652 2.7 2.7 4849 2411 392 723
CV 10% 11% 27% 20% 67% 40% 36% 51%
Difference 20% 32% -16% 31%
Note: difference was calculated by (average of Perp / average of Para)-1; Para: nails parallel to grain; Perp: nails
perpendicular to grain
Figure 11 Failure mode in nail connection test
UBC TEAM REPORT: TEAM 2017-07
UBC TEAM REPORT: TEAM 2017-07 PAGE 17/35
Figure 12 Load-displacement relationship of specimens in nail connection test
3.1.2 Bending shear test
The NLT bending-shear test results are shown in Table 5. The difference of the average
peak load in the two groups was 5%, and the difference was not statistically significant.
The group with plywood sheathing had a significantly higher stiffness than the group
without sheathing, 54% higher on average.
Table 5 Summary of NLT bending shear test results
Peak load (N) Displacement at peak
load (mm)
Stiffness (N/mm)
500-2000N
Sheathing No Yes No Yes No Yes
Maximum 42982 41167 21.5 20.8 2776 6075
Minimum 30383 21784 14.5 5.7 2380 2835
Average 37268 35378 18.0 15.3 2532 3899
Stdev 4041 5890 2.5 5.3 124 868
CV 11% 17% 14% 34% 5% 22%
Difference -5% -15% 54%
Note: difference was the group with sheathing compared to the group without sheathing

UBC TEAM REPORT: TEAM 2017-07
UBC TEAM REPORT: TEAM 2017-07 PAGE 18/35
The load displacement curves of three specimens with the highest peak loads in each group
were plotted in Figure 13. For the specimens with sheathing, the load dropped several times
before eventually reaching the peak load, as a result of the plywood fracture under tension.
Both groups had brittle failure mode caused by the failure of lumber/plywood on the
tension side, as shown in Figure 14. The nails were deformed under shear, as indicated by
the relative movement between adjacent lumber elements. But that deformation was
generally recovered after the load was released. No significant nail deformation was found
after taking the tested specimens apart. The plywood failure mode indicates that this
bending test configuration is not appropriate for getting the load slip behavior of the nail
connection in NLT. The results showed that adding plywood sheathing would significantly
increase the stiffness of the NLT.
Figure 13 Load-displacement relationship in NLT bending shear test

UBC TEAM REPORT: TEAM 2017-07
UBC TEAM REPORT: TEAM 2017-07 PAGE 19/35
Figure 14 Failure of specimens in NLT bending shear test
3.1.3 Full size NLT wall test
The test results of full size NLT are presented in Section 3.2.2, together with the results of
post laminated LVL walls.
3.2 Post laminated LVL
The average moisture content of post laminated LVL specimens was 8.1% (CV 2%). The
average specific gravity was 0.517 (CV 4%).
3.2.1 Block shear and bending shear tests
The test results for block shear test and bending shear test are shown in Table 6. The
average shear strength was 6.35 MPa for block shear test, and 4.84 MPa for bending shear
test. The block shear group had a higher coefficient of variation, 27% compared to 9% of
the bending shear group. All specimens in the bending shear test failed in horizontal shear,
as shown in Figure 15.
Table 6 Block shear and bending shear test results
Block shear test Bending shear test
Peak load
(kN)
Shear strength
(MPa)
Peak load
(kN)
Shear strength
(MPa)
Maximum 21.8 11.40 45.3 5.65
Minimum 6.8 3.55 30.0 3.74
Average 12.1 6.35 38.9 4.84
Stdev 3.3 1.74 3.4 0.42
CV 27% 27% 9% 9%

UBC TEAM REPORT: TEAM 2017-07
UBC TEAM REPORT: TEAM 2017-07 PAGE 20/35
Figure 15 Horizontal shear failure in bending shear test
The cumulative probability plots for the two groups are shown in Figure 16, with another
set of data obtained from TEAM database. This additional data was from a bending shear
test on the same product (bending shear #1 in the figure). The nominal dimensions of the
specimens were: 2134 mm long, 241 mm wide, and 267 mm deep. The span was 1867 mm
with a span/depth ratio of 7:1. The load applied at two points in the center with 475 mm in
between.
Figure 16 Cumulative probability plots for shear strength test results
Lognormal distribution (black) and 2P Weibull distribution (blue) were fitted to every data
set. The distribution parameters are shown in Table 7. For the block shear test data,

UBC TEAM REPORT: TEAM 2017-07
UBC TEAM REPORT: TEAM 2017-07 PAGE 21/35
lognormal distribution was much better. For the bending shear test data, 2P Weibull
distribution was slightly better, especially at the tails. The two sets of bending shear data
had similar shape (similar CV as well) and they differed mainly on the location in the plot.
Table 7 Distribution fitting parameters for shear strength test data
Data set Block shear Bending shear #1 Bending shear #2
Distribution Lognormal 2P Weibull Lognormal 2P Weibull Lognormal 2P Weibull
Mean/ Scale 1.81 7.00 1.14 3.33 1.57 5.02
Stdev/ Shape 0.27 3.78 0.16 9.22 0.09 12.77
3.2.2 Full size post laminated LVL wall test
The full size wall test results are shown in Table 8. The load-displacement relationship of
the monotonic test is shown in Figure 17. The data of two light wood frame shear walls
was obtained from TEAM database for comparison (LFW-01 and 02 in Table 8). It is to be
noted that post laminated LVL walls (LVL-01 and 02 in Table 8) had only about half the
size of the rest walls (see Tables 2 and 3). Therefore one can also examine the capacity
with respective to the shear wall width to gain a more direct comparison between LVL
walls and other walls.
Table 8 Full size wall test results
Wall Sheathing Loading
protocol
Peak Load
(kN)
Displacement at
Peak load (mm) Failure mode
LVL-01 N/A Monotonic 35.4 42.8 Holdowns
LVL-02 N/A Monotonic 36.0 41.0 Holdowns
NLT-01 N/A Monotonic 20.8* 166.5* Load did not decrease
NLT-02 Plywood Monotonic 40.1 75.0 Connection with sheathing
NLT-03 Plywood CUREE 32.9 80.3 Connection with sheathing
LFW-01 Plywood Monotonic 24.5 72.0 Connection with sheathing
LFW-02 Plywood CUREE 26.8 58.9 Connection with sheathing
Note: LFW- light wood frame wall, 2×4 Douglas fir, width 2.4 m, length 2.4 m
*: since the load did not decrease, these were the values when the test was stopped
Post laminated LVL walls had high strength and high stiffness, with a small variation
between the two replicates. The shear stress was low, estimated to be 0.34 MPa under a
peak load of 35-36 kN. The wall behaved as a rigid plate with little internal deformation.
The diagonal transducer recorded a deformation of 0.3 mm at peak load in one wall and
0.1 mm in the other, compared to the original diagonal length of 2750 mm. The
displacement of the wall mainly came from the holdown under high uplifting force. The
holdown at the near end deformed and the nails were being pulled out of the wood, as
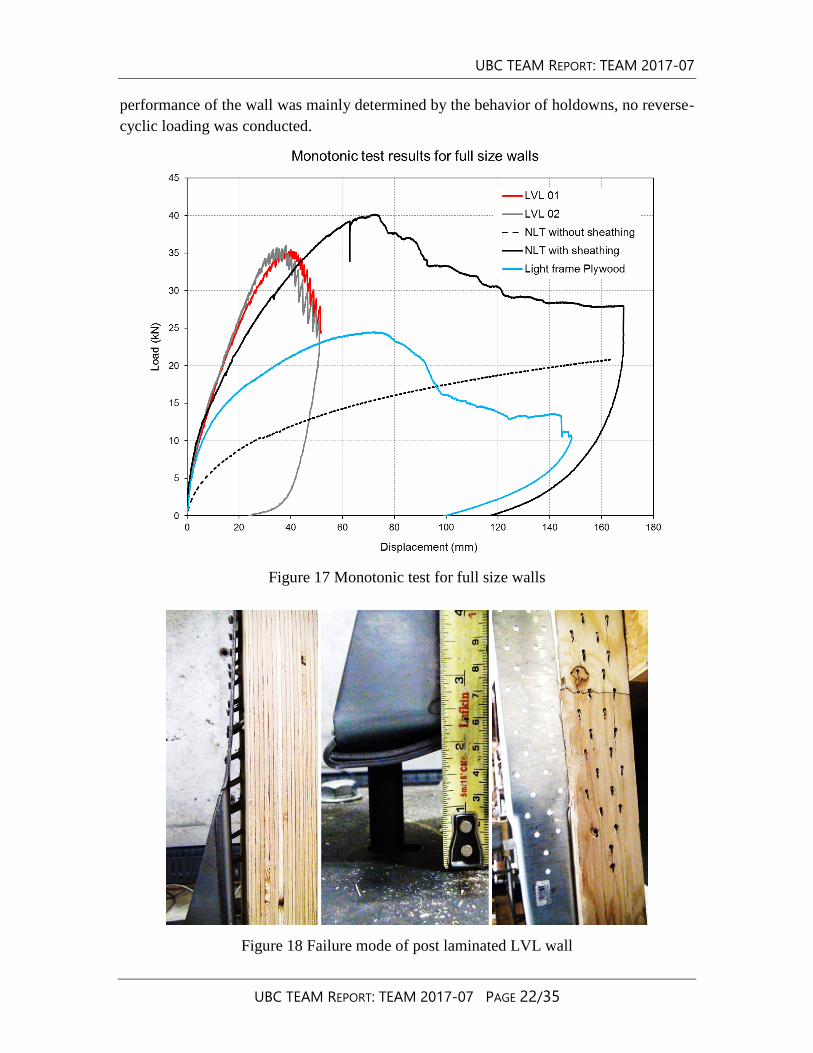
shown in Figure 18. It was the nail pulling out that caused the drop from peak load. No
visible failure was observed in the holdown at the far end or in the angle bracket. Since the
UBC TEAM REPORT: TEAM 2017-07
UBC TEAM REPORT: TEAM 2017-07 PAGE 22/35
performance of the wall was mainly determined by the behavior of holdowns, no reverse-
cyclic loading was conducted.
Figure 17 Monotonic test for full size walls
Figure 18 Failure mode of post laminated LVL wall

UBC TEAM REPORT: TEAM 2017-07
UBC TEAM REPORT: TEAM 2017-07 PAGE 23/35
Figure 19 Failure of NLT wall without sheathing
The NLT wall without sheathing (NLT-01) had the lowest load-carrying capacity and the
lowest stiffness, although the load did not decrease within the tested displacement. The
lateral load applied was resisted by the nails between adjacent pieces of lumber. At the far
end upper corner, some nails were pulled out, partly as a result of the lumber buckling
under compression; the shear shifting of adjacent lumber elements was observed in other
parts of the specimen, as shown in Figure 19.
Adding sheathing to the NLT wall significantly increased its strength and stiffness, as
suggested by the previous bending shear test. Under monotonic loading, the NLT wall with
sheathing had a much higher peak load than the light wood frame wall; and the two walls
reached the peak load at similar displacements. The failure in the NLT wall with sheathing
occurred at the connection between the lumber and sheathing, as commonly found in the
light wood frame walls. Depending on the location in the panel, nail withdrawal, nail head
pull through, and nail breakage occurred, as shown in Figure 20.
The cyclic test results are shown in Figures 21 and 22. Two monotonic test specimens are
also included in Figure 22 for comparison. The NLT wall with sheathing still had higher
load and stiffness than the light wood frame wall, although the difference was reduced. The
NLT wall had better ductility, especially in the reverse cyclic tests. The area under the
backbone curve was 5086 kN∙mm for the NLT wall, about 30% higher than that of light
wood frame wall, 3907 kN∙mm.

UBC TEAM REPORT: TEAM 2017-07
UBC TEAM REPORT: TEAM 2017-07 PAGE 24/35
Figure 20 Failure of NLT walls with sheathing
Figure 21 CUREE reverse cyclic loading test results

UBC TEAM REPORT: TEAM 2017-07
UBC TEAM REPORT: TEAM 2017-07 PAGE 25/35
Figure 22 Reverse cyclic loading backbone curves
3.3 Further discussions
3.3.1 Application and design of NLT shear wall
The manufacturing of NLT shear wall does not require sophisticated equipment or highly
skilled labor. Depending on the size and demand, it could be prefabricated in a factory or
simply assembled on-site. The cost of NLT is lower than most massive timber products,
and the design of NLT is well recognized in the building code. The thickness of NLT wall
ranges from 89 mm to 450 mm by using dimensional lumber. Finger joint connection can
be used to make longer elements. Alternatively the use of butt joint elements can also be
tried although the consideration of uplift forces must be verified. The width and length thus
will be mainly determined by the equipment, working space, and transportation.
Compared to light wood frame shear wall, NLT shear wall has higher lateral resistance,
higher stiffness, better seismic performance, and much higher vertical load bearing
capacity. Above all, since NLT is a massive timber product, its performance under fire is
different from a light wood frame wall. The burning of wood on the surface generates a
layer of charring protecting the wood below. Thus NLT shear walls may be used to increase
the building safety under fire by replacing light wood frame walls at critical locations of a
building. A well design NLT wall can also be exposed or be formed into curved shape,
creating unique aesthetic effect.

UBC TEAM REPORT: TEAM 2017-07
UBC TEAM REPORT: TEAM 2017-07 PAGE 26/35
Compared to CLT, NLT shear wall has higher vertical load bearing capacity and stiffness,
although its lateral resistance appears to be lower even with sheathing. The NLT shear wall
has an internal energy dissipating mechanics which CLT lacks: between lumber elements
and between lumber and sheathing. This energy dissipating capacity may be important in
some applications, since the demand on the connectors, as well as the potential damage to
adjacent structural elements is significantly reduced.
The design of NLT lateral resistance can be divided into two parts: the lateral resistance
provided by the NLT elements alone, and the resistance provided by the sheathing. The
latter part is similar to that of a traditional light wood frame wall, and the number of nails,
nail spacing could be adjusted according to the demand. The lateral resistance capacity of
NLT elements may be calculated based on the test results of single nail connections, and
the nailing pattern used. To ignore its contribution is not recommended since that will
dramatically reduce the competitiveness of this product. When the NLT wall with
sheathing reached the peak load in this test, the lateral load resistance provided by the NLT
elements was estimated to be 33% of the total on average (38% in the monotonic loading
and 27% in the cyclic loading).
3.3.2 Application and design of post laminated LVL shear wall
Post laminated LVL has a higher compressive strength and stiffness than CLT. The
compressive strength parallel to grain is 35.2 MPa and the Modulus of Elasticity is 13.8
GPa (Brisco 2018). The thickness is up to 292 mm (11.5 in), close to a common 9 layer
CLT. Its width is up to 1.2 m (48 in), and its length is up to 18 m (60 ft).
Since the design of CLT only considers the longitudinal layers under compression, post
laminated LVL is more suitable to bear high vertical load, especially in taller timber
buildings. The post laminated shear wall behaves as a rigid plate under lateral loading,
which is similar to CLT. The displacement of the wall mainly comes from the deformation
at connections.
One critical design criteria for post laminated LVL walls is the shear strength, which may
be the governing factor for a large, tall wall plate. The height/width ratio of the wall tends
to be higher than that of CLT. The size effect of shear stress in post laminated LVL walls
may be obtained from the test results based on Weibull Weakest Link principles. The
current connection techniques for CLT could be adopted in the application of post
laminated LVL walls. The connection design needs to pay particular attention to the
presence of tension perpendicular to grain stresses, as such certain reinforcements may be
considered, for example, using self-tapping wood screws.
Post laminated LVL walls have an elegant surface created by thin layers of veneers. And
the surface is wear and abrasion resistant due to its veneer alignment. Its fire resistance is
equivalent to that of CLT, with an estimated charring rate of 0.68 mm/min (Brisco 2018).

UBC TEAM REPORT: TEAM 2017-07
UBC TEAM REPORT: TEAM 2017-07 PAGE 27/35
4 CONCLUSIONS
The feasibility and performance of massive timber shear walls based on NLT and post
laminated LVL were investigated in this project.
The NLT wall without sheathing had the lowest load-carrying capacity and lowest stiffness.
Adding sheathing to the NLT wall significantly increased its strength and stiffness. The
failure in the NLT wall with sheathing was similar to that found in the light wood frame
walls: at the connections between the sheathing and lumber, in the forms of nail
withdrawal, nail head pull through, and nail breakage. The NLT wall with sheathing had a
peak load up to 60% higher than the light wood frame wall of the same size. The internal
energy dissipating capacity is one advantage of NLT shear walls, which will significantly
reduce the damage to adjacent structures and connections. As a massive timber product,
NLT shear walls are able to provide good fire safety even when exposed.
The post laminated LVL walls behaved as a rigid plate under lateral loading, with little
internal deformation. The failure occurred at the holdowns: the metal deformed and the
nails were pulled out of the wood. An equation was developed from test data to calculate
the size effect of its shear strength.
Both products have efficient vertical load bearing mechanism by arranging all elements in
the vertical direction. They may serve as alternative to light wood frame walls or CLT
walls. Some guidelines for the application and design of NLT shear walls and post
laminated LVL shear walls were proposed.
5 ACKNOWLEDGEMENTS
This research project was financially supported by Forestry Innovation Investment Ltd.
(FII). The material support from Brisco Manufacturing Ltd. is gratefully acknowledged.
6 REFERENCES
ASTM D143-14, Standard Test Methods for Small Clear Specimens of Timber, ASTM
International, West Conshohocken, PA, 2014, www.astm.org
ASTM D198-15, Standard Test Methods of Static Tests of Lumber in Structural Sizes,
ASTM International, West Conshohocken, PA, 2015, www.astm.org
ASTM D2395-17, Standard Test Methods for Density and Specific Gravity (Relative
Density) of Wood and Wood-Based Materials, ASTM International, West Conshohocken,
PA, 2017, www.astm.org
ASTM D4442-16, Standard Test Methods for Direct Moisture Content Measurement of
Wood and Wood-Based Materials, ASTM International, West Conshohocken, PA, 2016,
www.astm.org

UBC TEAM REPORT: TEAM 2017-07
UBC TEAM REPORT: TEAM 2017-07 PAGE 28/35
ASTM E564-06 (2012), Standard Practice for Static Load Test for Shear Resistance of
Framed Walls for Buildings, ASTM International, West Conshohocken, PA, 2012,
www.astm.org
ASTM E2126-11, Standard Test Methods for Cyclic (Reversed) Load Test for Shear
Resistance of Vertical Elements of the Lateral Force Resisting Systems for Buildings,
ASTM International, West Conshohocken, PA, 2011, www.astm.org
Brisco (2018). Fine LineTM Prelim Specs Sheet. Rev.1.14. Effective Jan 2018. Brisco
Manufacturing Ltd. Brisco, BC. www.briscoman.com

UBC TEAM REPORT: TEAM 2017-07
UBC TEAM REPORT: TEAM 2017-07 PAGE 29/35
Appendix A Specifications of specimens in NLT test
Figure A- 1 Nail connection test specimen with nails parallel to wood grain
Figure A- 2 Nail connection test specimen with nails perpendicular to wood grain

UBC TEAM REPORT: TEAM 2017-07
UBC TEAM REPORT: TEAM 2017-07 PAGE 30/35
Figure A- 3 Nail locations for specimens with nails parallel to wood grain
Figure A- 4 Nail locations for specimens with nails perpendicular to wood grain
UBC TEAM REPORT: TEAM 2017-07
UBC TEAM REPORT: TEAM 2017-07 PAGE 31/35
Figure A- 5 NLT bending-shear test specimen: nail locations front view
Figure A- 6 NLT bending-shear test specimen: nail locations top view
UBC TEAM REPORT: TEAM 2017-07
UBC TEAM REPORT: TEAM 2017-07 PAGE 32/35
Figure A- 7 NLT bending-shear test specimen: nail locations for plywood sheathing
Figure A- 8 NLT wall specimen nailing pattern

UBC TEAM REPORT: TEAM 2017-07
UBC TEAM REPORT: TEAM 2017-07 PAGE 33/35
Figure A- 9 Nailing pattern for plywood sheathing (dotted lines)

UBC TEAM REPORT: TEAM 2017-07
UBC TEAM REPORT: TEAM 2017-07 PAGE 34/35
Appendix B CUREE basic loading protocol
Figure B- 1 Loading history for CUREE basic loading protocol
Table B- 1 Amplitudes of CUREE basic loading protocol
Step Number of cycles Amplitude
(mm)
1 Equal 6 3.0
2 Primary 1 4.5
Secondary 6 3.4
3 Primary 1 6.0
Secondary 6 4.5
4 Primary 1 12.0
Secondary 3 9.0
5 Primary 1 18.0
Secondary 3 13.5
6 Primary 1 24.0
Secondary 2 18.0
7 Primary 1 42.0
Secondary 2 31.5
8 Primary 1 60.0
Secondary 2 45.0
9 Primary 1 78.0
Secondary 2 58.5
10 Primary 1 96.0
Secondary 2 72.0

UBC TEAM REPORT: TEAM 2017-07
UBC TEAM REPORT: TEAM 2017-07 PAGE 35/35
THE END