Using geophysical methods to characterize an abandoned uranium ...
Final Report
STUDY METHODS TO CHARACTERIZE AND IMPLEMENT THERMOGRAPHY
NONDESTRUCTIVE EVALUATION (NDE)
Contract Number: NAS8-97095
Task: H-28166D
Principle Investigator
James L. Walker
Center for Automation and Robotics
University of Alabama in Huntsville
Huntsville, AL 35899
(256)-890-6578*207
Submitted to
Samuel S. Russell
EH13
National Aeronautics and Space Administration
Marshall Space Flight Center, AL 35812
(256)-544-4411
October, 1998

TABLE OF CONTENTS
Section Page!
ABSTRACT ..................................................................................................................................... zL
1.0 INTRODUCTION .................................................................................................................... 5
2.0 THERMOGRAPHIC QUALIFICATION OF GRAPHITE/EPOXY INSTRUMENTATION
RACKS ..................................................................................................................................... 7
2.1 EXPERIMENTAL ................................................................................................................ 8
2.1.1 IMPACT DAMAGE ASSESSMENT ........................................................................... 8
2.1.2 POROSITY AND INCLUSIONS ................................................................................ 10
2.2 DISCUSSION OF RESULTS ............................................................................................ 11
2.2.1 IMPACT DAMAGE ASSESSMENT ......................................................................... 11
2.2.2 POROSITY AND INCLUSIONS ................................................................................ 12
2.2.2.1 Results using the Amber Radiance 1/TWI system ............................................... 12
2.2.2.2 Results Using The Bales Scientific Thermal Image Processor ............................. 16
2.3 CONCLUSIONS ................................................................................................................ 17
3.0 THERMOGRAPHIC INSPECTION OF THE SPACE SHUTTLE MAIN ENGINE
NOZZLE ................................................................................................................................. 18
3.1 DISBOND BETWEEN TUBES AND JACKET ............................................................... 18
3.2 DRILLED HOLE BETWEEN HAT BANDS 8 AND 9 .................................................... 19
3.3 INTERSTITIAL LEAKS AT THE NINTH HAT BAND .................................................. 23
3.4 THERMOGRAPHY OF SSME4 ........................................................................................ 25
3.4.1 INTENTIONAL WELD DEFECTS ............................................................................ 25
3.4.2 COMPARISON OF THERMAL RESPONSE AT THREE PRESSURE LEVELS ...27
3.5 PAN, TILT AND FOCUS UNIT FOR INSPECTION OF SSME NOZZLE .................... 29
4.0 TEST PANEL DESIGN FOR THE SPACE SHUTTLE CARGO BAY DOORS ................. 34
4.1 TEST PANEL H1 ............................................................................................................... 34
4.2 TEST PANEL H2 ............................................................................................................... 36
4.3 TEST PANEL H3 ............................................................................................................... 38
5.0 MIKRON-AMBER CORRELATION .................................................................................... 41
6.0 THERMOGRAPHIC INSPECTION OF GRAPHITE/EPOXY LOW PROFILE DOME .... 44
7.0 THERMOGRAPHIC INSPECTION OF GRAPHITE/EPOXY PANELS FOR THIOKOL.51

8.0
9.0
9.1
9.2
9.3
THERMOGRAPHICINSPECTIONOFGRAPHITEPANELSFORLOCKHEED-MARTIN .................................................................................................................................58
SOLID ROCKET BOOSTERNOSECAP............................................................................60
THERMOGRAPHY OFSRBCOUPONS.........................................................................60
THERMOGRAPHYOF GRAPHITE/CYANIDEESTERPANEL ..................................60
THERMOGRAPHY OFHG-10.........................................................................................61
9.4 HOT GASPANELS(HG15,HG16,HG17,HG18,HG19,HG20)...................................62
9.5 HOT GASPANEL SC350AND SCGLASS.....................................................................65
9.6 HOT GASPANEL EX1542AND F650BMI (POSTTREATMENT) ..............................66
10.0 X-38 PANEL #9 ...................................................................................................................68
11.0 GRAPHITE/EPOXYDEBRISIMPACT PANELS(PRE-IMPACT).................................74

ABSTRACT
The limits and conditions under which an infrared thermographic nondestructive evaluation can
be utilized to assess the quality of aerospace hardware is demonstrated in this research effort.
The primary focus of this work is on applying thermography to the inspection of advanced
composite structures such as would be found in the International Space Station Instrumentation
Racks, Space Shuttle Cargo Bay Doors, Bantam RP-1 tank or RSRM Nose Cone. Here, the
detection of delamination, disbond, inclusion and porosity type defects are of primary interest.
In addition to composites, an extensive research effort has been initiated to determine how well a
thermographic evaluation can detect leaks and disbonds in pressurized metallic systems "i.e. the
Space Shuttle Main Engine Nozzles".
In either case, research into developing practical inspection procedures was conducted and
thermographic inspections were performed on a myriad of test samples, subscale demonstration
articles and "simulated" flight hardware. All test samples were fabricated as close to their
respective structural counterparts as possible except with intentional defects for NDE
qualification. As an added benefit of this effort to create simulated defects, methods were
devised for defect fabrication that may be useful in future NDE qualification ventures.
4

1.0 INTRODUCTION
Theprocessof taking infraredthermography(IRT) out of the labandimplementingit for the
nondestructiveevaluation(NDE) of advancedaerospacestructurescanbeacomplextask.
Specialattentionmustbegivento determiningtheexperimentallimits andconditionswhich
controlthe ability to performavalid inspection.By characterizingandstandardizingthethermal
inspectionprocess,factorssuchasmeasurementrepeatabilityandreliability, defectsize
resolutionandeaseof datainterpretationcanbemoreeffectivelydealtwith.
ThermographicNDE asit appliesto structural"wellness"testingallowssubsurface
abnormalitiesto bevisuallydetectedthroughvariationsin surfacetemperaturearisingfrom the
internaldistortionof anexternallyapplied"injected" heatfield, suchasfrom an flash lamp. The
principleadvantagesof IRT overotherNDE approachesis that themeasurementcanbemade"at
distance",requiringnodirect contactwith thestructureandcanprovidecoverageoverrelatively
largesurfaceareas.Thelimitation on thesizeof theareato be testedvariesprimarily with the
sizeof thedefectto be locatedandthegeometry/materialof thestructure.
Thedevelopmentof thethermographicmethodfor applicationto inspectionof aerospace
structuresis accomplishedby first estimatingthetype,severityandlocationof the expected
critical defectsin thestructureof interest.With this informationthespatialresolutionof the
inspectioncanbeestimatedandrequiredfield of view determined.This in turnpermitsthe
developmentof a inspectiongrid, soasto provideoptimalcoverageof thestructure.Whenno
informationis givenasto thenatureof thedefectsthe inspectiongrid is normallydetermined
baseduponpermittedinspectiontime andstructuralgeometry.Next, abaselinemustbe
establishedfrom theinspectionof "thermally similar" testarticlesasto theconditionsnecessary
to conductaconfidentthermographicevaluation.Without this baselinetheinspectorhasnoway
of telling if theinspectionhascaughtall "critical" defectsandalsonowayof quantifyingthe
resultsobtained.To accomplishthis task,testcomponentsarefabricatedcontainingdefects

simulatingthosefoundin realstructures.By constructingtestpanelswith variousdefectsizes,
orientationsandlocationsthethresholdof detectionfor thermographicNDE of that specific
aerospacestructurecanbedetermined.
Thepurposeof thisprojectis to characterizethethermalinspectionprocesssuchthat IRT NDE
canbeefficiently implementedona broadrangeof aerospacestructuresaswell asbeeffectively
tailoredto specificapplications.Emphasishasbeenplacedupondevelopingstandardmethods
for quantifyingtheresolutionof thethermographicinspectionwith regardto defectsize,type,
orientationanddepthinto thestructure.This in turn makesit possibleto uniquelyqualify
thermographyasaprimary inspectiontool for testingthestructuresof thenextgenerationlaunch
vehiclesandotherNASA aerospacehardware.

2.0 THERMOGRAPHIC QUALIFICATION OF GRAPHITE/EPOXY
INSTRUMENTATION RACKS
A nondestructive evaluation method is desired for ensuring the "as manufactured" and "post
service" quality of graphite/epoxy instrumentation rack shells. The damage tolerance models
and geometry of the racks dictate that the evaluation method be capable of identifying defects, as
small as 0.25 inch 2 in area, over large acreage regions, tight compound radii and thickness
transition zones. The primary defects of interest include voids, inclusions, delaminations and
porosity.
The potential for an infrared thermographic inspection to replace ultrasonic testing for qualifying
the racks as "defect free" is under investigation. The inspection process is validated by
evaluating defect standard panels built to the same specifications as the racks, except for the
insertion of artificially fabricated defects. The artificial defects are designed to closely match
those which are most prevalent in the actual instrumentation racks. A target defect area of
0.0625 inch 2 (a square with 0.25 inch on a side) was chosen for the defect standard panels to
ensure the ability to find all defects of the critical (0.25 inch 2) size.
One part of the qualification of an aerospace structure for service involves verifying that no
defects were created during the manufacturing process and that no damage was produced during
handling. This is normally accomplished with a combination of nondestructive evaluation
(NDE) methods at various stages of the assembly. The graphite/epoxy instrumentation racks
under investigation for this study are qualified though a series of ultrasonic inspections after
fabrication. Ultrasonic testing (UT) provides 100 percent coverage of the rack shell and has the
potential of locating all critically sized defects. The problem with UT though, is that it is time
consuming and requires submersion of the shell in a water tank during the scanning operation.
Therefor, the method is not suited for post flight or in-service inspections; i.e. a fully equipped
rack. Infrared (IR) thermographic methods on the other hand have proven to be well suited for
the inspection of monolithic "shell" structures.
As previously discussed, one of the principle advantages of IR thermography over conventional
ultrasonic testing is that with thermography large regions are viewed in each inspection operation
as opposed to the point by point coverage of UT. Also, no direct contact with the structure is
required with thermography, such as the water coupling used with UT, therefor little disassembly
of the structure is required. One of the main disadvantages of thermography is that in order for a
defect to be detected it must interfere with an externally applied heat pulse in such a way as to
develop a change in the normal surface temperature profile. A very tight defect or one that is
thermally similar to the surrounding material has little chance of being detected.
The racks under investigation are constructed from an autoclaved graphite/epoxy with 18 ply
acreage regions building up to 22 plies in the corners. A protective layer of fiberglass provides
the finish layer and serves as a "tattle-tale" for in-service damage. The fiberglass shows as white

againsttheblack graphitebackgroundwhenits surfaceis struckhardenoughto producesignificant internaldamage.Thedefectsof interestincludevoids,inclusions,delaminationsandporositywith a critical areathresholdof 0.25inch2.
2.1 EXPERIMENTAL
The work presented is divided into two segments. First, the issues of delaminations created by
way of impact damage is covered then the ability to locate simulated porosity and inclusions are
discussed. The thermographic methods and results from inspection of actual rack panels are also
covered.
2.1.1 IMPACT DAMAGE ASSESSMENT
Damage created as a result of low energy blunt impacts are particularly troublesome for
composite structures, since drastic reductions in strength can be produced even when little or no
surface indications are present. The primary type of damage in low energy impacts are
delaminations and matrix cracking. Very complex damage patterns can be produced from impact
loads and quite often the extent of damage grows in size through the thickness of a sample
beneath the impact site. In many cases little or no indication of damage may be present at the
impact site while, serious back side and through thickness damage exists. For this reason it is
important to be able to inspect the instrumentation racks, fully loaded and installed as well asbetween missions.
Selection of the impact energy level was determined by performing a series of tests with different
impact tups, drop heights and boundary "panel support" conditions on a section of the
instrumentation rack. Table 1 outlines the thirteen impact levels used to determine the correct
drop height and Figure 1 shows their locations on the sample rack section. Figure 2 contains the
resulting thermograms produced by flash heating the impacted panel. Note that in Figure 2, none
of the 9 and 12 inch drop height impacts (impact numbers 5, 6, 9 and 10) produced any
detectable thermal indications. These impacts also produced no visual indications and when
tested ultrasonically gave no sign of damage. The smallest detectable impact level was produced
from a 13.5 inch drop (impact number 3 and 4) using a rubber mat to support the panel at the
impact site.
An impact produced by a 0.25 inch tup weighing 2.67 lb, dropped from a height of 13.5 inch
(impact number 1), was found to best match the desired defect size and shape. A series of thirty
impacts, in a 6 x 5 array, were performed on a section of rack (Table 2) to establish statistically
the ability to thermographically locate and evaluate the damage zones. The visible damage area
shown in the fiberglass cover ply was measured for reference. The areas ranged from 0.01 to
0.058 inch 2 on the outer "impact" side of the rack to between 0.015 to 0.078 inch 2 on the inner
surface of the rack panel. In all, only four of the damage areas exceeded the desired defect sizelimit of 0.0625 inch 2.
8

Table1. Check-outimpactloads
Impact Drop Height Tupsize Support OutsideArea Inside Area
(inch) (inch) Backing (inch 2) (inch 2)
1 13.5 0.25 No 0.007 0.151
2 13.5 0.25 No Not visible 0.144
3 13.5 0.25 Yes 0.004 0.040
4 13.5 0.25 Yes 0.031 0.040
5 12 0.25 No Not visible Not visible
6 12 0.25 No Not visible Not visible
7 15 0.25 No 0.012 0.131
8 15 0.25 No 0.021 0.160
9 9 0.25 No Not visible Not visible
10 9 0.25 No Not visible Not visible
11 23 0.25 No 0.342 0.650
12 13.5 0.5 No 0.017 0.176
13 21 0.5 No 0.016 0.225
x11
x3
x 9x x10 8
4 x
x x 5x 6x 7 x1 2
Figure 1. Impact locations for level determination.
Figure 2. Thermograms of impact damage.
9

Table2. Delaminationsizeandimpactenergies.
ImpactNumber
1A1B1C1D1E1F2A2B2C2D2E2F
Front Area(in2)
0.0310.0380.0430.0570.0430.0470.0110.0440.0370.0360.0130.058
Rear Area
(in / )
0.038
0.030
0.042
0.034
0.038
0.038
0.043
0.034
0.031
0.045
0.024
0.026
Impact
Energy
(ft-lbs)
5.10
4.16
5.08
5.06
5.07
4.30
5.10
5.08
5.01
5.05
4.13
5.12
3A 0.016 0.078* 4.94
3B 0.010 0.045 5.07
3C 0.033 0.041 4.25
2.1.2 POROSITY AND INCLUSIONS
ImpactNumber
3D
3E
3F
4A
4B
4C
4D
4E
4F
5A
5B
5C
SD
Front Area
(in 2)
0.035
0.023
0.029
0.020
0.010
0.031
0.040
0.036
0.042
0.010
0.012
0.010
0.048
Rear Area
(in 2)
0.070*
0.042
0.039
0.038
0.026
0.070*
0.063*
0.042
0.042
0.040
0.026
0.060
0.037
Impact
Energy
(ft-lbs)
5.01
5.09
5.05
4.27
4.46
5.08
5.04
4.27
5.06
4.40
5.06
5.11
5.07
5E 0.020 0.015 4.59
5F 0.013 0.044 5.05
During manufacture it is possible that regions within the laminate may contain tiny entrapped air
bubbles, or porosity. The porosity can come from many sources including; degassing of
contaminates (such as oils and silicones); improper debulking leaving air trapped between the
plies; or poor ventilation restricting the removal of any degassing of the panel, to name a few.
No matter what the source, porosity can have a detrimental effect on the performance of the
structure by leaving regions of unsupported fibers and points of stress concentration. If the
regions of porosity are large enough they may begin to interlink under stress and drastically
weaken the load carrying capability of the fibers especiall_, when put under compressive forces.For the racks under investigation in this paper a 0.25 inch area of concentrated, or connected,
porosity was set as the critical limit.
To determine the limits of thermographic NDE for detecting porosity two tests were performed.
First, a section of a rack with known porosity documented through an ultrasonic map was
thermographically examined. Second, a 24 ply monolithic test panel was created with simulated
porosity of known size and depth into the laminate. The panel was constructed from bi-
directional graphite/epoxy D683-29026 (22 plies) and E-Glass D683-29042 (2 cover plies) using
a (0,45,45,0,45,0,0,45,0,0,45,0)s lay-up schedule similar to that of the actual racks. The
simulated defects were sized around the critical area by using 0.25, 0.50, 0.75 inch square
regions yielding areas of 0.0625, 0.25 and 0.5625 inch 2. The pattern of planned defects is shown
in Figure 3.
10

!.50 3.00 3.00 3.00 2.75 2.75I 1 i i i
_1 _2 [3 _4 _5
-n--m n -u- uI
_ m _ _ _i
r
i
-- -- t--
1
I
- -j
J
t I
q
I
1
¢ f r
I I I
I I I
2.00
-- 11.50
2.00
2.00
2.00
1.90
2.10
2.50
I I ] 2.00
i i I
All units in inchesr
7.50 2.50
Figure 3. Fabricated test panel.
The light gray regions in Figure 3 depict where the simulated porosity "microballons" (7.0 nm
diameter fused silica SiO2 spheres) were placed in the panel. The dark Gray regions in Figure 3
are folded plastic backing material (0.001 inch thick polypropylene), used to simulate inclusions
and disbond areas. Wedge shaped stainless steel shims (0.006 inch thick) were also inserted into
the laminate to create void regions when they were removed after cure and are visible at the
bottom of the panel. The defects were placed in five columns so that the depth of inspectability
could be investigated. The defects were placed between plies (2-3), (5-6), (11-12), (16-17) and
(21-22).
2.2 DISCUSSION OF RESULTS
2.2.1 IMPACT DAMAGE ASSESSMENT
The impacted panel was thermographically inspected using flash heating from the impact side.
The coverage area for the imager dictated that the panel be inspected in two passes, each
covering an area of the panel 18 inches wide by 12 inches tall. As evident in Figures 4 and 5, all
thirty impact locations were identified thermographically. The extent of the damage between
impact points as viewed by the thermography system remained fairly constant even though the
visual measurements varied greatly between positions (Table 2). The thermograms indicate that
the maximum damage area is approximately 0.25 inch square as seen by comparison with the foil
11

tapesquarein eachimage. As expected,yetnot apparentin thetwo thermogramsshown,thedamageappearedto enlargewith depthawayfrom theimpactpoint.
Figure4. Rows1,2 and3 of qualificationimpacts.
Figure5. Rows3, 4 and5of qualificationimpacts.
2.2.2 POROSITY AND INCLUSIONS
2.2.2.1 Results using the Amber Radiance 1/TWI system
A section of a rack panel with known porosity was inspected thermographically and compared
against the UT results. As shown in Figure 6 a close match to the pattern of porosity is given
12

betweenthe UT imageandthermogram.In Figure6 theporosityshowsup asadarkpatchfortheUT imageandasa white"hotter" zoneon thethermogram.Thesinglethermogramdoesnotshowall thedetailsof theUT imagesincetheporosityactuallyresidesthroughoutthethickness.TheUT imagemeasuresthecompletethicknessof thepanelwhile thethermogramshowsonlytheeffectsfrom asingleslicethecross-section.Whenseveralthermogramsareviewedovertime though,by rasteringthroughthe scanhistory,mostif not all of thedetailsin theUT plot canbeseenon thethermographyimage.
UT Image Thermogram
Figure6. Comparisonof ActualPorositydetectedby UT andThermography
In orderto verify thedepthof penetrationof thethermographyinspectiona speciallydesigneddefectpanelwasconstructed(seeSection2.1.2)andexamined.Theinspectionswereaccomplishedthroughtheuseof anAmber Radiance 1 camera with Thermal Wave Imaging
software. The imager was positioned sixteen inches from the subject and though the use of a 25
mm lens gave a six inch square field of view. The flash unit used to thermally excite the sampled
was set to deliver 1.6 kJ of energy to the surface of the panel.
The resulting thermograms indicate that the limits of the system are somewhere between the
second and third column of defects, i.e. between the sixth and eleventh ply. Figures 7 and 8
show the defects from the first and second column from both sides of the panel (columns 1, 2, 4
and 5).
The primary drivers behind a successful thermal inspection lies in the ability to get heat into a
structure uniformly and with sufficient intensity to create a temporary thermal imbalance around
an anomaly as well as to resolve those temperature variations. The structure under test, although
appearing to be a good color to absorb heat "black", is somewhat reflective. Due to the high
reflectivity, even with a large heat pulse, most of the energy is reflected away from the panel.
Possible solutions to this problem included spraying the surface with a flat black water soluble
paint, using peal ply during manufacture to dull the surface, or increasing the number of flash
13
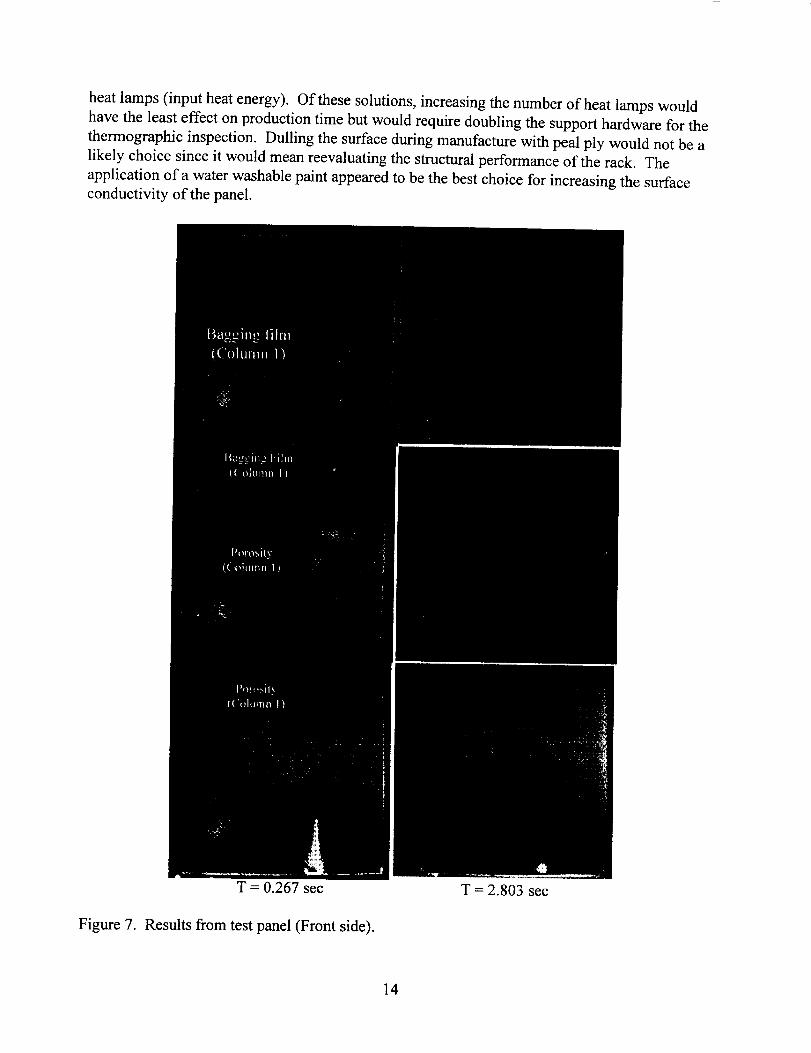
heatlamps(input heatenergy).Of thesesolutions,increasingthenumberof heatlampswouldhavethe leasteffectonproductiontimebutwould requiredoublingthesupporthardwarefor thethermographicinspection.Dulling thesurfaceduringmanufacturewith pealply would not bealikely choicesinceit wouldmeanreevaluatingthestructuralperformanceof therack. Theapplicationof awaterwashablepaintappearedto bethebestchoicefor increasingthesurfaceconductivityof thepanel.
T = 0.267sec T = 2.803sec
Figure7. Resultsfrom testpanel(Front side).
14

T = 0.767 sec T = 3.504 sec
Figure 8. Results from test panel (Back side).
As shown in Figure 9, by spraying the surface with a water washable flat black paint it was
possible to thermally penetrate to the midply of the laminate. The 0.25 inch square region of
porosity is right on the edge of detectability, but can be seen when the thermograms are viewed
in a series over time. Although this technique would require that the panel be inspected from
15

bothsidesandtherackbespayedandcleanedupafterthe inspection,it doesdemonstratethepotentialto inspecttherackswith thermography.
Figure9. Midply porosityviewedwhentestpanelwaspaintedflat black.
2.2.2.2 ResultsUsing The Bales Scientific Thermal Image Processor
For comparison, the Bales Thermal Image Processor was also used to inspect the panel. The
imager was set 16 inches from the test panel and flashed with a power setting of 1400V (_1.4 kJ)
Front side Back side
Figure 10. Bales TIP results.
16

FrontsideFigure 10continued.
Backside
2.3 CONCLUSIONS
Infraredthermographyhasbeendemonstratedto be capable of detecting impact damage
"delamination", porosity and inclusion type defects in the graphite/epoxy instrumentation racks.
Good confidence was found for detecting delaminations related to impact damage. The
thermographic technique was capable of detecting the subsurface effects of the impact loading
that would have been missed with a visual inspection. Porosity close to the surface was found to
also be a good candidate for location with thermography. When the porosity reached depths of
six or more plies it is difficult to say with any confidence that it could be detected without some
surface preparation of the racks. With the application of a flat black, water washable, paint the
porosity at the midplane of the panel was able to be detected. Finally, embedded inclusions and
voids were detectable down to about six plies into the laminate and deeper with the addition of a
dulling agent to the panels surface.
Additional research will need to be performed to develop methods to raise the sensitivity of the
thermographic inspections to a level that will permit one sided inspections without the need for
altering the surface finish of the racks. Investigations into image enhancement to increase the
sensitivity of the thermographic system, optional heating methods to better excite the defect and
finite element methods to determine the theoretical limitations of the system are ongoing.
The primary drivers behind a successful thermal inspection is the ability to get heat into a
structure uniformly and with sufficient intensity to create a temporary thermal imbalance around
an anomaly and the means to resolve those temperature variations. Both systems are highly
sensitive; the Bales system has a sensitivity of 0.05 ° C/level of color and the Amber system can
resolve 0.025 ° C/level. The main limitation for both systems is the ability to heat the part
quickly and to a sufficient level to make the defects react.
The structure under test, although being a good color to absorb heat "black", is somewhat
reflective. Possible solutions to this problem would be to spray the surface with a flat black
water soluble paint, use peal ply during manufacture to dull the surface, or increase the number
of heat lamps. Of these solutions, increasing the number of heat lamps has the least effect on
production time. By doubling the number of flash bulbs it may be possible to insert sufficient
heat into the structure so that the cameras can detect the scheduled defects.
17

3.0 THERMOGRAPHIC INSPECTION OF THE SPACE SHUTTLE MAIN
ENGINE NOZZLE
The nozzles of the Space Shuttle's main engines consist of approximately 1100 tapered Titanium
tubes brazed to a Titanium structural jacket (Figure 11). Two potential problems occur within
the SSME nozzles as a result of manufacturing anomalies and the highly volatile service
environment. The first problem is the unbonding of the tubes from the jacket and the second is
the leaking of fluid into the interstitial channels between the tubes as a result of tube fracture.
Figure 11.
/ Titanium skin __--
SSME nozzle cross section.
3.1 DISBOND BETWEEN TUBES AND JACKET
Initial experiments were performed to determine if it is possible to identify disbonds between the
cooling tubes and shell of the SSME nozzle. The disbond was simulated by milling out a portion
of the tubing with a moto-tool from the hot wall side of the nozzle as shown in Figure 12. The
defect tapers from a 1 inch opening at the inner surface of the nozzle to the brazed edge of the
skin. Although this did not produce a true disbond, the artificial defect did demonstrate the same
thermal behavior that a disbond, i.e. both have the effect of reducing the effective flow path of
heat.
Skin X _._ IJ -- Tubes[ _J J
Figure 12. Artificial disbond.
The nozzle was then inspected by flash heating its cold wall side using the Amber Radiance 1
camera (25 mm lens) running under TWI software. Three surface treatments were investigated
18

including;none,flat white imagedeveloper,flat blackspraypaintandthethermogramsgatessetto 0.150,0.584 and 1.485 seconds after flash
The images were all acquired by viewing the jacket side of the coupon after flash heating the
same side. Areas of greatest structural integrity conducted the heat away from the jacket quite
well, and appear dark in these images. Areas containing discontinuities (such as the programmed
defect or the interstitial gaps between the cooling tubes and jacket) did not conduct the heat away
from the jacket as well, and appear bright in these images.
• Figure 13a. Obtained by viewing the unaltered jacket surface.
- The dark (cold) spot is the thermal reflection of the cooled infrared camera.
- The distinct horizontal bright (hot) "flares" are the thermal reflections of the residual heat
in the lamps after flash.
- The faint horizontal bright (hot) lines are the interstitial gaps between the coolant tubes
and the jacket.
- The faint horizontal dark (cold) lines are the regions where the coolant tubes are in contact
with the jacket.
- The diagonal bright (hot) line is a feature of unknown classification which is visible to the
unaided observer on the coupon surface.
- The vertical bright (hot) line is a feature of unknown classification which is not visible to
the unaided observer on the coupon surface.
- The extremely faint bright (hot) spot near the lower left "flare" is the thermal signature of
the programmed defect.
• Figure 13b. Obtained by coating the jacket surface with a flat white powder (Adrox NQ1
liquid penetrant developer: non-aqueous solution of calcium carbonate).
- The faint bright (hot) spot is the thermal signature of the programmed defect.
- The faint horizontal bright (hot) and dark (cold) lines are the tubes and gaps.
- The diagonal and vertical bright (hot)lines are the features of unknown classification.
• Figure 13e. Obtained by painting the jacket surface flat black.
- The distinct bright (hot) spot is the thermal signature of the programmed defect.
- The somewhat distinct horizontal bright (hot) and dark (cold) lines are the tubes and gaps.
- The diagonal and vertical bright (hot)lines are the features of unknown classification.
3.2 DRILLED HOLE BETWEEN HAT BANDS 8 AND 9
As an initial attempt to create a interstitial leak in the nozzle a 1/16 inch diameter hole was
drilled though the Titanium structural jacket into the interstitial region of the tubing. Using the
same bit, a hole was started in the wall of a coolant tube. Once the wall was thinned sufficiently,
a sharp pin was used to puncture the coolant tube (Figure 14). The resulting hole in the tube was
then partially closed back off by forcing solder into the hole with a pointed chisel. The resulting
defect was leak tested with a soap solution under 35 psi pressure. The leak produced a foaming
indication similar to the class one or two defect. Finally the hole in the structural jacket was
plugged with a piece of vacuum bag sealant tape.
19

O.150seconds 0.584 seconds
Figure 13a. No Surface Treatment
_ ..... i)iiiiiiii! i! i!!_! ¸ :,i i_iii_iiiii!i_!_iii_ i!iii :-i
1.485 seconds
0.150 seconds
Figure 13b.
0.584 seconds 1.485 seconds
Painted flat white (penatrant developer)
0.150 seconds
Figure 13c.
0.584 seconds 1.485 seconds
Painted Flat Black (Water washable paint)
20

To verify that the thermographic inspection was seeing the leak and not the tacky tape, another
piece of sealant tape was place 2 inches away from the sealed hole.
Figure 14.
?/-- 1/16 inch diameter hole---- Titanium structural jacket
Tacky tara
"-_ \- Titanium coolant tubesArtificial interstitial leak.
The defect was then inspected using the Amber Radiance 1 camera (25 mm lens), running under
the TWI software. The structure was viewed at a distance of 24 inches and no surface
preparation was performed. Images were taken from the hot wall side at the defect location and
below hat band 9 as shown in the following figures. The defective tube was connected to a
nitrogen gas source and pressurized to 35 psi.
The affects of the leaking tube defect are apparent below the ninth hat band and in the acreage of
the nozzle at the point were the tube is leaking. Inspection time may be saved by first conducting
either a soap solution check or thermographic inspection below hat band 9 to locate which tube is
defective. Once the defective tube is found thermography may be used to find the position alongthe tube where the defect exists.
At hole location Effect of venting below hat band 9
Figure 15. Thermograms of venting interstitial leak.
A second test was performed by pressurizing a series of tubes around the artificial defect in an
attempt to simulate more closely an actual nozzle test. In the full nozzle test all the tubes would
21

be pressurized simultaneously. Figure 16 shows the manifold system used to pressurize eight
tubes at a time from a common nitrogen bottle.
/,__ Manifold To _trogen tank
_a_ir lines
Interface tubes bonded with epoxy
l SSME Nozzle tubes
_- Sealed with epoxy
Figure 16. Pressurization manifold.
The resulting thermograms are provided in Figure 17 at a time of 6.1 seconds after initial
pressurization. Note that in the unaltered image the defect is just barely visible. By subtracting
the initial frame from all subsequent frames though the defect resolution is increased drastically.
Upon pressurization the tubes are seen to increase in temperature while the leak produces a cold
spot.
Raw image
Figure 17. Comparison of raw image and image difference.
Image difference
22

3.3 INTERSTITIAL LEAKS AT THE NINTH HAT BAND
A nozzle section was provided with a series of known interstitial leaks found by using leak check
solution below the ninth hat band. These leaks were verified and divided into groups of 8 tubes
so that they could be pressurized with the manifold system described in Section 3.2 of this report.
A summary of the leaks and their locations is provided in Table 3. The thermograms are
provided in Figure 18.
Table 3. Interstitial leaks
Tube Number Region Number Defect Class Defect Location
546 Type II Both sides
547
548
549B
550
551
552
553
554
555B
556
557
558
559B
560
561
562
563
564
565
566
567
568
569
2
3
None
Type I Left
Type I Right
None
None
None
None
Type III Centered
Type III Centered
Type III Centered
Type II Right
Type III Centered
Type Ill Centered
None
None
None
Type II Right
Type III Centered
Type III Centered
Type III Centered
Type iII Centered
Type Iii Centered
.I Type III
570 Type III
571 B Type
572
573B 4
574
575
Centered
Centered
Ii Centered
Type III Centered
None
None
None
Type I => Frothy
Type III => Blows out bubbles (audible)
Type II => Bubble growthB ---> Bolt locations
23

Region1 Region2
Figure18.
Region3
Thermogramsof leaksattheninth hatband.
Region4
24

3.4 THERMOGRAPHY OF SSME4
The nozzle segment known as SSME4 is a section of nozzle including the eighth and ninth hat
bands that has artificial interstitial defects. The artificial defects were fabricated by cutting open
the tubing on the hot wall side of the nozzle, then puncturing the tube into the interstitial region
and finally resealing the tube through a welding operation.
During the reweld operation the hot wall surface of the tubes had to be cleaned with a wire brush.
This left the surface shiny, which greatly limits the thermographic inspection capability. To dull
the surface it was painted with a water washable flat black paint. As a side note, it is helpful to
heat the metal surface with a hot air gun before painting. This provides a more consistent finish
and permits a thinner coat of paint be applied and still have adequate dulling of the surface.
Unless otherwise noted all inspections were performed with the Amber Radiance 1 thermal
camera (25 mm lens) and Thermal wave Imaging software at a distance of 18 inches. The
system was pressurized to 35 psig Nitrogen and imaged
3.4.1 INTENTIONAL WELD DEFECTS
Two leak regions were manufactured in SSME4 as shown in Figure 19. The leak type and
interstitial location were determined by individually pressurizing tubes and checking with leak
solution (Tables 4 and 5). In all cases no surface leaks were detected with leak check solution
To Nitrogen tank t SSME Nozzle tubes
Manifold
Region 1
Flexible air lines
Figure 19. SSME4 defect regions.
Figures 20 and 21 show the resulting thermograms over 4 (gate)/time intervals. Also included in
the figures are the Time-Temperature plots which provide an indication of the degree to which
the defects can be detected.
Table 4. Region 1.
25
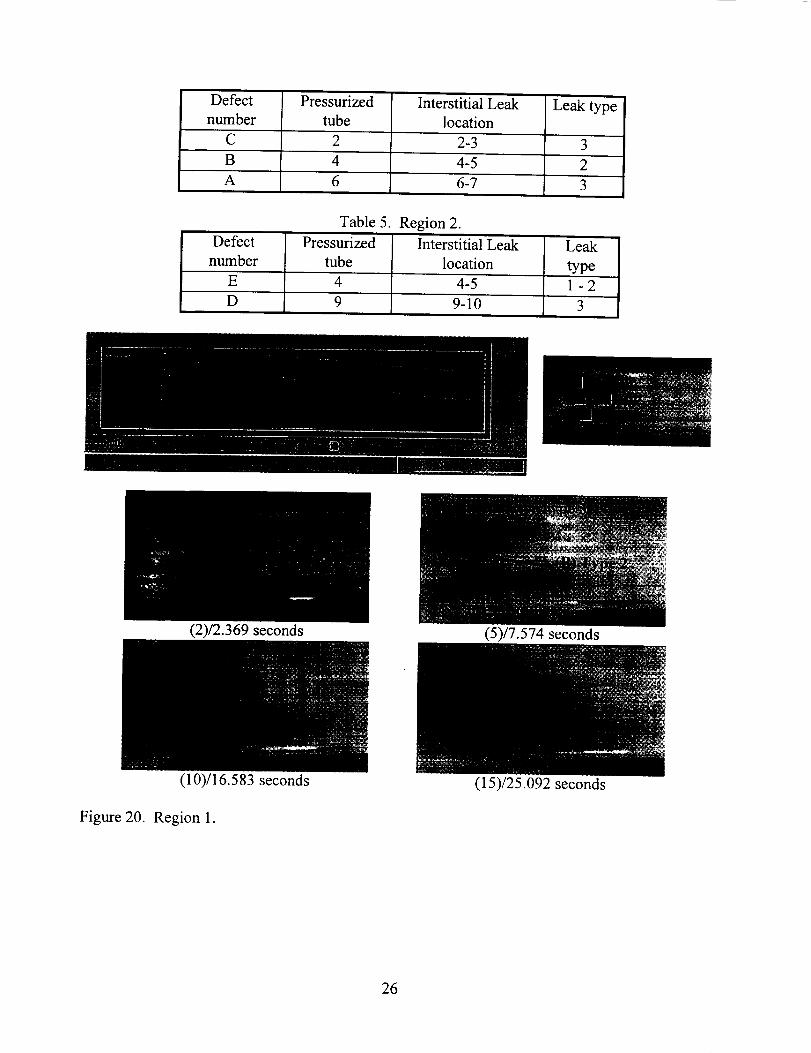
Defect Pressurized Interstitial Leak Leaktype
number tube location
C 2 2-3 3
B 4 4-5 2
A 6 6-7 3'
Table 5. Region 2.
Defect Pressurized Interstitial Leak Leak
number tube location type
E 4 4-5 1 - 2
D 9 9-10 3
(2)/2.369 seconds (5)/7.574 seconds
Figure 20.
(10)/16.5 8 3 seconds
Region 1.
(15)/25.092 seconds
26

(2)/2.135seconds (5)/7.574seconds
(10)/16.583seconds (15)/25.092seconds
Figure21. Region2.
3.4.2 COMPARISON OF THERMAL RESPONSE AT THREE PRESSURE LEVELS
One question that arose from the previous testing was how much of an effect does the amount of
pressure have on the ability to detect a leak. This question was answered by computing the delta
temperature based upon maximum difference in IR camera values between defect region and
acreage region assuming a conversion factor of 203 levels/°C. The results are given in Table 6
and Figure 22. All tests were conducted in region 2 of SSME4.
Table 6. Thermal responses.
'Line color Region Defect Class
Blue Defect 1 3
Green
Pink
Acreage none
Defect 2 2
Pressure (psig)
DePot 25 35 45
1 .039A°C .076A°C .107A°C
2 .003 A°C .033 A°C .057A°C
27

---.e-- Defect 1 + Defect 2 I
._.0.15!
" 0.1
0.05 _0
i
m
m
25! !
35 45
Pressure (psig)
25 psig
35 psig
45 psig
Figure 22. Thermal response at three pressures.
28

3.5 PAN, TILT AND FOCUS UNIT FOR INSPECTION OF SSME NOZZLE
In support of future inspections of complete nozzle assemblies a pan, tilt and focus unit was
adapted to the Amber camera. The following sketches provide the descriptions of each
component designed and fabricated in support of this effort.
_- Amber Camera
Focus unit
Pan & Tilt
Controller
Mount
Tripod
Figure 23. Pan, tilt and focus assembly.
29

-Top leg
Bottom leg
Material:
Hardware:
606 l-T6 aluminum
6 => 1/2 inch long 1/4-20 socket head cap screws
6 => 1/2 inch long 8-32 countersunk socket head screws
Figure 24. Pan & Tilt Tripod Mount.
-[
1.70
O_ _ Drill #7 and tap 1/4-20
\_,_" _ D;_:a_2e9s; ndtap8"32
0"__ 10.45
1.00
(Make 2)
0.31
Figure 24a. Doubler
30

[I
6.00
4.70
/
Drill #29 and tap 8-32 (2 places)
Drill #7 and tap 1/4-20
--- Drill #7 and tap 1/4-20(2 laces)
(D _ 0.88
3.00
1.70
Figure 24b. Top leg.
I I I I II
_ _ _ _ O_31 /--- 9/64 Diam. Countersink (4 places)
Drill #7 and tap 1/4-20_ _U//_')rill #7 and tap 1/4-20
9/64 dia. Countersink (2 places) _ \ _ (2 places)
2.304.70
4.90
6.00
Figure 24c. Bottom Leg
31
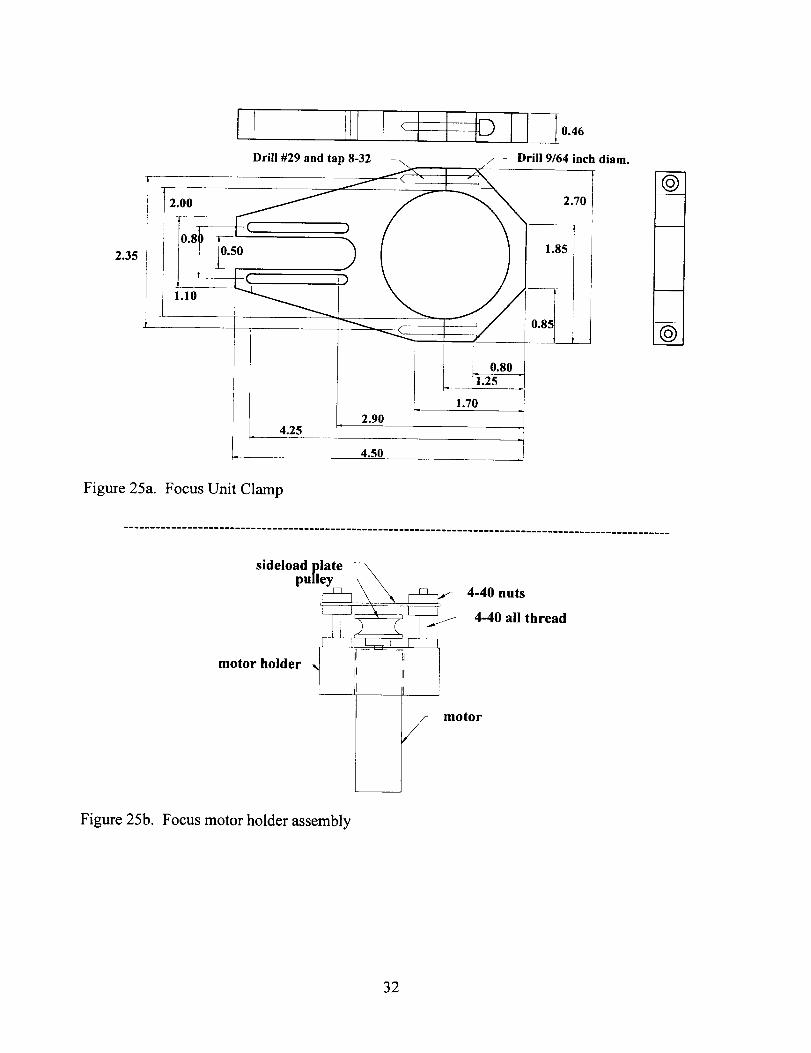
2.35
I _ I "_0.46
200 Drill #29 and ta_p_" I r_ Drill 9/642 iilh diam"
0.80
1.70
2.90
4.50
@
®
Figure 25a. Focus Unit Clamp
Figure 25b.
sideload plate
pulleTy_-q _ __ _-_
motor holder I_-_-_- _
/
Focus motor holder assembly
4-40 nuts
4-40 all thread
motor
32

1.25
0.90
0.51
Drill #21 and tap 4-40
(3 places) 5/64 diam.
(2 places)
3/16 diam.
Figure 25c. Motor holder
1.25
Figure 25d.
0.51
Drill 7/64 (3 places)
0.90
5/64 diam.
Motor side load support
33

4.0 TEST PANEL DESIGN FOR THE SPACE SHUTTLE CARGO BAY
DOORS
Three graphite/epoxy phenolic paper honeycomb panels were built for the Kennedy Space Center
(KSC) in support of an effort to qualify shearographic and thermographic inspection methods for
use on the Space Shuttle cargo bay doors. Each panel measures 18 inch square, with 3 ply
(0,45,0) face sheets over a 0.6 inch core.
4.1 TEST PANEL HI
The first test panel was built to determine which methods of defect fabrication would be best
suited for the given geometry. A summary of the defects built into the panel is provided in Table
7 and located on the panel in Figure 26.
Table 7. Defects for Panel H 1.
Defect Side Description
A Foil Missing cobond layer between face plate and core
B Foil Shim indentations (0.004 in) in face plate
C Foil Missing foil
D Back Doubled bagging film between plies 2 and 3
E Back Microballons between plies 2 and 3
F Back Doubled bagging film between plies 1 and 2
G Back Microballons between plies 1 and 2
H Back Precured cobond adhesive between core and face plate
Foil Side
I
Io 0 Ol
I IA
I0 o oi
i
o aolI
I
_g _r
_ _B
I
L
1 [] I
I I
ID c_ I
_ D pL D E]j
[D B Ii F IL __ _E]J
Back side
Z] o Io
E rof
o © J I()
_ _ IO
1[-2 o i ]o
i G I °lr.
L°-2 dC)
A
O io0 o
0 o-t _
H
Figure 26. Defect map for panel H1.
34

Thepanelwasfabricatedby first precuringthefacesheetsat350°F for 2.5 hr. using
conventional vacuum bagging procedures.. The stacking sequence for bagging included;
(Tool\bagging film\release ply\gr/ep\release ply\bagging film\tool\bleader\bagging film). The
core was precured with the built in defects for 2 hr. at 350 °F as it was sandwiched between two
tooling plates and held under vacuum pressure. Finally the face sheets were cobonded to the core
under vacuum pressure for 2 hr. at 350 °F.
The finished panel was inspected using the Amber Radiance 1 camera and front side flash
heating before being sent to KSC. The heat source for this inspection was supplied by the
Thermal Wave Imaging flash hood. The thermograms are given in Figures 27 and 28.
Figure 27. Foil Side of panel H1.
35

Figure28. Backsideof panel H1.
4.2 TEST PANEL H2
Panel H2 was fabricated in a manner similar to H1 except the defects were formed by precuring
sections of cobond adhesive on the core as given in Table 8 and Figure 29. The resulting
thermograms are given in Figure 30.
Table 8. Defect description for panel H2.
Defect Side Description
A Foil 0.50 inch diameter precured cobond adhesive between core and
face plate
B Back 0.25 inch diameter precured cobond adhesive between core and
face plate
36

18.0 4.0 3.0
A © • • 0--
B © o o @
• 0 • •
• • 0 •
0 0 0 •
• • • 0
® Q @ 0
18.0
Figure 29. Defect map for panel H2.
37

Foil side(top) Back(Top)
Figure30.
Foil side(bottom)
Thermogramsfor panelH2.
Back(Bottom)
4.3 TEST PANEL H3
Panel H3 was constructed using the lessons learned from building and testing the first two
panels. Due to physical constraints imposed by the shearographic system at KSC it was desired
on panel H3 to group the main defects within a 9 inch box in the center of the panel. Milled core
defects would be placed on the comers of the plate for thermographic inspection. The defect
descriptions are given in Table 9 with a defect map given in Figure 31. The resulting
thermograms are provided in Figure 32.
38

Table9. Defectidentification.DefectNumber Characteristics
1 Milled core,3/4 inch diameter,0.2 inch deep2 Milled core,1/2inch diameter,0.2 inch deep3 Missingcobondadhesive,3/4 inchdiameter4 Missingcobondadhesive,1/2 inchdiameter5 Missingcobondadhesive,1/4 inchdiameter6 Doubled0.001inchthick plasticfilm with singleply tissuepaperinsert,
1/2inch squarefilm, 1/4inch squarepaper7 Doubled0.001inchthick plasticfilm, 1/2inch square6* Doubled0.001inchthick plasticfilm with singleply tissuepaperinsert,
3/4 inch squarefilm, 1/4 inchsquarepaper7* Doubled0.001inch thick plasticfilm, 1/4inch square
* glossysideof panel
18¢.0015.00
12.00
10.25,I
I
9.50
9.00 !
8.50 I!
7.75
6.00
• 3.00 .
O !
5 °
Q2
Q3
103.00!
6.501
2 °
Figure 31. Defect map for Panel H3.
(All units in inches)
9.00
11.50
i 5.00
18.00
39

Top (Shiny) Bottom (Dull)
Figure32. Thermogramsfor panelH3.
1. Themilled coredefectsarejust barelyvisible. It appearsthattheability of thecoretoconductheatawayisvery similar to theability of air to radiatetheheataway.
2. Onemilled defectlooksvery similar to amissingcobondtapedefects. It maybe thatthecobondtapeon thatmilled corepulledawayfrom thefaceplate.
. The only insert defect that was clearly visible was number 6. Defects 6* and 7 are just barely
visible. The insert defects were placed between the core and cobond tape. It is possible that
a better defect would be made by placing the inserts between the cobond tape and the face
plate. In this manner the inclusion, and air, would be trapped between the cobond tape and
face plate. As the panel was built, the only thing one would expect to see is the lack of bond
between the cobond tape and the core and the difference in thermal conductivity of the
inclusion. The tightness to which the insert is held between the core and face plate may be
helping the flow of heat through that region, i.e. making the region look "thermally" bonded.
40

5.0 MIKRON-AMBER CORRELATION
In an attempt to get a handle on the temperature differences that were being produced during the
leak inspections of the SSME nozzles a study was initiated comparing the indicated values to
temperatures given off by a blackbody source. The Amber Radiance 1 thermal camera using a
25 mm lens and the TWI software was set up to image the detector of the Mikron M310
Blackbody calibration source. The face of the camera lens was placed 3 inches from the
blackbody source. The Mikron unit was then set to 20 °C, allowed to stabilize and then the
indicated Amber temperature and TWI values recorded. This process was repeated in one degree
increments up to 40 °C and Table 10 produced. With these vales a calibration factor for the
Amber/TWI system was found to be 203 levels/°C. This implies that each unit increase of the
TW] values corresponds to approximately 0.004 °C. A graph of the estimated error and
calibration curve is given in Figures 33 through 35.
Table 10. Summary of correlation values.
Mikron SV
20
21
22
23
24
2526
27
28
Mikron PV20
20
22
23
24
2526.5
27.5
Amber (C)20.7
20.8
23.3
24
25.6
26.6
27.9
29.1
TWI6011
6039
6159
6477
6721
6915
7136
7331
Slope
280
48
454
153
194
170
163
SV-PV0.7
0.8
1.3
1.0
1.6
1.6
1.4
1.6
Fitted SV-
0.862
0.871
1.100
1.164
1.310
1.402
1.521
1.631
28 29.5 7429 245 1.5 1.667
Fitted TWI
203.0
5768.6
6276.0
6418.0
6742.8
6945.7
7209.6
7453.1
7534.3
29 29 30.9 7709 200 1.9 1.795 7818.4
30 30 31.5 7798 148 1.5 1.850 7940.2
31 31 33.3 8164 203 2.3 2.015 8305.5
32 32 34.3 8444 280 2.3 2.107 8508.5
33 33 35 8532 126 2.0 2.171 8650.5
34 34 36.2 8866 278 2.2 2.281 8894.1
35 35 37.4 9131 221 2.4 2.390 9137.6
36 36 38.7 9385 195 2.7 2.509 9401.5
37 37 39.9 9716 276 2.9 2.619 9645.0
38 38 40.4 9782 132 2.4 2.665 9746.5
39 39 41.6 10160 315 2.6 2.775 9990.0
40 40 42.9 10483 248 2.9 2.894 10253.9
slope I 203
Intercept 1547Slope
Intercept
[ Rsq= [ 0.9911
0.0915 ] Rsq = ] 0.9117-1.0331 I
41

3.0
_' 2.5
2.0
1.5
111
_ 1.o
0.5
2O 25 30 35 40 45
Amber (C)
Figure 33. Error curve for Amber/TWI system.
45
40
35
30
25I L '_J_L_I_ _, / ........ / ' I I I I I I I I
......................................... .....-J_"_ I | r I I i J ] I I 1 I I I i I i I I20
Mikron (SV)
Figure 34. Correlation between Amber indicated values and Mikron set values.
42

10500
10000
-Tbql qlll
_ J J
_L-L-±_£ ]411-,--,--,--,---,-,-,-,-,-
J _ _ I - F-i-- T-T-
9500
9000
8500
8000
7500
7000
65OO
6O0O
20 25 30 35 40 45
Amber(C)
Figure 35. Calibration curve for Amber/TWI system.
43

6.0 THERMOGRAPHIC INSPECTION OF GRAPHITE/EPOXY LOW
PROFILE DOME
A graphite/epoxy low profile dome structural test article was thermographically inspected prior
to ultimate load testing. The lay-up schedule and critical defect size were not provided. The
dome was inspected using flash thermography and long term exposure (LTE) lamps. A Bales
Scientific thermal image processor was used for the inspections, configured to view a 12 inch by
18 inch section of the dome. A map showing the inspection regions is provided in Figure 36.
The power setting for flash was set at 1400V while the LTE heating was induced by a 1000 W
lamp.
Some thermal abnormalities were found at visible surface wrinkles as shown in the following
thermograms. Due to the severity of the visible surface features it is difficult to identify
individual subsurface defects.
/
Center region
LVDT Leads
Strain Gauges
Figure 36. Thermogram map for the dome.
44


Quadrant1 Quadrant4
Quadrant2 Quadrant3
47

0
oO


tt_

7.0 THERMOGRAPHIC INSPECTION OF GRAPHITE/EPOXY
PANELS FOR THIOKOL
• Project description: Test panels built by THIOKOL.
• Material: Graphite/epoxy
• Lay-up schedule: Unknown
• Critical defect size: Unknown
• Inspected using flash thermography (Bales TIP)
• Imaged at a distance of 32 inches
• Power setting of 1400V
• Results: Several thermal abnormalities found. See thermograms.
CY-B-Front CY-B-Back
CY-AB-From CY-AB-Back
51

CX-Back (Top) CX-From (Top)
CX-Back (Bottom) CX-Front (Bottom)
52

XY1 Front
XY1 Back
53

YZ Front
YZ Back
54

CY-A-Front
TX-B-Front
CY-A-Back
TX-B-Back
TX-AB-Front TX-AB-Back
55

TX-A-Front TX-A-Back
TY-B-Front TY-B-Back
TY-AB-Front TY-AB-Back
56

TY-A-Front TY-A-Back
XY2 Front XY2 Back
57

8.0 THERMOGRAPHIC INSPECTION OF GRAPHITE PANELSFOR LOCKHEED-MARTIN
• Material: Unidirectional graphite/epoxy
Lay-up schedule: Unknown
• Critical defect size: Unknown
• Inspected using flash thermography from the label side (Bales TIP)
• Imaged at a distance of 32 inches
• Power setting of 1400V
• Thermograms taken at 100 msec. after flash
• Panels are oriented on thermograms upside down, i.e. label inverted in upper right handcomer
• No thermal abnormalities detected, only ply orientations apparent
1 2
3 4
58

59
9.0 SOLID ROCKET BOOSTER NOSE CAP
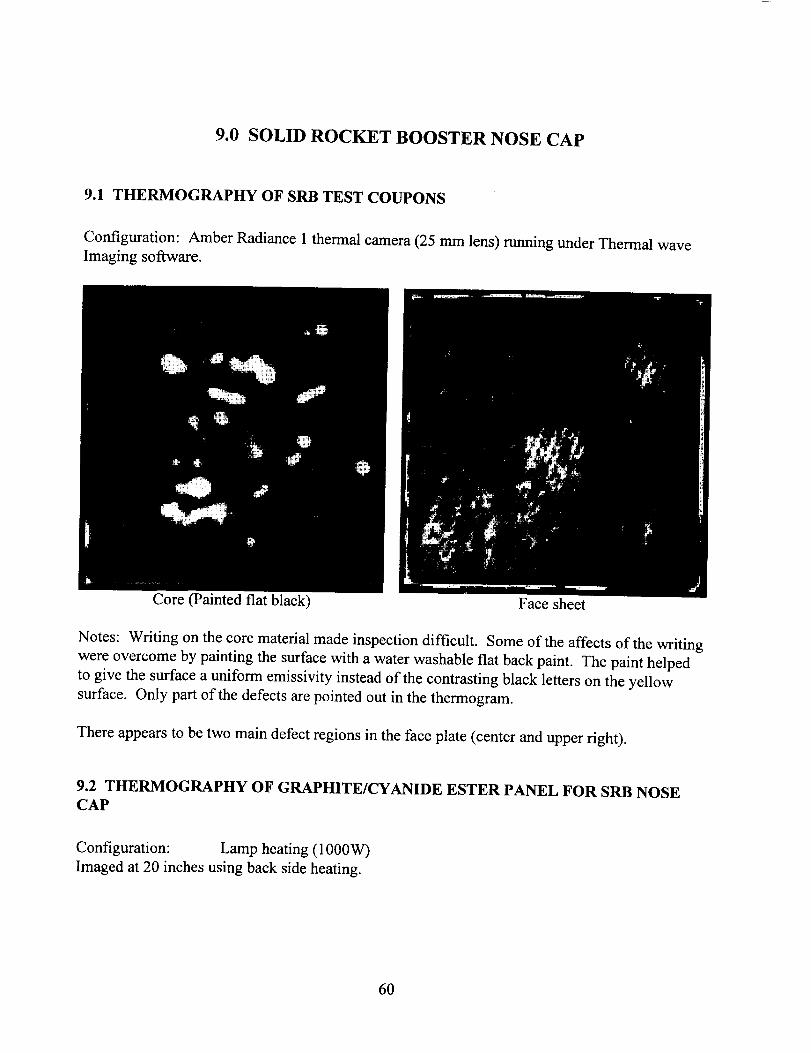
9.1 THERMOGRAPHY OF SRB TEST COUPONS
Configuration: Amber Radiance 1 thermal camera (25 mm lens) running under Thermal wave
Imaging software.
Core (Painted fiat black) Face sheet
Notes: Writing on the core material made inspection difficult. Some of the affects of the writing
were overcome by painting the surface with a water washable flat back paint. The paint helped
to give the surface a uniform emissivity instead of the contrasting black letters on the yellow
surface. Only part of the defects are pointed out in the thermogram.
There appears to be two main defect regions in the face plate (center and upper right).
9.2 THERMOGRAPHY OF GRAPHITE/CYANIDE ESTER PANEL FOR SRB NOSE
CAP
Configuration: Lamp heating (1000W)
Imaged at 20 inches using back side heating.
6O

Front Back
Discussionof results:
• Very efficient heatconductionthroughpanel,requiringlittle exposuretimeto the heatlampfor inspection.
• Boththru-transmission(lO00Wquartzlamp)"shownabove"andone-side(flashheating)inspectionswereperformed.
• No thermalabnormalitiesweredetectedwith eithermethodindicatinggoodbondbetweenfoamcoreandfaceplates.
9.3 THERMOGRAPHY OF HG-10
Panel HG- 10 featured a F650/AF- 191 K/8552 [Graphite/polyimide[foam filled honeycomb}
glass/phenolic]lay-up. The panel was inspected with the Amber Radiance 1 with 25 mm lens
running under Thermal Wave Imaging software. The heat source for this inspection was the
Bales Scientific flash unit set to 1400V excitation level. The distance between the imager and
test article was set at 32 inches. The surface of the sample was dulled with a water washable fiat
black paint.
The only thermal abnormality found was a small spot on the right side of the front face of the
panel. This defect acts as a small void "delamination" at the edge of a bolt hole. No indications
were found using through transmission heating (1000W heat lamp). A defect standard panel is
needed to verify the depth of penetration of the flash heating
61

Rearface Front face
9.4 HOT GAS PANELS (HG15, HG16, HG17, HG18, HG19, HG20)
As with the HG-10 panel the thermal inspection of panels HG 15 though 20 were performed with
the Amber Radiance 1 with 25 mm lens running under Thermal Wave Imaging software. The
heat source for these inspections was the Bales Scientific flash unit set to 1600V (maximum
allowable) excitation level. Each panel was inspected from both sides. The side in the
thermograms is labeled as (M => mesh side and B => back side). No surface preparation was
used (i.e. flat black paint) to dull surface for these inspections.
No abnormalities found in panels during inspection. The inspection were capable of detecting a
0.5 inch square piece of lead foil tape on side opposite camera during front side flash heating.
HG 15M HG 16M
62

HG17M HGI8M
HG19M HG20M
63

HG15B HG16B
HG17B HG18B
HG19B HG20B
64

9.5 HOT GAS PANEL SC350 and SCGLASS
Inspected using the Bales TIP and single sided flash (power setting of 1400V) thermography at adistance of 32 inches.
Thermal abnormalities marked on images
SC350 Front
Graphite/phenolic panel
SC350 Back
SCGLASS Front
Fiberglass/phenolic panel
SCGLASS Back
65

9.6 HOT GAS PANEL EX1542 and F650BMI (post treatment)
Inspected using the Bales TIP and flash (power setting of 1400V) thermography at a distance of
32 inches.
Material: A) EX 1542 Cynate ester/SC350G/3501-6/AS-4
B) F650 BMI Fab/SC350/8552 epoxy
C) Glass/Phenolic
A) EX1542 (Top) EX 1542 (Bottom)
B) F650BMI (Top) F650BMI (Bottom)
66

C) Glass/Phenolic(Top)Glass/Phenolic(Bottom)
67

10.0 X-38 PANEL #9
A thermographic inspection was performed on the X38 test panel, SDK51375091; S/N 002. The
panel was labeled as #9 and was intended to be the 2 "a (outer) face sheet of a cored composite
lay-up. The face sheet was fabricated using graphite/epoxy in at the Johnson Space Flight Center
(JSC). The lay-up schedule and critical defect size was not provided by JSC
The panel was inspected using flash thermography from both sides. A single sided inspection
was not possible as determined by the inability to detect lead foil tape on the back side of the
panel during inspections. The panel was imaged at a distance of 32 inches using a Amber
Radiance 1 thermal camera running under Thermal wave Imaging software. Flash heating was
provided by a Bales Scientific Flash Unit set to a power setting of 1400V. With this arrangement
the nominal inspection size was 12 inch tall by 18 inch wide and required 24 stations to provide
complete coverage of the panel (Figure 37).
Some surface preparation was required to cover the gloss "yellow" finish on the mesh side of the
panel. Here a "water washable" fiat black paint was applied to increase the emissivity of the
panel.
H(i) l(i) l _-_J_
zzlJ
Outside view
Note:
48'
/ H(i) / ._--_
_ 29"
J45"
Inside View
The label (i) indicates that the panel was inverted to acquire thermograms.
Figure 37. X-38 Panel.
68

Figure38. X-38 panelunderinspection.
Two anomalieswerefoundat imagepositionsE andH on theinsideof thepanel. Eachindicationappearedto becloseto thesurfaceof thepanel. Theindicationswerenot detectedwhenthepanelwasexaminedfrom theoppositeside. Theindicationsareapproximately1/4inch square.
ImageE. ImageH.
Figure39. Anomalieson X-38panel.
A completesetof imagesfrom theinspectionof thepanelareprovidedfor futurereference.
69

Insideof panel
ImageA. ImageB.
ImageC. ImageD.
ImageE. ImageF.
70

ImageG. ImageH.
ImageI. ImageL
Image K. Image L.
71

Outside(Meshside)of panel
ImageA Image B
Image C Image D
Image E Image F
72

ImageG ImageH
i ¸
Image I Image J
Image K Image L
73
11.0 GRAPHITE/EPOXY DEBRIS IMPACT PANELS
(PRE-IMPACT)
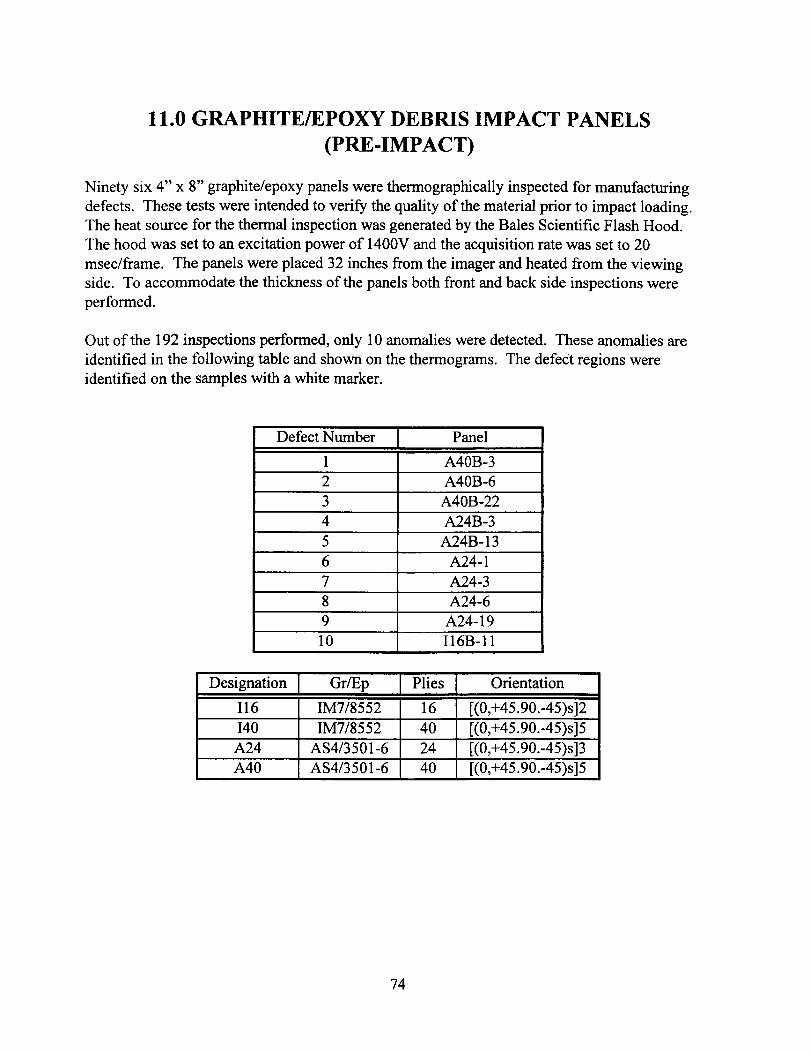
Ninety six 4" x 8" graphite/epoxy panels were thermographically inspected for manufacturing
defects. These tests were intended to verify the quality of the material prior to impact loading.
The heat source for the thermal inspection was generated by the Bales Scientific Flash Hood.
The hood was set to an excitation power of 1400V and the acquisition rate was set to 20
msec/frame. The panels were placed 32 inches from the imager and heated from the viewing
side. To accommodate the thickness of the panels both front and back side inspections were
performed.
Out of the 192 inspections performed, only 10 anomalies were detected. These anomalies are
identified in the following table and shown on the thermograms. The defect regions were
identified on the samples with a white marker.
Defect Number Panel
1 A40B-3
2 A40B-6
3 A40B-22
4 A24B-3
5 A24B- 13
6 A24-1
7 A24-3
8 A24-6
9 A24-19
10 I16B-11
Designation Gr/Ep
I 16 IM7/8552
I40 IM7/8552
A24 AS4/3501-6
A40 AS4/3501-6
[Plies
16
40
24
40
] Orientation
[(0,+45.90.-45)s]2
[(0,+45.90.-45)s]5
[(0,+45.90.-45)s]3
[(0,+45.90.-45)s]5
74

A40B-1-4
A40B-5-8
A40B-9-12
A40B-13-16
75

A40B- 17-20
A40B-21-24
A40-1-4
A40-5-8
76

A40-9-12
A40-13-16
A40-17-20
A40-21-24
77

A24B-1-4
A24B-5-8
A24B-9-12
A24B-13-16
78

A24B- 17-20
A24-B21-24
A24-1-4
A24-5-8
79

A24-9-12
A24-13-16
A24-17-20
A24-21-24
80
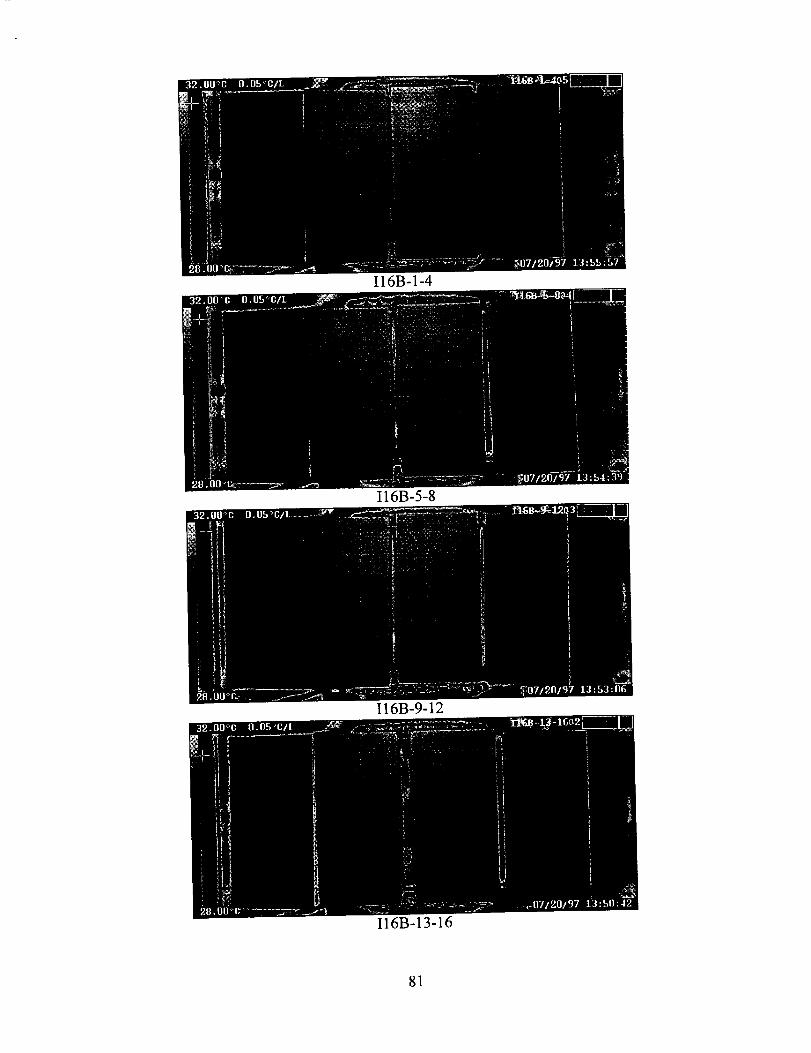
I16B-1-4
I16B-5-8
I16B-9-12
I16B-13-16
81

I16B-17-20
I16B-21-24
I16-1-4
I16-5-8
82

I16-9-12
I16-13-16
I16-17-20
I16-21-24
83

I40B-1-4
I40B-5-8
I40B-9-12
I40B-13-16
84

I40B- 17-20
I40B-21-24
I40-1-4
I40-5-8
85

I40-9-12
I40-13-16
I40-17-20
I40-21-24
86