
Studies of the Thermal Protective Performance of Textile ... of the Thermal Protective Performance...
127
Studies of the Thermal Protective Performance of Textile Fabrics used in Firefighters’ Clothing under Various Thermal Exposures by Sumit Mandal A thesis submitted in partial fulfillment of the requirements for the degree of Doctor of Philosophy Department of Human Ecology University of Alberta ©Sumit Mandal, 2016
Transcript of Studies of the Thermal Protective Performance of Textile ... of the Thermal Protective Performance...

Studies of the Thermal Protective Performance of Textile Fabrics used in Firefighters’
Clothing under Various Thermal Exposures
by
Sumit Mandal
A thesis submitted in partial fulfillment of the requirements for the degree of
Doctor of Philosophy
Department of Human Ecology
University of Alberta
©Sumit Mandal, 2016

ii
Abstract
This PhD study aims to thoroughly investigate the thermal protective performance of
textile fabrics used in firefighters’ clothing under various thermal exposures. This study has two
key objectives – firstly, to characterize the thermal protective performances of different fabrics
under a comprehensive range of thermal exposures; secondly, to empirically analyze the thermal
protective performance of these fabrics under the thermal exposures. To accomplish both the
objectives, physical properties (e.g., thickness, air permeability) of multi-layered fabrics that are
commonly used in firefighters’ clothing were measured; these multi-layered fabrics consisted
different combinations of one type of shell fabric, three types of thermal liners, and one type of
moisture barrier. Next, the thermal protective performances of these fabrics were evaluated in the
Protective Clothing and Equipment Research Facility at the University of Alberta, Canada under
the thermal exposures of flame, radiant heat, hot surface contact, steam, hot-water splash, and
hot-water immersion with compression. The experimental data obtained were statistically
analyzed to identify the effects of fabrics’ physical properties on the performance under these
thermal exposures. Also, the performances provided by the fabrics were compared, and the
nature of heat and mass transfer through the fabrics under these exposures was explored. Using
the significant fabric properties that affected the performance, numerical Multiple Linear
Regression (MLR) and Artificial Neural Networks (ANN) modeling techniques were used to
empirically predict the performance of the fabrics. The best prediction models were then
employed for saliency testing to understand the relative importance of the significant fabric
properties on the performance of the fabrics. The study demonstrates that the protective
performance of textile fabrics varies with different types of thermal exposures. To provide
effective protection in flame, radiant heat, and hot surface contact exposures, the most important

iii
fabric properties to address are thickness and thermal resistance. Steam and hot-water (splash
and immersion with compression) exposures allow mass transfer through fabrics. In the presence
of steam jet pressure or water, fabric thickness, air or water vapor permeability, and evaporative
resistance are primary properties to consider in protecting the human body. In this study, it has
been identified that ANN models can be effectively used in comparison to MLR models for
predicting the thermal protective performance of fabrics under different thermal exposures. By
analyzing the best fit ANN models, it is identified that different fabric properties play a key role
in predicting thermal protective performance of fabrics under various thermal exposures.
Overall, this PhD study will enhance our understanding of fabric materials used in firefighters’
clothing. This deeper understanding could be applied to engineer new test standards and fabric
materials for clothing that can provide optimum occupational health and safety for firefighters.
iv
Preface
This thesis contains 6 stand-alone but inter-connected journal articles that I have
published from my PhD work. I prepared these articles under the valuable guidance of my
previous PhD supervisor Dr. Guowen Song. He reviewed these articles before publication and
provided technical as well as editorial feedback to improve the quality of these articles. These
articles are listed below. In this list, my contribution to each article is clearly stated along with
the contribution of co-authors.
1. Mandal, S., Song, G., Ackerman, M., Paskaluk, S., & Gholamreza, F. (2013). Characterization
of textile fabrics under various thermal exposures. Textile Research Journal, 83(10), 1005-1019.
At the beginning of my PhD, I conceptualized this research article with the help of Dr.
Song. In this article, I reviewed the literature, conducted the experiments, analyzed the data, and
prepared the manuscript. For conducting the experiments, Mr. Ackerman and Mr. Paskaluk
helped me to set up the testing instruments that I used to evaluate the thermal protective
performance of fabrics under various thermal exposures: flame, radiant heat, hot surface contact,
steam, and hot-water splash. Mr. Gholamreza also ran the tests to evaluate the thermal protective
performance of some of my fabric samples under hot-water splash exposure. Before submitting
this article to the Textile Research Journal, Mr. Ackerman and Mr. Paskaluk thoroughly
reviewed the article and provided technical suggestions to improve the article.
2. Mandal, S., Lu, Y., Wang, F., & Song, G. (2014). Characterization of thermal protective
clothing under hot water and pressurized steam exposure. AATCC Journal of Research, 1(5), 7-
16.
In this article, I did the literature review, laboratory experiments to evaluate thermal
protective performance of fabrics under steam and hot-water splash, data analysis, and

v
manuscript preparation. Dr. Lu evaluated thermal protective performance of clothing under hot-
water spray using manikins (as this work is beyond the scope of my PhD, I did not incorporate
this part in this thesis). Dr. Wang together with Dr. Song suggested a few changes during the
galley proof of this article.
3. Mandal, S., Song, G., & Gholamreza, F. (2015). A novel protocol to characterize the thermal
protective performance of fabrics in hot-water exposures. Journal of Industrial Textiles. doi
10.1177/1528083715580522
For this article, a thorough literature review and discussions with Dr. Song helped me to
conceptualize the novel protocol to evaluate thermal protective performance of fabrics under hot-
water exposures. In this article, I tested and evaluated the thermal protective performance of
fabrics under hot-water immersion with compression exposure and further compared these
experimental results with thermal protective performance values of fabrics against hot-water
splash exposure. Here, Mr. Gholamreza ran the tests to evaluate the thermal protective
performance of some of my fabric samples under hot-water splash exposure.
4. Mandal, S., & Song, G. (2016). Characterizing fabrics in firefighters’ protective clothing: hot-
water immersion and compression. AATCC Journal of Research, 3(2), 8-15.
I was responsible to review the literature, conduct the experiments, and analyze the data.
Dr. Song provided me the technical guidance to understand the hot-water immersion with
compression exposure, and its impact on thermal protective performance of fabrics. I prepared
the manuscript and presented the paper at the conference.
5. Mandal, S., & Song, G. (2014). An empirical analysis of thermal protective performance of
fabrics used in protective clothing. The Annals of Occupational Hygiene, 58(8), 1065-1077.

vi
In this article, I have predicted thermal protective performance of fabrics using different
empirical modelling techniques – Multiple Linear Regression (MLR) and Artificial Neural
Networks (ANN). I used my experimental values of thermal protective performance of fabrics to
create the empirical models. I further analysed these models and prepared the manuscript. Dr.
Song provided valuable suggestions during the modelling of thermal protective performance of
fabrics.
6. Mandal, S., & Song, G. (2015). Thermal sensors for performance evaluation of protective
clothing against heat and fire: a review. Textile Research Journal, 85(1), 101-112.
In this article, I thoroughly reviewed the literature and composed the manuscript. For
preparing the manuscript, Dr. Song provided me the technical knowledge and many relevant
classic literatures on thermal sensors.

vii
Dedication
My parents always encouraged me to be a good academician. Although I lost my
father in the third year of my PhD, I strongly believe that his blessings were with me throughout
my PhD. After my father’s death, my younger brother wholeheartedly took care of my mother in
India; it gave me an opportunity to peacefully complete my PhD in Canada. Also, my loving
wife left her Assistant Professorship in India and accompanied me in Canada to support and
encourage at every step of my PhD. Hence, I like to dedicate this thesis to my grandparents (Late
Kiriti Mandal and Late Nalini Mandal), parents (Late Ranajit Kumar Mandal and Mrs. Sulekha
Mandal), parents-in-laws (Late Prem Lal and Late Wanti Bai), younger brother (Mr. Sunit
Mandal), and wife (Ms. Indu Mandal) for their inspiration, never-ending love, emotional support,
and understanding.
Also, I would like to dedicate this thesis to my philosophical mentor, Dr. Daisaku Ikeda
(President, Soka Gakkai International Association), for his guidance about the world peace,
culture, and education based on the wonderful life philosophy of Nichiren Buddhism.
‘As the heat of a fire reduces wood to ashes, the fire of knowledge burns to ashes all karma’
– Bhagavad Gita (Song of the Lord)

viii
Acknowledgements
At first, I wish to thank to the gracious God for giving me the opportunity and potential to
pursue this PhD study and the wisdom and strength to complete this successfully. The process of
this study has made me realize that I am a very fortunate person: my excellent supervisors,
loving family, and friends have always supported and helped me, without any hesitation.
I started my PhD under the supervision of Dr. Guowen Song. During the fourth year of
my PhD, Dr. Song resigned from the University of Alberta (U of A), Canada. Thereafter, I have
continued my PhD under the supervision of Dr. Jane Batcheller at the U of A. Dr. Song and Dr.
Batcheller are incredible supervisors. Without their unflagging support, guidance, patience, and
encouragement, I could never have finished my PhD with the title of ‘Killam Laureate’. They
were not just my supervisors, but excellent mentors: they set a good example of excellent
academicians. I would like to take this opportunity to express my most sincere gratitude to them.
I express my sincere gratitude to my PhD supervisory committee members – Dr. Rene
Rossi (Head, Protection and Physiology Laboratory, EMPA, Switzerland) and Dr. Hongbo Zeng
(Associate Professor, Chemical and Materials Engineering, U of A) – for their guidance and
support. I am thankful to Dr. Rossi for giving me a short term research opportunity under his
guidance at the EMPA (Swiss Federal Laboratories for Materials Science and Technology),
Switzerland. I am indebted to the incredible support and encouragement I received from my
arm’s length PhD examiners – Dr. David Torvi (Professor and Chair, Department of Mechanical
Engineering, University of Saskatchewan, Canada) and Dr. Rachel McQueen (Associate
Professor, Textile and Apparel Science, U of A). I am thankful to Dr. Rhonda Breitkreuz
(Associate Professor, Human Ecology, U of A) for helping me to learn and understand about the
theory and practice of human ecology.

ix
I greatly appreciate the technical support from Mr. Mark Ackerman (Adjunct Professor,
Mechanical Engineering, U of A), Mr. Stephen Paskaluk (Research Engineer, Human Ecology,
U of A), and Ms. Mary Glasper (Graduate Student, Human Ecology, U of A) for my PhD. I also
appreciate the technical support provided by Dr. Martin Camenzind, Ms. Leonie Elissawi, Mr.
Max Aeberhard, and Mr. Ivo Rechsteiner during my research at the EMPA, Switzerland.
I am indebted to U of A Human Ecology Graduate Coordinators – Dr. Berna Skrypnek,
Dr. Deanna Williamson, Dr. Janet Fast, and Dr. Arlene Oak – for showing confidence in my
abilities by nominating me for various institutional, provincial, and international scholarships or
awards. For my PhD study, I received FS Chia Scholarship, Provost Doctoral Entrance Award,
Alberta Innovates Scholarship, Izaak Walton Killam Scholarship, Andrew Stewart Prize, Betty
Crown Scholarship, Joanne A. Vincenten Scholarship, Pansy and George Scholarship, Edmonton
Consular Ball Scholarship, Martha Piper Award, International Graduate Student Award, Human
Ecology Research Grant, Travelling Grant for Advancement of Scholarship, Professional
Development Grant, Alberta Citizenship Award, and AATCC (American Association of Textile
Chemists and Colorists) Herman and Myrtle Goldstein Student Paper Competition Award.
During my PhD study, members of Soka Gakkai International Association of Canada
were my extended family. In particular, I would like to thank Mr. Richard Bornhuse, Ms. Debra
Bornhuse, Mr. Paul Reich, Ms. Paula Reich, Mr. Albert Lim, Dr. Mukul Jain, Ms. Sarika Jain,
Dr. Nidhi Sharma, and Dr. Prasanna Bhomkar for their unwavering emotional support and care.
I also acknowledge the friendships of my neighbors – Mr. Jai Singh, Dr. Vandana Singh,
Dr. Avinash Parashar, Ms. Akansha Parashar, Mr. Gautam Bardoloi, Dr. Prajjita Bardoloi, Mr.
Shiva Sivaskandan, Ms. Uma Sivaskandan, Mr. Vikram Chauhan, Ms. Priyali Chauhan, Mr.
Rahul Pandey, Dr. Madhur Pandey, Mr. Deva, and Ms. Karen – at the Michener Park residence.

x
Table of Contents
Page No.
Chapter 1: Introduction…………………………………………………………………………1
1.1 Background………………………………………………………………………………...1
1.2 Objectives and impacts……………………………………………………………………..2
1.3 Definitions………………………………………………………………………………….4
1.4 Outline of the thesis………………………………………………………………………...9
Chapter 2: Literature Review………………………………………………………………….11
2.1 Previous research on thermal protective performance of fabrics…………………………11
2.2 Remaining gaps in the previous research…………………………………………………16
Chapter 3: Research Methodology…………………………………………………………….19
3.1 Fabric selection and properties evaluation……………………………………………..…19
3.2 Test conditions and approaches…………………………………………………………...23
3.2.1 Flame exposure test………………………………………………………………...26
3.2.2 Radiant heat exposure test…………………………………………………………27
3.2.3 Hot surface contact exposure test………………………………………………….28
3.2.4 Steam exposure test………………………………………………………………...30
3.2.5 Hot-water splash exposure test…………………………………………………….31
3.2.6 Hot-water immersion with compression exposure test…………………………….34
3.3 Procedure to analyze the experimental results……………………………………………36
3.3.1 MLR modeling……………………………………………………………………..38
3.3.2 ANN modeling……………………………………………………………………..38

xi
Chapter 4: Results and Discussion…………………………………………………………….42
4.1 Characterization of thermal protective performance of fabrics under various thermal
exposures…………………………………………………………………………………………42
4.1.1 Thermal protective performance in flame, radiant heat, and hot surface contact
exposures…………………………………………………………………………………………44
4.1.2 Thermal protective performance in steam, hot-water splash, and hot-water
immersion with compression exposures…………………………………………………………52
4.2 Empirical analysis of thermal protective performance of fabrics under various thermal
exposures…………………………………………………………………………………………67
4.2.1 MLR models……………………………………………………………………….68
4.2.2 ANN models……………………………………………………………………….69
4.2.3 Comparison between MLR and ANN models……………………………………..71
4.2.4 Relative importance of each significant fabric property on thermal protective
performance……………………………………………………………………………………...72
Chapter 5: Summary and Conclusion………………………………………………………...75
References……………………………………………………………………………………….79
Appendices………………………………………………………………………………………92
xii
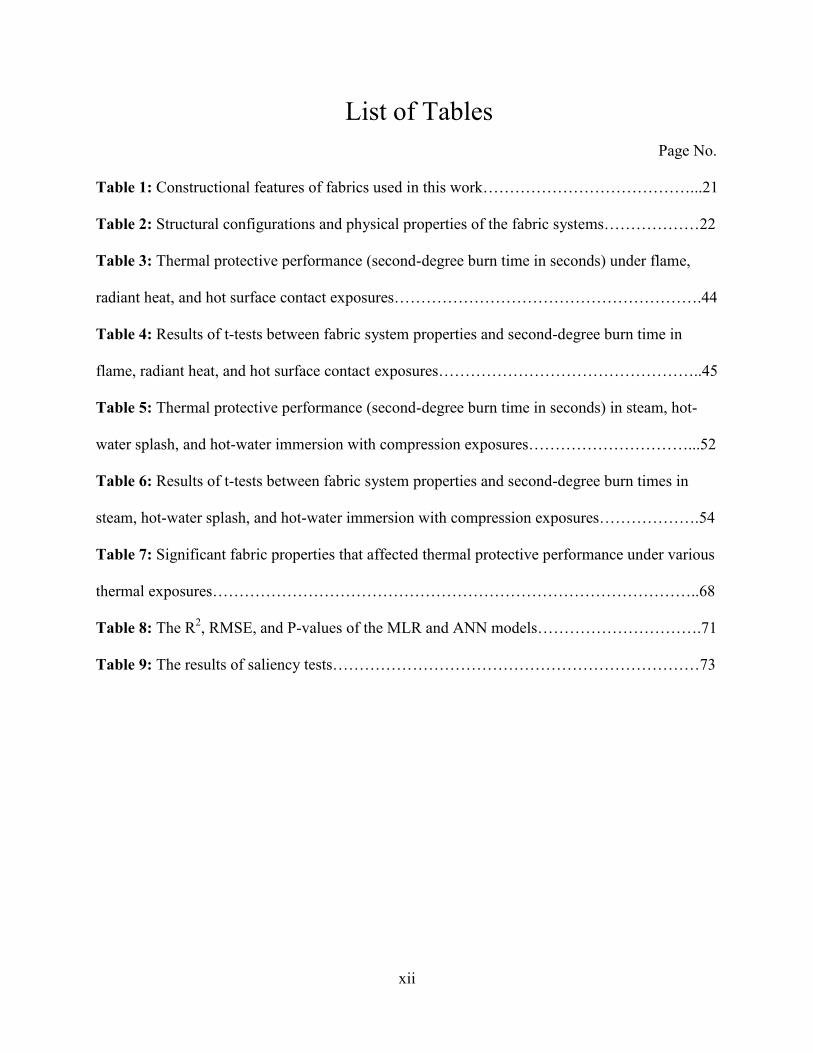
List of Tables
Page No.
Table 1: Constructional features of fabrics used in this work…………………………………...21
Table 2: Structural configurations and physical properties of the fabric systems………………22
Table 3: Thermal protective performance (second-degree burn time in seconds) under flame,
radiant heat, and hot surface contact exposures………………………………………………….44
Table 4: Results of t-tests between fabric system properties and second-degree burn time in
flame, radiant heat, and hot surface contact exposures…………………………………………..45
Table 5: Thermal protective performance (second-degree burn time in seconds) in steam, hot-
water splash, and hot-water immersion with compression exposures…………………………...52
Table 6: Results of t-tests between fabric system properties and second-degree burn times in
steam, hot-water splash, and hot-water immersion with compression exposures……………….54
Table 7: Significant fabric properties that affected thermal protective performance under various
thermal exposures………………………………………………………………………………..68
Table 8: The R2, RMSE, and P-values of the MLR and ANN models………………………….71
Table 9: The results of saliency tests……………………………………………………………73

xiii
List of Figures
Figure 1: Skin simulant sensor…………………………………………………………………..24
Figure 2: Human skin model……………………………………………………………………25
Figure 3: Schematic diagram of the flame exposure test………………………………………..27
Figure 4: Schematic diagram of the radiant heat exposure test…………………………………28
Figure 5: Schematic diagram of the hot surface contact exposure test………………………….30
Figure 6: Schematic diagram of the steam exposure test………………………………………..31
Figure 7: Schematic diagram of the hot-water splash exposure test…………………………….33
Figure 8: Schematic diagram of the hot-water immersion with compression exposure test……35
Figure 9: Schematic diagram of three-layered feed-forward back propagation ANN model with
five hidden neurons………………………………………………………………………………41
Figure 10: Relationship between fabric thickness and second-degree burn time in flame, radiant
heat, and hot surface contact exposures………………………………………………………….47
Figure 11: Behavior of thermal energy imposed on a fabric system in a hot surface contact
exposure………………………………………………………………………………………….50
Figure 12: Thermal energy transfer through the interface between hot surface contact and fabric
system……………………………………………………………………………………………50
Figure 13: Association between air permeability and second-degree burn time in steam……...57
Figure 14: Association between air permeability and second-degree burn time in hot-water
splash……………………………………………………………………………………………..57
Figure 15: Association between air permeability and second-degree burn time in hot-water
immersion with compression at a pressure of 56 kPa and temperature of 75ºC…………………58
Figure 16: Proposed behavior of high pressurized steam inside a fabric system……………….61

xiv
Figure 17: Heat and mass transfer mechanisms through fabric systems in steam and hot-water
exposures…………………………………………………………………………………………63
Figure 18: Relationship between fabric evaporative resistance and second-degree burn time in
hot-water immersion with compression exposure of different temperatures and pressures.…….64
1
Chapter 1
Introduction
1.1 Background
The National Fire Protection Association (NFPA) reported that 1,375,000 fire incidents
occurred across the U.S. in 2012 (Karter, 2013a). These fire incidents resulted in a total of
16,500 civilian injuries, 2,855 civilian deaths, and $12.4 billion loss of capital. Human cost in
terms of firefighter injuries and deaths were also very high. The NFPA fire statistics confirmed
injuries to 69,400 firefighters and a death toll of 97 firefighters in various fire incidents across
the U.S. in 2012. From these totals, 31,490 burn injuries occurred when firefighters were
working in fire hazards (Fahy, LeBlanc, & Molis, 2014; Karter & Molis, 2013). Although
Canada does not have a national fire commissioners’ office to compile detailed statistics on
casualties of Canadian firefighters, the Canadian Fallen Firefighters Foundation reported that
every year approximately 20 on-duty firefighter fatalities occur in Canada (The Fallen, n.d.). As
protective clothing is the only barrier between firefighters and their occupational fire hazards, the
majority of burn injuries result from the inadequate performance of their clothing (Kahn, Patel,
Lentz, & Bell, 2012). The performance of thermal protective clothing is strongly associated with
the nature of the thermal environments faced by on-duty firefighters (Lawson, 1996). In order to
understand the performance of thermal protective clothing, many researchers have investigated
the thermal environments faced by on-duty firefighters (Abbott & Schulman, 1976; Foster &
Roberts, 1995; Lawson, 1996; Lawson, 1997; Rossi, 2003). Through these investigations, it has
been established that firefighters are exposed to flames, radiant heat, hot surface contact, steam,
and hot liquids of varying intensities and durations. In these thermal exposures, the performance
of thermal protective clothing varies depending upon the characteristics of the textile fabrics

2
used in the clothing. Thus, to improve firefighters’ protection, there is a need to study and
understand the performance of the textile fabrics used in firefighters’ clothing under different
thermal exposures.
Considering the need, extant research has focused on the thermal protective performance of
fabrics used in firefighters’ clothing under specific thermal exposures, primarily, flame, radiant
heat, hot surface contact, steam, and hot-water splash (Benisek & Phillips, 1981; Lu, Song, Zeng,
Zhang, & Li, 2014; Rossi, Indelicato, & Bolli, 2004; Rossi & Zimmerli, 1994; Shalev & Barker,
1984). Most of the research has focused on a single thermal exposure and characterized the
performance of different fabrics under the exposure. At present, there has been no
comprehensive study of the performance of fabrics considering the full range of thermal
exposures likely to be encountered by firefighters. Firefighters also experience burn injuries from
the exposure to hot-water when they kneel and crawl on the fire-ground (Barker, 2005; Lawson,
1996; Lawson, Twilley, & Malley, 2000); however, no research has investigated the performance
of fabrics under this important exposure. Thus, our knowledge of the fabric properties that can
improve the thermal protection of firefighters’ clothing is still limited and fragmented.
Furthermore, the performance evaluation methods used in the previous research are fabric-
destructive in nature, expensive, and cumbersome to employ on a routine basis (Benisek &
Phillips, 1979; Stull, 1997). To date, no empirical analysis has been carried out to predict the
performances using numerical models (Hui & Ng, 2009).
1.2 Objectives and impacts
The objectives of this study are to characterize the thermal protective performance of
selected multi-layered textile fabrics used in firefighters’ clothing under various thermal
exposures and empirically analyze the thermal protective performance of these fabrics (Mandal,

3
Lu, Wang, & Song, 2014; Mandal & Song, 2014a; Mandal & Song, 2014b; Mandal & Song,
2015; Mandal, Song, Ackerman, Paskaluk, & Gholamreza, 2013a; Mandal, Song, &
Gholamreza, 2015; Mandal & Song, 2016). To accomplish these objectives, the physical
properties of the fabrics are experimentally measured, and the thermal protective performances
of these fabrics are evaluated under various laboratory-simulated thermal exposures. A novel test
protocol is used to evaluate the thermal protective performance under hot-water immersion with
compression. For the characterization, based on the data obtained from the laboratory
experiments, this study statistically analyzes the effect of fabric physical properties on the
thermal protective performances of the selected fabrics under various thermal exposures. Also,
the performance of the fabrics is compared, and the nature of the heat and mass transfer through
the fabrics under these exposures is comprehensively discussed. Using the significant fabric
properties that affect thermal protective performance, empirical Multiple Linear Regression
(MLR) and Artificial Neural Networks (ANN) models are further used to predict thermal
protective performance. The best prediction models are then employed to understand the relative
importance of the significant fabric properties on performance.
This study contributes to develop a thorough understanding of thermal protective
performance of fabrics under various thermal exposures by acknowledging various significant
fabric properties that affect the performance. This study also advances the theory of heat and
mass transfer through these fabrics under selected thermal exposures. Furthermore, empirical
models for predicting thermal protective performance of fabrics are established, and the relative
importance of different significant fabric properties on this prediction is thoroughly
demonstrated. In future, this understanding will help to develop new fabric materials and test
standards that can be used to provide better protection and comfort to firefighters in Canada and

4
worldwide.
1.3 Definitions
Air permeability of a fabric: is the volume of air passed per second through a known area
of the fabric at a particular pressure differential between the two surfaces of the fabric (ASTM
International, 2013a).
Artificial Neural Networks (ANN) model: are families of statistical learning models (in
machine learning and cognitive science discipline) inspired by biological neural networks and
are used to estimate or approximate a variable that is dependent on a large number of input
variables (Hassoun, 1995; Yegnanarayana, 2006).
Conduction or conductive heat transfer: is the transfer of heat between substances that are
in direct contact with each other (Arpaci, 1966). When a substance is heated, its molecules gain
more thermal energy and vibrate more. These molecules then bump into nearby molecules and
transfer some of their thermal energy to them. This process then continues and passes the thermal
energy from the hot end down to the colder end of the substance.
Condensation: is the change of water from its gaseous form (water vapor) into liquid
water (Bergman, Lavine, Incropera, & Dewitt, 2011).
Coefficient of Variation (CV): is a statistical measure of the dispersion of data points in a
data series around the mean. It represents the ratio of the standard deviation to the mean, and it is
a useful statistic for comparing degree of variation from one data series to another, even if the
means are drastically different from each other (Agresti & Franklin, 2009).
Coefficient of determination (denoted by R2): is interpreted as the proportion of the
variance in the dependent variable that is predictable from the independent variable (Agresti &
Franklin, 2009).

5
Confidence interval: is a range of values so defined that there is a specified probability
that the value of a parameter lies within it (Agresti & Franklin, 2009).
Constrictivity: is a dimensionless parameter that describes the mass transport processes in
a porous media and it depends on the ratio of the diameter of the diffusing particle to the pore
(Bergman, et al., 2011).
Convection or convective heat transfer: is the transfer of heat from one place to another
by the movement of fluids. This heat transfer involves the combined processes of conduction
(heat diffusion) and advection heat transfer by bulk fluid flow (Arpaci & Larsen, 1984).
Density: or more precisely, the volumetric mass density, of a material is its mass per unit
volume (Bergman, et al., 2011).
Diffusion: is the net movement of molecules or atoms from a region of high
concentration to a region of low concentration (Bergman, et al., 2011).
Emissivity: is defined as the ratio of the thermal energy radiated from a material’s surface
to that radiated from a blackbody (a perfect emitter) at the same temperature and wavelength
under the same viewing conditions (Hsu, 1963).
Evaporative resistance of a fabric: is the resistance of the fabric to the flow of moisture
vapor from a surface with a higher vapor pressure to an environment with a lower vapor pressure
(ISO, 2014).
Extinction coefficient: determines how strongly a material absorbs thermal energy in a
thermal exposure (Lienhard & Lienhard, 2011).
Heat capacity: is the number of heat units needed to raise the temperature of a material by
one degree (Bergman, et al., 2011).
6
Heat flux: is the thermal intensity indicated by the amount of energy transmitted per unit
area per unit time (Lienhard & Lienhard, 2011).
Heat transfer: is the movement of thermal energy from one object to another object of
different temperature (Lienhard & Lienhard, 2011).
Hypothesis test: is an inferential procedure that uses sample data to evaluate the
credibility of a hypothesis about a population (i.e., a set of fabric system) (Agresti & Franklin,
2009).
Linear regression t-test: determines whether there is a significant linear relationship
between an independent variable (fabric properties) and dependent variable (thermal protective
performance) (Agresti & Franklin, 2009; Yan & Su, 2009).
Mass of a fabric: is one of the ways to classify fabric, and it is measured by weighing a
standardized width of a yard or meter of fabric on a scale (ASTM International, 2013a).
Mass transfer: is the net movement of mass from one location (usually meaning a stream,
phase, fraction, or component) to another location. Mass transfer occurs in many processes, such
as absorption, evaporation, adsorption, drying, precipitation, and membrane filtration (Bergman,
et al., 2011).
Multiple Linear Regression (MLR) model: attempts to model the relationship between
two or more independent variables and a dependent variable by fitting a linear equation to
observed data. Here, every value of the independent variable is associated with a value of the
dependent variable (Orme & Orme, 2009; Yan & Su, 2009).
Nonwoven fabric: is a textile sheet or web structure bonded together by entangling fibers
or filaments through mechanical, thermal, or chemical process (Batra & Pourdeyhimi, 2012;
Massenaux, 2003).

7
Porosity of a fabric: is a measure of the void (i.e., empty) spaces in a fabric, and is a
fraction of the volume of voids over the total volume (ASTM International, 2013a). The porosity
values lie between 0 and 1 or it can be expressed as a percentage between 0 and 100%.
P-value: is a function of the observed sample results (a statistic) that is used for testing a
statistical hypothesis (Agresti & Franklin, 2009).
Radiation or radiative heat transfer: is the transfer of heat from one place to another
through infrared radiation (a type of electromagnetic radiation). This heat transfer can also occur
through empty spaces (Siegel & Howell, 2002).
Root Mean Square Error (RMSE): is frequently used to measure the differences between
values predicted by a model (e.g., MLR, ANN) or an estimator and the values actually observed
(Agresti & Franklin, 2009).
Specific heat: is the heat required to raise the temperature of the unit mass of a given
substance by a given amount (usually one degree) (Bergman, et al., 2011).
Standard deviation: is a measure that is used to quantify the amount of variation or
dispersion of a set of data values (Agresti & Franklin, 2009).
Thermal absorptivity: is the property of a material that determines the fraction of incident
thermal radiation absorbed by the material (Bergman, et al., 2011; Hsu, 1963).
Thermal conductivity: is the rate at which heat passes through a specified material,
expressed as the amount of heat that flows per unit time through a unit area with a temperature
gradient of one degree per unit distance (Bergman, et al., 2011; Hsu, 1963).
Thermal insulation of a fabric: is the reduction of heat transfer (the transfer of thermal
energy between objects of differing temperature) between objects in thermal contact or in range
of radiative influence (Abdel-Rehim, Saad, Ei-shakankery, & Hanafy, 2006; Song, 2009).

8
Thermal inertia: is the degree of slowness with which the temperature of a material
approaches that of its surrounding and which is dependent upon its absorptivity, thermal
conductivity, specific heat, and dimensions (Bergman, et al., 2011; Hsu, 1963).
Thermal protective performance of a fabric: According to American Society for Testing
and Materials (ASTM) D 4108 and Canadian General Standards Board (CGSB) 78.1 standards,
thermal protective performance of a fabric is defined as the minimum exposure energy required
to cause the accumulated energy received by the copper sensor to equal the energy that can cause
a second-degree burn in human tissue (ASTM International, 1987; CGSB, 2001). For this study,
thermal protective performance is the time to a predicted second-degree burn injury as defined
using a skin simulant sensor and skin burn model when the fabric is tested under various thermal
exposures (Mandal, et al., 2013a; Song, et al., 2011a). Here, thermal protective performance of
the fabric is defined as the time to second-degree burn injury because this could help to
realistically understand wearers’ protection under a thermal exposure while wearing the thermal
protective clothing.
Thermal resistance of a fabric: is the resistance of the fabric to the heat transfer through
conduction, convection, and/or radiation (ASTM International, 2014a).
Thickness of a fabric: is a precise measurement of the distance between two plane
parallel plates separated by the fabric when a known pressure is applied and maintained on the
plates (ASTM International, 2013a).
Tortuosity of a fabric: is a ratio that characterizes the convoluted pathways of fluid
diffusion through the porous media such as fabric. In the fluid mechanics of porous media,
tortuosity is the ratio of the length of a streamline – a flow line or path – between two points to
the straight-line distance between these points (Bear, 1972).

9
Transmissivity of a fabric: is the degree to which a fabric allows thermal energy, in
particular electromagnetic radiation, to pass through it (Haghi, 2011).
Woven fabric: is a structure produced when at least two sets of yarns are interlaced,
usually at right angles to each other, according to a predetermined pattern of interlacing, and
such that at least one set is parallel to the axis along the lengthwise direction of the fabric
(ASTM International, 2013a).
1.4 Outline of the thesis
This doctoral thesis is divided into 5 chapters. Chapter 1 introduces the research and
provides background for this study. The research problem is stated and the objectives and
contributions of the study are explained. Chapter 2 thoroughly reviews the literature on thermal
protective performance of fabrics under various thermal exposures. Through this review, various
fabric properties that affect the thermal protective performance of fabrics are presented. The
important knowledge gaps in the existing research are identified to provide the rationale for the
objectives of this study. Chapter 3 describes the research methodologies used to fulfil the
objectives of this study. This chapter describes the fabrics selected for this study and their
properties. Also, the experimental approaches to evaluate the thermal protective performance of
these fabrics under various thermal exposures are demonstrated, and the procedures for
analyzing the experimental results are stated. Chapter 4 presents the results and discussion of
this study. Here, thermal protective performances of fabrics are characterized under various
thermal exposures and are explained based on the theory of heat and/or mass transfer. This
characterization process helps to identify the fabric properties that significantly affected the
thermal protective performance. Furthermore, using the significant fabric properties as input
variables, thermal protective performance of fabric as an output variable is empirically predicted.
These predictions are actualized using MLR and ANN modeling techniques. These MLR and

10
ANN models are also statistically compared and best fit models for predicting thermal protective
performance of fabrics are identified. By utilizing the best fit models for predicting thermal
protective performance of fabrics, the relative importance of the significant fabric properties on
protective performance is thoroughly examined. Chapter 5 reports the summary and conclusion
of this study. Here, the limitations of the study are clearly mentioned in order to provide the
future research direction in the field of thermal protective clothing or textiles and materials
science.

11
Chapter 2
Literature Review
2.1 Previous research on thermal protective performance of fabrics
Many researchers have studied the thermal protective performance of fabrics used in
firefighters’ clothing under single or specific thermal exposures (Benisek & Phillips, 1981; Lu, et
al., 2014; Rossi, et al., 2004; Rossi & Zimmerli, 1994; Shalev & Barker, 1984). In these studies,
the thermal protective performance of the fabrics was evaluated using the test methods
developed by many national and international organizations such as ASTM, International
Organization for Standardization (ISO), and NFPA (ASTM International, 2008a; ASTM
International, 2008b; ASTM International, 2008c; ASTM International, 2013b; ISO, 1995;
NFPA, 2013). These studies have also characterized the fabrics in order to recognize and explain
fabric properties affecting the thermal protective performance.
In the late 1970s and early 1980s, Benisek and Phillips (1979, 1981) analyzed single- and
double-layered fabrics in the high intensity flame exposures. They found that the thickness and
weight of fabrics affected the thermal protective performance, and that the protection of double-
layered fabrics was much higher than that of single-layered fabrics. Barker and Lee (1987), and
Shalev and Barker (1983) demonstrated that the thermal protective performance of single-
layered fabrics was affected by changes in the intensity of the flame exposure and also by the
thickness and weight of the fabrics. Barker and Lee (1987) further explained that the fabric’s
density (mass per unit volume) does have a significant impact on thermal protective
performance. Here, if the density of a fabric gradually increases, the thermal protective
performance proportionately decreases. However, over the density of ~60 kg/m3, the thermal
protective performance drops very rapidly. This is because, beyond this density, the dead air
12
trapped inside the fabric structure starts conducting the thermal energy toward the wearer’s skin.
This situation rapidly lowers the thermal protective performance of the fabric. Furthermore,
Morris (1953) explained that when two fabrics are of equal thickness, the one with lower density
shows greater thermal protective performance. In this context, it is necessary to remember that
the structural properties of two fabrics with the same density can be quite different. One fabric
might be loosely woven from tightly twisted, hard yarns and the other might be closely woven
from loosely twisted, soft yarns. This variation in structural properties may affect the thermal
protective performance of the fabrics. Contextually, Torvi and Dale (1998), and Torvi, Dale, and
Faulkner (1999) found that a fabric with high thermal conductivity and low specific heat could
quickly transfer thermal energy through it and lower the thermal protective performance. They
also noted that such a fabric could decompose in a flame exposure. Here, the thermal
decomposition reactions of the fabric are generally endothermic because little oxygen is
available for exothermic oxidation reactions to happen (Torvi, 1997). This endothermic
decomposition reaction could generate considerable thermal energy depending upon the intensity
and duration of the flame exposure. This thermal energy generated by decomposition could also
lower the thermal protective performance of the fabric.
In a bench-top configuration that simulated a combined exposure of flame and radiant
heat, Shalev and Barker (1984) observed that the thermal energy transfer rate was lower for thick
fabrics than for thin fabrics, and that the air permeability of the fabrics did not significantly
affect the transfer of thermal energy. They concluded that air permeability has little or no impact
on thermal protective performance of fabrics. Perkins (1979) concluded that fabric weight and
thickness are the main properties to consider when analyzing fabric performance in low intensity
(~ < 20 kW/m2), radiant heat exposures. Through statistical analysis, he confirmed that fabric

13
weight and thickness are positively associated with thermal protective performance of fabrics.
Fabrics with high thickness entrap more dead air than thinner fabrics, and this air helps to
insulate wearers (Sun, Yoo, Zhang, & Pan, 2000; Torvi & Dale, 1999; Zhu, Zhang, & Chen,
2007). However, Song, et al. (2011a) observed that thick fabrics store more thermal energy than
thin fabrics in the low intensity radiant heat exposures, and this stored energy may be released
due to compression during and after the exposure. The release of the stored energy causes burn
injury on a wearer’s skin and consequently lowers the performance of the clothing (Eni, 2005).
Barker, Guerth-Schacher, Grimes, and Hamouda (2006) stated that fabrics may absorb moisture
due to perspiration from a sweating firefighter; thus increasing the thermal conductivity of fibers,
and lowering the thermal protective performance of the fabric (Lee & Barker, 1986; Lu, Li, Li, &
Song, 2013a). In contrast, it was also found that if a fabric absorbs a significantly high amount of
water (over 15% of its weight), this situation provides a cooling effect to firefighters by reducing
the thermal energy transfer (Song, Cao, & Gholamreza, 2011b).
Rossi and Zimmerli (1994) also investigated the impact of moisture on thermal protective
performance of multi-layered fabric systems during hot surface contact. They found that the
presence of water in the outer layer of the fabric system (exposed to the hot surface contact)
enhanced the thermal conductivity of the fabric system. As a result, the thermal protective
performance of the fabric system dropped by 50-60%. In this context, a multi-layered fabric
system with a separate moisture barrier in the inner layer exhibited better thermal protective
performance than a multi-layered fabric system with a laminated moisture barrier on the outer
shell fabric. However, both of these fabric systems exhibited a similar drop in performance when
their inner layers were wet. If the inner layer of the fabric system was wet, the thermal protective
performance was found to drop by 10-25% for all of the selected fabric systems of this study.
14
Here, the decrease in thermal protective performance was greater at lower temperatures because
the water accumulated in the fabric layers without any significant evaporation, enhancing
thermal conductivity and lowering the thermal protective performance of the fabric systems.
If moisture that has accumulated inside the fabric structure turns into steam during a
thermal exposure, the steam may diffuse toward the skin depending upon the fabric’s
characteristics, leading to skin burns (Keiser, Becker, & Rossi, 2008; Keiser & Rossi, 2008;
Keiser, Wyss, & Rossi, 2010; Rossi, et al., 2004). Similarly, water used by firefighters to
extinguish fire may generate steam in the environment and thus be transferred through their
clothing to produce skin burns. Rossi, et al. (2004) concluded that water vapor permeability is
the most important fabric property to consider for effective protection in steam exposures. They
suggested that a water vapor impermeable membrane inside the fabric layers might significantly
prevent steam transfer and reduce burn injuries. It was also confirmed that a thick fabric with a
water vapor impermeable membrane provides better protection from steam than a thick fabric
with a semi-permeable membrane (Keiser, et al., 2010; Keiser & Rossi, 2008; Sati, Crown,
Ackerman, Gonzalez, & Dale, 2008).
Lu, Song, Ackerman, Paskaluk, and Li (2013b), and Lu, Song, Li, and Paskaluk (2013c)
studied the performance of single-layered fabric systems against hot liquid splash at 85°C. They
used water, drilling mud (manufactured by SAGDRIL), and canola oil to simulate various
workplace hazards. They observed that the properties of water, e.g., density, thermal
conductivity, surface tension, and heat capacity, at 85°C were the highest among all liquids
evaluated; whereas, the dynamic viscosity of water was the lowest of all the liquids at this
temperature. They found that the thermal protective performance of the fabric systems evaluated
depended on the properties of the fabrics (e.g., weight, thickness, air permeability, fiber content,

15
weave structure) and liquids. They found that the air permeability of a fabric system was
negatively associated with thermal protective performance under all types of hot liquid splashes.
This is an important finding since previous studies did not find any relationship between air
permeability and thermal protective performance under flame and radiant heat exposures
(Perkins, 1979; Shalev & Barker, 1984). Lu, et al. (2013b, 2013c) also found that fabric
performance was lower when exposed to water or drilling mud than when exposed to canola oil.
This was thought to be because the heat capacity of hot-water or drilling mud is higher than the
heat capacity of canola oil. Basically, the amount of heat energy per unit mass of hot-water or
drilling mud was higher due to their high heat capacity; this high heat content lowered the
thermal protective performance of selected fabrics in Lu, et al.’s study. Gholamreza and Song
(2013) found that a multi-layered fabric system with an air-impermeable outer layer provided
better protection against hot liquid splash than a multi-layered fabric system with an air-
permeable outer layer. Recently, Lu, et al. (2014) investigated the thermal protective
performance of different single-layered fabrics under hot liquid splash. They found that the flow
pattern of liquids on the fabrics varied depending on the surface energy between the liquid
molecule and fabric. Generally, a very hot liquid or highly rough fabric surface could influence
the surface tension of the liquid; in turn, increasing the wettability of the fabric. In the case of a
fabric with high wettability, the liquid could penetrate through the fabric due to wicking and
cause burns on wearers’ skins. Lu, et al. (2014) further mentioned that the liquid applied can be
stored in fabric or transmitted through the fabric depending upon fabric properties (thickness,
density, air permeability). If a fabric can store more and transmit less liquid, it will show high
initial thermal protective performance. They also found that the addition of a thermal liner with a

16
single-layered shell fabric can help to store more and transmit less liquid and this enhances the
performance of the shell fabric.
2.2 Remaining gaps in the previous research
Based on the above discussion, it is evident that much research has focused on the
thermal protective performance of multi-layered fabrics used in firefighters’ clothing under
specific thermal exposures, namely flames, radiant heat, hot surface contact, steam, and/or hot-
water splash. From these studies, important fabric properties influencing thermal protective
performance under specific thermal exposures and test conditions have been identified (Benisek
& Phillips, 1981; Lu, et al., 2014; Rossi, et al., 2004; Rossi & Zimmerli, 1994; Shalev & Barker,
1984). However, no study has evaluated the thermal protective performance of fabrics under all
of these thermal exposures. As a consequence, knowledge of the fabric properties that influence
thermal protective performance is still limited. Contextually, Barker (2005), and Lawson (1997)
suggested that the studies on thermal protective performance of firefighters’ clothing over a wide
range of thermal exposures are needed in order to holistically understand the effects of various
thermal exposures on the performance. Furthermore, previous researchers focused on the thermal
protective performance of fabrics (for industrial use) under hot-water splash conditions
(Gholamreza & Song, 2013; Lu, et al., 2013b; Lu, et al., 2013c; Lu, et al., 2014). However, on-
duty firefighters are not so likely to be exposed to hot-water splash only. They do kneel and
crawl on the floor while working to extinguish fires and rescue fire-victims. While performing
these activities, their clothing is compressed specifically in the knees, elbows, and lower-legs.
The clothing may also be immersed in hot-water. This hot-water immersion with compression
can cause skin burns to firefighters’ arms, hands, legs, and feet (Barker, 2005; Lawson, 1996;
Lawson, et al., 2000). Burn injury statistics indicated that nearly 38% of burn injuries occurred
17
on firefighters’ arms/hands and legs/feet during the period 2007-2011 in the U.S. (Karter,
2013b). However, the thermal protective performance of fabrics under the hot-water immersion
with compression has not been widely studied.
As mentioned in the previous section, many national and international organizations (e.g.,
ASTM, ISO, NFPA) have developed standard test methods (e.g., ASTM F 2703, ASTM F 1939,
ASTM F 2702, ASTM F 2701, ISO 9151, NFPA 1971) to evaluate the performance of fabrics in
particular thermal exposures. By evaluating the thermal protective performances of fabrics using
these experimental methods, many researchers have also explained the relationship between
fabric properties and thermal protective performance (Benisek & Phillips, 1981; Lu, et al., 2014;
Rossi, et al., 2004; Rossi & Zimmerli, 1994; Shalev & Barker, 1984). However, these
experimental methods are fabric-destructive in nature, expensive, and difficult to carry out on a
routine basis (Benisek & Phillips, 1979; Stull, 1997). Therefore, an empirical analysis for
predicting the thermal protective performance of fabrics could save time and reduce costs. MLR
and ANN techniques have been successfully employed to empirically model the complex
relationships between input and output variables in the textile fabrics and clothing fields. For
example, they have been used to predict the fabric spirality, seam quality (Hui & Ng, 2009;
Majumdar & Majumdar, 2004; Murrells, Tao, Xu, & Cheng, 2009; Pynckels, Kiekens, Sette,
Van-Langenhove, & Impe, 1995). Although MLR models provide simple predictions of the
output variables, the prediction accuracy of ANN models is greater in most fields where they
have been applied. To date, no empirical MLR and ANN models have been used for predicting
the thermal protective performance (output variable) of textile fabrics from fabric properties
(input variables). Also, as previous researchers have not explained the significant fabric
properties affecting thermal protective performance (Benisek & Phillips, 1981; Lu, et al., 2014;

18
Rossi, et al., 2004; Rossi & Zimmerli, 1994; Shalev & Barker, 1984), the implementation of
these empirical MLR or ANN models for predicting the performance could be instrumental in
determining the relative importance of the significant fabric properties influencing thermal
protective performance.
19
Chapter 3
Research Methodology
3.1 Fabric selection and properties evaluation
In the manufactured thermal protective clothing for firefighters, layered fabric systems
are generally used. These fabric systems consist of different types of high-performance fabrics
(an outer shell, a moisture barrier, and/or a thermal liner) in an assembly (Makinen, 2008). The
high-performance fabrics used in this study were selected based on the fiber content, weave
structure, mass, thickness, and air permeability (Table 1). These fabrics are commercially
available and commonly used in the manufacturing of thermal protective clothing. By
assembling these fabrics in different combinations, layered fabric systems (single-, double-, and
triple-layered) were prepared to fulfil the objectives of this study (Table 2). Notably, the number
of prepared fabric systems or the sample size for this study was relatively small; however, the
small sample size is common to most textile experimental research and this does not adversely
affect the data analysis (Andersson, 1999; Wen, 2014). In these fabric systems, the outer layer
(OL) is facing the thermal exposure, the inner layer (IL) is closest to the skin simulant sensor or
the wearers’ skin, and the middle layer (ML) is sandwiched between OL and IL. The physical
properties (mass, thickness, air permeability, thermal resistance, and evaporative resistance) of
each of these fabrics or fabric systems were measured according to ASTM standards and their
mean value is calculated by maintaining a Coefficient of Variation (CV) between 1-2.5% (see
Appendices 1-3). These mean values are presented in Table 1 and Table 2. It should be noted
that the mean values of three specimens are presented in my published papers (Mandal, et al.,
2013a; Mandal, et al., 2014), but I calculated the mean values of ten specimens for the thesis. As
a consequence, the mean values reported in the thesis are slightly different from the values

20
reported in my published papers. Furthermore, the measured physical properties (mass,
thickness, air permeability, thermal resistance, and evaporative resistance) were considered as
independent variables with respect to the dependent variable (thermal protective performance)
for the statistical data analysis. Here, the number of physical properties considered was limited to
four because the sample size of this study is relatively small. Generally, fewer independent
variables are recommended for statistical analysis, especially where the sample size is small
(Wen, 2014).

21
Table 1. Constructional features of fabrics used in this work
aMeasured according to ASTM D 3776 (ASTM International, 2009).
bMeasured according to ASTM D 1777 under 1kPa pressure (ASTM International, 1996).
cMeasured according to ASTM D 737 under air pressure differential 125Pa (ASTM International, 2004).
Fabric types Fiber content Weave structure Mass
a
(g/m2)
Thicknessb
(mm)
Air
permeabilityc
(cm3/cm
2/s)
A (Outer Shell) 60% Kevlar
® aramid and
40% Polybenzimidazole Plain weave, rip-stop woven 248 0.69 15.7
B (Thermal liner) 100% Nomex® aramid
Plain weave Nomex®
layer
quilted to two thin Nomex®
oriented webs
209 1.63 43.2
C (Thermal liner) 100% Nomex® aramid
Plain weave Nomex®
layer
quilted to Nomex® needle-felted
batt
289 2.13 40.6
D (Thermal liner) 100% Nomex® aramid
Plain weave Nomex®
layer
quilted to Nomex® scrim,
needle-felted batt, and scrim
351 3.18 38.4
E (Moisture Barrier) 85% Nomex-IIIA
® and
15% polyurethane
Plain weave Nomex®
back-
coated with polyurethane film 211 0.85 0

22
Table 2. Structural configurations and physical properties of the fabric systems
aThe web side of Fabric B is in contact with wearers’ skin.
bThe scrim side of Fabric D is in contact to wearers’ skin.
cThe batt side of Fabric C is in contact with wearers’ skin.
dThe polyurethane coated side of Fabric E faces Fabric A.
eThe polyurethane coated side of Fabric E faces a thermal exposure.
fMeasured according to ASTM D 1518 (ASTM International, 2014a).
gMeasured according to ISO 11092 (ISO, 2014).
Fabric
construction
Fabric
systems
Structural
configurations
Thick-
ness
(mm)
Air
permeability
(cm3/cm
2/s)
Thermal
resistancef
( ºK·m2/W )
Evaporative
resistanceg
( m2·Pa/W)
Single-
layered A Fabric A 0.69 15.71 0.073 4.40
Double-
layered
AB Fabric A (OL) + Fabric Ba (IL) 2.18 13.59 0.117 9.87
AD Fabric A (OL) + Fabric Db (IL) 3.53 13.30 0.169 12.70
AE Fabric A (OL) + Fabric Ed (IL) 1.42 0 0.095 20.70
EA Fabric Ee (OL) + Fabric A (IL) 1.42 0 0.095 21.17
Triple-
layered
AEB Fabric A (OL) + Fabric Ed (ML) + Fabric B
a (IL) 2.88 0 0.129 25.90
AEC Fabric A (OL) + Fabric Ed (ML) + Fabric C
c (IL) 3.49 0 0.151 25.40
AED Fabric A (OL) + Fabric Ed (ML) + Fabric D
b (IL) 4.23 0 0.184 28.03
EAC Fabric Ee (OL) + Fabric A (ML) + Fabric C
c (IL) 3.49 0 0.151 25.37
23
3.2 Test conditions and approaches
The protective performances of three specimens of each selected single-, double-, and
triple-layered fabric system were evaluated for each thermal exposure using bench-scale tests.
Before testing, the specimens were conditioned at 20±2°C temperature and 65±5% relative
humidity for at least 24 hours in accordance with ASTM D 1776 (ASTM International, 2015).
Then, these specimens were subjected to the laboratory-simulated thermal exposure until the
time required to generate a second-degree burn on human skin was reached (see details in
sections 3.2.1-3.2.6). The standard deviation (SD) of the mean burn time for three specimens of
each fabric system in the thermal exposure was maintained within the limits of 2.5%. If the
standard deviation of mean burn time obtained from three specimens was not within this limit,
more specimens were tested to maintain the limit (see Appendices 4-9). The mean result of
second-degree burn time of a fabric system is defined as its ‘thermal protective performance’
under the specific test.
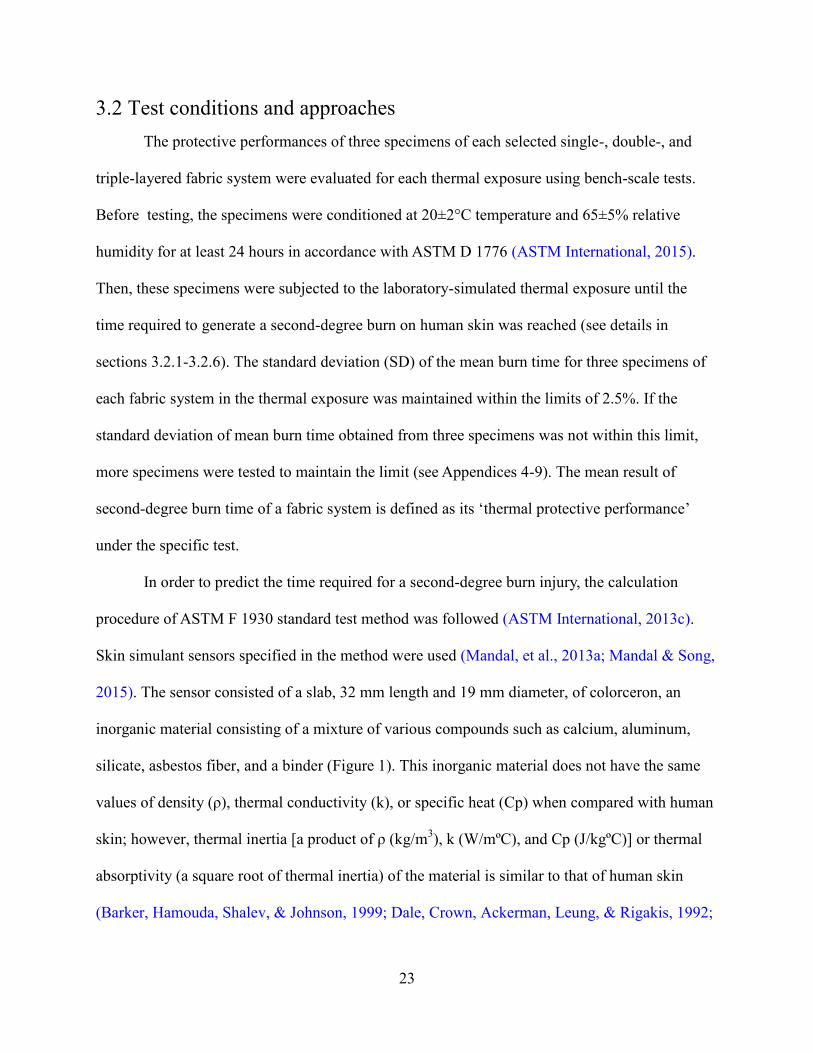
In order to predict the time required for a second-degree burn injury, the calculation
procedure of ASTM F 1930 standard test method was followed (ASTM International, 2013c).
Skin simulant sensors specified in the method were used (Mandal, et al., 2013a; Mandal & Song,
2015). The sensor consisted of a slab, 32 mm length and 19 mm diameter, of colorceron, an
inorganic material consisting of a mixture of various compounds such as calcium, aluminum,
silicate, asbestos fiber, and a binder (Figure 1). This inorganic material does not have the same
values of density (ρ), thermal conductivity (k), or specific heat (Cp) when compared with human
skin; however, thermal inertia [a product of ρ (kg/m3), k (W/mºC), and Cp (J/kgºC)] or thermal
absorptivity (a square root of thermal inertia) of the material is similar to that of human skin
(Barker, Hamouda, Shalev, & Johnson,,1999; Dale, Crown, Ackerman, Leung, & Rigakis, 1992;

24
Torvi, 1997). Here, a type-T thermocouple (copper-constantan) is held on the surface of the
colorceron slab (by an epoxy-phenolic adhesive that can tolerate temperatures up to 370ºC) to
measure the temperature increase of the slab during the thermal exposure. During the thermal
exposures, the energy transmitted through the fabric systems is processed at every 0.1s by the
skin simulant sensor. In this process, the skin simulant sensor works according to the skin model
(Figure 2). Based on this model, the thermal energy transmitted within the sensor is represented
as a transient, one dimensional heat diffusion problem in which the temperature within the
human skin (epidermis layer) and under the human skin (dermis, subcutaneous layers) varies
with skin depth and exposure time (ASTM International, 2013c). In this study, using the surface
(epidermis skin) temperatures of the slab measured by thermocouple, the time for a second-
degree skin burn injury was calculated using Henriques Burn Integral (HBI) equation (Equations
1 and 2) (Henriques, 1947; Henriques & Moritz, 1947).
Figure 1. Skin simulant sensor
32mm
19mm
Colorceron Body
Type-T
Thermocouple

25
Figure 2. Human skin model
)exp(RT
EP
dt
d
……………………………………………………………………..Equation 1
Mathematical integration of Equation 1 yields,
dtPt RTE
0
)/(
exp …………………………………………………………………Equation 2
where,
Ω = burn injury parameter (dimensionless),
P = frequency factor (2.185×10124
seconds−1
at T < 50°C and 1.823×1051
seconds−1
at T > 50°C),
ΔE = activation energy (J/kmol),
R = universal gas constant (8.315 J/kmolK) (i.e., ΔE/R = 93534.9 K at T < 50°C and ΔE/R =
39109.8 K at T > 50°C),
T = temperature (K) at epidermis skin depth of 75 × 10−6
m, and
t = time (seconds) for which T is above 317.15 K (44°C).
Subcutaneous
Dermis
Epidermis
Thermal Exposures

26
The time at which Ω reaches a value of 1 in Equation 2 is called the ‘second-degree burn time’
(Heath, 2000).
3.2.1 Flame exposure test
Protective performance in flame exposure was measured using a modified ISO 9151
testing approach as shown in Figure 3. The modification was primarily associated with the type
of sensor and data calculation technique to predict the thermal protective performance in terms of
time required for a second-degree burn injury. In the original ISO 9151 standard, a horizontally
oriented specimen of the fabric system (14×14 cm) is subjected to an incident heat flux of 80
kW/m2 from the flame of a gas burner placed beneath it (ISO, 1995). The heat passing through
the specimen is measured by means of a small copper calorimeter placed on top of and in contact
with the specimen. The time, in seconds, required to raise the temperature at 24±0.2°C in the
calorimeter is recorded; the mean result for three test specimens is calculated as the ‘heat transfer
index (flame)’. In the modified ISO 9151 standard, the flame was delivered from a Meker
propane gas burner with a diameter of 38 mm (Figure 3, a) (Mandal, et al., 2013a). The burner
was adjusted to deliver a heat flux of 84 kW/m2. The fabric specimen of size 10×10 cm (Figure
3, b) was mounted above the burner using the specimen support frame (Figure 3, c) with the
outer layer of the fabric system facing the burner. The fabric specimen was protected from the
heat source before and after the test run. At the time of the test, the burner was placed beneath
the fabric specimen and the flame was delivered for a time that depended on the structure (i.e.,
the composition and number of layers) of fabric system. The thermal energy transferred through
the fabric specimen was processed using a skin simulant sensor (Figure 3, d) mounted on an
insulating board and located behind the fabric specimen. The surface (epidermis skin)
temperature of the sensor was recorded and the second-degree burn time was calculated using the
customized software (Figure 3, e) that was programmed according to HBI equation.

27
Figure 3. Schematic diagram of the flame exposure test (a = gas burner, b = fabric specimen, c =
specimen support frame, d = skin simulant sensor, and e = HBI software)
3.2.2 Radiant heat exposure test
To measure thermal protective performance of fabrics in radiant heat exposure, the cone
calorimeter (Figure 4) test was conducted following a modified ASTM E 1354 testing approach.
The modification involved the use of a data acquisition technique for predicting the time required
for a second-degree burn injury as the means of evaluating the thermal protective performance of
fabrics. In the original ASTM E 1354 standard, a horizontally oriented specimen of the fabric
system (10×10 cm) is subjected to an incident radiant heat flux of 0-100 kW/m2 generated from
an electric spark placed on top of it; the ignitability, heat release rates, mass loss rates, effective
heat of combustion, and visible smoke development of the specimen in the certain duration
exposure are measured using an oxygen consumption calorimeter (ASTM International, 2014b).
In the modified ASTM E 1354 test, heat was generated by a truncated cone-shaped electrically
heated (5000W, 240V) coil (Figure 4, a) adjusted to deliver a heat flux of 84 kW/m2
(Mandal, et
al., 2013a). The specimen of the fabric system (15×15 cm) (Figure 4, b) was horizontally
mounted beneath the heated coil. The heat flux was kept uniform within the central 50 by 50 mm
d
b
a
c
e

28
area of the specimen. A transverse shutter was used to protect the fabric specimen from the heat
source before and after the test. The radiant heat exposure time for different fabric specimens
was varied according to the structure of the fabric system. A skin simulant sensor attached on a
frame (Figure 4, c) was placed behind the test specimen to process the thermal energy transferred
through the fabric system during the exposure. The surface (epidermis skin) temperature of the
sensor was recorded and the second-degree skin burn time was calculated using the customized
and programmed HBI software (Figure 4, d).
Figure 4. Schematic diagram of the radiant heat exposure test (a = cone-shaped electrically
heated coil, b = fabric specimen, c = skin simulant sensor on a frame, and d = HBI software)
3.2.3 Hot surface contact exposure test
Thermal protective performance of fabrics in hot surface contact exposure was measured
according to a modified ASTM F 1060 (Figure 5) method. The modification was primarily
associated with the hot surface temperature, type of sensor, and data calculation procedure to
predict the thermal protective performance. In the original ASTM F 1060 standard, a specimen
of the fabric system (10×15 cm) is horizontally placed in contact (contact-pressure is 3 kPa) with
a
b
c
d

29
a standard hot surface (temperature is up to 316ºC) (ASTM International, 2008d). The amount of
heat transmitted through the specimen is measured by a copper calorimeter placed on top of the
specimen; this calorimeter is mounted in an insulating block with added weight. Finally, the heat
measured is compared with the human tissue tolerance (pain sensation or a second-degree burn)
and the obvious effects of heat on the specimen (physical damage and degradation) are noted. In
the modified ASTM F 1060 test used, the specimen of the fabric system (10×15 cm) was placed
horizontally (Figure 5, a) on a hot surface plate of electrolytic copper (Figure 5, b) under a load
of 1 kg (Figure 5, c) (Mandal, et al., 2013a) . The temperature of the hot surface (Figure 5, d)
was controlled at 400°C using variable power supply with a thermocouple (Figure 5, e). Heat
transmitted through the test specimen was processed by a skin simulant sensor (Figure 5, f)
mounted above the fabric specimen on an insulated board. The exposure time varied depending
on the composition and number of layers of the fabric system, since the test ran until the
transferred energy was sufficient to generate a second-degree skin burn injury. The skin simulant
sensor (Figure 5, f) and customized HBI software (Figure 5, g) were used to calculate the time
required for a second-degree skin burn injury.
30
Figure 5. Schematic diagram of the hot surface contact exposure test (a = fabric specimen, b =
hot surface plate of electrolytic copper, c = a load of 1 kg, d = hot surface, e = variable power
supply with a thermocouple, f = skin simulant sensor, and g = HBI software)
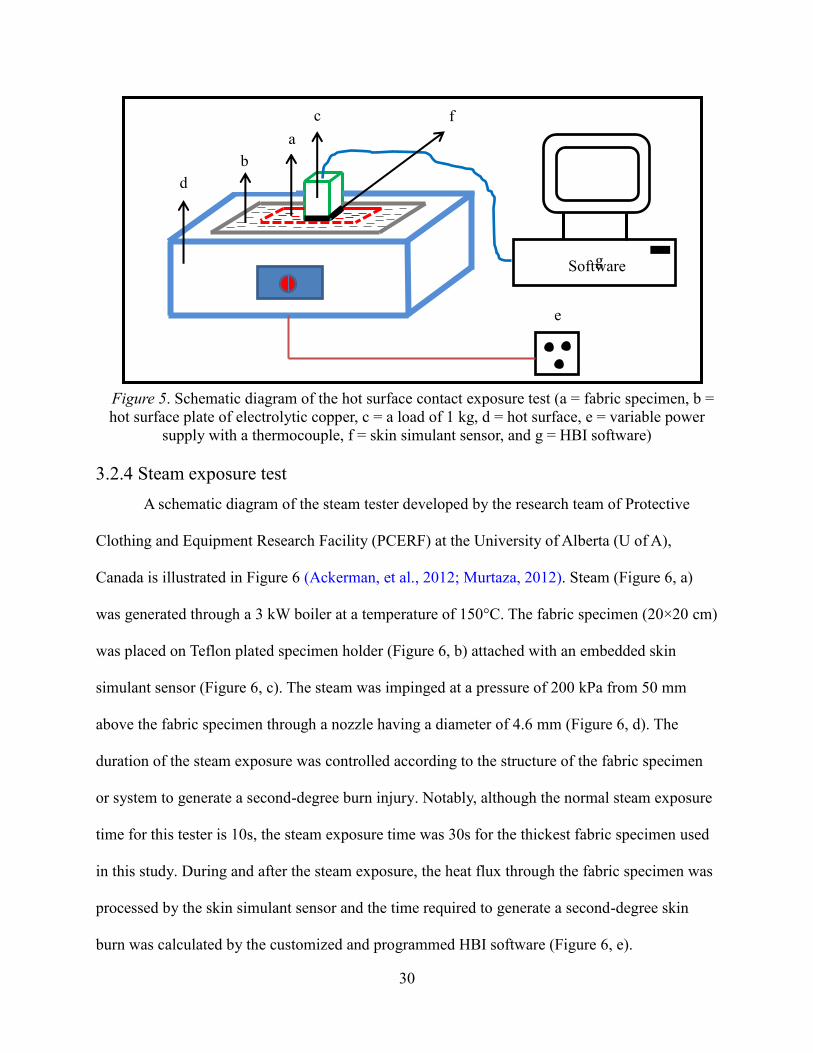
3.2.4 Steam exposure test
A schematic diagram of the steam tester developed by the research team of Protective
Clothing and Equipment Research Facility (PCERF) at the University of Alberta (U of A),
Canada is illustrated in Figure 6 (Ackerman, et al., 2012; Murtaza, 2012). Steam (Figure 6, a)
was generated through a 3 kW boiler at a temperature of 150°C. The fabric specimen (20×20 cm)
was placed on Teflon plated specimen holder (Figure 6, b) attached with an embedded skin
simulant sensor (Figure 6, c). The steam was impinged at a pressure of 200 kPa from 50 mm
above the fabric specimen through a nozzle having a diameter of 4.6 mm (Figure 6, d). The
duration of the steam exposure was controlled according to the structure of the fabric specimen
or system to generate a second-degree burn injury. Notably, although the normal steam exposure
time for this tester is 10s, the steam exposure time was 30s for the thickest fabric specimen used
in this study. During and after the steam exposure, the heat flux through the fabric specimen was
processed by the skin simulant sensor and the time required to generate a second-degree skin
burn was calculated by the customized and programmed HBI software (Figure 6, e).
Software
b
a
f c
e
g
d

31
Figure 6. Schematic diagram of the steam exposure test (a = steam from boiler, b = fabric
specimen holder, c = skin simulant sensor, d = steam impingement nozzle, and e = HBI software)
3.2.5 Hot-water splash exposure test
The hot-water splash test was conducted using a modified ASTM F 2701 (Figure 7)
method (Jalbani, Ackerman, Crown, Keulen, & Song, 2012; Lu, et al., 2013b). In the original
ASTM F 2701 standard, hot-water is hand-poured on the fabric specimen through a funnel to
create a 10s hot-water splash exposure for evaluating the thermal protective performance of the
specimen using copper calorimeters (ASTM International, 2008c). However, Jalbani, et al.
(2012) found that this pouring procedure is unrealistic and can affect the hot-water flow rate and
repeatability, resulting in an increase in measurement errors. They replaced the funnel with a
small pipe, directly fed by a circulating hot-water bath via a small pump through a hose and
valve system; this modification provides a consistent application of a given quantity of water at a
consistent temperature and flow rate. The equipment was further modified as described by
Mandal, et al. (2013a) to replace the copper calorimeters with skin simulant sensors. Each fabric
a
d
c
b
e

32
specimen (30×30 cm) was mounted on an inclined (45°) sensor board (Figure 7, a) made of a
nonconductive, liquid and heat resistant material. The sensor board had two skin simulant
sensors – an upper sensor (Figure 7, b1) representing a direct exposure point of the fabric system
to the hot-water, and a lower sensor (Figure 7, b2) representing an off-direct exposure point of the
fabric system to the hot-water. Notably, only the data obtained from the upper sensor was used
for this study. Here, hot-water was prepared in a circulating bath (Figure 7, c) and its temperature
was maintained at 85°C using a temperature control device (Figure 7, d). The hot-water was
initially circulated by a pump (Figure 7, e) through a circulation valve attached with a flow
control valve (Figure 7, f) in order to regulate the water temperature within the pipe at 85°C.
Using a water tap (Figure 7, g), the hot-water was then passed through the water outlet (Figure 7,
h). By employing a thermocouple at the front of the outlet, the water temperature was constantly
monitored. Next, the fabric specimen was continuously exposed to the hot-water until a second-
degree burn was predicted. The duration of the water flow depended upon the structure of the
fabric specimen or system being tested. The thermal energy (in the form of heat and mass
transmitted through the specimen) at the direct exposure point was processed using the skin
simulant sensor (Figure 7, b1). The surface (epidermis skin) temperature of the sensor was
recorded and used to calculate the time required for a second-degree skin burn injury using the
customized and programmed HBI software (Figure 7, i).

33
Figure 7. Schematic diagram of the hot-water splash exposure test (a = inclined sensor board, b1 = upper skin simulant sensor, b2 =
lower skin simulant sensor, c = hot-water bath, d = temperature control device, e = pump, f = circulation valve attached with flow
control valve, g = water tap, h = water outlet, and i = HBI software)
f
g
h
e
b2
b1
a
i c
d

34
3.2.6 Hot-water immersion with compression exposure test
The hot-water immersion with compression test was carried out using a new test
apparatus available at the U of A, Canada (Mandal & Song, 2014b; Mandal & Song, 2014c). In
this study, a metal platform with perforated top surface (Figure 8, a) was positioned at the
bottom-center of a hot-water bath (Figure 8, b). Then, water (Figure 8, c) was poured into the
bath up to a level 6 cm above the perforated top surface. The water temperature was maintained
at 75ºC, 85ºC, or 95ºC using a temperature control device (Figure 8, d). Next, a 30.5×30.5 cm
fabric specimen (Figure 8, e) was attached with a rubber band (Figure 8, f) to the skin simulant
sensor (Figure 8, g) mounted on a cylindrical weight (Figure 8, h). This specimen-covered sensor
was immersed into the hot-water bath using a pneumatic device (Figure 8, i) until the whole
assembly (specimen + sensor) rested flatly on the center of the perforated surface. Pressure was
applied to compress the specimen between the sensor and perforated surface and was
pneumatically controlled at 14 kPa (~2.0 psi), 28 kPa (~4.0 psi), or 56 kPa (~8.0 psi). Thermal
energy transmitted through the compressed specimen was processed by the sensor for a period of
120s. From the thermal energy, time required to generate a second-degree skin burn was
calculated by the customized HBI software (Figure 8, j).

35
Figure 8. Schematic diagram of the hot-water immersion with compression exposure test [a = metal platform with perforated top
surface, b = hot-water bath, c = hot-water, d = temperature control device, e = fabric specimen, f = rubber band, g = skin simulant
sensor, h = cylindrical weight, i = pneumatic device (i1= pneumatically controlled up and down device, i2 = pressure gauge, i3 = air
compressor), and j = HBI software]
e
b
d
i3 c
i2
a
g
h
f
i1
j

36
3.3 Procedure to analyze the experimental results
The second-degree skin burn times of the selected fabric systems obtained from the tests
described above were tabulated. The thermal protective performances of the fabric systems were
ranked or rated according to the time required to generate a second-degree burn injury in each
thermal exposure. The physical properties (e.g., thickness, air permeability, thermal resistance,
and evaporative resistance) and thermal protective performances (second-degree burn times) of
the fabric systems were normalized between −1 and +1, with the average value set to zero. The
normalized variable Xi,norm was calculated by Equation 3, where,
)](),[( min,,,max,max, iavgiavgiii XXXXMaximumR . This normalization process reduced the
redundancy rates in the data by pulling out abnormal factors, and it helped to distribute the data
with normal probability plot.
max,
,
,
i
avgii
normiR
XXX
…………………………………………………………………….Equation 3
In Equation 3,
Xi is the value of a selected variable (thickness, air permeability, thermal resistance, evaporative
resistance, or second-degree burn time),
Xi,avg is the average value of that particular variable,
Xi,min is the minimum value of that variable,
Xi,max is the maximum value of that variable, and
Ri,max is the maximum range between the average value and either the minimum or the maximum
of that variable.
In order to understand the association between the physical properties of fabric systems
and thermal protective performance in a thermal exposure, a linear regression t-test of the
normalized data set was conducted using the StatCrunchTM
5.0 software (StatCrunch, n.d.). The

37
association was inferred based on the + or – sign of the T-stat value obtained from the t-test; this
association was further justified through the theories of heat and mass transfer. P-values obtained
from the t-test for individual fabric properties were analyzed to identify the fabric properties that
significantly affected the thermal protective performance. Significance tests were carried out at
the significance level 0.05. Thus, if the obtained P-value for any considered property was less
than 0.05, that property was inferred to be statistically significant. Relationships between the
significant fabric properties and the thermal protective performance were plotted, and the
coefficients of determination (R2) of these plots were calculated. An R
2 value with proximity to 1
was inferred as a strong association between the significant fabric property and thermal
protective performance. Inference tests [hypothesis test (P-value) and confidence interval (upper
and lower limits)] were carried out to understand the differences in thermal protective
performances of different fabric systems in various thermal exposures. The significant properties
were further used in the MLR and ANN models for predicting the thermal protective
performance in a thermal exposure; for the modeling, a linear relationship was assumed between
the significant fabric properties and thermal protective performance. These MLR and ANN
models were then statistically compared based on their predicting performance parameters [R2,
Root Mean Square Error (RMSE), P-values]. This comparison process was applied to identify
the best-fit high-performance models to predict the thermal protective performance. During the
comparison, a model with high R2, low RMSE, and P-values of <0.05 was inferred as the best-fit
high-performance model. The best-fit high-performance model was further used in a saliency test
to understand the relative importance of the significant fabric properties on thermal protective
performance. Here, the saliency test was conducted by eliminating only one designated
significant fabric property from the best-fit model at a time. The increase in RMSE value in the

38
saliency test compared to the best-fit model was considered as the indicator of importance of the
eliminated significant fabric property; the eliminated property that generated the highest RMSE
was inferred to be the most important property for thermal protective performance. In the
following section, the modeling methodologies of MLR and ANN are thoroughly discussed.
3.3.1 MLR modeling
In this study, the standard MLR models were used to predict the thermal protective
performance using the significant properties (under various thermal exposures) obtained from the
t-test analysis. This modeling was carried out using the StatCrunchTM
5.0 statistical software
(StatCrunch, n.d.). A generic form of these MLR models used is shown in Equation 4.
nn SFPSFPSFPCePerformanc )(...)()()( 2211 ….........................................Equation 4
where,
C = identically distributed constant normal error,
(SFP)1…(SFP)n = significant fabric properties, and
β1…βn = regression coefficients that determine relative strength of the respective significant
fabric properties.
Here, a notable inherent limitation of the MLR model is that it should not be used to
predict the output variable (thermal protective performance) beyond the range of the values of
the input variables (significant fabric properties) employed in the model (Hui & Ng, 2009;
Majumdar & Majumdar, 2004; Murrells, et al., 2009; Pynckels, et al., 1995).
3.3.2 ANN modeling
The ANN used is a powerful data modeling tool that could capture and represent any
kind of relationship between the input (significant fabric properties obtained from the t-tests) and
output (thermal protective performance) variables (Arupjoyti & Iragavarapu, 1998; Hui & Ng,
2009; Majumdar & Majumdar, 2004; Murrells, et al., 2009; Pynckels, et al., 1995; Zaefizadeh,

39
Khayatnezhad, & Gholamin, 2011). By using the ANN modeling technique, different ANN
models were developed in this study for predicting the thermal protective performance of fabrics
under various thermal exposures. In these ANN models, three layers were used – input layer,
hidden layer, and output layer. These models were constructed using the MATLAB® 6.1
software (MATLAB, n.d.). For constructing a suitable model, an important point to consider was
to decide upon the architecture of the ANN as it can have different architectures. Keeping all this
in mind, various ANN architectures were deployed and investigated considering one hidden
layer. Through this investigation, it was found that a three-layered feed-forward back
propagation ANN model (with one hidden layer) can be a universal technique to model a
complex linear function (Figure 9). In this three-layered feed-forward model, each layer of the
neural network contained connections to the next layer (e.g., from the input to the hidden layer),
but there were no connections back. Here, all the neurons in a particular layer received a signal
from the neurons of the previous layer. The signal received was then multiplied by a weight
factor known as a synaptic weight. Next, the weighted inputs were summed up and passed
through a transfer function to generate the output in a fixed range of values. This output was then
transferred to the neurons of the next layer. As the models used back propagation supervised
training form (the gradient descent with momentum constant), the final outputs predicted were
always compared with the actual output. Through this comparison, the back propagation training
algorithm calculated the prediction error and adjusted the synaptic weight of various layers
backward from the output to the input layer. This weight adjustment process worked based on a
delta rule and decreased the error signal iteratively. Eventually, the model got closer and closer
to produce the desired final output. The delta rule used is shown in Equation 5, where, W(n) =
the weight connecting between two neurons at the nth
iteration, ΔW(n) = the weight correction

40
applied to the W(n) at the nth
iteration, E = predicted error signal at the nth
iteration, and η =
learning rate parameter constant. The hyperbolic tangent sigmoid transfer function (Equation 6)
was assigned as an activation function in the hidden layer, and the linear function (Equation 7)
was used in the output layer. These specific functions were used because they can easily be
applied with all types of data and can provide the best performance for an ANN model (Hui &
Ng, 2009). In the Equations 6 and 7, x is the weighted sum of inputs to a neuron and f(x) is the
transformed output from that neuron. In this regard, a challenge in using the feed-forward back
propagation ANN model was to decide the number of neurons in the hidden layer. If the neurons
are too few in the hidden layer, the model is unable to differentiate between complex patterns,
and it might lead to a linear estimate of the actual relationship between the inputs and output
variables; whereas, if the neurons are too many, the model follows a noise in the data set, and it
might lead to an inaccurate output (Murrells, et al., 2009). In order to choose the optimum
number of neurons in the hidden layer, the feed-forward ANN models were trained with two to
ten neurons, and the best predictive ANN models was found with five hidden neurons (Figure 9)
(Mandal & Song, 2012a; Mandal & Song, 2014a). In the present study, by default, MATLAB
software randomly used 70% of the data (significant properties and thermal protective
performance) for the training, 15% of the data for the validation, and the remaining 15% of the
data to test the predicting performance of the ANN models. Contextually, it is notable that these
ANN models were trained with a small dataset. As a consequence, these models could be
unstable and may not be generalized for use in predicting thermal protective performance of all
types of fabrics.
)](/[)( nWEnW ………………………………………………………….........Equation 5
1
1
cosh
sinh)(
2
2
x
x
xx
xx
e
e
ee
ee
x
xxf …………………………………………………….Equation 6
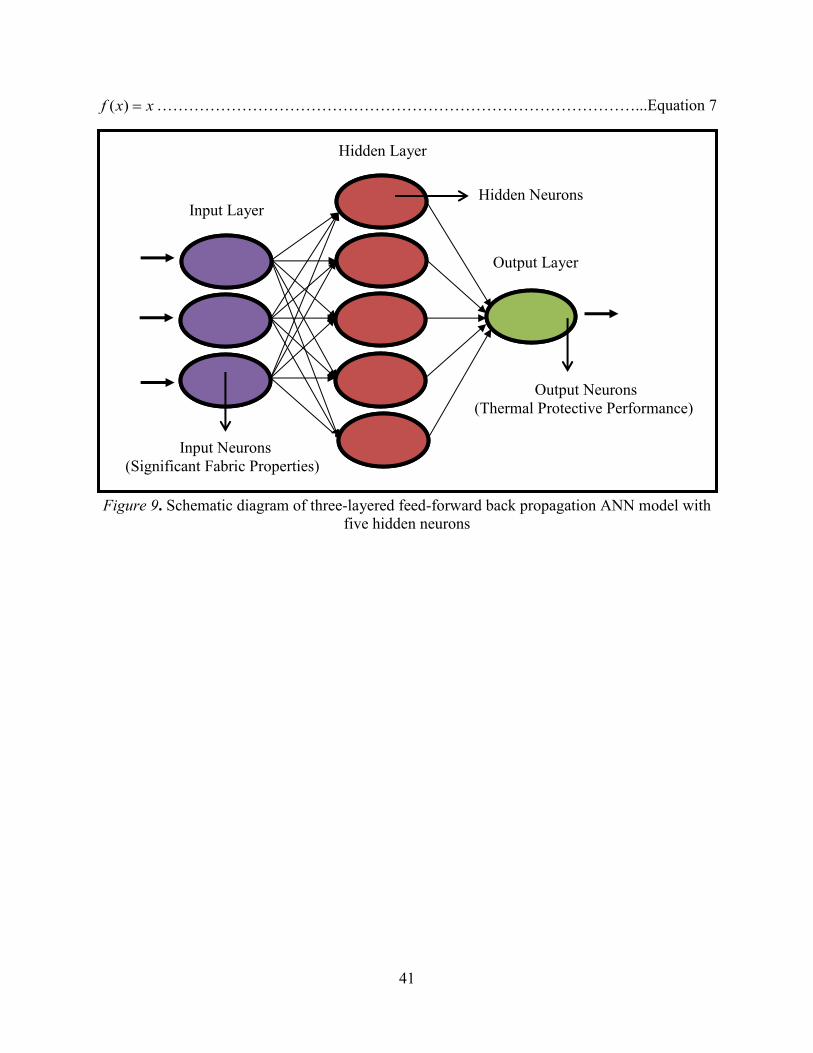
41
xxf )( ………………………………………………………………………………...Equation 7
Figure 9. Schematic diagram of three-layered feed-forward back propagation ANN model with
five hidden neurons
Input Layer
Hidden Layer
Output Layer
Hidden Neurons
Input Neurons
(Significant Fabric Properties)
Output Neurons
(Thermal Protective Performance)
42
Chapter 4
Results and Discussion
This results and discussion chapter is broadly divided into two sections (sections 4.1 and
4.2). In section 4.1, the results of the characterization of the thermal protective performance of
the fabrics under various thermal exposures (flame, radiant heat, hot surface contact, steam, hot-
water splash, and hot-water immersion with compression) are reported. Here, based on the
statistical significance tests [e.g., t-test, coefficient of determination (R2)], different fabric
properties significantly affecting the thermal protective performance are identified and discussed
through the theory of heat and mass transfer. Additionally, the differences in thermal protective
performance of two sets of fabric systems (e.g., air-permeable, air-impermeable) are
demonstrated through statistical inference tests (hypothesis test, confidence interval test). In
section 4.2, the thermal protective performance of the fabric systems are empirically analyzed by
employing the MLR and ANN modeling techniques. Here, the significant fabric properties
(identified in section 4.1) are used in the empirical MLR and ANN models to predict the thermal
protective performance of the fabric systems under each thermal exposure. Then, these empirical
MLR and ANN models are compared to identify the best fit model for predicting the thermal
protective performance of the fabric systems. The best fit model for each thermal exposure is
further used for saliency testing to find the relative importance of each significant fabric property
for the thermal protective performance of the fabric systems.
4.1 Characterization of thermal protective performance of fabrics under
various thermal exposures
During the flame exposure, a flame is produced through controlled combustion of
flammable propane gas. The flame generates a jet of hot gaseous molecules that move toward the

43
fabric surface. As the moving air mass imposes thermal energy on the fabric system, convection
is the primary mode of heat transfer in flame exposure (Arpaci & Larsen, 1984; Burnmeister,
1993). As some thermal energy also radiates from the flame surface toward the fabric, radiation
is the secondary mode of heat transfer in flame exposure. In radiant heat exposure,
electromagnetic waves radiate from a conical electrical heat source toward the fabric system
imposing electromagnetic energy on the fabric system; therefore, radiation is the primary mode
of heat transfer (Hsu, 1963; Siegel & Howell, 2002). Physical contact between the fabric system
and hot surfaces results in conduction being the primary mode of heat transfer in hot surface
contact exposure (Arpaci, 1966). Convection and/or diffusion are the primary modes of mass
(water molecules) and heat transfer through the fabric system, especially in steam, hot-water
splash, and hot-water immersion with compression exposures (Bergman, et al., 2011).
The thermal protective performance of the fabric systems varies under each type of
thermal exposure, depending upon heat and/or mass transfer through the fabric system. Flame,
radiant heat, and hot surface contact exposures transfer mainly heat through the fabric systems
(Arpaci, 1966; Arpaci & Larsen, 1984; Hsu, 1963); whereas, mainly mass transfer (through
water containing a large amount of thermal energy) occurs in steam, hot-water splash, and hot-
water immersion with compression exposures (Bergman, et al., 2011). During mass transfer,
liquid and vaporized water molecules diffuse along their concentration gradients i.e., from the
high concentration regions towards the low concentration regions. As the steam exposure occurs
under high pressure, it is expected that the vaporized water molecules have a greater momentum
than the liquid water molecules present in the hot-water exposures (splash, and immersion with
compression). In turn, the mass transfer rate is greater during steam exposures than during hot-
water exposures.

44
4.1.1 Thermal protective performance in flame, radiant heat, and hot surface
contact exposures
The thermal protective performance (second-degree burn times) of the selected fabric
systems (A–EAC) obtained through laboratory-simulated flame, radiant heat, and hot surface
contact exposures are presented in Table 3. In agreement with previous literature (Benisek &
Phillips, 1981; Shalev & Barker, 1984), second-degree burn times of triple-layered fabric
systems are mostly higher than second-degree burn times of single- and double-layered fabric
systems, inferring that triple-layered fabric systems will provide more protection to a wearer than
single- and double-layered fabric systems in flame, radiant heat, or hot surface contact
exposures. Actually, the greater number of air layers and extra trapped air inside the triple-
layered fabric systems contribute to their high second-degree burn times (Song, et al., 2011a;
Song, et al., 2011b).
Table 3. Thermal protective performance (second-degree burn time in seconds) under flame,
radiant heat, and hot surface contact exposures
Fabric
construction
Fabric
systems
Second-degree burn time in seconds
Flame Radiant heat Hot surface contact
Single-layered A 2.75 4.64 1.51
Double-layered
AB 12.81 11.90 4.77
AD 16.59 24.18 6.87
AE 9.58 9.22 5.16
EA 5.72 7.91 3.54
Triple-layered
AEB 11.79 17.60 9.45
AEC 15.74 23.19 16.27
AED 20.84 27.93 17.30
EAC 15.47 20.59 7.22
To understand the impact of the fabric systems’ properties on the second-degree burn
times, the experimental dataset comprising fabric thickness, air permeability, thermal resistance,
evaporative resistance, and second-degree burn time of each thermal exposure was normalized
following the procedure indicated in section 3.3 titled “Procedure to analyze the experimental

45
results” and t-tests were carried out. Results obtained from the t-tests (T-stat and P-value) are
shown in Table 4.
Table 4. Results of t-tests between fabric system properties and second-degree burn time in
flame, radiant heat, and hot surface contact exposures
Fabric system properties
Second-degree burn time in seconds
Flame Radiant heat Hot surface contact
T-Stat P-value T-Stat P-value T-Stat P-value
Thickness 8.96 0.0001 17.68 0.0001 3.78 0.007
Air permeability -0.76 0.47 -0.82 0.43 -1.59 0.15
Thermal resistance 9.72 0.003 17.78 0.002 3.33 0.01
Evaporative resistance 1.71 0.13 1.87 0.11 2.67 0.16
As shown in Table 4, the T-stat values for fabric air permeability and evaporative
resistance are negative and positive, respectively, in the exposures of flame, radiant heat, and hot
surface contact. The negative and positive T-stat values indicate a negative and positive
association between fabric air permeability and second-degree burn time (as air permeability
increases or evaporative resistance decreases, second-degree burn time decreases). Basically, a
fabric system with high air permeability generally reduces the evaporative resistance of the
fabric system and that helps to move the thermal energy through the fabric system. However, the
impact of air permeability and evaporative resistance is not significant as indicated by the P-
values which are all much greater than 0.05. In the flame, radiant heat, and hot surface contact
exposures, fabric air permeability and evaporative resistance did not significantly impact the
second-degree burn times.
The T-stat values for fabric thickness and thermal resistance are also positive in the
exposures of flame, radiant heat, and hot surface contact. Hence, the association between these
two fabric properties (fabric thickness and thermal resistance) and second-degree burn time is
positive in these exposures. Furthermore, P-values of fabric thickness and thermal resistance
under these exposures are all less than 0.05. These P-values as expected indicate that thickness

46
and thermal resistance are highly significant fabric properties for effective protection under
flame, radiant heat, and hot surface contact exposures. However, P-values of fabric thickness are
significantly less than the P-values of fabric thermal resistance. From this, it can be inferred that
fabric thickness is a more significant property than fabric thermal resistance. In the same context,
it is notable that the thickness could affect the thermal resistance of the fabric. The values in
Table 4 also suggest that P-value of fabric thickness in hot surface contact exposure is
significantly higher than flame and radiant heat exposures. This indicates that fabric thickness is
less significant property for second-degree burn time in hot surface contact exposure. Basically,
heat or thermal energy transfer in hot surface contact exposure proceeds through a pressure or
load on the fabric system that is not present in flame and radiant heat exposures. Consequently,
heat or thermal energy transfer mechanism through the fabric systems in hot surface contact
exposure differs from both the flame and radiant heat exposures. Relationships between fabric
thickness and second-degree burn time in flame, radiant heat, and hot surface contact exposures
are shown in Figure 10 to individually explain and compare the exposures in detail. In this
context, it has been hypothesized that thermal energy transfer mechanisms through multiphase
(solid fiber and gaseous air), non-homogeneous fabric systems entail a combination of
absorption, re-radiation/reflection, conduction, and possibly forced convection (Chitrphiromsri &
Kuznetsov, 2005; Shalev & Barker, 1984; Song, Chitrphiromsri, & Ding, 2008).
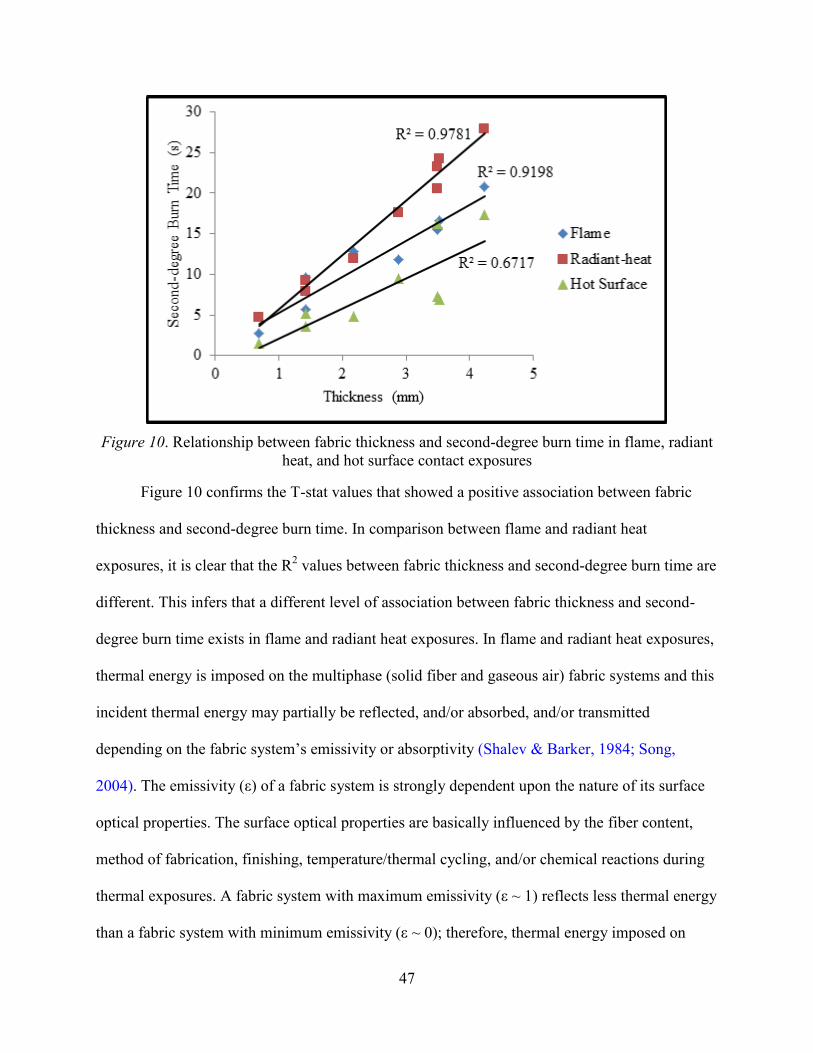
47
Figure 10. Relationship between fabric thickness and second-degree burn time in flame, radiant
heat, and hot surface contact exposures
Figure 10 confirms the T-stat values that showed a positive association between fabric
thickness and second-degree burn time. In comparison between flame and radiant heat
exposures, it is clear that the R2 values between fabric thickness and second-degree burn time are
different. This infers that a different level of association between fabric thickness and second-
degree burn time exists in flame and radiant heat exposures. In flame and radiant heat exposures,
thermal energy is imposed on the multiphase (solid fiber and gaseous air) fabric systems and this
incident thermal energy may partially be reflected, and/or absorbed, and/or transmitted
depending on the fabric system’s emissivity or absorptivity (Shalev & Barker, 1984; Song,
2004). The emissivity (ε) of a fabric system is strongly dependent upon the nature of its surface
optical properties. The surface optical properties are basically influenced by the fiber content,
method of fabrication, finishing, temperature/thermal cycling, and/or chemical reactions during
thermal exposures. A fabric system with maximum emissivity (ε ~ 1) reflects less thermal energy
than a fabric system with minimum emissivity (ε ~ 0); therefore, thermal energy imposed on

48
fabrics with high emissivity is mostly absorbed inside the fabric system and/or transmitted
toward the skin. In this study, the fabrics consist mainly of Kevlar®/PBI and Nomex
® fibers.
According to Song (2004), the emissivity of fabrics made from these fibers is nearly 0.9; in turn,
these fabrics have a significant contribution to absorb and/or transmit thermal energy toward
human skin. The thermal energy transmitted through a fabric system comes in direct contact with
the skin and may generate a burn injury. Also, thermal energy absorbed inside the fabric system
can move toward the wearer’s skin and generate a burn injury. Normally, thick fabric systems
provide higher protection against thermal exposure because they contain more trapped air than
thin fabric systems. The trapped air volumes act as an insulator, lowering the transmissivity of
the fabric system; hence, reducing the penetration rate of thermal energy from the fabric system
toward the skin. Adding a moisture barrier and a thermal liner to a shell fabric will substantially
increase wearers’ protection by increasing the number of air layers and the trapped air volume.
Although a triple-layered fabric system might contain more air between its layers than a single-
layered fabric contains in its pores, the insulating effect of the additional air space might be
compromised by the increase in thermal energy that can be stored inside the fabric layers. This
stored energy might also be transmitted toward the wearer’s skin over time. This energy would
transmit regardless of whether the fabric is compressed or not. As fabrics usually get compressed
at various locations (elbows, knees) when the wearer moves, this compression may reduce the
second-degree burn time or thermal protective performance of the fabric system (Song, et al.,
2011a; Song, et al., 2011b). Interestingly, as the R2 values between fabric thickness and second-
degree burn time in flame and radiant heat exposures are 0.92 and 0.98, respectively (Figure 10),
this infers that fabric thickness may be more strongly related to thermal protective performance
(second-degree burn time) in radiant heat exposure compared to flame exposure. This is because

49
in radiant heat exposure thermal energy is mostly transmitted through the fabric system (Torvi &
Threlfall, 2006) while in flame exposure, thermal energy imposed on the surface of the fabric
system mainly spreads horizontally and/or bounces back to the environment depending upon the
configuration of the exposure (e.g., angle of flame impingement, intensity of flame). Therefore,
fabric thickness plays a more significant role in heat or thermal energy transmission to the
wearer in radiant heat exposure than in flame exposure.
Furthermore, it can be identified from Figure 10 that the R2 in the hot surface contact
(R2=0.67) exposure is much lower than the flame (R
2=0.92) and radiant heat (R
2=0.98)
exposures. At any given thickness, the second-degree burn time in hot surface contact exposure
is also much lower than the flame and radiant heat exposures. To explain these phenomena, it is
necessary to understand the behavior of thermal energy imposed on a fabric system in a hot
surface contact exposure (Figure 11). Figure 11 shows that a physical contact establishes
between the hot surface and the fabric system in a hot surface contact exposure. The contact
resistance between the fabric system and the hot surface may vary depending on the surface
roughness of the fabric system (Figure 12). A fabric system with a rough surface (i.e., with high
contact resistance or a high static frictional coefficient) will have a tiny air gap at the interface
between the fabric system and the hot surface, which reduces the thermal energy transfer inside
the fabric system. A smooth fabric system surface (i.e., with a low contact resistance or low static
frictional coefficient) allows good thermal contact between the hot surface and the fabric system,
increasing the thermal energy transfer inside the fabric system. In the hot surface contact
exposure, compression of the fabric system also decreases the air volume in the fabric. Absence
of an air phase inside a compressed fabric system (between the wearer’s skin and a hot surface
contact) lowers the thermal insulation of the fabric system; hence, the second-degree burn time

50
or thermal protective performance is decreased. When the solid fiber phase inside the fabric
system predominates, the thermal conductivity of the fabric system is enhanced and its extinction
coefficient (i.e. how strongly the fabric system absorbs thermal energy) becomes high. Thermo-
physical properties (e.g., density, volumetric heat capacity) of the fabric system may also change
depending on the compression in the fabric system (Shalev & Barker, 1983). The rapid
transmission of thermal energy through a compressed fabric system generates a quick burn on
the wearer’s skin. Contact resistance between the fabric system and the wearer’s skin is also
reduced with fabric compression, and this situation aggravates the thermal energy transmission
toward the skin.
Figure 11. Behavior of thermal energy imposed on a fabric system in a hot surface contact
exposure (a = absorbed thermal energy, b = transmitted thermal energy)
Figure 12. Thermal energy transfer through the interface between hot surface contact and fabric
system

51
Fabric systems AEC and EAC have the same thickness but the thermal protective
performance of AEC is almost twice that of EAC in hot surface contact exposure (Table 3). This
is because in the EAC fabric system, the moisture barrier is present in the outer layer, whereas, in
the AEC fabric system the moisture barrier is present in the inner layer. The moisture barrier in
the EAC fabric system was in direct contact with the hot surface. In particular, the polyurethane
coated side of the moisture barrier contacted the hot surface and was noted to catch fire and melt
easily. This is because the ignition temperature of polyurethane, which is reported to be (~370°C)
(Bryner, Madrzykowski, & Grosshandler, n.d.; Klyosov, 2007, p. 480) is lower than the
temperature of the hot surface and lower than the ignition temperature of Kevlar®/PBI shell
fabric (~700°C). Melting or ignition of the moisture barrier does not maintain the integrity of the
fabric system, which enhances the transfer of thermal energy toward the skin, reducing the time
required to generate a second-degree burn. A molten surface on moisture barrier also reduces the
contact resistance between the hot surface and the fabric system; in turn, causing the poor
thermal protective performance of the fabric system. These phenomena are less pronounced for
the AEC fabric system as the outer layer in this fabric system comprises a Kevlar®/PBI fabric
that has high ignition temperature (~600°C) and high surface roughness; consequently, the
integrity of the fabric system is maintained and it efficiently slows down heat flow toward the
skin. The findings for fabric systems AE and EA can be similarly compared; these fabric systems
have the same thickness and air permeability but the burn time is higher (i.e., higher protection)
for AE than EA (Table 3) due to the position of the moisture barrier which is in the inner layer of
AE and in the outer layer of EA (notably, in EA fabric system, the polyurethane coated side of
moisture barrier gets exposed to hot surface contact). For flame exposure, the position of the
polyurethane coating in the AEC and EAC fabric systems had minimal effect on the thermal
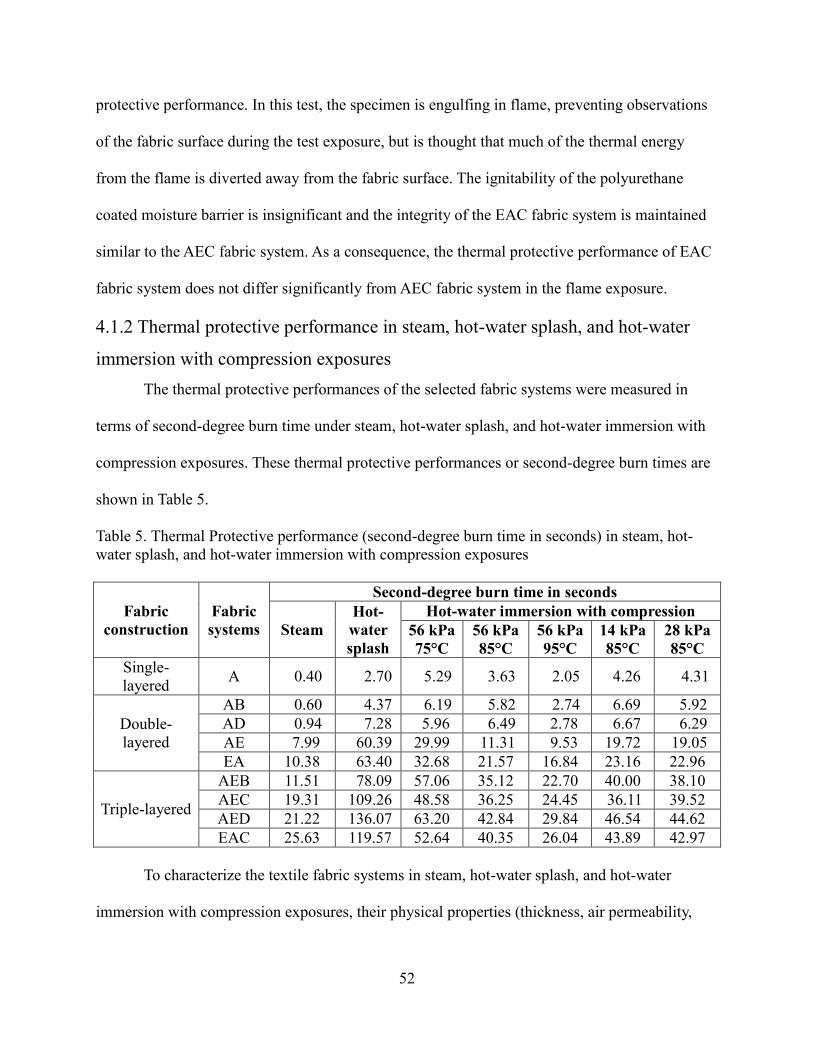
52
protective performance. In this test, the specimen is engulfing in flame, preventing observations
of the fabric surface during the test exposure, but is thought that much of the thermal energy
from the flame is diverted away from the fabric surface. The ignitability of the polyurethane
coated moisture barrier is insignificant and the integrity of the EAC fabric system is maintained
similar to the AEC fabric system. As a consequence, the thermal protective performance of EAC
fabric system does not differ significantly from AEC fabric system in the flame exposure.
4.1.2 Thermal protective performance in steam, hot-water splash, and hot-water
immersion with compression exposures
The thermal protective performances of the selected fabric systems were measured in
terms of second-degree burn time under steam, hot-water splash, and hot-water immersion with
compression exposures. These thermal protective performances or second-degree burn times are
shown in Table 5.
Table 5. Thermal Protective performance (second-degree burn time in seconds) in steam, hot-
water splash, and hot-water immersion with compression exposures
Fabric
construction
Fabric
systems
Second-degree burn time in seconds
Steam
Hot-
water
splash
Hot-water immersion with compression
56 kPa
75°C
56 kPa
85°C
56 kPa
95°C
14 kPa
85°C
28 kPa
85°C
Single-
layered A 0.40 2.70 5.29 3.63 2.05 4.26 4.31
Double-
layered
AB 0.60 4.37 6.19 5.82 2.74 6.69 5.92
AD 0.94 7.28 5.96 6.49 2.78 6.67 6.29
AE 7.99 60.39 29.99 11.31 9.53 19.72 19.05
EA 10.38 63.40 32.68 21.57 16.84 23.16 22.96
Triple-layered
AEB 11.51 78.09 57.06 35.12 22.70 40.00 38.10
AEC 19.31 109.26 48.58 36.25 24.45 36.11 39.52
AED 21.22 136.07 63.20 42.84 29.84 46.54 44.62
EAC 25.63 119.57 52.64 40.35 26.04 43.89 42.97
To characterize the textile fabric systems in steam, hot-water splash, and hot-water
immersion with compression exposures, their physical properties (thickness, air permeability,

53
thermal resistance, and evaporative resistance) and second-degree burn times in a particular
exposure were normalized following the procedure indicated in section 3.3 titled “Procedure to
analyze the experimental results”. After the normalization, t-tests were carried out to analyze the
association between fabric system properties and second-degree burn times. Results obtained
from the t-tests (T-stat and P-value) are presented in Table 6.

54
Table 6. Results of t-tests between fabric system properties and second-degree burn times in steam, hot-water splash, and hot-
water immersion with compression exposures
Fabric
system
properties
Second-degree burn time in seconds
Steam Hot-water
splash
Hot-water immersion with compression
56 kPa
75°C
56 kPa
85°C
56 kPa
95°C
14 kPa
85°C
28 kPa
85°C
T-
Stat
P-
value
T-
Stat
P-
value
T-
Stat
P-
value
T-
Stat
P-
value
T-
Stat
P-
value
T-
Stat
P-
value
T-
Stat
P-
value
Thickness 2.07 0.07 2.05 0.08 1.86 0.09 2.47 0.04 2.11 0.07 2.18 0.07 2.18 0.06
Air
permeability -3.63 0.004 -4.71 0.002 -5.12 0.001 -3.54 0.009 -4.34 0.003 -4.37 0.003 -4.47 0.002
Thermal
resistance 1.66 0.14 1.67 0.13 1.44 0.19 1.91 0.10 1.67 0.14 1.69 0.13 1.68 0.14
Evaporative
resistance 4.67 0.002 6.74 0.003 8.20 0.0001 5.78 0.0007 6.78 0.0003 7.30 0.0002 7.32 0.0002

55
According to Table 6, P-values for air permeability and evaporative resistance are less
than 0.05; thus, air permeability and evaporative resistance significantly affect fabrics’ thermal
protective performance in steam, hot-water splash, and hot-water immersion with compression
exposures. Although the P-values of thickness (≤ 0.09) are higher than 0.05, thickness is still
considered one of the significant properties in steam and hot-water protection (Rossi, et al.,
2004). This is because fabric thickness plays an important role in preventing heat transfer
through fabric systems. However, thickness may not be so pertinent in steam, hot-water splash,
and hot-water immersion with compression exposures since mass transfer occurs through the
fabric systems and is the primary cause of skin burn injury. Fabric air permeability and
evaporative resistance are more important than thickness when mass transfer (hot-water) results
in a skin burn (Keiser, et al., 2010; Keiser, et al., 2008), thus, air permeability and evaporative
resistance of the fabric system are expected to be more significant properties in steam, hot-water
splash, and hot-water immersion with compression exposures. In Table 6, the T-stat values for
thickness and air permeability are positive and negative respectively, indicating that as thickness
increases, the time to a second-degree burn also increases, whereas an increase in the air
permeability results in a decrease in the time to a second-degree burn. As thick fabric systems
provide more thermal insulation than thin fabric systems (Song, et al., 2011a; Song, et al.,
2011b), heat transfer is lower and second-degree burn time is higher in thick fabric systems
compared to thin fabric systems. However, the presence of air pores in a highly air-permeable
fabric system may enhance the transfer of mass and thus reduce the time requirement for a
second-degree burn. For example, although the AD fabric system is thicker than the AE fabric
system, the second-degree burn time of AD fabric system is less than that of the AE fabric
system (Table 5). This difference in second-degree burn times is because the air permeability of

56
the AD fabric system is higher than the air permeability of the AE fabric system. Furthermore,
according to Table 6, P-values of fabric thickness (0.07, 0.08, 0.09, 0.04, 0.07, 0.07, and 0.06)
are higher than P-values of fabric air permeability (0.008, 0.002, 0.001, 0.009, 0.003, 0.003, and
0.002), indicating that fabric thickness is a less significant property than fabric air permeability
in providing protection against steam and hot-water exposures. These findings can be
rationalized by the observation that heat transfer is less expedient than mass transfer in steam,
hot-water splash, and hot-water immersion with compression exposures (Keiser, et al., 2010;
Keiser, et al., 2008; Keiser & Rossi, 2008). As the P-values of fabric thickness are marginally
higher than 0.05 and P-values of fabric air permeability are significantly less than 0.05, it can be
inferred that thickness has a minor/marginal impact on thermal protective performance while air
permeability has a strong impact on thermal protective performance. The association between air
permeability and second-degree burn time under steam, hot-water splash, and hot-water
immersion with compression exposures (at a temperature of 75°C and pressure of 56 kPa) are
depicted in Figures 13, 14, and 15, respectively. By reflecting on the data in Table 5, it is
expected that a similar association could be found under hot-water immersion with compression
at other temperatures (85°C and 95°C) and pressures (14 kPa and 28 kPa) as well.

57
Figure 13. Association between air permeability and second-degree burn time in steam
Figure 14. Association between air permeability and second-degree burn time in hot-water splash

58
Figure 15. Association between air permeability and second-degree burn time in hot-water
immersion with compression at a pressure of 56 kPa and temperature of 75°C
According to Figures 13, 14, and 15, fabric systems with zero air permeability (AE–
EAC) show greater second-degree burn times than the fabric systems with higher (> 0) air
permeability (A, AB, AD). An inference test confirmed that the second-degree burn time of a
fabric system with zero air permeability (an air-impermeable fabric system) is significantly
higher than the second-degree burn time of a fabric system with higher air permeability (an air-
permeable fabric system). This observation can be explained based on the Darcy’s Law, which
associates the mass (steam or water) transfer through a porous medium (fabric system) with other
parameters according to the following equation:
L
PaPbKAQ
)( ……………………………………………………………………Equation 8
where,
Q = the total discharge of steam or water per unit time (m3/s),
K = fabric permeability (m2),

59
A = cross sectional area of mass flow (m2),
Pa = pressure of the steam or hot-water jet (Pa),
Pb = pressure of the steam or hot-water jet after passing through the fabric system (Pa),
μ = viscosity (Pa.s), and
L = fabric thickness (m).
It seems that air-impermeable fabric systems (AE–EAC) do not allow the transfer of
steam or water through the fabric systems. As a result, the time requirement for second-degree
burn increases and that enhances the thermal protective performance of the air-impermeable
fabric systems. From another point of view, as the porosity and tortuosity of an air-impermeable
fabric system are very low and high, respectively, the flux or flow of steam or water through the
air-impermeable fabric system should also be negligible according to Fick’s law, shown in
Equation 9. This low flux or flow of steam or water resulted in comparatively high second-
degree burn times in the case of the air-impermeable fabric systems.
)( 12 CCDJ t
......................................................................................................Equation 9
where,
J = the flux or flow of mass through the fabric (mol/m2.s),
D = mass diffusion coefficient (m2/s),
εt = porosity of the fabric (dimensionless),
γ = constrictivity of the steam or water (dimensionless),
τ = tortuosity of the fabric (dimensionless),
C2 = concentration of the steam or water after passing through the fabric (mol/m3),
C1 = concentration of the steam or water before passing through the fabric (mol/m3), and
δ = thickness of the fabric (m) (Cussler, 2009; Kothandaraman, 2006).
60
Although the AE/EA fabric systems are air-impermeable, their second-degree burn times
are significantly lower than the second-degree burn times of the other air-impermeable fabric
systems (e.g., AEB, EAC) (Figures 13, 14, and 15). The AE/EA fabric systems are the thinnest
of all the air-impermeable fabric systems, and consist of only two layers (Table 2). The triple-
layered, thick fabric systems (e.g. AEB, EAC) provide better protection than the double-layered,
thin fabric systems (e.g., AE/EA). This is quite reasonable because both hot-water splash and
steam apply a certain amount of pressure/load, which ultimately compresses the fabric system,
reducing air volumes inside the fabric systems and lowering the thermal insulation afforded by
air. Also, fabric systems were tested in compressed condition (on a perforated hot metal surface)
in the hot-water immersion and compression exposures, which ultimately lowered the thermal
insulation of the fabric systems. In the compressed stage, a triple-layered, thick fabric system
contains more air than a double-layered, thin fabric system. As a result, the thermal protective
performance of a triple-layered, thick fabric system is better than a double-layered, thin fabric
system, especially when heat transfer occurs with steam and hot-water exposures (Ackerman, et
al., 2012; Mandal, et al., 2013a; Song, et al., 2011a). Contact with high pressurized steam, hot-
water, and/or perforated hot metal surface might cause thermo-physical properties of the fabric
system (e.g., surface tension, thermal conductivity, heat capacity) to change, allowing steam and
hot-water to enter the fabric system more easily and thus increasing the chances of scald burns
on the wearer. Triple-layered, thick fabric systems can store more hot-water than double-layered,
thin fabric systems and would be expected to generate skin burns more slowly. On entering a
fabric system, steam may condense into hot-water (Figure 16), and generate scald burns on the
wearer (Keiser, et al., 2008; Shoda, Wang, & Cheng., 1998). In a triple-layered, thick fabric

61
system, this condensation may occur far away from the skin causing less burn injury than may
occur in a double-layered, thin fabric system.
Figure 16. Proposed behavior of high pressurized steam inside a fabric system
The presence of a thermal liner also affects the second-degree burn time or thermal
protective performance of multi-layered, thick, impermeable fabric systems. For example, the
two outermost layers of the AE (double-layered) and the AEB/AEC/AED (three-layered) fabric
systems are the same: shell fabric (A) and moisture barrier (E). However, the AEB/AEC/AED
fabric systems comprise an extra layer of thermal liner (B/C/D) in their innermost part (in
contact with the wearer’s skin). Due to this added thermal liner, the thermal insulation property
of the AEB/AEC/AED fabric systems is higher than that of the AE fabric system. Consequently,
the AEB/AEC/AED fabric systems can resist heat transfer more effectively than the AE fabric
system; that is, the second-degree burn times or thermal protective performances of the
AEB/AEC/AED fabric systems are higher than the thermal protective performance of the AE
fabric system. The thickness of a thermal liner is also important to thermal protective

62
performance. For example, there is a gradual increase in the thickness of the thermal liners in
AEB, AEC, and AED fabric systems. Thus, the overall thicknesses of AEB, AEC, and AED
fabric systems also gradually increase. As expected, thermal protective performance generally
increases in the order of AEB, AEC, and AED under all types of thermal exposures. Notably, the
thermal protective performance of AEB fabric system is higher than AEC fabric system in a few
hot-water immersion and compression exposures, where the water temperature (75°C) or
compression pressure (14 kPa) are low. This may because of the structural difference between
the thermal liners B and C. The thermal liner B comprises two thin Nomex® oriented webs along
with a plain weave Nomex® fabric layer, whereas, the thermal liner C comprises one Nomex
®
needle-felted batt along with a plain weave Nomex® fabric layer (Table 1).
It has also been found that impermeable fabric systems comprising the same number of
layers (double-layered or triple-layered) and thickness show significant differences in second-
degree burn time under steam, hot-water splash, and hot-water immersion with compression
exposures (P-value < 0.05) (Figures 13, 14, and 15). Although AE and EA fabric systems have
the same number of layers and thickness, the thermal protective performance of the EA fabric
system is higher than that of the AE fabric system in these exposures (Table 5). Similar
observations can be made for AEC and EAC fabric systems where, although the fabric systems
are of same thickness, the thermal protective performance of the EAC fabric system is higher
than that of the AEC fabric system in these exposures (Table 5). These results can be rationalized
by considering the difference in position of the moisture barrier in the protective fabric systems.
To understand these results, heat and mass transfer are depicted (Figure 17) through two
differently configured impermeable fabric systems comprising the same number of layers and the
same thickness: System 1 comprises a moisture barrier in its outermost layer; System 2

63
comprises a shell fabric in its outermost layer and the moisture barrier in its innermost layer. In
Figure 17, Systems 1 and 2 shows that incoming steam or hot-water is deflected from the
moisture barrier upon contact. If the moisture barrier is in the outermost layer of the fabric
system (System 1), much of the mass hazard is deflected away long before it reaches the
wearer’s skin. If the moisture barrier is in the innermost layer of the fabric system (System 2),
the steam or hot-water is transmitted close to the wearer’s skin. Thus, a burn injury is less likely
to happen in System 1 that is analogous to fabric systems EA and EAC than in System 2 that is
analogous to fabric systems AE and AEC. Contextually, it is interesting that the effects of the
moisture barrier position in steam and hot-water exposures are opposite to the hot surface contact
exposure. This opposite behaviour is most likely due to the different thermal energy transfer
mechanisms in hot surface contact exposure versus steam and hot-water exposures.
Figure 17. Heat and mass transfer mechanisms through fabric systems in steam and hot-water
exposures
Furthermore, in the case of steam and hot-water splash exposures, the P-values of air
permeability and evaporative resistance are considerably close (Table 6). Essentially, fabric air

64
permeability and evaporative resistance have similar effects on second-degree burn time.
However, the data in Table 6 demonstrate that P-values of air permeability are much higher than
the P-values of evaporative resistance under hot-water immersion with compression exposures
(at different temperatures and pressures). This indicates that evaporative resistance is a highly
significant property affecting second-degree burn time in hot-water immersion with compression
exposures. Relationships between fabric evaporative resistance and second-degree burn time at
different temperatures and pressures are shown in Figure 18 to individually explain and compare
the exposures in detail.
Figure 18. Relationship between fabric evaporative resistance and second-degree burn time in
hot-water immersion with compression exposure of different temperatures and pressures
According to Figure 18, it is clear that R2 values between evaporative resistance and
second-degree burn times are different at different temperatures (75°C, 85°C, and 95°C) and
constant pressure (56 kPa). From Figure 18, it is also evident that R2
values are gradually
decreasing with increasing temperatures. It means that evaporative resistance has a different

65
level of impact on second-degree burn time at different temperatures and it has the maximum
impact at the lowest temperature (e.g., 75°C) in comparison to the highest temperature (e.g.,
95°C). Basically, evaporative resistance controls the amount of mass (hot-water) transfer through
a fabric system; hence, it does control the thermal protective performance (second-degree burn
time) of the fabric systems. At low temperatures, a fabric system with high evaporative
resistance may not allow significant mass transfer through the fabric system and this can increase
the second-degree burn times or enhance the thermal protective performance of the fabric
system. However, the water molecules (in the hot-water bath) spread slightly further apart from
each other and their speed elevates at high temperatures. In this situation, water molecules can
easily or forcefully penetrate through the fabric system. Eventually, evaporative resistance has
less impact on second-degree burn time or thermal protective performance of the fabric system at
high temperatures. Additionally, Figure 18 confirms that the second-degree burn times of the
fabric systems are generally lower at the high temperatures in comparison to the low
temperatures. This is because of the comparatively easy and quick penetration of water
molecules through fabric systems at the high temperatures. Interestingly, it is also evident from
Figure 18 that R2 values between evaporative resistance and second-degree burn time are similar
at different pressures (14 kPa and 28 kPa) and at constant temperature (85°C). From this, it can
be inferred that the changes of pressure do not affect the amount of water molecules penetration
through the fabric systems. As a consequence, evaporative resistance has a similar effect on
second-degree burn time at different pressures. In this context, it is notable that the second-
degree burn time at 28 kPa is slightly lower than the second-degree burn time at 14 kPa. This is
because the fabric systems get highly compressed against the perforated hot metal surface at high
pressure (28 kPa) (Figure 8). During the compression, the conductive heat transfer (q)

66
predominates through the fabric systems based on Equation 10 (Lienhard & Lienhard, 2011;
Song, 2009),
]))1/[(()/(1)/( AkV
Vk
V
VXAhAkX
q
F
A
F
AFHFHH
HF
……………Equation 10
where,
ΔHF = temperature difference between the hot surface and the fabric (K),
ΔXH = thickness of the hot surface (m),
kH = thermal conductivity of the hot surface (W/m.K),
A = contact area between the hot surface and the fabric (m2),
1/hHF = thermal contact resistance between the hot surface and the fabric depending upon their
surface roughness (m2.K/W),
ΔXF = thickness of the fabric (m),
VA = air volume of the fabric (m3),
VF = volume of the fabric (m3),
kγ = thermal conductivity of the solid fiber phase of the fabric (W/m.K), and
kα = thermal conductivity of the gaseous air phase of the fabric (W/m.K).
This conductive heat transfer may cause significant burns on wearers. At high
compression, the thickness of the fabric systems and the trapped dead air within the fabric
systems tremendously decrease, which ultimately increases the thermal conductivity of the fabric
systems. This increase in thermal conductivity causes more heat transfer through the fabric
systems and lowers their thermal protective performance. This high compression also lowers the
surface roughness of the fabric system resulting in low trapped air layers on the surface. This
situation lowers the second-degree burn time or thermal protective performance of the fabric
systems. In this context, Mandal, et al. (2015) mention that the conductive heat transfers is more
67
prominent in the hot-water immersion with compression exposure than the typical hot-water
splash exposure. They concluded that the transfer of both mass and conductive heat through
fabrics significantly lower the second-degree burn times or thermal protective performance of the
fabric systems under hot-water immersion with compression in comparison to the hot-water
splash. Contextually, it has also been observed that the differences in second-degree burn times
or thermal protective performance under hot-water splash and hot-water immersion with
compression (at different temperatures and compression pressures) are not significant for single-
layered fabric systems; however, these differences are significant for triple-layered fabric
systems. This is likely because changes in the thermo-physical properties (e.g., density, thermal
conductivity, volumetric heat capacity) of the triple-layered fabric systems under hot-water
splash and hot-water immersion with compression (at different temperatures and compression
pressures) are more significant than in the single-layered fabric systems.
4.2 Empirical analysis of thermal protective performance of fabrics
under various thermal exposures
Based on the discussion in Section 4.1, it is clear that the thermal protective performance
of fabric systems varies under different thermal exposures. This section 4.1 further identifies
different significant fabric properties that affect thermal protective performance under these
thermal exposures. Thickness and thermal resistance are the significant fabric properties that
affect thermal protective performance under flame, radiant heat, and hot surface contact
exposures. Fabric thickness, air permeability, and evaporative resistance are the significant
properties that affect thermal protective performance under steam, hot-water splash, and hot-
water immersion with compression exposures. These significant fabric properties for thermal
protective performance under these thermal exposures are summarised in Table 7.

68
Table 7. Significant fabric properties that affected thermal protective performance under various
thermal exposures
Thermal protective performance
Significant fabric properties
Thickness Air
permeability
Thermal
resistance
Evaporative
resistance
Flame
Radiant heat
Hot surface contact
Steam
Hot-water splash
Hot-water immersion with
compression
In the following sections, by employing these significant fabric properties (Table 7),
thermal protective performance of a fabric system under a specific thermal exposure is predicted
using MLR and ANN modelling techniques (sections 4.2.1 and 4.2.2). Subsequently, these MLR
and ANN models are compared to identify the best fit models for predicting thermal protective
performance (section 4.2.3). The best fit models are further used in the saliency test to identify
the relevance or relative importance of each significant property on the thermal protective
performance of a fabric system in a particular thermal exposure (section 4.2.4).
4.2.1 MLR models
The MLR models for predicting the thermal protective performance of fabric systems
under various thermal exposures [(e.g., flame, radiant heat, hot surface contact, steam, hot-water
splash, hot-water immersion with compression at different temperatures (75°C, 85°C, and 95°C)
and pressures(14 kPa and 28 kPa)] are presented in Equations 11-20. In these models, the
respective fabric properties that significantly affected the thermal protective performance of
fabric systems under a particular thermal exposure were employed in StatCrunchTM
5.0 software
according to the MLR modelling method described in section 3.3.1.
resistanceThermal61.1Thickness70.445.0ce)(Performan Flame ………...Equation 11

69
resistance Thermal53.1Thickness64.646.0 ce)(Performan heatRadiant …....Equation 12
resistance Thermal69.55Thickness61.502.1e)Performanc( surfaceHot …….Equation 13
resistance eEvaporativ75.0
typermeabiliAir 07.0Thickness13.109.5e)Performanc( Steam
………..……...Equation 14
resistance eEvaporativ59.4
typermeabiliAir 12.0Thickness57.347.25ce)(Performan splashwater Hot
………Equation 15
resistance eEvaporativ36.2
typermeabiliAir 07.0Thickness11.007.9ce)(PerformanC)(75Immersion
……..…..Equation 16
resistance eEvaporativ20.1
typermeabiliAir 07.0Thickness01.307.6ce)(PerformanC)85Immersion(
…..…..Equation 17
resistance eEvaporativ98.0
typermeabiliAir 01.0Thickness92.065.4e)Performanc(C)95Immersion(
…....…Equation 18
resistance eEvaporativ52.1
typermeabiliAir 02.0Thickness57.101.6e)Performanc( 14kPa)Immersion(
……..…Equation 19
resistance eEvaporativ45.1
typermeabiliAir 10.0Thickness75.143.5e)Performanc( 28kPa)Immersion(
………..Equation 20
4.2.2 ANN models
In order to predict the thermal protective performance by ANN models, the ANN
modelling method described in section 3.3.2 was followed. Here, the values of significant fabric
properties for thermal protective performance under a particular thermal exposure (Table 7) were
employed to code the computer programs for ANN models using MATLAB software. The
coding of these software programs for ANN models is presented in Appendices 10-19. These
coded programs were executed in the MATLAB software for predicting the thermal protective
performance under each specified thermal exposure. A generic code for ANN models that can be
used to predict thermal protective performance under various thermal exposures is presented
below:

70
load dataset.txt;
input=dataset(1:9,1:2); % input data.
target=dataset(1:9,3); % target data.
[inputn,meani,stdi,targetn,meant,stdt] = prestd(input',target');
% preprocessing or normalizing the data with mean at zero and standard deviation 1.
M=[5 1]; %Size of ith layer, for Nl layers.
net = newff(minmax(inputn),M,{'tansig','purelin'},'traingdm');
% creating the feedforward backpropagation (gradient descent with momentum) neural network.
% here newff defines feedforward network architecture.
% first argument minmax(inputn) defines range of input and initializes the network parameters.
% second argument defines the structure of the network. There is 1 hidden and 1 output layer.
% 5 is the number of the nodes in the first hidden layer.
% 1 is the number of nodes in the output layer.
% next the activation functions in the layers are defined.
% in the first hidden layer, there are 5 tansig functions.
% in the output layer, there is 1 linear function.
net.trainParam.epochs=3000; % number of epochs/iterations.
net.trainParam.lr=0.3; % learning rate.
net.trainParam.mc=0.6; % momentum.
net=train(net,inputn,targetn);
y=sim(net,inputn);
% to simulate the trained network on the original input data.
output=poststd(y',meant,stdt); % to convert output back to the original scale.
[output target] % predicted data vs actual data.
title('Comparison between actual targets and predictions')
d=[output-target].^2; % to calculate square error between actual and predicted values.
mse=mean(d) % to calculate the mean square error (mse).
rmse=sqrt(mse) % to calculate the root mean square error (rmse).
[m,b,r]=postreg(output',target') % use of regression analysis to judge the network performance.
Rsquare=r.^2 % to calculate the Coefficient of Determination (R2).
save net % to save the trained network 'net'.
load net % to load the trained network 'net'.
newinput = [3.49 0.151];
newinputn = trastd(newinput',meani,stdi);
newoutputn = sim(net,newinputn);
newoutput = poststd(newoutputn',meant,stdt)

71
4.2.3 Comparison between MLR and ANN models
In this section, the MLR and ANN models obtained (in sections 4.2.1 and 4.2.2) for
predicting the thermal protective performance under each thermal exposure are statistically
compared according to the method described in section 3.3. The predicting performance
parameters [R2, Root Mean Square Error (RMSE), P-values] of these MLR and ANN models are
presented in Table 8.
Table 8. The R2, RMSE, and P-values of the MLR and ANN models
Thermal exposure Model R2 RMSE P-value
Flame MLR 0.95 1.43
< 0.0001 ANN 0.97 0.91
Radiant heat MLR 0.98 1.16
< 0.0001 ANN 0.99 0.69
Hot surface contact MLR 0.70 2.92
0.005 ANN 0.82 2.16
Steam MLR 0.57 5.95
0.01 ANN 0.97 1.53
Hot-water splash MLR 0.71 6.10
0.002 ANN 0.98 2.41
Hot-water immersion with
compression (at 56 kPa and 75°C)
MLR 0.80 9.64 0.0002
ANN 0.98 1.19
Hot-water immersion with
compression (at 56 kPa and 85°C)
MLR 0.76 7.35 0.0006
ANN 0.97 2.01
Hot-water immersion with
compression (at 56 kPa and 95°C)
MLR 0.75 5.14 0.0006
ANN 0.98 1.43
Hot-water immersion with
compression (at 14 kPa and 85°C)
MLR 0.80 6.97 0.0002
ANN 0.98 1.87
Hot-water immersion with
compression (at 28 kPa and 85°C)
MLR 0.82 6.64 0.0001
ANN 0.99 1.22
Table 8 presents that the prediction models are valid as all of the P-values are less than
0.05. In a comparison between the MLR and ANN models under all thermal exposures [(i.e.,
flame, radiant heat, hot surface contact, steam, hot-water splash, hot-water immersion with
compression at different temperatures (75°C, 85°C, and 95°C) and pressures (14 kPa and 28
kPa)], it can be identified that the R2 values of MLR models are lower than the ANN models;

72
hence, the predictability of the ANN models works better than the MLR models. Moreover, the
prediction errors (RMSE) by the ANN models are much lower than the MLR models. In
summary, the ANN models perform better than the MLR models for thermal protective
performance prediction in terms of the precision and accuracy. Thus, it is worthwhile to use the
ANN models for predicting the thermal protective performance of the fabric systems under all
types of thermal exposures.
4.2.4 Relative importance of each significant fabric property on thermal protective
performance
Based on the previous section, it is clear that ANN models can effectively predict the
thermal protective performance of fabric systems under various thermal exposures – flame,
radiant heat, hot surface contact, steam, hot-water splash, and hot-water immersion with
compression. In this section, these ANN models are used to analyze the relative importance of
significant properties on thermal protective performance of fabric systems under all of these
thermal exposures. For this, a saliency test is conducted by eliminating only one designated
significant property from an ANN model at a time. In this test, the increase in RMSE value in the
saliency test compared to the original model is considered as the indicator of importance of the
eliminated significant property; the eliminated property that generates the highest RMSE is
inferred as the prime significant property for thermal protective performance. The results of the
saliency tests for all the ANN models are shown in Table 9.
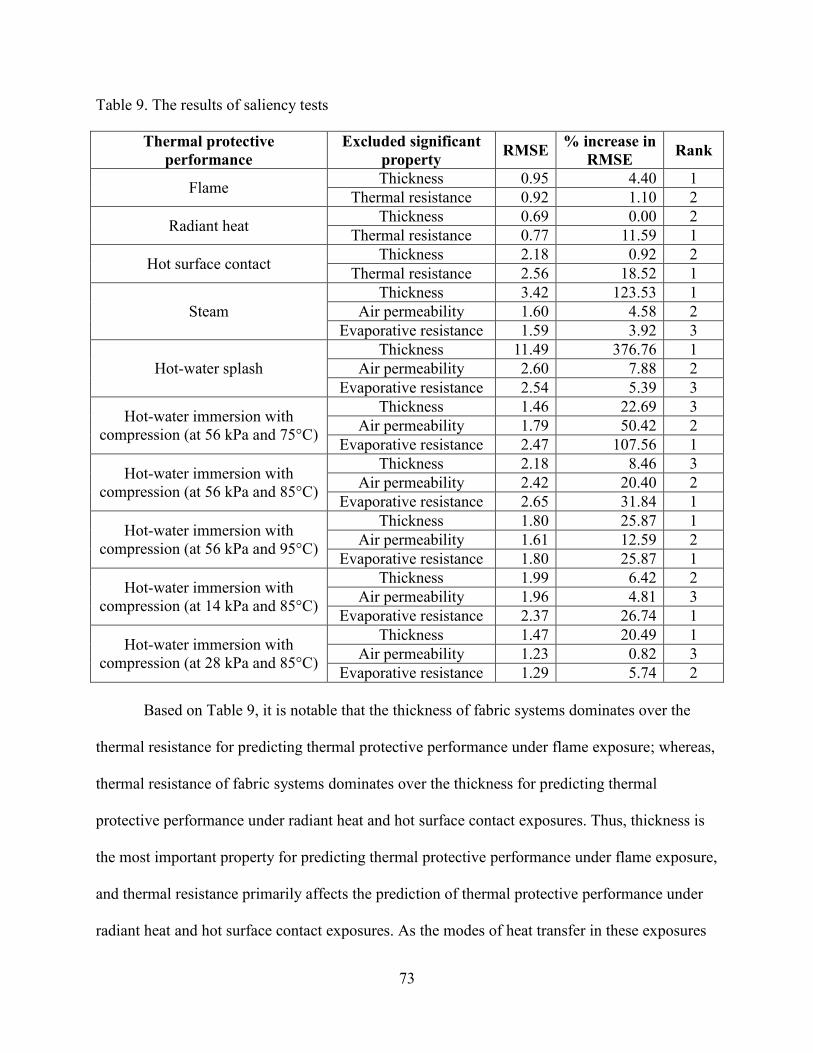
73
Table 9. The results of saliency tests
Thermal protective
performance
Excluded significant
property RMSE
% increase in
RMSE Rank
Flame Thickness 0.95 4.40 1
Thermal resistance 0.92 1.10 2
Radiant heat Thickness 0.69 0.00 2
Thermal resistance 0.77 11.59 1
Hot surface contact Thickness 2.18 0.92 2
Thermal resistance 2.56 18.52 1
Steam
Thickness 3.42 123.53 1
Air permeability 1.60 4.58 2
Evaporative resistance 1.59 3.92 3
Hot-water splash
Thickness 11.49 376.76 1
Air permeability 2.60 7.88 2
Evaporative resistance 2.54 5.39 3
Hot-water immersion with
compression (at 56 kPa and 75°C)
Thickness 1.46 22.69 3
Air permeability 1.79 50.42 2
Evaporative resistance 2.47 107.56 1
Hot-water immersion with
compression (at 56 kPa and 85°C)
Thickness 2.18 8.46 3
Air permeability 2.42 20.40 2
Evaporative resistance 2.65 31.84 1
Hot-water immersion with
compression (at 56 kPa and 95°C)
Thickness 1.80 25.87 1
Air permeability 1.61 12.59 2
Evaporative resistance 1.80 25.87 1
Hot-water immersion with
compression (at 14 kPa and 85°C)
Thickness 1.99 6.42 2
Air permeability 1.96 4.81 3
Evaporative resistance 2.37 26.74 1
Hot-water immersion with
compression (at 28 kPa and 85°C)
Thickness 1.47 20.49 1
Air permeability 1.23 0.82 3
Evaporative resistance 1.29 5.74 2
Based on Table 9, it is notable that the thickness of fabric systems dominates over the
thermal resistance for predicting thermal protective performance under flame exposure; whereas,
thermal resistance of fabric systems dominates over the thickness for predicting thermal
protective performance under radiant heat and hot surface contact exposures. Thus, thickness is
the most important property for predicting thermal protective performance under flame exposure,
and thermal resistance primarily affects the prediction of thermal protective performance under
radiant heat and hot surface contact exposures. As the modes of heat transfer in these exposures

74
are different, it is expected that different properties could predominantly contribute in predicting
thermal protective performance under these exposures. Furthermore, thickness and air
permeability of fabric systems dominates over evaporative resistance during the prediction of
thermal protective performance under steam and hot-water splash exposures. In the exposures of
hot-water immersion with compression at 75°C and 85°C, evaporative resistance and air
permeability of fabric systems predominate over thickness for predicting thermal protective
performance; however, thickness and evaporative resistance primarily affect the prediction of
thermal protective performance under the exposures of hot-water immersion with compression at
95°C, 14 kPa, and 28 kPa. Here, thickness and evaporative resistance have the same contribution
in predicting thermal protective performance at 95°C. Also, the predominance of thickness and
evaporative resistance are completely reversed in the exposures of hot-water immersion with
compression at 14 kPa and 28 kPa. It is also notable from Table 9 that the percentage (%)
increase in RMSE is generally high in the case of steam, hot-water splash, and hot-water
immersion with compression exposures in comparison to the flame, radiant heat, and hot surface
contact exposures. This difference is because mass transfer primarily occurs in the case of steam,
hot-water splash, and hot-water immersion with compression exposures; whereas, heat transfer
predominates in the case of flame, radiant heat, and hot surface contact exposures.

75
Chapter 5
Summary and Conclusion
In this PhD study, the thermal protective performance of textile fabrics used in
firefighters’ clothing was investigated under various laboratory-simulated thermal exposures –
flames, radiant heat, hot surface contact, steam, hot-water splash, and hot-water immersion with
compression. For this, the thermal protective performance of the fabrics with different physical
properties was evaluated in terms of time required to generate a second-degree burn on a
wearer’s skin. Subsequently, various fabric properties affecting the performance were
statistically identified and the reasons for the importance of these fabric properties were
explained according to theories of heat and mass transfer through fabrics. By employing the
significant fabric properties, MLR and ANN models were used to predict and explain the thermal
protective performances of the fabrics under the thermal exposures.
The findings from this study demonstrate that thermal protective performance of fabric
systems varies according to the characteristics of the fabric systems and the type of thermal
exposures. The thickness of a fabric system primarily controls its thermal protective performance
in flame and radiant heat exposures. Insulation from flame and radiant heat exposures is found to
be provided by air volumes inside the fabric system that prohibited thermal energy transfer to the
sensor (i.e., human skin). In other exposures (i.e., hot surface contact, high pressurized steam,
hot-water splash, and hot-water immersion with compression), a certain amount of pressure is
imposed on the fabric system. This pressure caused fabric compression which reduced both the
contact resistance between the fabric system and the sensor (human skin) and the air volume
insulation provided by fabric system, enhancing heat transfer toward the sensor and reducing the
protective performance of the fabric system. Thermo-physical properties (e.g., thermal

76
conductivity, heat capacity) of the fabric systems did change in various thermal exposures.
Hence, fabric systems may char or pyrolize, reducing their thermal protective performance. In
addition to the heat delivered in steam and hot-water (splash, and immersion with compression)
exposures, mass transfer through the fabric system may present another primary concern. The
study suggests that impermeable fabric systems can reduce mass transfer and enhance thermal
protective performance. Better protection is obtained by stopping or minimizing the mass
transfer at the initial contact point in steam and hot-water exposures. Otherwise, a significant
amount of condensed steam and hot-water may be stored inside the fabric system and might be
instantaneously delivered to the human skin. This delivery of condensed steam and/or hot-water
transmits the thermal energy to the human skin and that causes significant skin burns. Also,
depending upon the hot-water temperature and compression pressure, a different amount of heat
and/or mass (hot-water) might be stored inside or transmitted through the fabric system in hot-
water immersion with compression exposure; this situation may influence the thermal protective
performance of fabric systems under hot-water immersion with compression exposures. From
this study, it can be concluded that an air-impermeable fabric can be efficiently used to produce
thermal protective clothing. However, this air-impermeable clothing may cause heat stress or
discomfort for firefighters through ineffective dissipation of their sweat-vapor (Rossi, 2003;
Song, et al., 2011a). Notably, the air-impermeable moisture barrier should be vapor-permeable to
dissipate the metabolic-heat and sweat-vapor generated from firefighters’ bodies in order to
prevent heat strain (Moein & Torvi, 2011; Song, et al., 2011a). It can also be concluded that
thickness and thermal resistance are the significant fabric properties that affect thermal protective
performance of fabric systems under flame, radiant heat, and hot surface contact exposures; and
thickness, air permeability, and evaporative resistance are the significant fabric properties for

77
thermal protective performance of fabric systems under steam, hot-water splash, and hot-water
immersion with compression exposures.
By employing the above mentioned significant fabric properties in the MLR and ANN
models, thermal protective performance of fabric systems are predicted under various thermal
exposures. The results indicate that the ANN models outperformed the MLR models in
predicting thermal protective performance; here, the three-layered feed-forward back
propagation ANN models with five neurons in the hidden layer are found as the best fit models
to effectively predict thermal protective performance. By using the ANN models in saliency
testing, it can be concluded that the different fabric properties primarily affect the prediction of
thermal protective performance under various thermal exposures. In summary, thickness is the
key fabric property to predict thermal protective performance in flame exposures; thermal
resistance is the key fabric property to predict thermal protective performance in radiant heat and
hot surface contact exposures; thickness and air permeability are the key fabric properties for
predicting thermal protective performance under steam and hot-water splash exposures; air
permeability and evaporative resistance are the key in predicting thermal protective performance
under hot-water immersion with compression exposure at low temperatures (75°C and 85°C);
and thickness and evaporative resistance are the key for predicting thermal protective
performance under hot-water immersion with compression at high temperature (95°C) and
different pressures (14 kPa and 28 kPa). Here, it can be concluded that the mode of heat and/or
mass transfer is different under various thermal exposures; as a result, different key fabric
properties influence the prediction of thermal protective performance under various thermal
exposures.
Overall, this PhD study acknowledges the thermal protective performance of fabrics used

78
in the firefighters’ clothing under various thermal exposures that are faced by firefighters.
Interestingly, this study demonstrates a new finding on the thermal protective performance of
fabrics under the significant and unexplored area of thermal exposure to hot-water immersion
with compression. This study also holistically characterizes the fabric properties that affect the
thermal protective performance, and empirically analyzes the thermal protective performance
under the thermal exposures. This study further advances the field of textile/materials science
through better understanding of heat and mass transfer in fabrics. This understanding is useful to
develop an integrated knowledge on fabric properties, heat and mass transfer through fabrics
under various thermal exposures, and thermal protective performance of fabrics. Eventually, this
PhD study would help to build an improved understanding of the materials used in the
firefighters’ clothing. Based on this PhD research findings, a number of peer-reviewed papers are
published and presented in the international journals and conferences (Mandal, et al., 2013a;
Mandal, et al., 2014; Mandal, et al., 2015; Mandal & Song, 2011; Mandal, Lu, & Song, 2013b;
Mandal & Song, 2012a; Mandal & Song, 2012b; Mandal & Song, 2014a; Mandal & Song,
2014b; Mandal & Song, 2014c; Mandal & Song, 2014d; Mandal & Song, 2015; Mandal & Song,
2016). Notably, the performance prediction accuracy of the MLR models of this study may be
affected by the input variables of some mutually dependent significant fabric properties (e.g.,
thickness and thermal resistance). In future, these MLR models can be further improved by
considering only the mutually independent variables. Also, this research is limited to the
characterization and prediction of thermal protective performance of fabrics for firefighters’
clothing. In future, this study could be extended to the development or engineering of new fabric
testing standards and materials for thermal protective clothing. Such clothing will provide
optimal occupational safety and health for on-duty firefighters in Canada and worldwide.

79
References
Abbott, N. J., & Schulman, S. (1976). Protection from fire: nonflammable fabrics and coatings.
Journal of Coated Fabrics, 6(1), 48-64.
Abdel-Rehim, Z. S., Saad, M. M., Ei-Shakankery. M., & Hanafy, I. (2006). Textile fabrics as
thermal insulator, Autex Research Journal, 6(3), 148-161.
Ackerman, M. Y., Crown, E. M., Dale, J. D., Murtaza, G., Batcheller, J., & Gonzalez, J. A.
(2012). Development of a test apparatus/method and material specifications for protection
from steam under pressure. Performance of Protective Clothing and Equipment: Emerging
Issues and Technologies, 9th Vol., STP1544, 308-328.
Agresti, A., & Franklin, C. (2009). Statistics- the art and science of learning from data. USA:
Prentice Hall.
Andersson, C. J. (1999). Relationship between physical textile properties and human comfort
during wear trials of chemical biological protective garment systems. MSc Thesis, University
of Alberta, Edmonton, Canada.
Arpaci, V. S. (1966). Conduction Heat Transfer. USA: Addison-Wesley Publication Company.
Arpaci, V. S. & Larsen, P. S. (1984). Convection Heat Transfer. USA: Prentice Hall.
Arupjoyti, S., & Iragavarapu, S. (1998). New electrotopological descriptor for prediction of
boiling points of alkanes and aliphatic alcohols through artificial neural network and multiple
linear regression analysis. Computers and Chemistry, 22(6), 512-522.
ASTM International. (1987). ASTM D 4108: Standard test method for thermal protective
performance of materials for clothing by open-flame method. Annual Book of ASTM
Standards (Vol. 7.01, 9 pp.). West Conshohocken, PA, USA.

80
ASTM International. (1996). ASTM D 1777: Standard test method for thickness of textile
material. Annual Book of ASTM Standards (Vol. 7.01, 5 pp.). West Conshohocken, PA,
USA.
ASTM International. (2004). ASTM D 737: Standard test method for air permeability of textile
fabrics. Annual Book of ASTM Standards (Vol. 7.01, 5 pp.). West Conshohocken, PA, USA.
ASTM International. (2008a). ASTM F 1939: Standard test method for radiant heat resistance of
flame resistant clothing materials with continuous heating. Annual Book of ASTM Standards
(Vol. 11.03, 12 pp.). West Conshohocken, PA, USA.
ASTM International. (2008b). ASTM F 2702: Standard test method for radiant heat performance
of flame resistant clothing materials with burn injury prediction. Annual Book of ASTM
Standards (Vol. 11.03, 17 pp.). West Conshohocken, PA, USA.
ASTM International. (2008c). ASTM F 2701: Standard test method for evaluating heat transfer
through materials for protective clothing upon contact with a hot liquid splash. Annual Book
of ASTM Standards (Vol. 11.03, 8 pp.). West Conshohocken, PA, USA.
ASTM International. (2008d). ASTM F 1060: Standard test method for thermal protective
performance of materials for protective clothing for hot surface contact. Annual Book of
ASTM Standards (Vol. 11.03, 7 pp.). West Conshohocken, PA, USA.
ASTM International. (2009). ASTM D 3776: Standard test method for mass per unit area
(weight) of fabric. Annual Book of ASTM Standards (Vol. 7.01, 5 pp.). West Conshohocken,
PA, USA.
ASTM International. (2013a). ASTM D 4850: Standard terminology relating to fabrics and
fabric test methods. Annual Book of ASTM Standards (Vol. 7.02, 11 pp.). West
Conshohocken, PA, USA.

81
ASTM International. (2013b). ASTM F 2703: Standard test method for unsteady-state heat
transfer evaluation of flame resistant materials for clothing with burn injury prediction.
Annual Book of ASTM Standards (Vol. 11.03, 12 pp.). West Conshohocken, PA, USA.
ASTM International. (2013c). ASTM F 1930: standard test method for evaluation of flame
resistant clothing for protection against flash fire simulations using an instrumented manikin.
Annual Book of ASTM Standards (Vol. 11.03, 12 pp.). West Conshohocken, PA, USA.
ASTM International. (2014a). ASTM D 1518: Standard test method for thermal resistance of
batting systems using a hot plate. Annual Book of ASTM Standards (Vol. 7.01, 6 pp.). West
Conshohocken, PA, USA.
ASTM International. (2014b). ASTM E 1354: Standard test method for heat and visible smoke
release rates for materials and products using an oxygen consumption calorimeter. Annual
Book of ASTM Standards (Vol. 4.07, 20 pp.). West Conshohocken, PA, USA.
ASTM International. (2015). ASTM D 1776: Standard practice for conditioning and testing
textiles. Annual Book of ASTM Standards (Vol. 7.01, 4 pp.). West Conshohocken, PA, USA.
Barker, R. L. (2005, January). A review of gaps and limitations in test methods for first
responder protective clothing and equipment. USA: National Personal Protection Technology
Laboratory, 1-98.
Barker, R. L., Guerth-Schacher, C., Grimes, R. V., & Hamouda, H. (2006). Effects of moisture
on the thermal protective performance of firefighter protective clothing in low-level radiant
heat exposures. Textile Research Journal, 76(1), 27-31.
Barker, R. L., Hamouda, H., Shalev, I., & Johnson, J. (1999). Review and evaluation of thermal
sensors for use in testing firefighters protective clothing. USA: National Institute of
Standards and Technology, 1-49.

82
Barker, R. L., & Lee, Y. M. (1987). Analyzing the transient thermophysical properties of heat-
resistant fabrics in TPP exposures. Textile Research Journal, 57(6), 331-338.
Batra, S. K., & Pourdeyhimi, B. (2012). Introduction to Nonwoven Technology, USA: DEStech
Publications.
Bear, J. (1972). Dynamics of Fluids in Porous Media, USA: Dover Publications.
Benisek, L., & Phillips, W. A. (1979). Evaluation of flame retardant clothing assemblies for
protection against convective heat flames. Clothing and Textile Research Journal, 7(9), 2-20.
Benisek, L., & Phillips, W. A. (1981). Protective clothing fabrics: part II. against convective heat
(open-flame) hazards . Textile Research Journal, 51(3), 191-196.
Bergman, T. L., Lavine, A. S., Incropera, F. P., & Dewitt, D. P. (2011). Fundamentals of Heat
and Mass Transfer. USA: John Wiley & Sons Incorporation.
Bryner, N., Madrzykowski, D., & Grosshandler, W. (n.d.). Reconstructing the station nightclub
fire- materials testing and small scale experiments. Retrieved from
http://fire.nist.gov/bfrlpubs/fire07/PDF/f07062.pdf
Burnmeister, L. C. (1993). Convective Heat Transfer, USA: Wiley Publications.
CGSB (2001). CGSB 78.1: Thermal protective performance of materials for clothing. CGSB (11
pp.), Ottawa, Canada.
Chitrphiromsri, P., & Kuznetsov, A. V. (2005). Modeling heat and moisture transport in
firefighter protective clothing during flash fire exposure. Heat and Mass Transfer, 41(3),
206-215.
Cussler, E. L. (2009). Diffusion Mass Transfer in Fluid Systems. UK: Cambridge University
Press.

83
Dale, J. D., Crown, E. M., Ackerman, M. Y., Leung, E., & Rigakis, K. B. (1992). Instrumented
manikin evaluation of thermal protective clothing. In J. P. McBriarty & N. W. Henry (Eds.),
Performance of Protective Clothing, ASTM STP 1133 (pp. 717-733). USA: American Society
for Testing and Materials.
Eni, E. U. (2005). Developing test procedures for measuring stored thermal energy in firefighter
protective clothing. MSc Thesis. North Carolina State University, Raleigh, USA.
Fahy, R. F., LeBlanc, P. R., & Molis, J. L. (2014, June). Firefighter fatalities in the United
States- 2012. USA: National Fire Protection Association, 1-30.
Foster, J. A., & Roberts, G. V. (1995). Measurements of the firefighters environments- summary
report. Fire Engineers Journal, 55(178), 30-34.
Gholamreza F., & Song, G. (2013). Laboratory evaluation of thermal protective clothing
performance upon hot liquid splash. The Annals of Occupational Hygiene, 57(6), 805-822.
Haghi, A. K. (2011). Heat & Mass Transfer in Textiles. Canada: World Scientific and
Engineering Academy and Society.
Hassoun, M. H. (1995). Fundamentals of Artificial Neural Networks. USA: The MIT Press.
Heath, D. W. (2000). A liquid cooled heat flux transducer for use in evaluating the thermal
protective performance of firefighters’ clothing. MSc Thesis. North Carolina State
University, Raleigh, USA.
Henriques, F. C. (1947). Studies of thermal injury; the predictability and the significance of
thermally induced rate processes leading to irreversible epidermal injury. Archives of
Pathology, 43(5) 489-502.
84
Henriques, F. C., & Moritz, A. R. (1947). Studies of thermal injury I. The conduction of heat to
and through skin and the temperatures attained therein: a theoretical and an experimental
investigation. The American Journal of Pathology, 23(4), 530-549.
Hsu, S. T. (1963). Engineering Heat Transfer. USA: Van Nostrand Company.
Hui, C. L., & Ng, S. F. (2009). Predicting seam performance of commercial woven fabrics using
multiple logarithm regression and artificial neural networks. Textile Research Journal,
79(18), 1649-1657.
ISO. (1995). ISO 9151: Protective clothing against heat and flame – determination of heat
transmission on exposure to flame. ISO (14 pp.). Geneva, Switzerland.
ISO. (2014). ISO 11092: Textiles – physiological effects – measurement of thermal and water-
vapor resistance under steady-state conditions (sweating guarded-hotplate test). ISO (15pp.).
Geneva, Switzerland.
Jalbani, S. H., Ackerman, M. Y., Crown, E. M., Keulen, M., & Song, G. (2012). Apparatus for
use in evaluating protection from low pressure hot water jets. Performance of Protective
Clothing and Equipment: Emerging Issues and Technologies, 9th
Vol., STP1544, 329-339.
Kahn, S. A., Patel, J. H., Lentz, C. W., & Bell, D. E. (2012). Firefighter burn injuries: predictable
patterns influenced by turnout gear. Journal of Burn Care & Research, 33(1), 152-156.
Karter, M. J. (2013a, September). Fire loss in the United States during 2012. USA: National Fire
Protection Association, 1-42.
Karter, M. J. (2013b, December). Patterns of firefighter fireground injuries. USA: National Fire
Protection Association, 1-27.
Karter, M. J., & Molis, J. L. (2013, October). U.S. firefighter injuries- 2012. USA: National Fire
Protection Association, 1-28.
85
Keiser, C., Becker, C., & Rossi, R. M. (2008). Moisture transport and absorption in multilayer
protective clothing fabrics. Textile Research Journal, 78(7), 604-613.
Keiser, C., & Rossi, R. M. (2008). Temperature analysis for the prediction of steam formation
and transfer in multilayer thermal protective clothing at low level thermal radiation. Textile
Research Journal, 78(11), 1025-1035.
Keiser, C., Wyss, P., & Rossi, R. M. (2010). Analysis of steam formation and migration in
firefighters’ protective clothing using X-ray radiography. International Journal of
Occupational Safety and Ergonomics, 16(2), 217-229.
Klyosov, A. A. (2007). Wood-Plastic Composites. New Jersey: John Wiley & Sons Inc.
Kothandaraman, C. P. (2006). Fundamentals of Heat and Mass Transfer. New Delhi: New Age
International Publishers.
Lawson, J. R. (1996, August). Fire fighter’s protective clothing and thermal environments of
structural fire fighting. USA: National Institute of Standards and Technology, 1-22.
Lawson, J. R. (1997, August). Thermal environments of structural firefighting and thermal tests
for firefighters’ protective clothing. Second International Conference on Fire Research and
Engineering, Maryland, USA.
Lawson, J. R., Twilley, W. H., & Malley, K. S. (2000, April). Development of a dynamic
compression test apparatus for measuring thermal performance of fire fighters’ protective
clothing. USA: National Institute of Standards and Technology, 1-24.
Lee, Y. M., & Barker, R. L. (1986). Effect of moisture on the thermal protective performance of
heat-resistant fabrics. Journal of Fire Sciences, 4(5), 315-330.
Lienhard, J. H., & Lienhard, J. H. (2011). A Heat Transfer Textbook. USA: Phlogiston Press.
86
Lu, Y., Li, J., Li, X., & Song, G. (2013a). The effect of air gaps in moist protective clothing on
protection from heat and flame, Journal of Fire Sciences, 31(2), 99-111.
Lu, Y., Song, G., Ackerman, M. Y., Paskaluk, S. A., & Li, J. (2013b). A new protocol to
characterize thermal protective performance of fabrics against hot liquid splash.
Experimental Thermal and Fluid Science, 46, 37-45.
Lu, Y., Song, G., Li, J., & Paskaluk, S. (2013c). Effect of an air gap on the heat transfer of
protective materials upon hot liquid splashes. Textile Research Journal, 83(11), 1156-1169.
Lu, Y., Song, G., Zeng, H., Zhang, L., & Li, J. (2014). Characterizing factors affecting the hot
liquid penetration performance of fabrics for protective clothing. Textile Research Journal,
84(2), 174-186.
Majumdar, P. K., & Majumdar, A. (2004). Predicting the breaking elongation of ring spun cotton
yarns using mathematical, statistical and artificial neural networks models. Textile Research
Journal, 74(7), 652-655.
Makinen, H. (2008). Firefighters protective clothing. In R. A. Scott (Ed.), Textiles for Protection
(pp. 622-647). England: Woodhead Publishing.
Mandal, S., Lu, Y., & Song, G. (2013b, April). Characterization of thermal protective clothing
under hot-water and pressurized steam exposure. The 2013 Herman and Myrtle Goldstein
Student Paper Competition organized by AATCC, South Carolina, USA.
Mandal, S., Lu, Y., Wang, F., & Song, G. (2014). Characterization of thermal protective
clothing under hot water and pressurized steam exposure. AATCC Journal of Research, 1(5),
7-16.
Mandal, S., & Song, G. (2011, May). Characterization of protective textile materials for various
thermal hazards. Fiber Society Spring Conference, Kowloon, Hong Kong.

87
Mandal, S., & Song, G. (2012a, August). Modeling of thermal protective performance of
commercial woven fabric using artificial neural network. 9th
International Meeting for
Manikins and Modeling, Tokyo, Japan.
Mandal, S., & Song, G. (2012b, May) Modeling for predicting the performances of thermal
protective clothing. 5th
European Conference on Protective Clothing and NOKOBETEF 10,
Valencia, Spain.
Mandal, S., & Song, G. (2014a). An empirical analysis of thermal protective performance of
fabrics used in protective clothing. The Annals of Occupational Hygiene, 58(8), 1065-1077.
Mandal, S., & Song, G. (2014b). Characterizing fabric materials of firefighters’ protective
clothing in hot-water immersion and compression. Proceedings of 2014 AATCC
International Conference. p. 77-86. Asheville, North Carolina: AATCC.
Mandal, S., & Song, G. (2014c, April). Characterizing fabric materials of firefighters’ protective
clothing in hot-water immersion and compression. The 2014 Herman and Myrtle Goldstein
Student Paper Competition organized by AATCC, North Carolina, USA.
Mandal, S., & Song, G. (2014d, May). Analyzing the parameters of thermal protective fabrics
under hot-water immersion and compression. Fiber Society Spring Conference, Liberec,
Czech Republic. (Poster)
Mandal, S., & Song, G. (2015). Thermal sensors for performance evaluation of protective
clothing against heat and fire: a review. Textile Research Journal, 85(1), 101-112.
Mandal, S., & Song, G. (2016). Characterizing fabrics in firefighters’ protective clothing: hot-
water immersion and compression. AATCC Journal of Research, 3(2), 8-15.

88
Mandal, S., Song, G., & Gholamreza, F. (2015). A novel protocol to characterize the thermal
protective performance of fabrics in hot-water exposures. Journal of Industrial Textiles. doi
10.1177/1528083715580522
Mandal, S., Song, G., Ackerman, M., Paskaluk, S., & Gholamreza, F. (2013a). Characterization
of textile fabrics under various thermal exposures. Textile Research Journal, 83(10), 1005-
1019.
Massenaux, G. (2003). Introduction to nonwovens. In W. Albrecht, H. Fuchs, & W. Kittelmann
(Eds.), Nonwoven Fabrics: Raw Materials, Manufacture, Applications, Characteristics,
Testing Processes. Germany: Wiley-VCH.
MATLAB. (n.d.). Retrieved from http://www.mathworks.com/products/matlab/
Moein, R., & Torvi, D. A. (2011). Assessment of factors affecting the continuing performance
of firefighters protective clothing. Fire Technology, 47, 565-599.
Morris, G. J. (1953). Thermal properties of textile materials. Journal of the Textile Institute
Transactions, 44(10), T449-T476.
Murrells, C. M., Tao, X. M., Xu, B. G., & Cheng, K. P. S. (2009). An artificial neural network
model for the prediction of spirality of fully relaxed single jersey fabrics. Textile Research
Journal, 79(3), 227-234.
Murtaza, G. (2012). Development of fabrics for steam and hot water protection. MSc Thesis.
University of Alberta, Edmonton, Canada
NFPA. (2013). NFPA 1971: Standard on protective ensembles for structural fire fighting and
proximity fire fighting. 2013 NFPA 1971 Handbook (145 pp.). Quincy, MA, USA.
Orme, J. G., & Orme, T. C. (2009). Multiple Regression with Discrete Dependent Variables.
United Kingdom: Oxford University Press.
89
Perkins, R. M. (1979). Insulative values of single-layer fabrics for thermal protective clothing.
Textile Research Journal, 49(4), 202-205.
Pynckels, F., Kiekens, P., Sette, S., Van-Langenhove, L., & Impe, K. (1995). Use of neural nets
for determining the spinnability of fibres. Journal of Textile Institute, 86(3), 425-437.
Rossi, R. (2003). Firefighting and its influence on the body. Ergonomics, 46(10), 1017-1033.
Rossi, R., Indelicato, E., & Bolli, W. (2004). Hot steam transfer through heat protective clothing
layers. International Journal of Occupational Safety and Ergonomics, 10(3), 239-245.
Rossi, R., & Zimmerli, T. (1994, January). Influence of humidity on the radiant, convective and
contact heat transmission through protective clothing materials. Fifth International
Symposium on Performance of Protective Clothing: Improvement through Innovation, San
Francisco, USA.
Sati, R., Crown, E., Ackerman, M., Gonzalez, J., & Dale, J. D. (2008). Protection from steam at
high pressure: development of a test device and protocol. International Journal of
Occupational Safety and Ergonomics, 14(1), 29-41.
Shalev, I., & Barker, R. L. (1983). Analysis of heat transfer characteristics of fabrics in an open
flame exposure. Textile Research Journal, 53(8), 475-482.
Shalev, I., & Barker, R. L. (1984). Protective fabrics: a comparison of laboratory methods for
evaluating thermal protective performance in convective/radiant exposures. Textile Research
Journal, 54(10), 648-654.
Shoda, A., Wang, C. Y., & Cheng, P. (1998). Simulation of constant pressure steam injection in
a porous medium. International Communication on Heat Mass Transfer, 25(6), 753 – 762.
Siegel, R., & Howell, J. (2002). Thermal Radiation Heat Transfer. London: Taylor & Francis.

90
Song G. (2004). Modeling thermal protection outfit for fire exposures. PhD Thesis. North
Carolina State University, Raleigh, USA.
Song, G. (2009). Thermal insulation properties of textiles and clothing. In J. T. Williams (Ed.),
Textiles for Cold Weather Apparel (pp. 19-32). England: Woodhead Publishing.
Song, G., Cao, W., & Gholamreza, F. (2011b). Analyzing thermal stored energy and effect on
protective performance. Textile Research Journal, 81(11), 120-135.
Song, G., Chitrphiromsri, P., & Ding, D. (2008). Numerical simulations of heat and moisture
transport in thermal protective clothing under flash fire conditions. International Journal of
Occupational Safety and Ergonomics, 14(1), 89-106.
Song, G., Paskaluk, S., Sati, R., Crown, E. M., Dale, J. D., & Ackerman, M. (2011a). Thermal
protective performance of protective clothing used for low radiant heat protection. Textile
Research Journal, 81(3), 311-323.
StatCrunch. (n.d.). Retrieved from http://www.statcrunch.com/learn-about/what-is.html
Stull, J. O. (1997). Comparison of conductive heat resistance and radiant heat resistance with
thermal protective performance of fire fighter protective clothing. In O. S. Jeffrey & D. S.
Arthur (Eds.), Performance of Protective Clothing, ASTM STP 1273 (pp. 248-269). USA:
American Society for Testing and Materials.
Sun, G., Yoo, H. S., Zhang, X. S., & Pan, N. (2000). Radiant protective and transport properties
of fabrics used by wildland firefighters. Textile Research Journal, 70(7), 567-573.
The Fallen. (n.d.). Retrieved from http://www.cfff.ca/EN/fallen.html
Torvi, D. A. (1997). Heat transfer in thin fibrous materials under high heat flux conditions. PhD
Thesis. University of Alberta, Edmonton, Canada.

91
Torvi, D. A., & Dale, J. D. (1998). Effect of variation in thermal properties on the performance
of flame resistant fabrics for flash fires. Textile Research Journal, 68(11), 787-796.
Torvi, D. A., & Dale, J. D. (1999). Heat transfer in thin fibrous materials under high heat flux.
Fire Technology, 35(3), 210-231.
Torvi, D. A., Dale, J. D., & Faulkner, B. (1999). Influence of air gaps on bench-top test results of
flame resistant fabrics. Journal of Fire Protection Engineering, 10(1), 1-12.
Torvi, D. A., & Threlfall, T. G. (2006). Heat transfer model of flame resistant fabrics during
cooling after exposure to fire. Fire Technology, 42(1), 27- 48.
Wen, S. (2014). Physiological strain and physical burden in chemical protective coveralls. PhD
Thesis, University of Alberta, Edmonton, Canada.
Yan, X., & Su, X. G. (2009). Linear Regression Analysis – Theory and Computing. Singapore:
World Scientific.
Yegnanarayana, B. (2006). Artificial Neural Networks. New Delhi: Prentice-Hall of India Private
Limited.
Zaefizadeh, M., Khayatnezhad, M., & Gholamin, R. (2011). Comparison of multiple linear
regression (MLR) and artificial neural networks (ANN) in predicting the yield using its
components in hulless barley. Journal of Agricultural and Environmental Science, 10(1), 60-
64.
Zhu, F., Zhang, W., & Chen, M. (2007). Investigation of material combinations for fire-fighter's
protective clothing on radiant protective and heat-moisture transfer performance. Fibres
and Textiles in Eastern Europe, 15(1), 72-75.

92
Appendices
Appendix 1. Mass and thickness of fabrics used in this work
Fabric
types Specimens
Total weight
(g/196.35cm2)
Massa
(g/m2)
Thicknessb (mm)
Air permeabilityc
(cm3/cm
2/s)
ISd M
e CV% IS M CV%
A
1
4.87 248
0.69
0.69 2.45
15.75
15.71 2.40
2 0.69 15.67
3 0.71 16.10
4 0.69 15.93
5 0.66 16.25
6 0.71 15.63
7 0.69 16.06
8 0.69 15.35
9 0.66 15.15
10 0.69 15.25
B
1
4.10 209
1.63
1.63 1.40
43.74
43.19 2.50
2 1.60 43.52
3 1.60 44.27
4 1.63 43.33
5 1.63 43.52
6 1.68 42.95
7 1.63 44.64
8 1.65 42.76
9 1.63 42.39
10 1.63 40.79
C
1
5.68 289
2.17
2.13 2.48
41.81
40.62 2.31
2 2.15 41.61
3 2.11 41.20
4 2.01 40.59
5 2.16 38.83
6 2.06 39.56
7 2.15 40.39
8 2.17 40.18
9 2.14 41.40
10 2.15 40.59
D
1
6.89 351
3.18
3.18 2.29
38.15
38.43 2.50
2 3.34 39.01
3 3.15 37.95
4 3.12 36.83
5 3.18 38.96
6 3.05 37.95
7 3.20 37.28
8 3.18 39.98

93
9 3.18 39.17
10 3.20 39.00
E
1
4.15 211
0.87
0.85 2.28
0.00
0
NA
2 0.85 0.00
3 0.89 0.00
4 0.84 0.00
5 0.82 0.00
6 0.84 0.00
7 0.86 0.00
8 0.84 0.00
9 0.86 0.00
10 0.86 0.00 a
Measured according to ASTM D 3776 (ASTM International, 2009).
bMeasured according to ASTM D 1777 under 1kPa pressure (ASTM
International, 1996).
cMeasured according to ASTM D 737 under air pressure differential 125Pa
(ASTM International, 2004).
dIS = Individual Specimens;
eM = Mean

94
Appendix 2. Thickness and air permeability of fabrics systems
Fabric
systems Specimens
Thicknessa (mm) Air permeability
b (cm
3/cm
2/s)
Individual
specimen Mean CV%
Individual
specimen Mean CV%
A
1 0.69
0.69 2.45
15.75
15.71 2.40
2 0.69 15.67
3 0.71 16.10
4 0.69 15.93
5 0.66 16.25
6 0.71 15.63
7 0.69 16.06
8 0.69 15.35
9 0.66 15.15
10 0.69 15.25
AB
1 2.11
2.18 2.26
13.01
13.59 2.48
2 2.11 13.82
3 2.21 13.55
4 2.18 13.47
5 2.16 13.36
6 2.18 13.81
7 2.18 13.13
8 2.26 13.81
9 2.24 13.97
10 2.21 13.92
AD
1 3.59
3.53 2.09
13.22
13.30 2.21
2 3.53 13.19
3 3.58 13.24
4 3.53 12.77
5 3.57 13.47
6 3.66 13.70
7 3.41 13.81
8 3.53 13.20
9 3.43 13.19
10 3.51 13.22
AE
1 1.42
1.42 0.60
0.00
0
NA
2 1.42 0.00
3 1.42 0.00
4 1.42 0.00
5 1.40 0.00
6 1.40 0.00
7 1.42 0.00
8 1.42 0.00
9 1.42 0.00
10 1.42 0.00

95
EA
1 1.42
1.42 0.96
0.00
0
NA
2 1.42 0.00
3 1.43 0.00
4 1.42 0.00
5 1.39 0.00
6 1.39 0.00
7 1.42 0.00
8 1.42 0.00
9 1.42 0.00
10 1.42 0.00
AEB
1 2.82
2.88 2.25
0.00
0
NA
2 2.87 0.00
3 2.95 0.00
4 2.90 0.00
5 2.92 0.00
6 2.95 0.00
7 2.90 0.00
8 2.92 0.00
9 2.79 0.00
10 2.77 0.00
AEC
1 3.61
3.49 2.48
0.00
0
NA
2 3.35 0.00
3 3.51 0.00
4 3.53 0.00
5 3.35 0.00
6 3.43 0.00
7 3.53 0.00
8 3.53 0.00
9 3.56 0.00
10 3.51 0.00
AED
1 4.29
4.23 2.04
0.00
0
NA
2 4.31 0.00
3 4.24 0.00
4 4.29 0.00
5 4.01 0.00
6 4.27 0.00
7 4.19 0.00
8 4.22 0.00
9 4.24 0.00
10 4.27 0.00
EAC
1 3.61
3.49
2.50
0.00
0
NA
2 3.35 0.00
3 3.51 0.00
4 3.53 0.00
5 3.35 0.00

96
6 3.42 0.00
7 3.53 0.00
8 3.53 0.00
9 3.56 0.00
10 3.48 0.00 a
Measured according to ASTM D 1777 under 1kPa pressure (ASTM
International, 1996).
bMeasured according to ASTM D 737 under air pressure differential 125Pa
(ASTM International, 2004).

97
Appendix 3. Thermal and evaporative resistances of fabrics systems
Fabric
systems Specimens
Thermal resistancea (K·m
2/W) Evaporative resistance
b ( m
2·Pa/W)
Individual
specimen Mean CV%
Individual
specimen Mean CV%
A
1 0.0732
0.073 1.28
4.3
4.40 2.27 2 0.073 4.5
3 0.0715 4.4
AB
1 0.119
0.117 1.30
10.0
9.87 1.17 2 0.117 9.8
3 0.116 9.8
AD
1 0.168
0.169 1.36
12.8
12.70 0.79 2 0.168 12.7
3 0.172 12.6
AE
1 0.094
0.095 1.22
20.6
20.70 0.84 2 0.094 20.6
3 0.096 20.9
EA
1 0.094
0.095 1.05
21.1
21.17 0.27 2 0.095 21.2
3 0.096 21.2
AEB
1 0.128
0.129 1.18
26.0
25.90 0.39 2 0.131 25.9
3 0.129 25.8
AEC
1 0.149
0.151 1.15
24.9
25.40 1.97 2 0.152 25.9
3 0.152 25.4
AED
1 0.181
0.184 1.44
27.4
28.03 2.15 2 0.186 28.6
3 0.185 28.1
EAC
1 0.150
0.151 1.38
25.4
25.37 0.60 2 0.153 25.5
3 0.149 25.2 aMeasured according to ASTM D 1518 (ASTM International, 2014a).
bMeasured according to ISO 11092 (ISO, 2014).

98
Appendix 4. Thermal protective performance of fabric systems under flame exposure
Fabric Systems Specimens
Thermal Protective Performancea
(Second-degree Burn Time in Seconds)
Values Mean CV (%)
A
1 2.68
2.75 2.22 2 2.80
3 2.76
AB
1 12.86
12.81 1.76 2 13.00
3 12.56
AD
1 16.27
16.59 1.68 2 16.70
3 16.79
AE
1 9.40
9.58 2.41 2 9.50
3 9.84
EA
1 5.86
5.72 2.21 2 5.62
3 5.67
AEB
1 12.01
11.79 2.22 2 11.86
3 11.50
AEC
1 15.91
15.74 2.48 2 16.01
3 15.29
AED
1 20.93
20.84 1.07 2 21.01
3 20.59
EAC
1 15.80
15.47 2.47 2 15.05
3 15.55 a
Measured according to modified ISO 9151 (ISO, 1995).

99
Appendix 5. Thermal protective performance of fabric systems under radiant heat exposure
Fabric Systems Specimens
Thermal Protective Performancea
(Second-degree Burn Time in Seconds)
Values Mean CV (%)
A
1 4.65
4.64 2.39 2 4.74
3 4.52
AB
1 11.58
11.90 2.50 2 11.94
3 12.17
AD
1 23.63
24.18 2.20 2 24.69
3 24.22
AE
1 9.48
9.22 2.49 2 9.06
3 9.11
EA
1 7.99
7.91 2.02 2 7.73
3 8.02
AEB
1 17.30
17.60 2.29 2 17.45
3 18.06
AEC
1 22.69
23.19 1.87 2 23.39
3 23.48
AED
1 27.16
27.93 2.43 2 28.17
3 28.45
EAC
1 21.09
20.59 2.11 2 20.29
3 20.40 a
Measured according to modified ASTM E 1354 (ASTM International, 2014b).

100
Appendix 6: Thermal protective performance of fabric systems under hot surface contact
exposure
Fabric Systems Specimens
Thermal Protective Performancea
(Second-degree Burn Time in Seconds)
Values Mean CV (%)
A
1 1.48
1.51 2.02 2 1.54
3 1.52
AB
1 4.83
4.77 2.43 2 4.85
3 4.64
AD
1 6.71
6.87 2.48 2 7.05
3 6.86
AE
1 5.20
5.16 1.14 2 5.18
3 5.09
EA
1 3.45
3.54 2.43 2 3.62
3 3.56
AEB
1 9.47
9.45 2.29 2 9.65
3 9.22
AEC
1 16.42
16.27 2.12 2 15.88
3 16.52
AED
1 17.46
17.30 2.36 2 17.61
3 16.84
EAC
1 7.19
7.22 2.38 2 7.06
3 7.40 a
Measured according to modified ASTM F 1060 (ASTM International, 2008d).
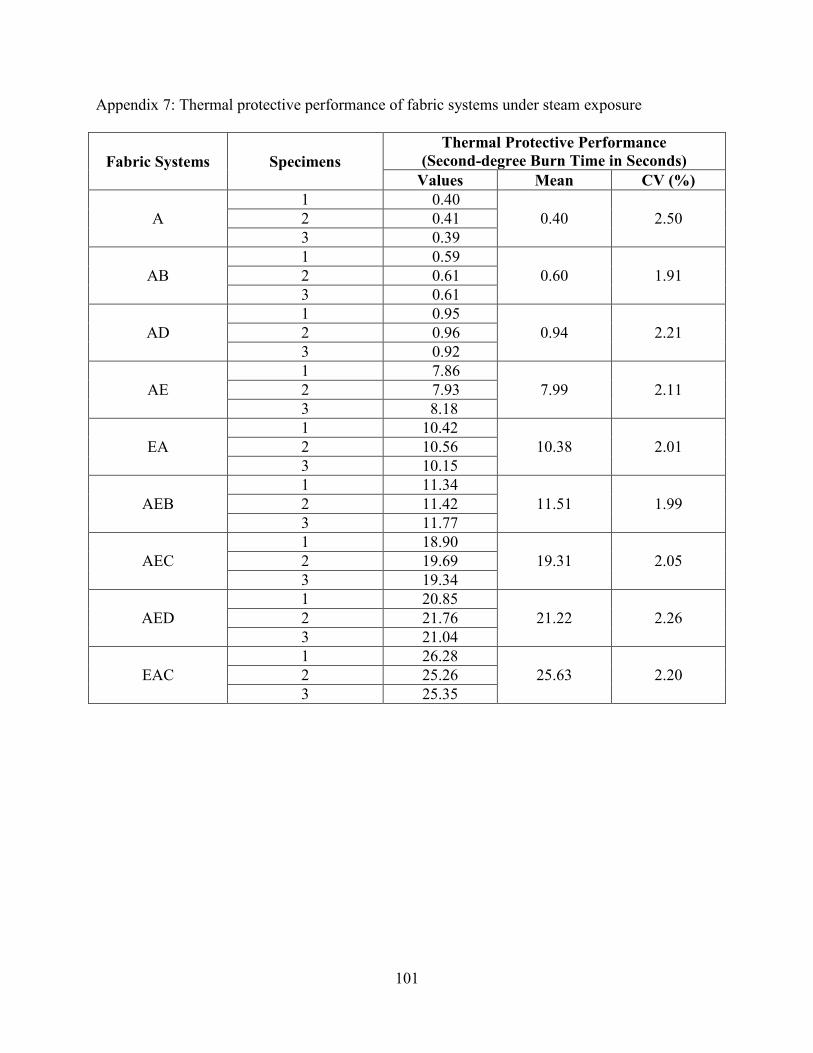
101
Appendix 7: Thermal protective performance of fabric systems under steam exposure
Fabric Systems Specimens
Thermal Protective Performance
(Second-degree Burn Time in Seconds)
Values Mean CV (%)
A
1 0.40
0.40 2.50 2 0.41
3 0.39
AB
1 0.59
0.60 1.91 2 0.61
3 0.61
AD
1 0.95
0.94 2.21 2 0.96
3 0.92
AE
1 7.86
7.99 2.11 2 7.93
3 8.18
EA
1 10.42
10.38 2.01 2 10.56
3 10.15
AEB
1 11.34
11.51 1.99 2 11.42
3 11.77
AEC
1 18.90
19.31 2.05 2 19.69
3 19.34
AED
1 20.85
21.22 2.26 2 21.76
3 21.04
EAC
1 26.28
25.63 2.20 2 25.26
3 25.35

102
Appendix 8: Thermal protective performance of fabric systems under hot-water splash exposure
Fabric Systems Specimens
Thermal Protective Performancea
(Second-degree Burn Time in Seconds)
Values Mean CV (%)
A
1 2.69
2.70 2.26 2 2.65
3 2.77
AB
1 4.34
4.37 1.73 2 4.46
3 4.32
AD
1 7.30
7.28 2.35 2 7.10
3 7.44
AE
1 60.28
60.39 1.58 2 59.49
3 61.39
EA
1 62.98
63.40 0.88 2 63.18
3 64.03
AEB
1 76.07
78.09 2.40 2 8.43
3 79.78
AEC
1 108.10
109.26 1.09 2 110.47
3 109.20
AED
1 138.48
136.07 1.97 2 133.19
3 136.53
EAC
1 118.15
119.57 2.28 2 117.85
3 122.71 a
Measured according to modified ASTM F 2701 (ASTM International, 2008c).

103
Appendix 9: Thermal protective performance of fabric systems under hot-water immersion with compression exposure

104
Appendix 10: ANN coding for predicting thermal protective performance under flame exposure
input=[0.69 0.073;2.18 0.117;3.53 0.169;1.42 0.095;1.42 0.095;2.88 0.129;3.49 0.151;4.23
0.184;3.49 0.151]; % input data.
target=[2.75;12.81;16.59;9.58;5.72;11.79;15.74;20.84;15.47]; % target data.
[inputn,meani,stdi,targetn,meant,stdt] = prestd(input',target');
% preprocessing or normalizing the data with mean at zero and standard deviation 1
M=[5 1]; % size of ith layer, for Nl layers.
netflame = newff(minmax(inputn),M,{'tansig','purelin'},'traingdm');
% creating the feedforward backpropagation(gradient descent with momentum) neural network.
% here newff defines feedforward network architecture.
% first argument minmax(inputn) defines range of input and initializes the network parameters.
% second argument defines the structure of the network. There is 1 hidden and 1 output layer.
% 5 is the number of the nodes in the first hidden layer.
% 1 is the number of nodes in the output layer.
% next, the activation functions in the layers are defined.
% in the first hidden layer, there are 5 tansig functions.
% in the output layer, there is 1 linear function.
netflame.trainParam.epochs=3000; % number of epochs/iterations.
netflame.trainParam.lr=0.3; % learning rate.
netflame.trainParam.mc=0.6; % momentum.
netflame=train(netflame,inputn,targetn);
y=sim(netflame,inputn);
% to simulate the trained network on the original input data.
output=poststd(y',meant,stdt); % to convert y back to the original scale.
[output target] % predicted data vs actual data
title('Comparison between actual targets and predictions')
d=[output-target].^2; % to calculate square error between actual and predicted values.
mse=mean(d) % to calculate the mean square error (mse).
rmse=sqrt(mse) % to calculate the root mean square error (rmse).
[m,b,r]=postreg(output',target') % use of regression analysis to judge the network performance.
Rsquare=r.^2 % to calculate the Coefficient of Determination (R2).
save netflame % to save the trained network 'netflame'.
load netflame % to load the trained network 'netflame'.
% newinput = [3.49 0.151];
% newinputn = trastd(newinput',meani,stdi);
% newoutputn = sim(netflame,newinputn);
% newoutput = poststd(newoutputn',meant,stdt)

105
Appendix 11: ANN coding for predicting thermal protective performance under radiant heat
exposure
input=[0.69 0.073;2.18 0.117;3.53 0.169;1.42 0.095;1.42 0.095;2.88 0.129;3.49 0.151;4.23
0.184;3.49 0.151]; % input data.
target=[4.64;11.9;24.18;9.22;7.91;17.6;23.19;27.93;20.59]; % target data.
[inputn,meani,stdi,targetn,meant,stdt] = prestd(input',target');
% preprocessing or normalizing the data with mean at zero and standard deviation 1.
M=[5 1]; % size of ith layer, for Nl layers.
netrh = newff(minmax(inputn),M,{'tansig','purelin'},'traingdm');
% creating the feedforward backpropagation(gradient descent with momentum) neural network.
% here newff defines feedforward network architecture.
% first argument minmax(inputn) defines range of input and initializes the network parameters.
% second argument defines structure of the network. There is 1 hidden and 1 output layer.
% 5 is the number of the nodes in the first hidden layer.
% 1 is the number of nodes in the output layer.
% next, the activation functions in the layers are defined.
% in the first hidden layer, there are 5 tansig functions.
% in the output layer, there is 1 linear function.
netrh.trainParam.epochs=3000; % number of epochs/iterations.
netrh.trainParam.lr=0.3; % learning rate.
netrh.trainParam.mc=0.6; % momentum.
netrh=train(netrh,inputn,targetn);
y=sim(netrh,inputn);
% to simulate the trained network on the original input data.
output=poststd(y',meant,stdt); % to convert y back to the original scale.
[output target] % predicted data vs actual data.
title('Comparison between actual targets and predictions')
d=[output-target].^2; % to calculate square error between actual and predicted values.
mse=mean(d) % to calculate the mean square error (mse).
rmse=sqrt(mse) % to calculate the root mean square error (rmse).
[m,b,r]=postreg(output',target') % use of regression analysis to judge the network performance.
Rsquare=r.^2 % to calculate the Coefficient of Determination (R2).
save netrh % to save the trained network 'netrh'.
load netrh % to load the trained network 'netrh'.
% newinput = [3.49 0.151];
% newinputn = trastd(newinput',meani,stdi);
% newoutputn = sim(netrh,newinputn);
% newoutput = poststd(newoutputn',meant,stdt)

106
Appendix 12: ANN coding for predicting thermal protective performance under hot surface
contact exposure
input=[0.69 0.073;2.18 0.117;3.53 0.169;1.42 0.095;1.42 0.095;2.88 0.129;3.49 0.151;4.23
0.184;3.49 0.151]; % input data.
target=[1.51;4.77;6.87;5.16;3.54;9.45;16.27;17.3;7.22]; % target data.
[inputn,meani,stdi,targetn,meant,stdt] = prestd(input',target');
% preprocessing or normalizing the data with mean at zero and standard deviation 1.
M=[5 1]; % size of ith layer, for Nl layers.
neths = newff(minmax(inputn),M,{'tansig','purelin'},'traingdm');
% creating the feedforward backpropagation(gradient descent with momentum) neural network.
% here newff defines feedforward network architecture.
% first argument minmax(inputn) defines range of input and initializes the network parameters.
% second argument defines the structure of the network. There is 1 hidden and 1 output layer.
% 5 is the number of the nodes in the first hidden layer.
% 1 is the number of nodes in the output layer.
% next, the activation functions in the layers are defined.
% in the first hidden layer, there are 5 tansig functions.
% in the output layer, there is 1 linear function.
neths.trainParam.epochs=3000; % number of epochs/iterations.
neths.trainParam.lr=0.3; % learning rate.
neths.trainParam.mc=0.6; % momentum.
neths=train(neths,inputn,targetn);
y=sim(neths,inputn);
% to simulate the trained network on the original input data.
output=poststd(y',meant,stdt); % to convert y back to the original scale.
[output target] % predicted data vs actual data.
title('Comparison between actual targets and predictions')
d=[output-target].^2; % to calculate square error between actual and predicted values.
mse=mean(d) % to calculate the mean square error (mse).
rmse=sqrt(mse) % to calculate the root mean square error (rmse).
[m,b,r]=postreg(output',target') % use of regression analysis to judge the network performance.
Rsquare=r.^2 % to calculate the Coefficient of Determination (R2).
save neths % to save the trained network 'neths'.
load neths % to load the trained network 'neths'.
% newinput = [3.49 0.151];
% newinputn = trastd(newinput',meani,stdi);
% newoutputn = sim(neths,newinputn);
% newoutput = poststd(newoutputn',meant,stdt)

107
Appendix 13: ANN coding for predicting thermal protective performance under steam exposure
input=[0.69 15.71 4.4;2.18 13.59 9.87;3.53 13.3 12.7;1.42 0 20.7;1.42 0 21.17;2.88 0 25.9;3.49 0
25.4;4.23 0 28.03;3.49 0 25.37]; % input data.
target=[0.4;0.6;0.94;7.99;10.38;11.51;19.31;21.22;25.63]; % target data.
[inputn,meani,stdi,targetn,meant,stdt] = prestd(input',target');
% preprocessing or normalizing the data with mean at zero and standard deviation 1.
M=[5 1]; % size of ith layer, for Nl layers.
netsteam = newff(minmax(inputn),M,{'tansig','purelin'},'traingdm');
% creating the feedforward backpropagation(gradient descent with momentum) neural network.
% here newff defines feedforward network architecture.
% first argument minmax(inputn) defines range of input and initializes the network parameters.
% second argument defines the structure of the network. There is 1 hidden and 1 output layer.
% 5 is the number of the nodes in the first hidden layer.
% 1 is the number of nodes in the output layer.
% next, the activation functions in the layers are defined.
% in the first hidden layer, there are 5 tansig functions.
% in the output layer, there is 1 linear function.
netsteam.trainParam.epochs=3000; % number of epochs/iterations.
netsteam.trainParam.lr=0.3; % learning rate.
netsteam.trainParam.mc=0.6; % momentum.
netsteam=train(netsteam,inputn,targetn);
y=sim(netsteam,inputn);
% to simulate the trained network on the original input data.
output=poststd(y',meant,stdt); % to convert y back to the original scale.
[output target] % predicted data vs actual data.
title('Comparison between actual targets and predictions')
d=[output-target].^2; % to calculate square error between actual and predicted values.
mse=mean(d) % to calculate the mean square error (mse).
rmse=sqrt(mse) % to calculate the root mean square error (rmse).
[m,b,r]=postreg(output',target') % use of regression analysis to judge the network performance.
Rsquare=r.^2 % to calculate the Coefficient of Determination (R2).
save netsteam % to save the trained network 'netsteam'.
load netsteam % to load the trained network 'netsteam'.
% newinput = [3.49 0 25.4];
% newinputn = trastd(newinput',meani,stdi);
% newoutputn = sim(netsteam,newinputn);
% newoutput = poststd(newoutputn',meant,stdt)

108
Appendix 14: ANN coding for predicting thermal protective performance under hot-water splash
exposure
input=[0.69 15.71 4.4;2.18 13.59 9.87;3.53 13.3 12.7;1.42 0 20.7;1.42 0 21.17;2.88 0 25.9;3.49 0
25.4;4.23 0 28.03;3.49 0 25.37]; % input data.
target=[2.7;4.37;7.28;60.39;63.4;78.09;109.26;136.07;119.57]; % target data.
[inputn,meani,stdi,targetn,meant,stdt] = prestd(input',target');
% preprocessing or normalizing the data with mean at zero and standard deviation 1.
M=[5 1]; % size of ith layer, for Nl layers.
netsplash1 = newff(minmax(inputn),M,{'tansig','purelin'},'traingdm');
% creating the feedforward backpropagation(gradient descent with momentum) neural network.
% here newff defines feedforward network architecture.
% first argument minmax(inputn) defines range of input and initializes the network parameters.
% second argument defines the structure of the network. There is 1 hidden and 1 output layer.
% 5 is the number of the nodes in the first hidden layer.
% 1 is the number of nodes in the output layer.
% next, the activation functions in the layers are defined.
% in the first hidden layer, there are 5 tansig functions.
% in the output layer, there is 1 linear function.
netsplash1.trainParam.epochs=3000; % number of epochs/iterations.
netsplash1.trainParam.lr=0.3; % learning rate.
netsplash1.trainParam.mc=0.6; % momentum.
netsplash1=train(netsplash1,inputn,targetn);
y=sim(netsplash1,inputn);
% to simulate the trained network on the original input data.
output=poststd(y',meant,stdt); % to convert y back to the original scale.
[output target] % predicted data vs actual data
title('Comparison between actual targets and predictions')
d=[output-target].^2; % to calculate square error between actual and predicted values.
mse=mean(d) % to calculate the mean square error (mse).
rmse=sqrt(mse) % to calculate the root mean square error (rmse).
[m,b,r]=postreg(output',target') % use of regression analysis to judge the network performance.
Rsquare=r.^2 % to calculate the Coefficient of Determination (R2).
save netsplash1 % to save the trained network 'netsplash1'.
load netsplash1 % to load the trained network 'netsplash1'.
% newinput = [3.49 0 25.4];
% newinputn = trastd(newinput',meani,stdi);
% newoutputn = sim(netsplash1,newinputn);
% newoutput = poststd(newoutputn',meant,stdt)

109
Appendix 15: ANN coding for predicting thermal protective performance under hot-water
immersion and compression exposure at 56 kPa and 75°C
input=[0.69 15.71 4.4;2.18 13.59 9.87;3.53 13.3 12.7;1.42 0 20.7;1.42 0 21.17;2.88 0 25.9;3.49 0
25.4;4.23 0 28.03;3.49 0 25.37]; % input data.
target=[5.29;6.19;5.96;29.99;32.68;57.06;48.58;63.2;52.64]; % target data.
[inputn,meani,stdi,targetn,meant,stdt] = prestd(input',target');
%preprocessing or normalizing the data with mean at zero and standard deviation 1.
M=[5 1]; % size of ith layer, for Nl layers.
netimmersion75 = newff(minmax(inputn),M,{'tansig','purelin'},'traingdm');
% creating the feedforward backpropagation(gradient descent with momentum) neural network.
% here newff defines feedforward network architecture.
% first argument minmax(inputn) defines range of input and initializes the network parameters.
% second argument defines the structure of the network. There is 1 hidden and 1 output layer.
% 5 is the number of the nodes in the first hidden layer.
% 1 is the number of nodes in the output layer.
% next, the activation functions in the layers are defined.
% in the first hidden layer, there are 5 tansig functions.
% in the output layer, there is 1 linear function.
netimmersion75.trainParam.epochs=3000; % number of epochs/iterations.
netimmersion75.trainParam.lr=0.3; % learning rate.
netimmersion75.trainParam.mc=0.6; % momentum.
netimmersion75=train(netimmersion75,inputn,targetn);
y=sim(netimmersion75,inputn);
% to simulate the trained network on the original input data.
output=poststd(y',meant,stdt); % to convert y back to the original scale.
[output target] % predicted data vs actual data.
title('Comparison between actual targets and predictions')
d=[output-target].^2; % to calculate square error between actual and predicted values.
mse=mean(d) % to calculate the mean square error (mse).
rmse=sqrt(mse) % to calculate the root mean square error (rmse).
[m,b,r]=postreg(output',target') % to judge the network performance, use of regression analysis
Rsquare=r.^2 % to calculate the Coefficient of Determination (R2).
save netimmersion75 % to save the trained network 'netimmersion75'.
load netimmersion75 % to load the trained network 'netimmersion75'.
% newinput = [3.49 0 25.4];
% newinputn = trastd(newinput',meani,stdi);
% newoutputn = sim(netimmersion75,newinputn);
% newoutput = poststd(newoutputn',meant,stdt)

110
Appendix 16: ANN coding for predicting thermal protective performance under hot-water
immersion and compression exposure at 56 kPa and 85°C
input=[0.69 15.71 4.4;2.18 13.59 9.87;3.53 13.3 12.7;1.42 0 20.7;1.42 0 21.17;2.88 0 25.9;3.49 0
25.4;4.23 0 28.03;3.49 0 25.37]; % input data.
target=[3.63;5.82;6.49;11.31;21.57;35.12;36.25;42.84;40.35]; % target data.
[inputn,meani,stdi,targetn,meant,stdt] = prestd(input',target');
% preprocessing or normalizing the data with mean at zero and standard deviation 1.
M=[5 1]; % size of ith layer, for Nl layers.
netimmersion85 = newff(minmax(inputn),M,{'tansig','purelin'},'traingdm');
% creating the feedforward backpropagation(gradient descent with momentum) neural network.
% here newff defines feedforward network architecture.
% first argument minmax(inputn) defines range of input and initializes the network parameters.
% second argument defines the structure of the network. There is 1 hidden and 1 output layer.
% 5 is the number of the nodes in the first hidden layer.
% 1 is the number of nodes in the output layer.
% next, the activation functions in the layers are defined.
% in the first hidden layer, there are 5 tansig functions.
% in the output layer, there is 1 linear function.
netimmersion85.trainParam.epochs=3000; % number of epochs/iterations.
netimmersion85.trainParam.lr=0.3; % learning rate.
netimmersion85.trainParam.mc=0.6; % momentum.
netimmersion85=train(netimmersion85,inputn,targetn);
y=sim(netimmersion85,inputn);
% to simulate the trained network on the original input data.
output=poststd(y',meant,stdt); % to convert y back to the original scale.
[output target] % predicted data vs actual data.
title('Comparison between actual targets and predictions')
d=[output-target].^2; % to calculate square error between actual and predicted values.
mse=mean(d) % to calculate the mean square error (mse).
rmse=sqrt(mse) % to calculate the root mean square error (rmse).
[m,b,r]=postreg(output',target') % use of regression analysis to judge the network performance.
Rsquare=r.^2 % to calculate the Coefficient of Determination (R2).
save netimmersion85 % to save the trained network 'netimmersion85'.
load netimmersion85 % to load the trained network 'netimmersion85'.
% newinput = [3.49 0 25.4];
% newinputn = trastd(newinput',meani,stdi);
% newoutputn = sim(netimmersion85,newinputn);
% newoutput = poststd(newoutputn',meant,stdt)

111
Appendix 17: ANN coding for predicting thermal protective performance under hot-water
immersion and compression exposure at 56 kPa and 95°C
input=[0.69 15.71 4.4;2.18 13.59 9.87;3.53 13.3 12.7;1.42 0 20.7;1.42 0 21.17;2.88 0 25.9;3.49 0
25.4;4.23 0 28.03;3.49 0 25.37]; % input data.
target=[2.05;2.74;2.78;9.53;16.84;22.7;24.45;29.84;26.04]; % target data.
[inputn,meani,stdi,targetn,meant,stdt] = prestd(input',target');
% preprocessing or normalizing the data with mean at zero and standard deviation 1.
M=[5 1]; % size of ith layer, for Nl layers.
netimmersion95 = newff(minmax(inputn),M,{'tansig','purelin'},'traingdm');
% creating the feedforward backpropagation(gradient descent with momentum) neural network.
% here newff defines feedforward network architecture.
% first argument minmax(inputn) defines range of input and initializes the network parameters.
% second argument defines the structure of the network. There is 1 hidden and 1 output layer.
% 5 is the number of the nodes in the first hidden layer.
% 1 is the number of nodes in the output layer.
% next, the activation functions in the layers are defined.
% in the first hidden layer, there are 5 tansig functions.
% in the output layer, there is 1 linear function.
netimmersion95.trainParam.epochs=3000; % number of epochs/iterations.
netimmersion95.trainParam.lr=0.3; % learning rate.
netimmersion95.trainParam.mc=0.6; % momentum.
netimmersion95=train(netimmersion95,inputn,targetn);
y=sim(netimmersion95,inputn);
% to simulate the trained network on the original input data.
output=poststd(y',meant,stdt); % to convert y back to the original scale.
[output target] % predicted data vs actual data.
title('Comparison between actual targets and predictions')
d=[output-target].^2; % to calculate square error between actual and predicted values.
mse=mean(d) % to calculate the mean square error (mse).
rmse=sqrt(mse) % to calculate the root mean square error (rmse).
[m,b,r]=postreg(output',target') % use of regression analysis to judge the network performance.
Rsquare=r.^2 % to calculate the Coefficient of Determination (R2).
save netimmersion95 % to save the trained network 'netimmersion95'.
load netimmersion95 % to load the trained network 'netimmersion95'.
% newinput = [3.49 0 25.4];
% newinputn = trastd(newinput',meani,stdi);
% newoutputn = sim(netimmersion95,newinputn);
% newoutput = poststd(newoutputn',meant,stdt)

112
Appendix 18: ANN coding for predicting thermal protective performance under hot-water
immersion and compression exposure at 14 kPa and 85°C
input=[0.69 15.71 4.4;2.18 13.59 9.87;3.53 13.3 12.7;1.42 0 20.7;1.42 0 21.17;2.88 0 25.9;3.49 0
25.4;4.23 0 28.03;3.49 0 25.37]; % input data.
target=[4.26;6.69;6.67;19.72;23.16;40;36.11;46.54;43.89]; % target data.
[inputn,meani,stdi,targetn,meant,stdt] = prestd(input',target');
% preprocessing or normalizing the data with mean at zero and standard deviation 1.
M=[5 1]; % size of ith layer, for Nl layers.
netimmersion2p = newff(minmax(inputn),M,{'tansig','purelin'},'traingdm');
% creating the feedforward backpropagation(gradient descent with momentum) neural network.
% here newff defines feedforward network architecture.
% first argument minmax(inputn) defines range of input and initializes the network parameters.
% second argument defines the structure of the network. There is 1 hidden and 1 output layer.
% 5 is the number of the nodes in the first hidden layer.
% 1 is the number of nodes in the output layer.
% next, the activation functions in the layers are defined.
% in the first hidden layer, there are 5 tansig functions.
% in the output layer, there is 1 linear function.
netimmersion2p.trainParam.epochs=3000; % number of epochs/iterations.
netimmersion2p.trainParam.lr=0.3; % learning rate.
netimmersion2p.trainParam.mc=0.6; % momentum.
netimmersion2p=train(netimmersion2p,inputn,targetn);
y=sim(netimmersion2p,inputn);
% to simulate the trained network on the original input data.
output=poststd(y',meant,stdt); % to convert y back to the original scale.
[output target] % predicted data vs actual data.
title('Comparison between actual targets and predictions')
d=[output-target].^2; % to calculate square error between actual and predicted values.
mse=mean(d) % to calculate the mean square error (mse).
rmse=sqrt(mse) % to calculate the root mean square error (rmse).
[m,b,r]=postreg(output',target') % use of regression analysis to judge the network performance.
Rsquare=r.^2 % to calculate the Coefficient of Determination (R2).
save netimmersion2p % to save the trained network 'netimmersion2p'.
load netimmersion2p % to load the trained network 'netimmersion2p'.
% newinput = [3.49 0 25.4];
% newinputn = trastd(newinput',meani,stdi);
% newoutputn = sim(netimmersion2p,newinputn);
% newoutput = poststd(newoutputn',meant,stdt)

113
Appendix 19: ANN coding for predicting thermal protective performance under hot-water
immersion and compression exposure at 28 kPa and 85°C
input=[0.69 15.71 4.4;2.18 13.59 9.87;3.53 13.3 12.7;1.42 0 20.7;1.42 0 21.17;2.88 0 25.9;3.49 0
25.4;4.23 0 28.03;3.49 0 25.37]; % input data.
target=[4.31;5.92;6.29;19.05;22.96;38.1;39.52;44.62;42.97]; % target data.
[inputn,meani,stdi,targetn,meant,stdt] = prestd(input',target');
% preprocessing or normalizing the data with mean at zero and standard deviation 1.
M=[5 1]; % size of ith layer, for Nl layers.
netimmersion4 = newff(minmax(inputn),M,{'tansig','purelin'},'traingdm');
% creating the feedforward backpropagation(gradient descent with momentum) neural network.
% here newff defines feedforward network architecture.
% first argument minmax(inputn) defines range of input and initializes the network parameters.
% second argument defines the structure of the network. There is 1 hidden and 1 output layer.
% 5 is the number of the nodes in the first hidden layer.
% 1 is the number of nodes in the output layer.
% next, the activation functions in the layers are defined.
% in the first hidden layer, there are 5 tansig functions.
% in the output layer, there is 1 linear function.
netimmersion4.trainParam.epochs=3000; % number of epochs/iterations.
netimmersion4.trainParam.lr=0.3; % learning rate.
netimmersion4.trainParam.mc=0.6; % momentum.
netimmersion4=train(netimmersion4,inputn,targetn);
y=sim(netimmersion4,inputn);
% to simulate the trained network on the original input data.
output=poststd(y',meant,stdt); % to convert y back to the original scale.
[output target] % predicted data vs actual data.
title('Comparison between actual targets and predictions')
d=[output-target].^2; % to calculate square error between actual and predicted values.
mse=mean(d) % to calculate the mean square error (mse).
rmse=sqrt(mse) % to calculate the root mean square error (rmse).
[m,b,r]=postreg(output',target') % use of regression analysis to judge the network performance.
Rsquare=r.^2 % to calculate the Coefficient of Determination (R2).
save netimmersion4 % to save the trained network 'netimmersion4'.
load netimmersion4 % to load the trained network 'netimmersion4'.
% newinput = [3.49 0 25.4];
% newinputn = trastd(newinput',meani,stdi);
% newoutputn = sim(netimmersion4,newinputn);
% newoutput = poststd(newoutputn',meant,stdt)