Studies of displacement of antibodies from surface- bound...
34
UPTEC X 06 046 ISSN 1401-2138 DEC 2006 JOHAN NYBERG Studies of displacement of antibodies from surface- bound antibody-antigen complexes Master’s degree project
Transcript of Studies of displacement of antibodies from surface- bound...
UPTEC X 06 046 ISSN 1401-2138 DEC 2006
JOHAN NYBERG
Studies of displacement of
antibodies from surface-
bound antibody-antigen
complexes
Master’s degree project
Molecular Biotechnology Programme
Uppsala University School of Engineering
UPTEC X 06 046 Date of issue 2006-12
Author
Johan Nyberg
Title (English)
Studies of displacement of antibodies from surface-bound antibody-antigen complexes
Title (Swedish)
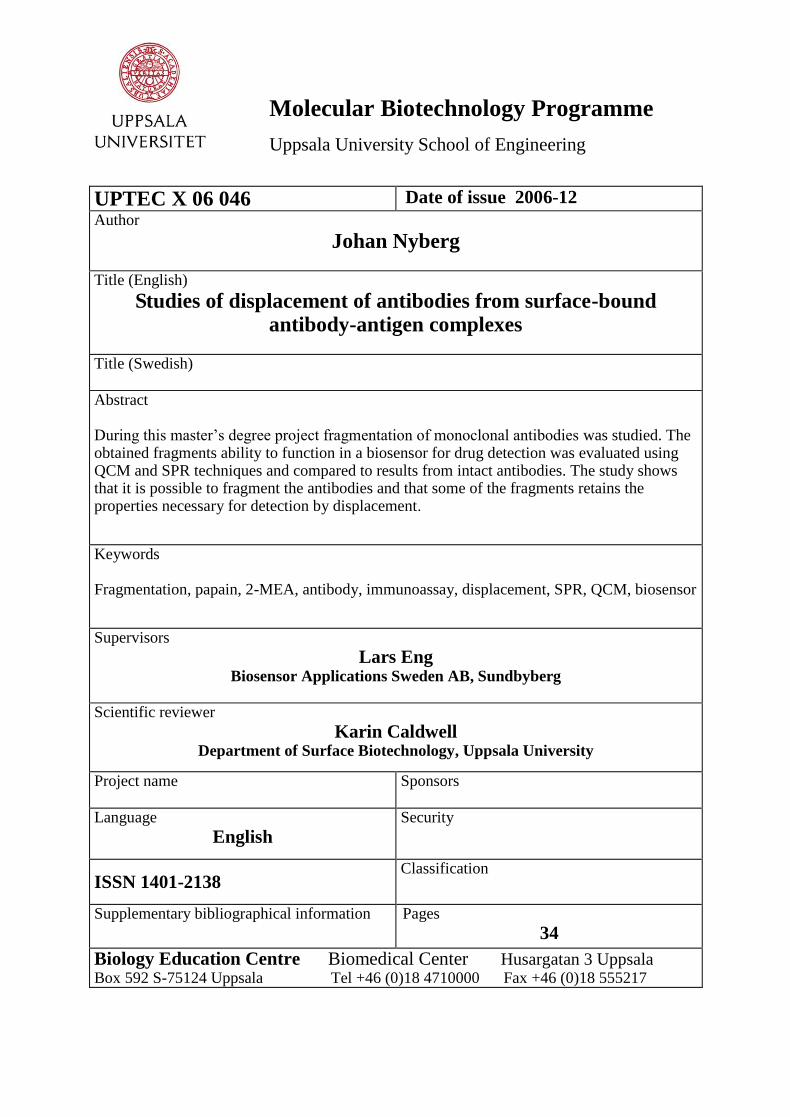
Abstract During this master’s degree project fragmentation of monoclonal antibodies was studied. The obtained fragments ability to function in a biosensor for drug detection was evaluated using QCM and SPR techniques and compared to results from intact antibodies. The study shows that it is possible to fragment the antibodies and that some of the fragments retains the properties necessary for detection by displacement.
Keywords Fragmentation, papain, 2-MEA, antibody, immunoassay, displacement, SPR, QCM, biosensor
Supervisors
Lars Eng Biosensor Applications Sweden AB, Sundbyberg
Scientific reviewer
Karin Caldwell Department of Surface Biotechnology, Uppsala University
Project name
Sponsors
Language
English
Security
ISSN 1401-2138
Classification
Supplementary bibliographical information Pages
34
Biology Education Centre Biomedical Center Husargatan 3 Uppsala
Box 592 S-75124 Uppsala Tel +46 (0)18 4710000 Fax +46 (0)18 555217
Studies of displacement of antibodies from surface-bound antibody-antigen complexes
Johan Nyberg
Sammanfattning
Biosensor Applications AB utvecklar en biosensor vid namn BIOSENSTM
för detektion av
droger och sprängämnen. Denna bygger på QCM teknik och specificiteten hos monoklonala
antikroppar. Examensarbetet har syftat till att undersöka fragmentering av dessa antikroppar
och studera deras bindningsegenskaper. I arbetet har två olika antikroppar studerats, en
specifik för kokain och en för ecstasy. Två olika metoder användes för att fragmentera
antikropparna, reduktiv klyvning och enzymatisk nedbrytning. Fragmentens och de intakta
antikropparnas bindningsegenskaper studerades med hjälp av QCM och SPR teknik. Syftet
med att fragmentera antikroppar och endast använda ett mindre fragment är att undvika
ospecifik adsorption av antikroppen till biosensorns sensoryta, minska möjligheten till
återbindning av antikroppen till sensorytan vid detektion och att få en snabbare och enklare
kinetik.
I studien framkom det att de två antikropparna inte gick att klyva till önskade fragment med
reduktiv klyvning under de förhållanden som undersöktes. Den enzymatiska klyvningen
fungerade bättre och gav önskade fragment. Dessa kunde därför studeras med QCM och SPR
och jämföras med hela antikroppar. De erhållna fragmenten från den kokain specifika
antikroppen visade på viss bindningsförmåga till sensorytan men gav inte upphov till någon
detekterbar signal vid kontakt med kokain. Fragmenten från den ecstasy specifika antikroppen
däremot, band både bra till sensorytan och gav upphov till en detekterbar signal vid kontakt
med ecstasy. Jämförelser med den intakta ecstasy specifika antikroppen visade på en viss
förlust av bindningsförmåga och att signalen för ecstasy minskade. I studien gick det alltså att
konstatera att de ecstasy specifika fragmenten från den enzymatiska fragmenteringen
fungerade för att detektera ecstasy. Huruvida de är bättre för användning i BIOSENS än
intakta antikroppar gick dock inte att bestämma i detta projekt.
Examensarbete 20 poäng
Civilingenjörsprogrammet i Molekylär Bioteknik
Uppsala Universitet december 2006
2
Contents
INTRODUCTION 3
BACKGROUND 3
THE PROJECT 4 SPR ANALYSIS 4
FRAGMENTATION OF ANTIBODIES 4
COMPARISON OF BI- AND MONOVALENT ANTIBODIES 5
MATERIALS AND METHODS 7
MATERIALS 7
INSTRUMENTATION 7
METHODS 7 SPR ANALYSIS 7
FRAGMENTATION OF ANTIBODIES 8
COMPARISON OF BI- AND MONOVALENT ANTIBODIES 9
RESULTS 10
SPR ANALYSIS 10 COCAINE 10
ECSTASY 11
QCM ANALYSIS 12
FRAGMENTATION OF ANTIBODIES 13 REDUCTIVE CLEAVAGE BY 2-MEA 14
PAPAIN FRAGMENTATION 16
COMPARISON OF BI- AND MONOVALENT ANTIBODIES 19 QCM MEASUREMENTS 19
SPR MEASUREMENTS 21
DISCUSSION 25
SPR ANALYSIS 25
FRAGMENTATION OF ANTIBODIES 25
COMPARISON OF BI- AND MONOVALENT ANTIBODIES 26
CONCLUSION 28
ACKNOWLEDGMENTS 29
REFERENCES 30
APPENDIX 1: KINETICS 31
3
Introduction
Background
This master’s degree project was performed at Biosensor Applications Sweden AB in
Stockholm. Biosensor Applications develops a biosensor for detection of small amounts of
drugs and explosives, BIOSENSTM
. BIOSENS uses a displacement immunoassay based on a
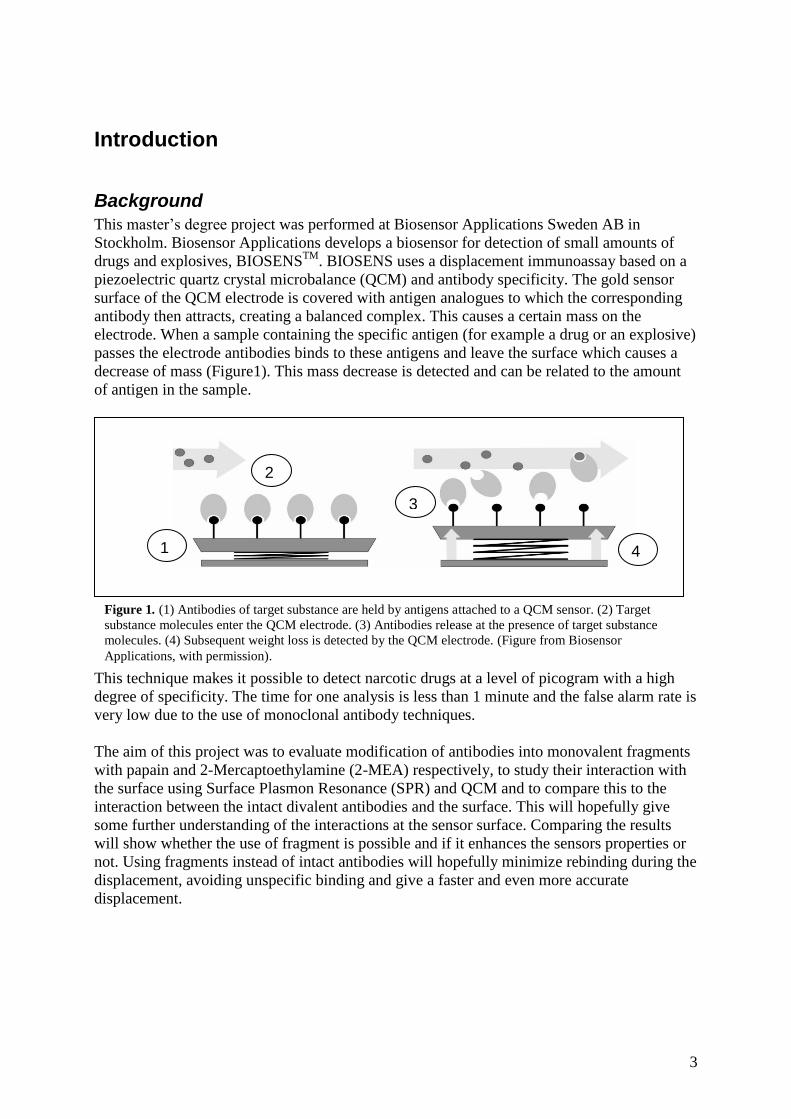
piezoelectric quartz crystal microbalance (QCM) and antibody specificity. The gold sensor
surface of the QCM electrode is covered with antigen analogues to which the corresponding
antibody then attracts, creating a balanced complex. This causes a certain mass on the
electrode. When a sample containing the specific antigen (for example a drug or an explosive)
passes the electrode antibodies binds to these antigens and leave the surface which causes a
decrease of mass (Figure1). This mass decrease is detected and can be related to the amount
of antigen in the sample.
This technique makes it possible to detect narcotic drugs at a level of picogram with a high
degree of specificity. The time for one analysis is less than 1 minute and the false alarm rate is
very low due to the use of monoclonal antibody techniques.
The aim of this project was to evaluate modification of antibodies into monovalent fragments
with papain and 2-Mercaptoethylamine (2-MEA) respectively, to study their interaction with
the surface using Surface Plasmon Resonance (SPR) and QCM and to compare this to the
interaction between the intact divalent antibodies and the surface. This will hopefully give
some further understanding of the interactions at the sensor surface. Comparing the results
will show whether the use of fragment is possible and if it enhances the sensors properties or
not. Using fragments instead of intact antibodies will hopefully minimize rebinding during the
displacement, avoiding unspecific binding and give a faster and even more accurate
displacement.
1
2
3
4
Figure 1. (1) Antibodies of target substance are held by antigens attached to a QCM sensor. (2) Target
substance molecules enter the QCM electrode. (3) Antibodies release at the presence of target substance
molecules. (4) Subsequent weight loss is detected by the QCM electrode. (Figure from Biosensor
Applications, with permission).
4
The project
The project was divided into three main steps; implementation of BIOSENS into SPR system,
fragmentation of antibodies and comparison of mono and bivalent antibodies. Two different
substances were chosen for the project, cocaine and ecstasy.
SPR analysis
The key feature of this part was to evaluate whether or not it was possible to study the system
of BIOSENS in a SPR system. The system used was a Biacore 2000. To simulate the system
conditions from BIOSENS, all parameters were set as the ones in BIOSENS. This included
temperature, flow rate, buffer, regeneration method and immobilisation chemistry. Due to the
differences between Biacore 2000 and BIOSENS the immobilisation procedure of the antigen
analogues had to be altered.
Fragmentation of antibodies
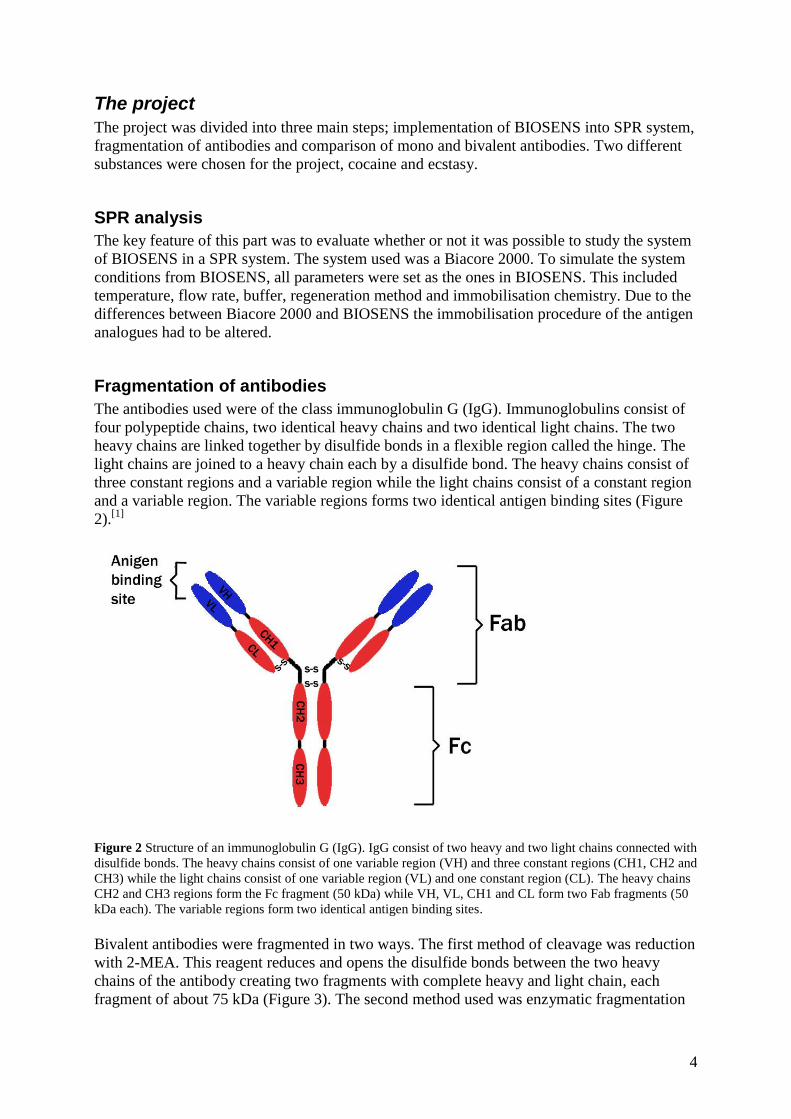
The antibodies used were of the class immunoglobulin G (IgG). Immunoglobulins consist of
four polypeptide chains, two identical heavy chains and two identical light chains. The two
heavy chains are linked together by disulfide bonds in a flexible region called the hinge. The
light chains are joined to a heavy chain each by a disulfide bond. The heavy chains consist of
three constant regions and a variable region while the light chains consist of a constant region
and a variable region. The variable regions forms two identical antigen binding sites (Figure
2).[1]
Figure 2 Structure of an immunoglobulin G (IgG). IgG consist of two heavy and two light chains connected with
disulfide bonds. The heavy chains consist of one variable region (VH) and three constant regions (CH1, CH2 and
CH3) while the light chains consist of one variable region (VL) and one constant region (CL). The heavy chains
CH2 and CH3 regions form the Fc fragment (50 kDa) while VH, VL, CH1 and CL form two Fab fragments (50
kDa each). The variable regions form two identical antigen binding sites.
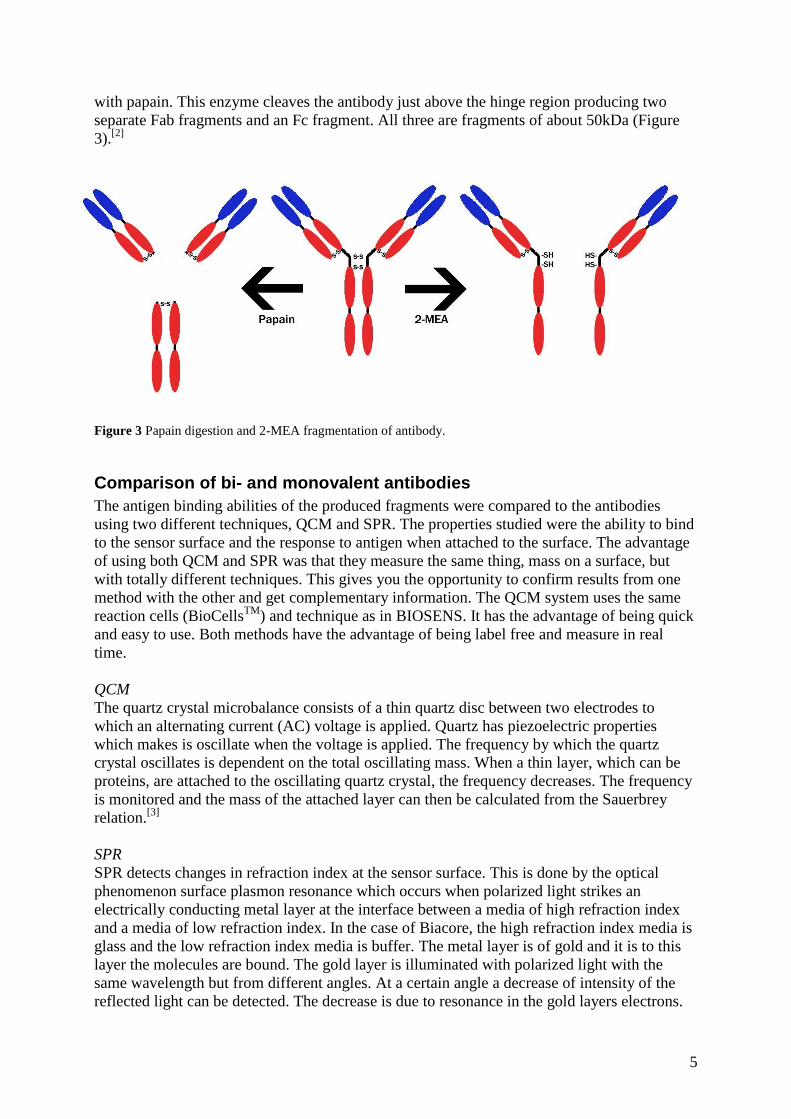
Bivalent antibodies were fragmented in two ways. The first method of cleavage was reduction
with 2-MEA. This reagent reduces and opens the disulfide bonds between the two heavy
chains of the antibody creating two fragments with complete heavy and light chain, each
fragment of about 75 kDa (Figure 3). The second method used was enzymatic fragmentation
5
with papain. This enzyme cleaves the antibody just above the hinge region producing two
separate Fab fragments and an Fc fragment. All three are fragments of about 50kDa (Figure
3).[2]
Figure 3 Papain digestion and 2-MEA fragmentation of antibody.
Comparison of bi- and monovalent antibodies
The antigen binding abilities of the produced fragments were compared to the antibodies
using two different techniques, QCM and SPR. The properties studied were the ability to bind
to the sensor surface and the response to antigen when attached to the surface. The advantage
of using both QCM and SPR was that they measure the same thing, mass on a surface, but
with totally different techniques. This gives you the opportunity to confirm results from one
method with the other and get complementary information. The QCM system uses the same
reaction cells (BioCellsTM
) and technique as in BIOSENS. It has the advantage of being quick
and easy to use. Both methods have the advantage of being label free and measure in real
time.
QCM
The quartz crystal microbalance consists of a thin quartz disc between two electrodes to
which an alternating current (AC) voltage is applied. Quartz has piezoelectric properties
which makes is oscillate when the voltage is applied. The frequency by which the quartz
crystal oscillates is dependent on the total oscillating mass. When a thin layer, which can be
proteins, are attached to the oscillating quartz crystal, the frequency decreases. The frequency
is monitored and the mass of the attached layer can then be calculated from the Sauerbrey
relation.[3]
SPR
SPR detects changes in refraction index at the sensor surface. This is done by the optical
phenomenon surface plasmon resonance which occurs when polarized light strikes an
electrically conducting metal layer at the interface between a media of high refraction index
and a media of low refraction index. In the case of Biacore, the high refraction index media is
glass and the low refraction index media is buffer. The metal layer is of gold and it is to this
layer the molecules are bound. The gold layer is illuminated with polarized light with the
same wavelength but from different angles. At a certain angle a decrease of intensity of the
reflected light can be detected. The decrease is due to resonance in the gold layers electrons.
6
The angle at which this occurs is dependent on the refraction index in the buffer close to the
gold layer. The amount of molecules bound to the surface can therefore be studied by
monitoring the intensity of the reflected light at different angles, since the refraction index is
proportional to the mass. [4]
7
Materials and methods
Materials
The gold surfaces of the QCM-electrodes and SPR-electrodes were surface modified
according to a proprietary method at Biosensor laboratory. The antigen analogues used during
the surface modifications were P-B014u4, P-B038AA, P-B014T and P-B028A. The antigens
cocaine and ecstasy were obtained from Cerilliant (35006-18D and FC100203-01C).
Proprietary antibodies for cocaine (16B10) and for ecstasy (10D1) were used throughout the
study. Antigens and antibodies were dissolved in PBS buffer (Sigma P-3813, pH 7.4).
2-Mercaptoethylamine (2-MEA) and N-Ethylmaleimide (NEM) were obtained from Fluka
(30070 and 04260). Pierce reaction buffer for 2-MEA reduction (2-MEA buffer 1) contained
50 mM NaH2PO4, 150 mM NaCl and 10 mM EDTA with a pH of 7.2. Modified reaction
buffer for 2-MEA reduction (2-MEA buffer 2) contained 100 mM NaH2PO4 and 2.5 mM
EDTA with a pH of 6.0. Papain was purchased from Sigma-Aldrich (P-4762). Sample buffer
for papain digestion contained 20mM Na-phosphate and 10mM EDTA, with a pH of 7.0. The
digestion buffer for papain fragmentation contained 20mM Na-phosphate, 10mM EDTA and
20mM L-cysteine·HCl with a pH of 7.0. Iodoacetamide was obtained from Fluka (57670).
Protein G was purchased from Sigma-Aldrich (P-7700). Gels for electrophoresis were Ready
Gel from Bio-Rad, 10% Tris-HCl and 4-15% Tris-HCl (161-1101 and 161-1104). Size
reference for gel electrophoresis was Precision Plus Protein Standards from BIO-RAD. Gel
staining used was EZBlue Gel Staining Reagent from Sigma (G 1041). PBS was purchased
from Sigma (P-3813). Bovine serum albumin (BSA) was obtained from Sigma (A 3912).
Instrumentation
The SPR system used was a Biacore 2000 from Biacore AB. The sensor chips used for
Biacore 2000 were pure gold surface chips (Sensor Chip Au, BR-1005-42) and ordered from
Biacore AB. The liquid chromatography system (LC) was a Knauer Manager 2000, Knauer
Pump 1000, Knauer UV Detector 2500 used at 254 nm and Superose 12 10/300 GL column
from GE Healthcare. The electrophoresis was done in a Mini-Protean 3 Cell from Bio-Rad
connected to PowerPac Basic Power Supply also from BIO-RAD. A modified BIOSENS
system was used for the QCM measurements.
Methods
SPR analysis
Two chips were used, one for each antibody. Each chip has 4 flow cells which can be used in
series or singular. Flow cell 1 can be used as a reference to flow cell 2 and compensate for
changes in the cells due to sample injections. Flow cells 3 and 4 can be used in the same way.
Flow cell 2 of the first chip and flow cell 2 of the second chip were surface modified with
cocaine antigen analogues and ecstasy antigen analogues respectively. Flow cell 1 on each
chip was treated with BSA prior to the analysis. Concentrations of antibodies were between
0.02 and 1.58 mg/ml for cocaine and between 0.50*10-3
mg/ml and 0.48 mg/ml for ecstasy.
The studies were performed at a flow rate of 10 l/min and at a temperature of 30 oC.
Surfaces were regenerated according to procedures from Biosensor Applications AB between
every run. Studies of the antibodies response to their respective drug when attached to the
surface were performed by injecting cocaine or ecstasy with a concentration of 50-500 pg/µl
8
after antibody injections. Results were evaluated using BIAevaluation 3.2 and Microsoft
Excel.
Fragmentation of antibodies
Non reducing SDS-PAGE
Sodium dodecyl sulphate polyacrylamide gel electrophoresis (SDS-PAGE) is a technique to
separate proteins according to size. There are two types of SDS-PAGE, reducing and non-
reducing. In reducing SDS-PAGE a reducing agent is used, when the samples are prepared,
which reduces disulfide linkages. This breaks any existing quaternary protein structures and
opens up the tertiary structures. In non-reducing SDS-PAGE no reducing agent is used during
the preparation. This gives a more intact protein maintaining the quaternary structure. Non-
reducing SDS-PAGE was the technique used in this study. SDS-PAGE was used as a
complement to LC to study the results of the two fragmentation methods used. Before transfer
to the gel the samples were treated with SDS for 4 min at 95oC. The gels were run for 40
minutes at 200 V. After the electrophoreses, the gels were stained with EZBlue Gel Staining
Reagent over night and destained with deionised water according to the product information [5]
.
Reductive cleavage using 2-Mercaptoethylamine
Dialysis of ecstasy antibody 10D1 and cocaine antibody 16B10 was carried out against 2-
MEA buffer 1 for 48 hours using a dialysis membrane from Spectrum Laboratories Inc
(Spectra/Por 4 MWCO 12-14 000). The buffer was changed several times. For fragmentation,
4.1 mg of 2-MEA was added to 1 ml of each antibody sample. The final concentration of 2-
MEA was 53 mM. The samples were mixed and left to fragment for 90 min. By running the
reaction mixture on a PD-10 column from GE Healthcare the reaction was stopped and the
sample desalted.[6]
Fractions of 500 µl were collected in tubes containing 20 µl NEM with a
concentration of 10 mM. NEM was used to cap the free thiol on the antibody fragments.
Samples were left for incubation from 1 hour to overnight at room temperature. The
fragmented samples were then analysed with LC at 254 nm and non reducing SDS-PAGE.
Two further attempts were performed with 10D1. The first one examined higher
concentrations and longer reaction times using 75 mM 2-MEA and incubation over night at
37 oC. The procedure was otherwise the same as before. The second attempt was to see if
another reaction buffer would give different results. This time 2-MEA buffer 2 was used. Two
different reaction times were tested, 90 minutes as in the protocol and 230 minutes. As before
the 2-MEA concentration was 53 mM, the sample was desalted with a PD-10 column and the
thiols capped with NEM.
Papain fragmentation
Ecstasy antibody 10D1 and cocaine antibody 16B10 were dialyzed against the sample buffer
for papain fragmentation using a dialysis membrane from Spectrum Laboratories Inc
(Spectra/Por 4 MWCO 12-14 000). The dialysis was carried out for more then 48 hours with
multiple buffer changes. Fragmentation of the antibodies was performed according to a
protocol from PIERCE[7]
except for the papain concentrations which derived from a article by
C. Cresswell[8]
. The reaction mixture was prepared by mixing 0.5 ml of antibody sample with
0.5 ml digestion buffer. Papain was added and the reaction tubes were placed on a teeter in an
oven at 37 oC. Three different assays were performed for 16B10. The first fragmentation was
performed for 5 hours and 45 minute with 1.5 % (w/w) papain. The reaction was ended by
adding 10 % (v/v) 0.15 M iodoacetamide and left at 8 oC over night before being purified with
9
size exclusion chromatography, SEC (LC, Superose 12). The second reaction was left for 16
hours and 30 minutes with 1 % (w/w) papain. This reaction mixture was immediately purified
with SEC without first being stopped with iodoacetamide. The last fragmentation of 16B10
was conducted for 5 hours with 1.5 % (w/w) papain. This fragmentation was also separated
from low weight molecules immediately without addition of iodoacetamide. The three
different reactions were named A, B and C. Antibody 10D1 was treated with 1.5 % (w/w)
papain for 5 hours and 30 minutes and, as for 16B10, immediately purified with SEC. During
the separation with SEC all fractions generating a peak were collected. All samples were then
dialysed in PBS and 0.1 % azide was added. The fractions were analysed with LC at 254 nm
and non-reducing SDS-PAGE. The samples were also supposed to be purified using protein G
which separates Fab fragments from Fc fragments and antibodies. Due to problems with the
protein G column during pre-studies of the papain fragmentation this method of purification
had to be left out.
Comparison of bi- and monovalent antibodies
Antibody fragments and antibodies were compared using both QCM and SPR. The QCM
system used two serial detection cells (cocaine or ecstasy). The injection loop was a 50 µl
loop and filled between 3 and 10 times to assure the right concentration of sample. After
injection of antibodies or fragments, cocaine or ecstasy (50 pg/µl) was injected. Each
detection cell was verified for proper performance according to Biosensor standard protocol.
Biacore 2000 was used for two main studies of the antibodies and their fragments. Here the
objective was comparison of the mass uptake responses when injecting the same amount
(mg/ml) of protein, as well as the kinetics of binding. Comparison of responses was done by
repeatedly injecting 0.1 mg/ml of fragments or antibodies at a flow rate of 10 µl/min and a
temperature of 30 oC. The surface was regenerated between every injection according to
procedures from Biosensor Applications. The resulting curves were then compared in
BIAevaluation 3.2. The kinetic studies were carried out by injecting antibodies or fragments
for 2.5 minutes and then washing with eluent for 5 minutes. All surfaces were regenerated
before injection of the next concentration. A minimum of 6 different concentrations were used
for each study. The concentrations were between 0.5 mg/l and 50.0 mg/l for antibodies and 1
mg/l to 100 mg/l for fragments. The chips used were the same as in the earlier SPR
measurements with the addition of an extra surface for the ecstasy study where an antigen
analogue (P-B028A) with known high affinity but not optimized for displacement was used.
To be able to study the 16B10 fragments a new surface was made where the antigen (P-
B014T) was used. The new surfaces were surface modified according to the same proprietary
method as mentioned in materials.
The kinetic constants were calculated by making plots in Excel. See Appendix 1
10
Antibody
Eluent Regeneration
Results
SPR analysis
A set of tests was conducted to establish that the system worked, to learn the amount of
regeneration needed and to study the reproducibility.
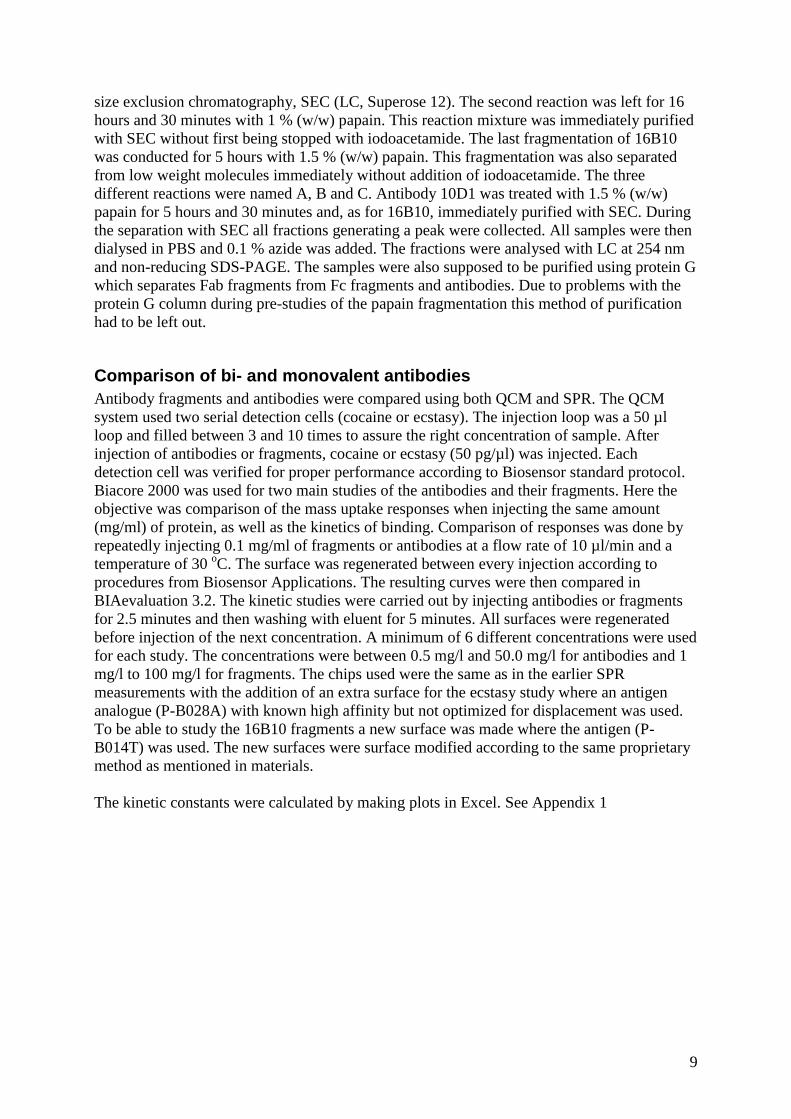
Cocaine
The binding of the cocaine antibody 16B10 to the cocaine sensor surface was followed at
different antibody concentrations. The concentrations ranged between 0.10 and 1.58 mg/ml.
The result showed an increased response with an increase in concentration as expected. The
concentration 0.10 mg/ml gave a response of 2864 RU (Figure 4). The unit 1 RU is
approximately 1 pg/mm2 and therefore the response for 0.10 mg/ml corresponds to, about
2.86 ng/mm2.
Figure 4 Sensorgram showing the adhesion of 16B10 to the cocaine sensor surface. The concentrations were
0.10, 0.26, 0.52, 0.75, 1.05 and 1.58 mg/ml.
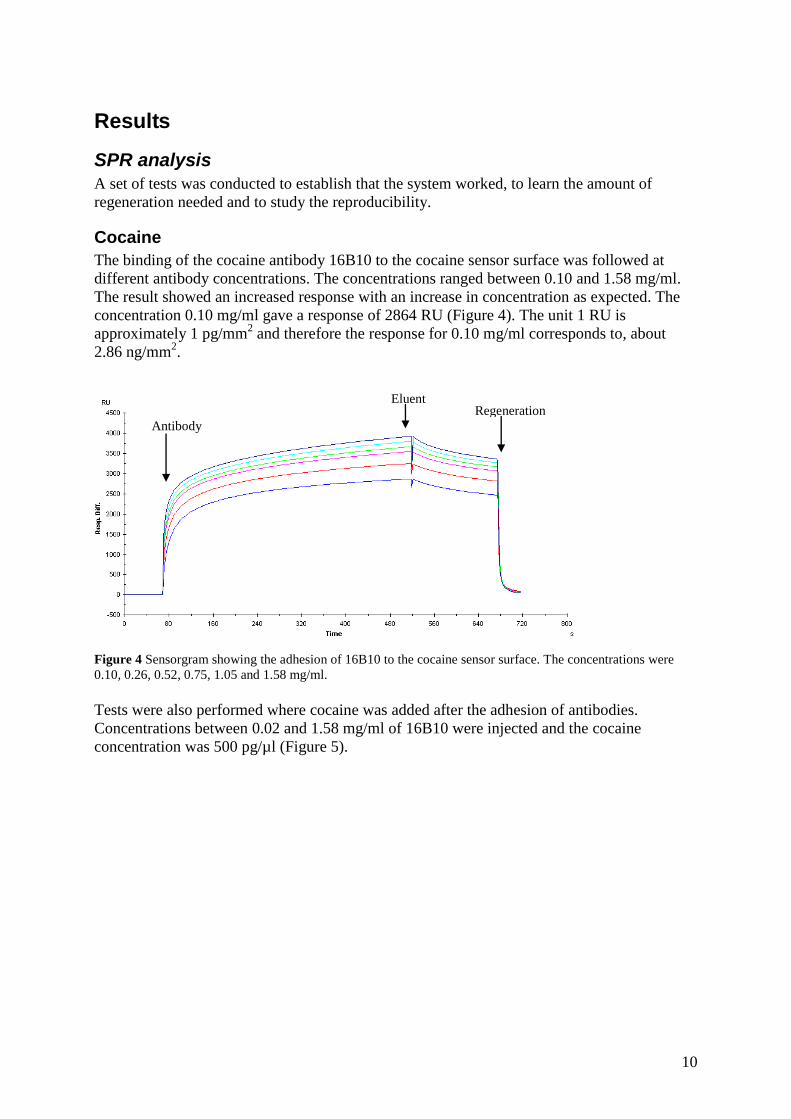
Tests were also performed where cocaine was added after the adhesion of antibodies.
Concentrations between 0.02 and 1.58 mg/ml of 16B10 were injected and the cocaine
concentration was 500 pg/µl (Figure 5).
11
Antibody Eluent Regeneration
Antibody
Eluent
Cocaine
Figure 5 Sensorgram showing the adhesion of 16B10 with the concentrations 0.02, 0.10, 0.26, 0.52, 0.75, 1.05
and 1.58 mg/ml. The cocaine concentration was 0.50 mg/l.
Ecstasy
The binding of the ecstasy antibody 10D1 to the ecstasy surface was followed in a series of
tests. As a start, 10D1 was repeatedly injected to confirm that the system was robust. Samples
of 0.10 mg/ml were injected and removed four times resulting in maximum response values
between 3308 and 3387 RU (Figure 6). The responses correspond to 3.34 ng/mm2.
Figure 6 Sensorgram showing four adhesions of ecstasy antibody 10D1 to the sensor surface. The antibody
concentration was 0.10 mg/ml.
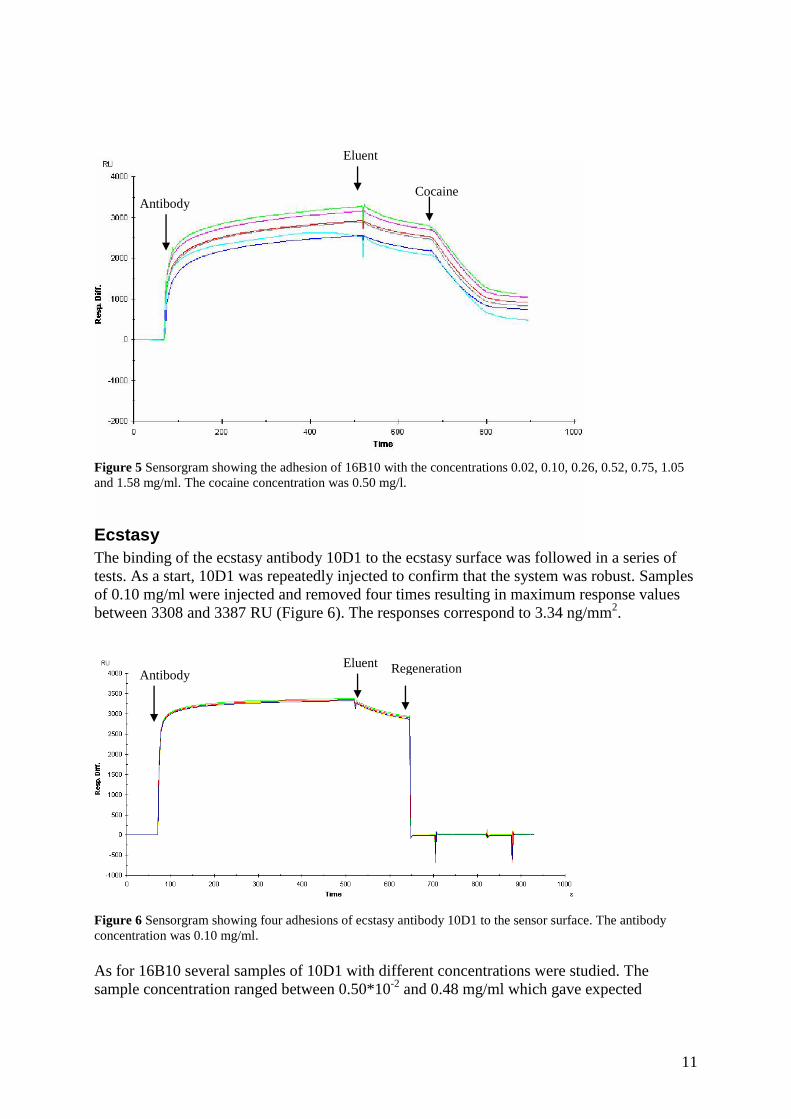
As for 16B10 several samples of 10D1 with different concentrations were studied. The
sample concentration ranged between 0.50*10-2
and 0.48 mg/ml which gave expected
12
Antibody
Eluent
Regeneration
Antibody
Eluent
separation of curves according to the amount of antibodies in each one. The highest response
for 0.10 mg/ml was 3196 RU. (Figure 7)
Figure 7 Sensorgram showing adhesion of antibody 10D1, of different concentrations, to the ecstasy sensor
surface. The concentrations were 0.005, 0.010, 0.025, 0.050, 0.100, 0.200 and 0.480 mg/ml.
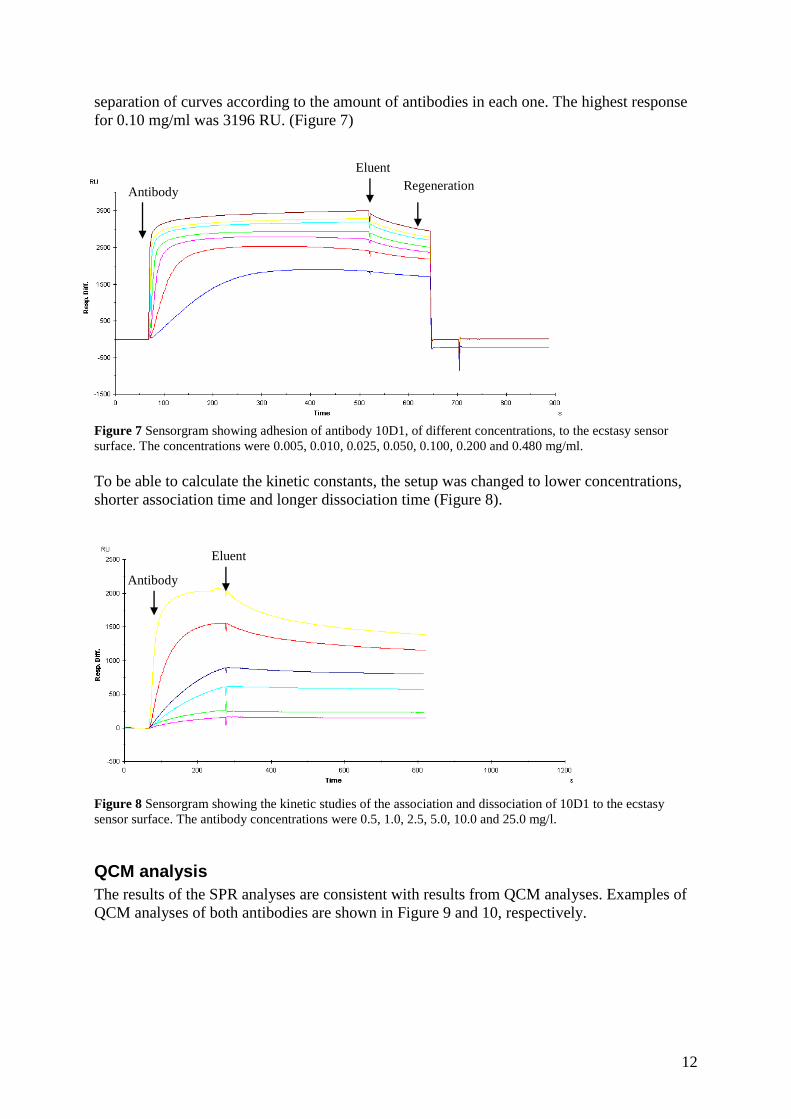
To be able to calculate the kinetic constants, the setup was changed to lower concentrations,
shorter association time and longer dissociation time (Figure 8).
Figure 8 Sensorgram showing the kinetic studies of the association and dissociation of 10D1 to the ecstasy
sensor surface. The antibody concentrations were 0.5, 1.0, 2.5, 5.0, 10.0 and 25.0 mg/l.
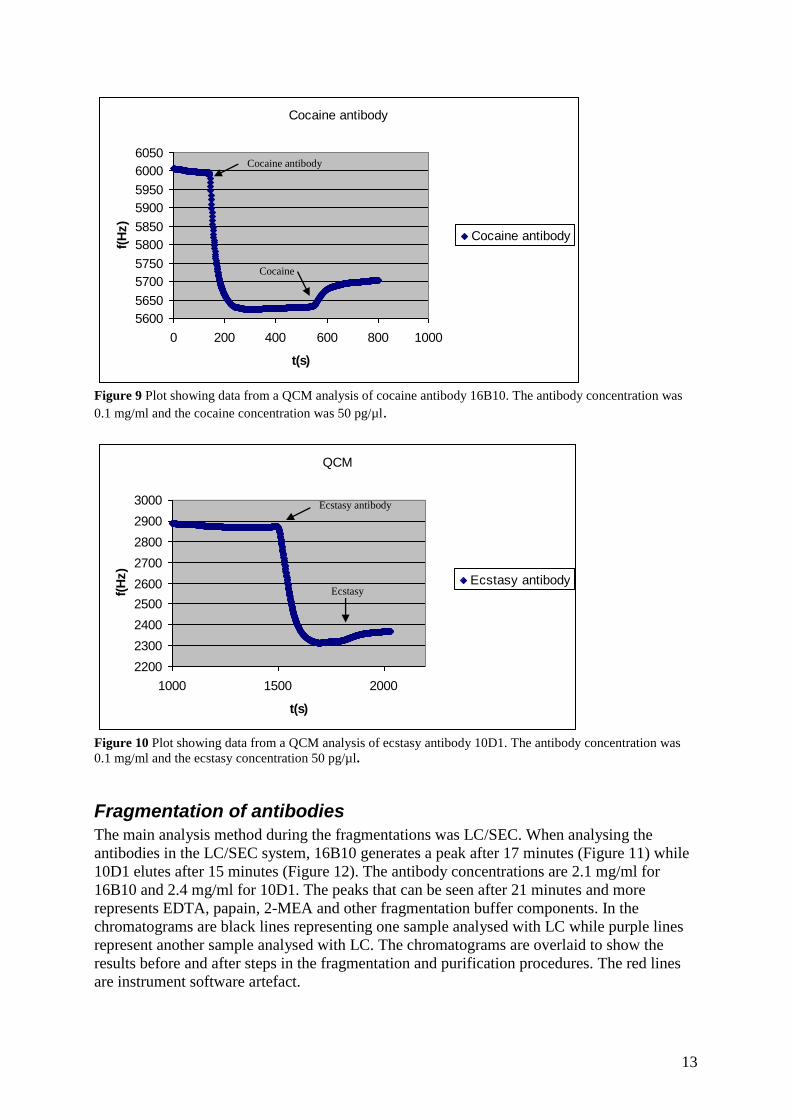
QCM analysis
The results of the SPR analyses are consistent with results from QCM analyses. Examples of
QCM analyses of both antibodies are shown in Figure 9 and 10, respectively.
13
Cocaine antibody
5600
5650
5700
5750
5800
5850
5900
5950
6000
6050
0 200 400 600 800 1000
t(s)
f(H
z)
Cocaine antibody
Figure 9 Plot showing data from a QCM analysis of cocaine antibody 16B10. The antibody concentration was
0.1 mg/ml and the cocaine concentration was 50 pg/µl.
QCM
2200
2300
2400
2500
2600
2700
2800
2900
3000
1000 1500 2000
t(s)
f(H
z)
Ecstasy antibody
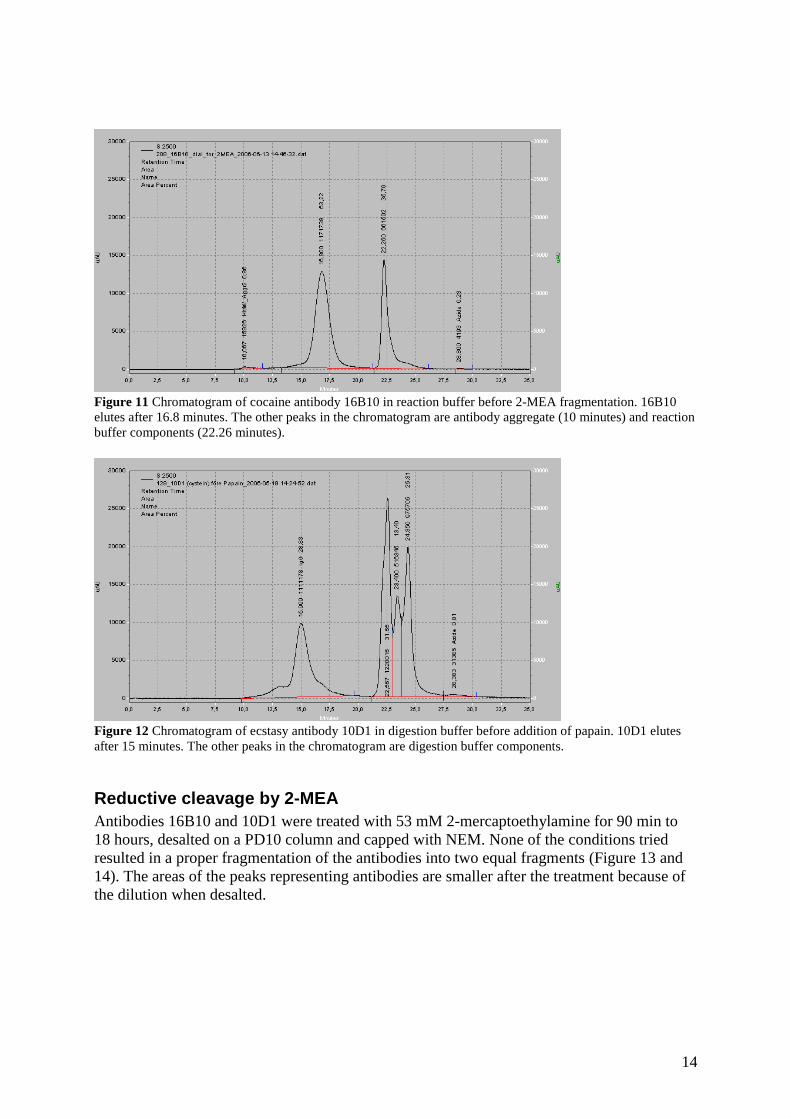
Figure 10 Plot showing data from a QCM analysis of ecstasy antibody 10D1. The antibody concentration was
0.1 mg/ml and the ecstasy concentration 50 pg/µl.
Fragmentation of antibodies
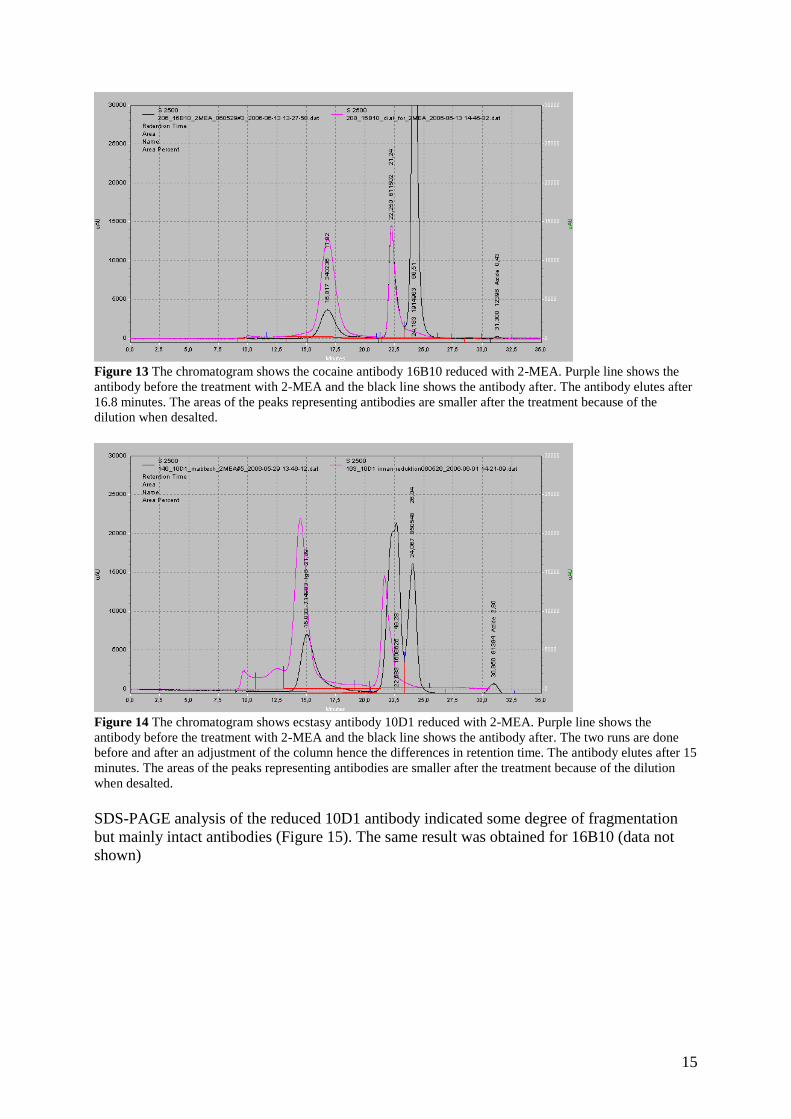
The main analysis method during the fragmentations was LC/SEC. When analysing the
antibodies in the LC/SEC system, 16B10 generates a peak after 17 minutes (Figure 11) while
10D1 elutes after 15 minutes (Figure 12). The antibody concentrations are 2.1 mg/ml for
16B10 and 2.4 mg/ml for 10D1. The peaks that can be seen after 21 minutes and more
represents EDTA, papain, 2-MEA and other fragmentation buffer components. In the
chromatograms are black lines representing one sample analysed with LC while purple lines
represent another sample analysed with LC. The chromatograms are overlaid to show the
results before and after steps in the fragmentation and purification procedures. The red lines
are instrument software artefact.
Cocaine antibody
Cocaine
Ecstasy
Ecstasy antibody
14
Figure 11 Chromatogram of cocaine antibody 16B10 in reaction buffer before 2-MEA fragmentation. 16B10
elutes after 16.8 minutes. The other peaks in the chromatogram are antibody aggregate (10 minutes) and reaction
buffer components (22.26 minutes).
Figure 12 Chromatogram of ecstasy antibody 10D1 in digestion buffer before addition of papain. 10D1 elutes
after 15 minutes. The other peaks in the chromatogram are digestion buffer components.
Reductive cleavage by 2-MEA
Antibodies 16B10 and 10D1 were treated with 53 mM 2-mercaptoethylamine for 90 min to
18 hours, desalted on a PD10 column and capped with NEM. None of the conditions tried
resulted in a proper fragmentation of the antibodies into two equal fragments (Figure 13 and
14). The areas of the peaks representing antibodies are smaller after the treatment because of
the dilution when desalted.
15
Figure 13 The chromatogram shows the cocaine antibody 16B10 reduced with 2-MEA. Purple line shows the
antibody before the treatment with 2-MEA and the black line shows the antibody after. The antibody elutes after
16.8 minutes. The areas of the peaks representing antibodies are smaller after the treatment because of the
dilution when desalted.
Figure 14 The chromatogram shows ecstasy antibody 10D1 reduced with 2-MEA. Purple line shows the
antibody before the treatment with 2-MEA and the black line shows the antibody after. The two runs are done
before and after an adjustment of the column hence the differences in retention time. The antibody elutes after 15
minutes. The areas of the peaks representing antibodies are smaller after the treatment because of the dilution
when desalted.
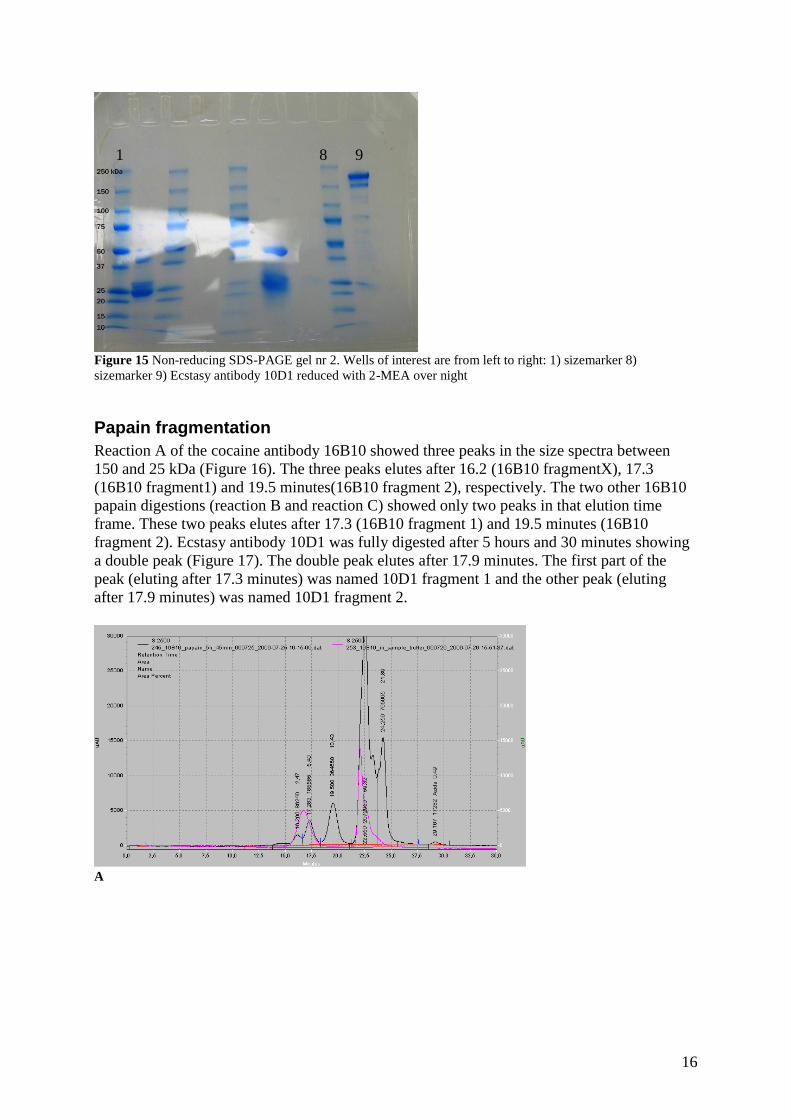
SDS-PAGE analysis of the reduced 10D1 antibody indicated some degree of fragmentation
but mainly intact antibodies (Figure 15). The same result was obtained for 16B10 (data not
shown)
16
Figure 15 Non-reducing SDS-PAGE gel nr 2. Wells of interest are from left to right: 1) sizemarker 8)
sizemarker 9) Ecstasy antibody 10D1 reduced with 2-MEA over night
Papain fragmentation
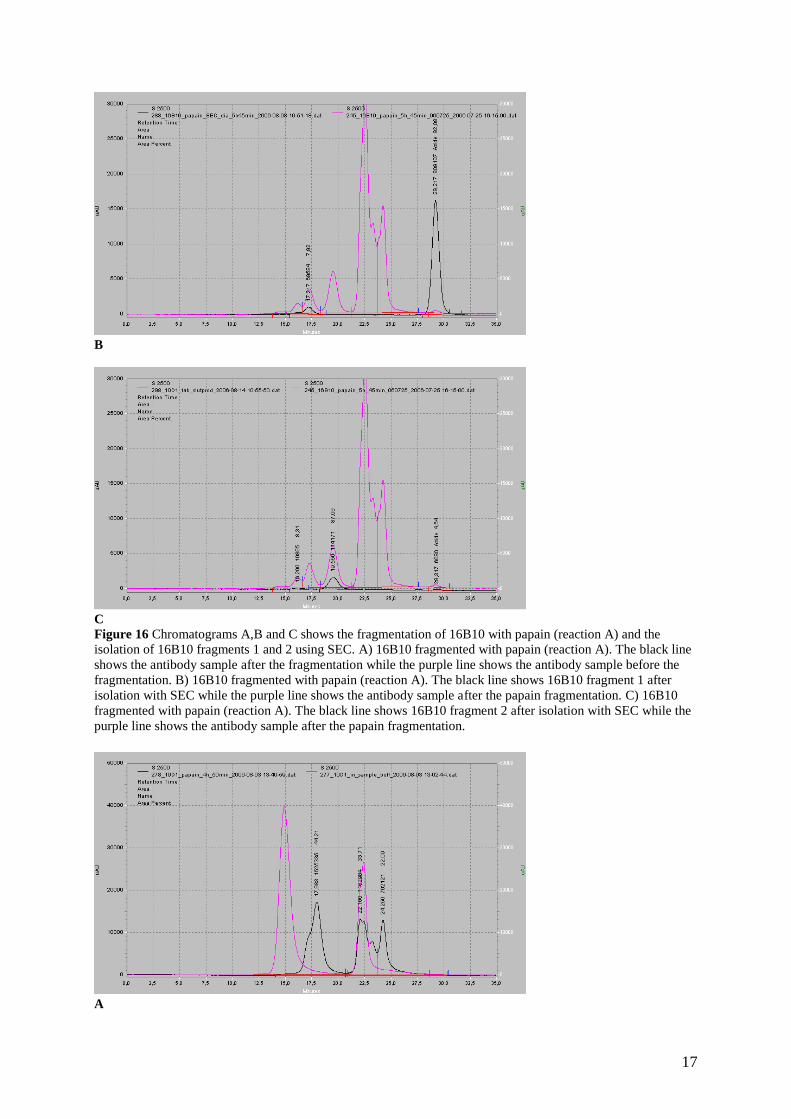
Reaction A of the cocaine antibody 16B10 showed three peaks in the size spectra between
150 and 25 kDa (Figure 16). The three peaks elutes after 16.2 (16B10 fragmentX), 17.3
(16B10 fragment1) and 19.5 minutes(16B10 fragment 2), respectively. The two other 16B10
papain digestions (reaction B and reaction C) showed only two peaks in that elution time
frame. These two peaks elutes after 17.3 (16B10 fragment 1) and 19.5 minutes (16B10
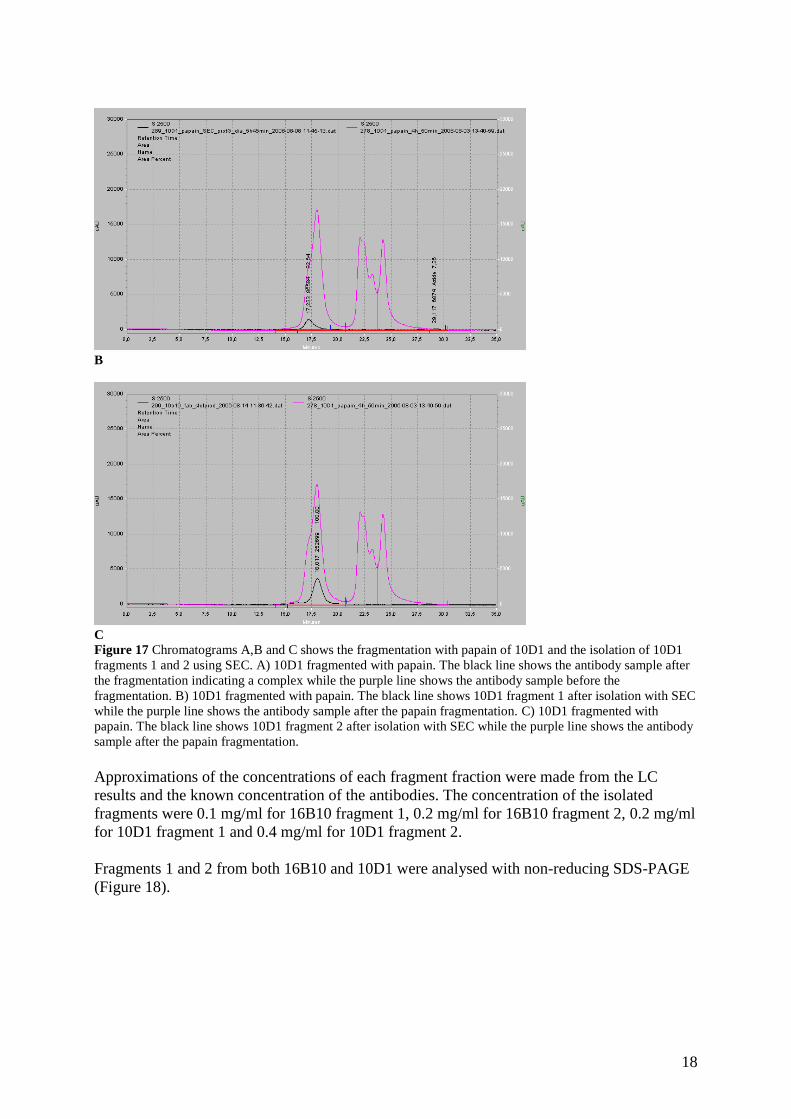
fragment 2). Ecstasy antibody 10D1 was fully digested after 5 hours and 30 minutes showing
a double peak (Figure 17). The double peak elutes after 17.9 minutes. The first part of the
peak (eluting after 17.3 minutes) was named 10D1 fragment 1 and the other peak (eluting
after 17.9 minutes) was named 10D1 fragment 2.
A
8 9 1
17
B
C
Figure 16 Chromatograms A,B and C shows the fragmentation of 16B10 with papain (reaction A) and the
isolation of 16B10 fragments 1 and 2 using SEC. A) 16B10 fragmented with papain (reaction A). The black line
shows the antibody sample after the fragmentation while the purple line shows the antibody sample before the
fragmentation. B) 16B10 fragmented with papain (reaction A). The black line shows 16B10 fragment 1 after
isolation with SEC while the purple line shows the antibody sample after the papain fragmentation. C) 16B10
fragmented with papain (reaction A). The black line shows 16B10 fragment 2 after isolation with SEC while the
purple line shows the antibody sample after the papain fragmentation.
A
18
B
C
Figure 17 Chromatograms A,B and C shows the fragmentation with papain of 10D1 and the isolation of 10D1
fragments 1 and 2 using SEC. A) 10D1 fragmented with papain. The black line shows the antibody sample after
the fragmentation indicating a complex while the purple line shows the antibody sample before the
fragmentation. B) 10D1 fragmented with papain. The black line shows 10D1 fragment 1 after isolation with SEC
while the purple line shows the antibody sample after the papain fragmentation. C) 10D1 fragmented with
papain. The black line shows 10D1 fragment 2 after isolation with SEC while the purple line shows the antibody
sample after the papain fragmentation.
Approximations of the concentrations of each fragment fraction were made from the LC
results and the known concentration of the antibodies. The concentration of the isolated
fragments were 0.1 mg/ml for 16B10 fragment 1, 0.2 mg/ml for 16B10 fragment 2, 0.2 mg/ml
for 10D1 fragment 1 and 0.4 mg/ml for 10D1 fragment 2.
Fragments 1 and 2 from both 16B10 and 10D1 were analysed with non-reducing SDS-PAGE
(Figure 18).
19
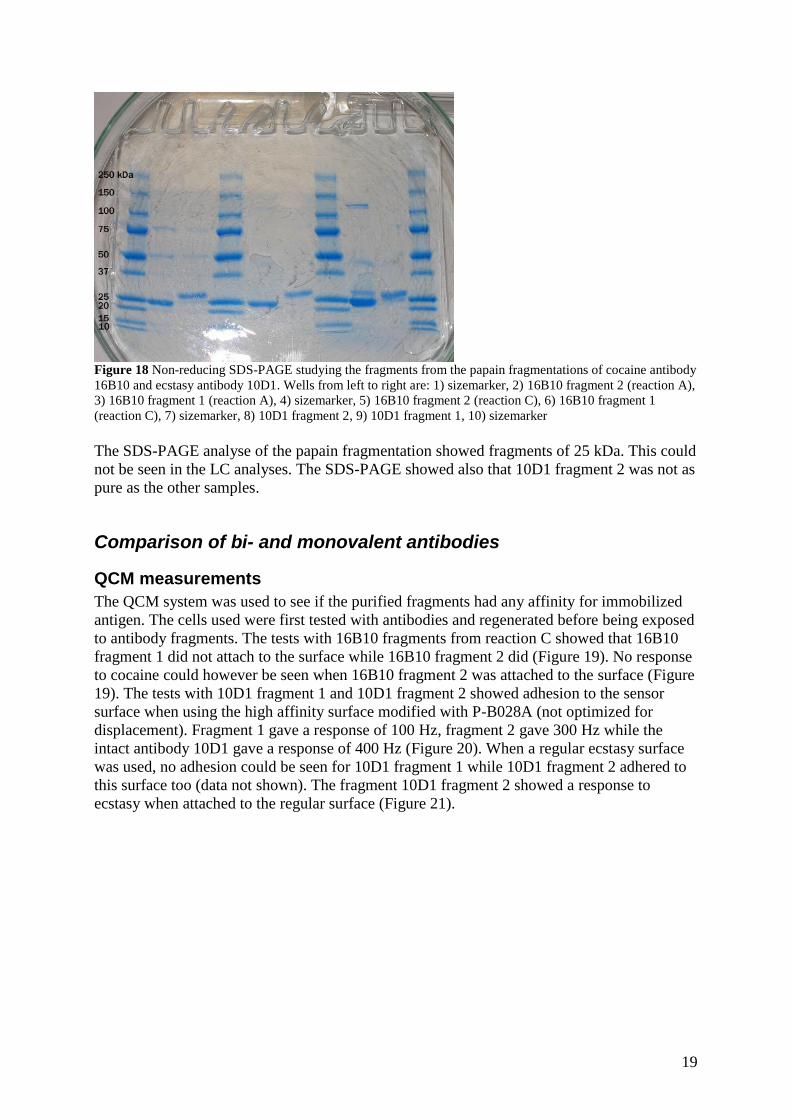
Figure 18 Non-reducing SDS-PAGE studying the fragments from the papain fragmentations of cocaine antibody
16B10 and ecstasy antibody 10D1. Wells from left to right are: 1) sizemarker, 2) 16B10 fragment 2 (reaction A),
3) 16B10 fragment 1 (reaction A), 4) sizemarker, 5) 16B10 fragment 2 (reaction C), 6) 16B10 fragment 1
(reaction C), 7) sizemarker, 8) 10D1 fragment 2, 9) 10D1 fragment 1, 10) sizemarker
The SDS-PAGE analyse of the papain fragmentation showed fragments of 25 kDa. This could
not be seen in the LC analyses. The SDS-PAGE showed also that 10D1 fragment 2 was not as
pure as the other samples.
Comparison of bi- and monovalent antibodies
QCM measurements
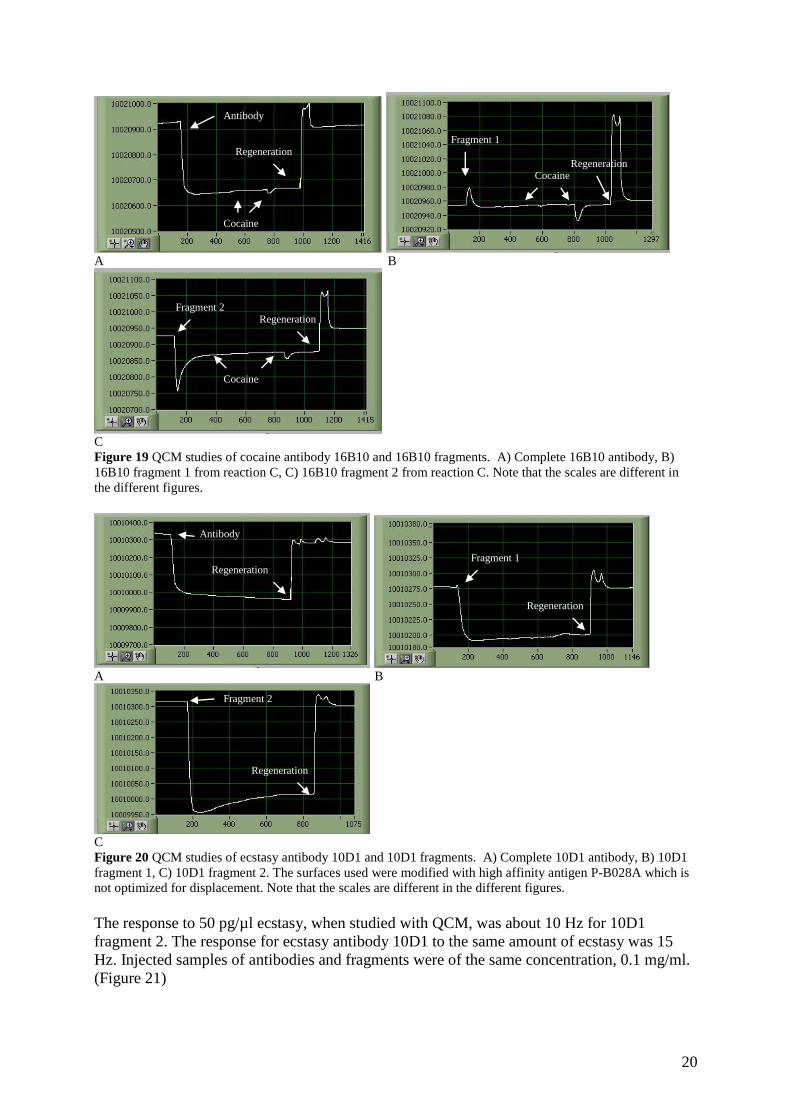
The QCM system was used to see if the purified fragments had any affinity for immobilized
antigen. The cells used were first tested with antibodies and regenerated before being exposed
to antibody fragments. The tests with 16B10 fragments from reaction C showed that 16B10
fragment 1 did not attach to the surface while 16B10 fragment 2 did (Figure 19). No response
to cocaine could however be seen when 16B10 fragment 2 was attached to the surface (Figure
19). The tests with 10D1 fragment 1 and 10D1 fragment 2 showed adhesion to the sensor
surface when using the high affinity surface modified with P-B028A (not optimized for
displacement). Fragment 1 gave a response of 100 Hz, fragment 2 gave 300 Hz while the
intact antibody 10D1 gave a response of 400 Hz (Figure 20). When a regular ecstasy surface
was used, no adhesion could be seen for 10D1 fragment 1 while 10D1 fragment 2 adhered to
this surface too (data not shown). The fragment 10D1 fragment 2 showed a response to
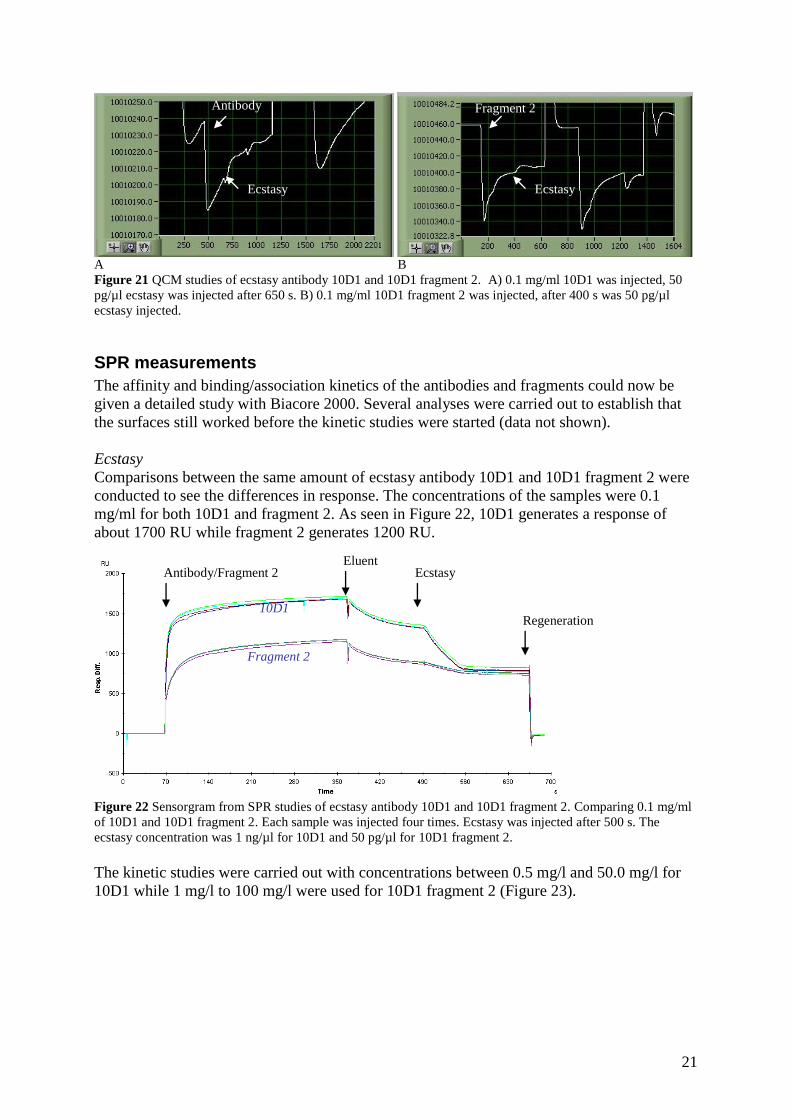
ecstasy when attached to the regular surface (Figure 21).
20
A B
C
Figure 19 QCM studies of cocaine antibody 16B10 and 16B10 fragments. A) Complete 16B10 antibody, B)
16B10 fragment 1 from reaction C, C) 16B10 fragment 2 from reaction C. Note that the scales are different in
the different figures.
A B
C
Figure 20 QCM studies of ecstasy antibody 10D1 and 10D1 fragments. A) Complete 10D1 antibody, B) 10D1
fragment 1, C) 10D1 fragment 2. The surfaces used were modified with high affinity antigen P-B028A which is
not optimized for displacement. Note that the scales are different in the different figures.
The response to 50 pg/µl ecstasy, when studied with QCM, was about 10 Hz for 10D1
fragment 2. The response for ecstasy antibody 10D1 to the same amount of ecstasy was 15
Hz. Injected samples of antibodies and fragments were of the same concentration, 0.1 mg/ml.
(Figure 21)
Antibody
Regeneration Fragment 1
Regeneration
Fragment 2
Regeneration
Antibody
Regeneration
Cocaine
Fragment 1
Regeneration Cocaine
Fragment 2 Regeneration
Cocaine
21
A B
Figure 21 QCM studies of ecstasy antibody 10D1 and 10D1 fragment 2. A) 0.1 mg/ml 10D1 was injected, 50
pg/µl ecstasy was injected after 650 s. B) 0.1 mg/ml 10D1 fragment 2 was injected, after 400 s was 50 pg/µl
ecstasy injected.
SPR measurements
The affinity and binding/association kinetics of the antibodies and fragments could now be
given a detailed study with Biacore 2000. Several analyses were carried out to establish that
the surfaces still worked before the kinetic studies were started (data not shown).
Ecstasy
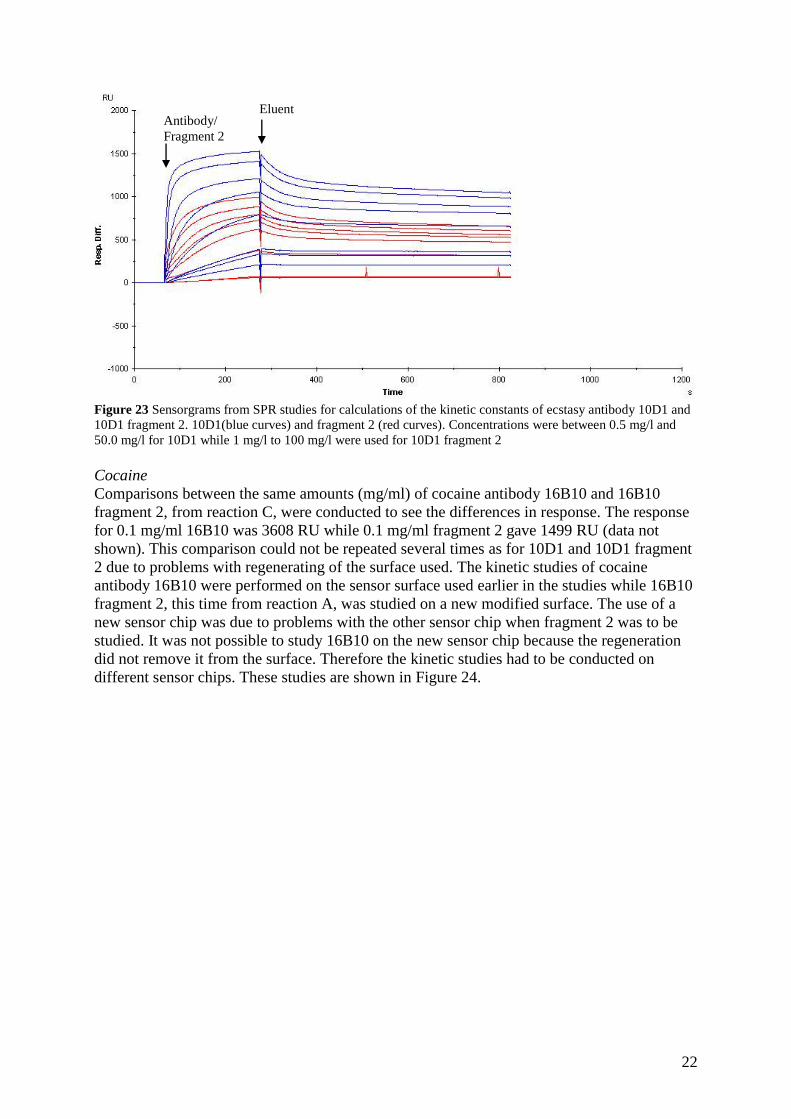
Comparisons between the same amount of ecstasy antibody 10D1 and 10D1 fragment 2 were
conducted to see the differences in response. The concentrations of the samples were 0.1
mg/ml for both 10D1 and fragment 2. As seen in Figure 22, 10D1 generates a response of
about 1700 RU while fragment 2 generates 1200 RU.
Figure 22 Sensorgram from SPR studies of ecstasy antibody 10D1 and 10D1 fragment 2. Comparing 0.1 mg/ml
of 10D1 and 10D1 fragment 2. Each sample was injected four times. Ecstasy was injected after 500 s. The
ecstasy concentration was 1 ng/µl for 10D1 and 50 pg/µl for 10D1 fragment 2.
The kinetic studies were carried out with concentrations between 0.5 mg/l and 50.0 mg/l for
10D1 while 1 mg/l to 100 mg/l were used for 10D1 fragment 2 (Figure 23).
Antibody
Ecstasy
Fragment 2
Ecstasy
Antibody/Fragment 2 Eluent
Ecstasy
10D1
Fragment 2
Regeneration
22
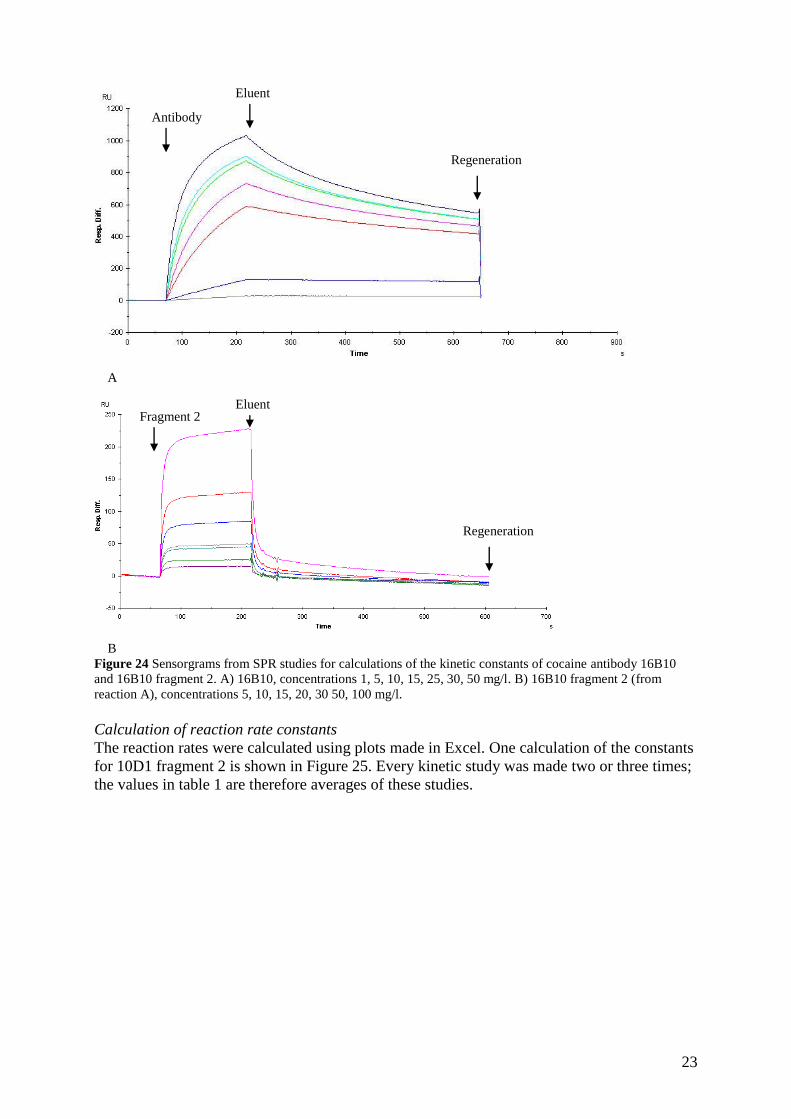
Figure 23 Sensorgrams from SPR studies for calculations of the kinetic constants of ecstasy antibody 10D1 and
10D1 fragment 2. 10D1(blue curves) and fragment 2 (red curves). Concentrations were between 0.5 mg/l and
50.0 mg/l for 10D1 while 1 mg/l to 100 mg/l were used for 10D1 fragment 2
Cocaine
Comparisons between the same amounts (mg/ml) of cocaine antibody 16B10 and 16B10
fragment 2, from reaction C, were conducted to see the differences in response. The response
for 0.1 mg/ml 16B10 was 3608 RU while 0.1 mg/ml fragment 2 gave 1499 RU (data not
shown). This comparison could not be repeated several times as for 10D1 and 10D1 fragment
2 due to problems with regenerating of the surface used. The kinetic studies of cocaine
antibody 16B10 were performed on the sensor surface used earlier in the studies while 16B10
fragment 2, this time from reaction A, was studied on a new modified surface. The use of a
new sensor chip was due to problems with the other sensor chip when fragment 2 was to be
studied. It was not possible to study 16B10 on the new sensor chip because the regeneration
did not remove it from the surface. Therefore the kinetic studies had to be conducted on
different sensor chips. These studies are shown in Figure 24.
Antibody/
Fragment 2
Eluent
23
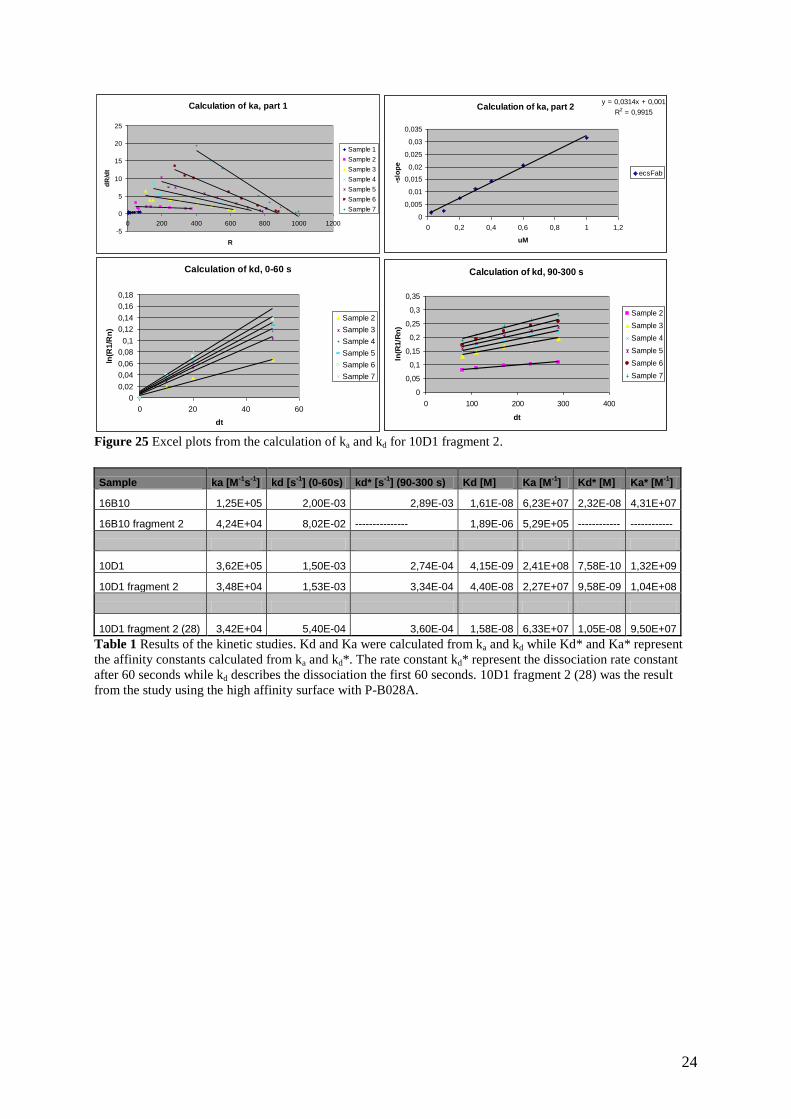
A
B
Figure 24 Sensorgrams from SPR studies for calculations of the kinetic constants of cocaine antibody 16B10
and 16B10 fragment 2. A) 16B10, concentrations 1, 5, 10, 15, 25, 30, 50 mg/l. B) 16B10 fragment 2 (from
reaction A), concentrations 5, 10, 15, 20, 30 50, 100 mg/l.
Calculation of reaction rate constants
The reaction rates were calculated using plots made in Excel. One calculation of the constants
for 10D1 fragment 2 is shown in Figure 25. Every kinetic study was made two or three times;
the values in table 1 are therefore averages of these studies.
Antibody
Eluent
Regeneration
Fragment 2 Eluent
Regeneration
24
Calculation of ka, part 1
-5
0
5
10
15
20
25
0 200 400 600 800 1000 1200
R
dR
/dt
Sample 1
Sample 2
Sample 3
Sample 4
Sample 5
Sample 6
Sample 7
Calculation of ka, part 2y = 0,0314x + 0,001
R2 = 0,9915
0
0,005
0,01
0,015
0,02
0,025
0,03
0,035
0 0,2 0,4 0,6 0,8 1 1,2
uM
-slo
pe
ecsFab
Calculation of kd, 0-60 s
0
0,02
0,04
0,06
0,08
0,1
0,12
0,14
0,16
0,18
0 20 40 60
dt
ln(R
1/R
n)
Sample 2
Sample 3
Sample 4
Sample 5
Sample 6
Sample 7
Calculation of kd, 90-300 s
0
0,05
0,1
0,15
0,2
0,25
0,3
0,35
0 100 200 300 400
dt
ln(R
1/R
n)
Sample 2
Sample 3
Sample 4
Sample 5
Sample 6
Sample 7
Figure 25 Excel plots from the calculation of ka and kd for 10D1 fragment 2.
Sample ka [M-1s
-1] kd [s
-1] (0-60s) kd* [s
-1] (90-300 s) Kd [M] Ka [M
-1] Kd* [M] Ka* [M
-1]
16B10 1,25E+05 2,00E-03 2,89E-03 1,61E-08 6,23E+07 2,32E-08 4,31E+07
16B10 fragment 2 4,24E+04 8,02E-02 --------------- 1,89E-06 5,29E+05 ------------ ------------
10D1 3,62E+05 1,50E-03 2,74E-04 4,15E-09 2,41E+08 7,58E-10 1,32E+09
10D1 fragment 2 3,48E+04 1,53E-03 3,34E-04 4,40E-08 2,27E+07 9,58E-09 1,04E+08
10D1 fragment 2 (28) 3,42E+04 5,40E-04 3,60E-04 1,58E-08 6,33E+07 1,05E-08 9,50E+07
Table 1 Results of the kinetic studies. Kd and Ka were calculated from ka and kd while Kd* and Ka* represent
the affinity constants calculated from ka and kd*. The rate constant kd* represent the dissociation rate constant
after 60 seconds while kd describes the dissociation the first 60 seconds. 10D1 fragment 2 (28) was the result
from the study using the high affinity surface with P-B028A.
25
Discussion Though all questions of this project could not be answered, some interesting results and
observations can be discussed.
SPR analysis
To be able to do some deeper studies of the chemistry at the sensor surface it was important to
make the BIOSENS chemistry work in the SPR system. The starting studies and test of the
implementation of BIOSENS into Biacore 2000 indicated good results. The antibodies
adhered to the modified sensor surfaces in amounts which corresponded well to the amounts
that can be seen in BIOSENS. An increase in antibody concentration also resulted in an
increased response. The results were further more reproducible when injecting samples with
the same concentration in shorter time frames. Identical samples tested during the same
analysis stage gave the same results indicating fully regenerated surfaces, therefore
comparisons of the reactions of different samples with these surfaces were meaningful.
Studies of antibodies with Biacore are of course nothing new, it is rather a standard method.
Due to the importance of the balance between the surface and the antibodies, which makes it
possible to detect the target molecules, it was however important to verify that the system
could be studied in another environment. When injecting cocaine or ecstasy a decrease in
response was seen indicating that the drug sensor worked. There was one problem with the
16B10 batch, though. It was not so easy to remove from the surface as it should have been.
This was confirmed by Ann-Charlotte Hellgren at Biosensor Applications AB (private
communication). The batch used in the comparative studies was therefore another one. There
were also some problems with the evaluation software, BIAevaluation 3.2, used for kinetic
calculations. The main reason for this is the fact that when one makes kinetic studies one
should have a low ligand concentration to avoid detrimental mass transfer effects and a high
flow rate to inhibit rebinding. These two experimental setups had to be ignored to simulate
BIOSENS. Another fact is that the model for bivalent analyte in BIAevaluation 3.2 is not
good enough [9]
. One further deviation from the model was that the ligand was not
homogenous. Therefore, a model with bivalent analyte, heterogeneous ligand and mass
transfer correction should have been used. Such a model does however, not exist in
BIAevaluation 3.2. So to be able to make some kind of kinetic calculations, which also should
work for the fragments so that a comparison could be made, Excel plots were used.
Fragmentation of antibodies
The two antibodies used, cocaine antibody 16B10 and ecstasy antibody 10D1, were meant to
be fragmented with two different methods (reductively cleaved and papain cleaved) to give
different types of fragments. The fragmentation using 2-MEA did not work out as well as
expected, no significant amount of reductively cleaved antibodies could be obtained. Different
procedures were tested but no condition was successful. These results were confirmed by
studies performed by Lars Eng at Biosensor Applications AB (private communication). The
reason why this procedure did not work might be due to structures of the antibodies hiding the
disulfide bridges from the reducing agent. It can also be due to the amount of disulfide bridges
which vary between different subclasses of IgG [1]
. The more disulfide bridges the harder the
separation. Another possible explanation is that the capping procedure did not work so the
cleaved antibodies reattached to one another. This method was therefore dropped and all
further studies were done with fragments from the papain digestion. The papain fragmentation
worked well, fragmenting both antibodies, but was rather hard to interpret in the beginning.
26
The first thing was the interpretation of the chromatogram from the analysis of the papain
fragmentation of 16B10. It seemed to leave behind intact antibodies, suggesting that the
reaction time used might be too short or the papain concentration too low. The analysis with
SDS-PAGE later showed that the reaction mixture actually contained a fragment of 50 kDa. It
is a bit strange that the fragment elutes at this time though. All isolated fragments from the
papain fragmentation indicated sizes of about 25 kDa when analysed with non-reducing SDS-
PAGE. These fragments are probably not 25 kDa, but 50 kDa fragments. This phenomenon
that the IgG fragments from papain fragmentation looks like 25 kDa when studied with non-
reducing SDS-PAGE are shown in other studies[8]
. These results of the SDS-PAGE analyses
are not unexpected when considerate the use of non-reducing sample preparation which gives
a very approximately weight measurement. The isolation step with SEC resulted in a pure
product but at low yield. No good explanation for the low yield could be found.
Comparison of bi- and monovalent antibodies
The QCM studies showed that 16B10 fragment 1 and 10D1 fragment 1 did not bind their
respective surfaces, cocaine and ecstasy. The isolated fragments 16B10 fragment 2 and 10D1
fragment 2 resulted in adhesion to their surfaces, cocaine respectively ecstasy. This indicated
that these isolates at least contained the Fab fragment. But if they contained only Fab or also
the Fc fragment was not proven. One theory is that fragment 2 from both antibodies is pure
Fab while fragment 1 represents the Fc fragment. The observation that fragment 1, from both
antibodies, is of 50 kDa but without the ability to bind the surface points to this. Other results
that confirm this is that fragment 2 retain surface binding ability and seems to contain just one
type of fragment. The peaks generated in the LC analyses by fragment 1 and fragment 2
represent the same amount of protein as the antibody before fragmentation. Also the
observation from the LC chromatograms that the peak of 16B10 fragment 2 represent twice
the amount of protein as 16B10 fragment 1 point in this direction. When the responses of
16B10 fragment 2 and 10D1 fragment 2 were compared to intact antibodies it could clearly be
seen that the response was significantly smaller when using fragments. It was hard to tell
whether this was only because the fragments were smaller or if there was another explanation
too. What can be said though is that the fragments seemed to release to a certain amount from
the surface quicker than antibodies. This observation was the same for both 10D1 fragment 2
and 16B10 fragment 2. The antibody 10D1 had this behaviour to but not as much as for the
fragment while there was no release for 16B10. This implies that the fragments lost some
affinity. The fragment 16B10 fragment 2 from reaction C did not respond to cocaine while
fragment 2 from reaction A dissociated too fast to be exposed to cocaine. Antibody 10D1
fragment 2 responded well to 50 pg/µl antigen indicating a potential to work in the
displacement immunoassay.
All sensor surfaces used under the studies with Biacore successively lost their ability to bind
antibodies. This made it very important to do the comparing studies during the same period
otherwise the conditions would have been too different. All conclusions from the study are
therefore based on comparisons of antibodies and fragments studied at the same time.
The use of SPR was advantageous because it could confirm and explain some observations
from the QCM studies. Kinetic studies were performed to calculate the reaction rate constants
to determine the differences between antibodies and fragments. The problem with the kinetic
studies was, as mentioned before, that a low ligand concentration should be used and at a
rather fast flow. Neither of this was followed in this study due to the interest of studying the
system with parameters as close as possible to BIOSENS. The flow rate used in SPR, 10
27
µl/min, is however higher than the flow in the BIOSENS cells if the flow cell volumes are
compared. An interesting observation common for all studies is the different phases during
dissociation. The first minute seemed to be characterised by one rate constant while there was
another rate constant after one minute. In the results of the present study are these different
dissociation constant are named kd and kd*. The reason for the different phases is probably
that the immobilized antigen is inhomogeneous. In the case of antibodies one can also expect
a variation in dissociation rates depending on whether only one or both binding sites has
bound to the surface antigens. To be able to compare the parameters of the antibodies and the
fragments, both were described the same way. The main difference between 16B10 and
16B10 fragment 2 was the dissociation rate constant that shows that fragment 2 dissociates 40
times faster than 16B10 while the association rate for 16B10 was only 3 times faster than for
fragment 2. This should be considered with the knowledge of the differences between the
surfaces that were used. The surface used for 16B10 fragment 2 seemed to have a higher
affinity due to the fact that it was not possible to remove 16B10 from it. When comparing the
kinetics for 10D1 and 10D1 fragment 2, the association rate for 10D1 was 10 times faster.
The dissociation rate was almost the same in both time frames. When using the high affinity
surface for 10D1 fragment 2 studies the difference that could be seen was the dissociation rate
during the first minute of dissociation. It was a bit slower but the association rate was the
same as before. The results in this study can be compared with other studies of retained
affinity for antigen when fragmented but the results are very different from study to study
showing from 4 to 300-fold lower affinity for Fab than for IgG [10][11][12]
. The fragment 10D1
fragment 2 showed good response to ecstasy when studied with QCM. The response was
however smaller than for 10D1. This can also be seen in the studies with Biacore. The
response to 50 pg/µl was distinct when the surfaces were activated with 0.1 mg/ml 10D1
fragment 2. The tests performed with ecstasy during the kinetics studies also implied a
response to it even though the ecstasy was injected after almost 10 minutes. Antibody 10D1
and 10D1 fragment 2 has almost the same percentage decrease at this point. These results
suggest that 10D1 fragment 2 works well in the displacement immunoassay. It is hard to tell
from this study though whether or not the fragment is better or worse than 10D1. Another
property of the fragments that should be considered is the stability. How stable are the
fragments of an antibody?
An interesting observation was the difference between 16B10 fragment 2 obtained from
reaction A and reaction C. It seems like the fragment from reaction C attached better than the
fragment from reaction A. Due to problems with Biacore when trying to study fragment 2
from reaction C no kinetics for this one could be calculated but some results from QCM and
tests on Biacore exist. The first study of 16B10 fragment 2 with QCM was with fragments
from reaction C. The dissociation started immediately after injection but it was observed that
a considerable amount remained on the surface. When later performing new tests where
fragment 2 from reaction A was used, almost nothing remained at the surface. One difference
between the studies was that the concentrations were different between them. In the first 0.2
mg/ml and in the second 0.1 mg/ml was used respectively. This observation was also noticed
in the Biacore studies but also here two different concentrations had been used. It is therefore
difficult to tell whether there is a difference between the two fragments. It does imply though
that either a long exposure time to the reaction buffer or the use of iodoacetamide affects the
binding site. The fragments from reaction A were not separated from the reaction buffer
immediately and the sample was treated with iodoacetamide while reaction C was isolated
immediately without exposure to iodoacetamid. The reactions were otherwise almost the
same. This would also imply that 16B10 fragment 2, when treated as in reaction C, could
work better than that isolated from reaction A.
28
Conclusion From the results of this study the conclusion can be drawn that it is possible to fragment 10D1
into Fab fragments and use these in a displacement immunoassay with retained response to
ecstasy and with the ability to bind to the sensor surface but with a lower affinity than for the
antibodies. Fragmentation of 16B10 with papain works well but if the produced Fab works in
the displacement system is a bit clouded. Due to the amount of time for this project, the
question whether or not the use of fragments enhances the properties of the displacement
reaction could not be answered. It is clear though that a one to one interaction is to prefer to
avoid rebinding. It is also clear that the non specific binding of the Fc region is negative but if
avoiding those properties compensates the loss of mass is not obvious. The study has also
concluded that it is not possible to cleave neither 16B10 nor 10D1 with 2-MEA under the
conditions and with the method used in this project.
Due to the intricate balance between the necessity to bind the antibodies to the surface and the
wish to have a binding weak enough to allow dissociate when the drug enters the system, it is
not wrong to expect that changes of the antibodies in both size and valency alter this balance
requiring new conditions for optimal detection.
29
Acknowledgments I would like to thank my supervisor Lars Eng at Biosensor Applications and Karin Caldwell at
the Department of Surface Biotechnology at Uppsala University. I would also like to thank
Per Månsson, Ann-Charlotte Hellgren and everyone at Biosensor Applications. It was a real
pleasure to work with you all. Last but not least I would like to thank the Department of
Surface Biotechnology at Uppsala University.
30
References
[1] Boenisch, T. “Antibodies“. http://www.dakousa.com/ishbantibodies.pdf (27 Mar. 2006).
[2] Pierce, “Antibody Fragmentation (Overview)”.
http://www.piercenet.com/files/1601323%20Antibodies_2.pdf (09 Dec. 2006).
[3] Q-sense, http://www.q-sense.com/viewArticle.asp?ID=32 (29 Oct. 2006).
[4] Biacore,
http://www.biacore.se/lifesciences/technology/introduction/following_interaction/Detecting_i
nteractions_in_real_time/index.html?backurl=%2Flifesciences%2Ftechnology%2Fintroductio
n%2Ffollowing_interaction%2Findex.html (26 Oct. 2006).
[5] Sigma product information, EZBlue gel staining reagent.
http://www.sigmaaldrich.com/sigma/datasheet/g1041dat.pdf (09 Dec. 2006).
[6] Pierce instructions 20408, 2-Mercaptoethylamine·HCl.
http://www.piercenet.com/files/0131dh4.pdf (09 Dec. 2006).
[7] Pierce instructions 20341, Immobilized Papain.
http://www.piercenet.com/files/0107as4.pdf (09 Dec. 2006).
[8] Crasswell, C., Newcombe A. R., Davies, S., Mcpherson, I. Nelson, P., O’Donovan, K. and
Francis, R. (2005). Optimal conditions for the papain digestion of polyclonal ovine IgG for
production of biotherapeutic Fab fragments. Biotechnol. Appl. Biochem: 42, 163-168.
[9] BIAevaluation Software Handbook version 3. Edition November 1999 (Version AD),
Biacore AB.
[10] Pericleous L.M., Richards J., Epenetos A. A., Courtenay-Luck N. and Deonarian M. P.
(2005). Characterisation and internalisation of recombinant humanised HMFG-I antibodies
against MUCI. British Journal of Cancer: 93, 1257-1266.
[11] Brinkmann U., Webber K., Di Carlo A., Beers R., Chowdhury P., Chang K., Chaudhary
V., Gallo M. and Pastan I. (1997). Cloning and expression of recombinant Fab fragment of
monoclonal antibody K1 that reacts with mesothelin present on mesotheliomas and ovarian
cancers. Int. J. Cancer:71, 638-644.
[12] Henderikx P. Coolen-van Neer N., Jacobs A., van der Linden E., Arends J-W., Müllberg
J. And Hoogenboom H. R. (2002). A human immunoglobulin G1 antibody originating from
an in vitro-selected Fab phage antibody binds avidly to tumor-associated MUCI and is
efficiently internalized. American Journal of Pathology: vol 160, nr 5.
[13] Biacore laboratory theory, Biosensor Course Uppsala University (03 Mar. 2006).
31
Appendix 1: Kinetics
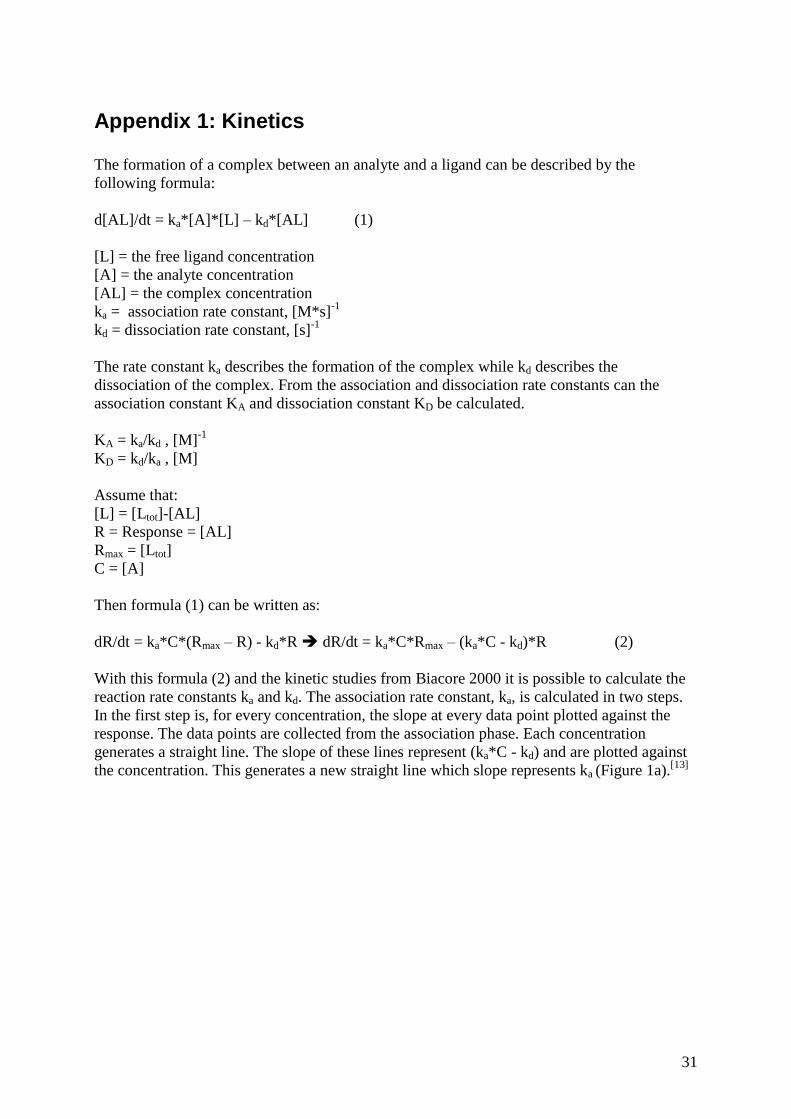
The formation of a complex between an analyte and a ligand can be described by the
following formula:
d[AL]/dt = ka*[A]*[L] – kd*[AL] (1)
[L] = the free ligand concentration
[A] = the analyte concentration
[AL] = the complex concentration
ka = association rate constant, [M*s]-1
kd = dissociation rate constant, [s]-1
The rate constant ka describes the formation of the complex while kd describes the
dissociation of the complex. From the association and dissociation rate constants can the
association constant KA and dissociation constant KD be calculated.
KA = ka/kd , [M]-1
KD = kd/ka , [M]
Assume that:
[L] = [Ltot]-[AL]
R = Response = [AL]
Rmax = [Ltot]
C = [A]
Then formula (1) can be written as:
dR/dt = ka*C*(Rmax – R) - kd*R dR/dt = ka*C*Rmax – (ka*C - kd)*R (2)
With this formula (2) and the kinetic studies from Biacore 2000 it is possible to calculate the
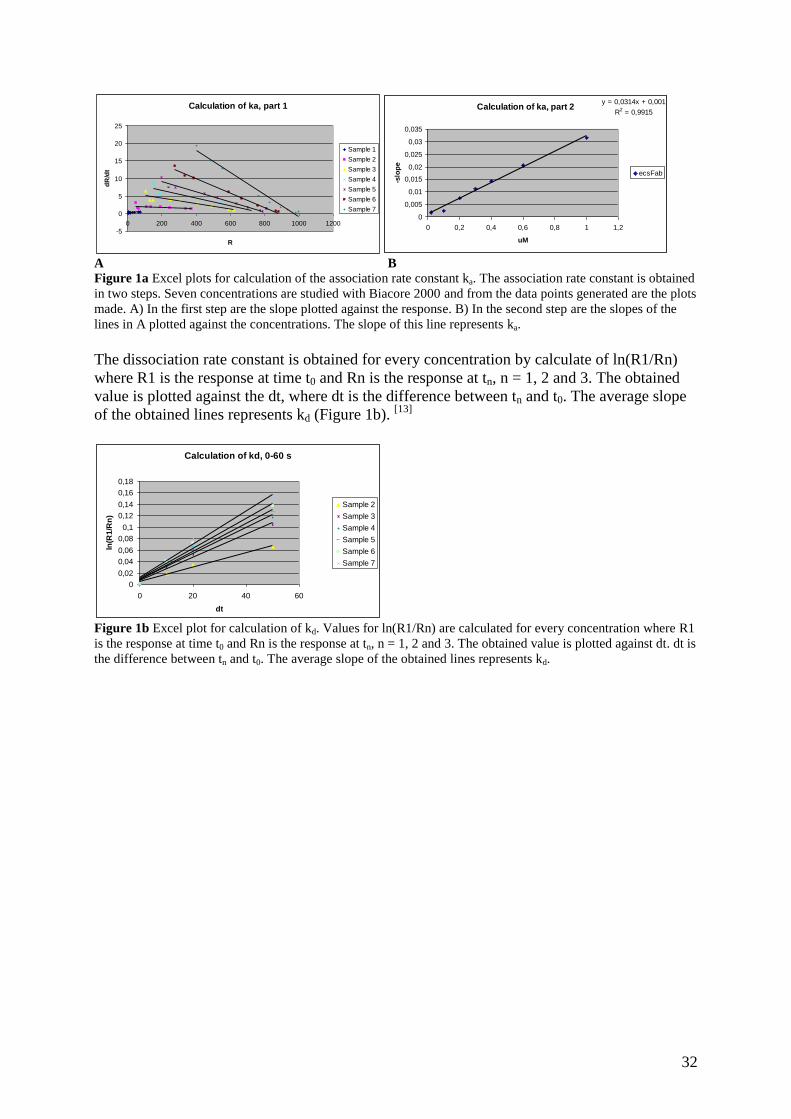
reaction rate constants ka and kd. The association rate constant, ka, is calculated in two steps.
In the first step is, for every concentration, the slope at every data point plotted against the
response. The data points are collected from the association phase. Each concentration
generates a straight line. The slope of these lines represent (ka*C - kd) and are plotted against
the concentration. This generates a new straight line which slope represents ka (Figure 1a).[13]
32
Calculation of ka, part 1
-5
0
5
10
15
20
25
0 200 400 600 800 1000 1200
R
dR
/dt
Sample 1
Sample 2
Sample 3
Sample 4
Sample 5
Sample 6
Sample 7
Calculation of ka, part 2y = 0,0314x + 0,001
R2 = 0,9915
0
0,005
0,01
0,015
0,02
0,025
0,03
0,035
0 0,2 0,4 0,6 0,8 1 1,2
uM
-slo
pe
ecsFab
A B
Figure 1a Excel plots for calculation of the association rate constant ka. The association rate constant is obtained
in two steps. Seven concentrations are studied with Biacore 2000 and from the data points generated are the plots
made. A) In the first step are the slope plotted against the response. B) In the second step are the slopes of the
lines in A plotted against the concentrations. The slope of this line represents ka.
The dissociation rate constant is obtained for every concentration by calculate of ln(R1/Rn)
where R1 is the response at time t0 and Rn is the response at tn, n = 1, 2 and 3. The obtained
value is plotted against the dt, where dt is the difference between tn and t0. The average slope
of the obtained lines represents kd (Figure 1b). [13]
Calculation of kd, 0-60 s
0
0,02
0,04
0,06
0,08
0,1
0,12
0,14
0,16
0,18
0 20 40 60
dt
ln(R
1/R
n)
Sample 2
Sample 3
Sample 4
Sample 5
Sample 6
Sample 7
Figure 1b Excel plot for calculation of kd. Values for ln(R1/Rn) are calculated for every concentration where R1
is the response at time t0 and Rn is the response at tn, n = 1, 2 and 3. The obtained value is plotted against dt. dt is
the difference between tn and t0. The average slope of the obtained lines represents kd.