Development of rapid dipstick tests for detection of...
34
UPTEC X 06 017 ISSN 1401-2138 APR 2006 JAN TROENG Development of rapid dipstick tests for detection of foot and mouth disease virus Master’s degree project
-
Upload
nguyenminh -
Category
Documents
-
view
216 -
download
0
Transcript of Development of rapid dipstick tests for detection of...

UPTEC X 06 017 ISSN 1401-2138 APR 2006
JAN TROENG
Development of rapid dipstick tests for detection of foot and mouth disease virus
Master’s degree project
Molecular Biotechnology Programme Uppsala University School of Engineering
UPTEC X 06 017 Date of issue 2006-04 Author
Jan Troeng Title (English)
Development of rapid dipstick tests for detection of foot and mouth disease virus
Title (Swedish) Abstract Foot and mouth disease virus (FMDV) is one of the most contagious animal diseases and there is a big need for rapid and accurate test methods. Four different monoclonal antibodies (mAbs) were used in a lateral chromatographic system to detect FMDV. The mAbs were immobilized on a nitrocellulose membrane, where test samples and mAb-detector particle complexes were added to analyse the mAb binding capacity. Positive samples showed a visual line due to the significant colour of the detector particle (colloidal gold or latex microspheres). The system does recognize four of the seven FMDV serotypes and the results were in agreement with both enzyme-linked immunosorbent assay (ELISA) and proximity ligation assay (PLA) experiments.
Keywords FMDV, lateral chromatography, rapid dipstick tests, mAbs
Supervisors Katarina Persson Svanova Biotech AB
Scientific reviewer
Malik Merza Svanova Biotech AB
Project name
Sponsors
Language English
Security
ISSN 1401-2138
Classification
Supplementary bibliographical information Pages 34
Biology Education Centre Biomedical Center Husargatan 3 Uppsala Box 592 S-75124 Uppsala Tel +46 (0)18 4710000 Fax +46 (0)18 555217
Development of rapid dipstick tests for detection of foot and mouth disease virus
Jan Troeng
Sammanfattning
Mul- och klövsjuka är en mycket smittsam djursjukdom som kan drabba alla klövbärande djur. Den kan förutom lidandet för djuren också ge stora ekonomiska konsekvenser eftersom den kraftigt nedsätter livsmedelsproduktionen hos t ex boskap. Med tanke på dessa faktorer är det därför mycket viktigt att snabbt kunna diagnostisera sjukdomen för att på ett så tidigt stadium som möjligt förhindra smittspridning. Prover från misstänkt smittade djur analyseras vanligtvis på laboratorier, men i och med så kallade snabbtester finns det möjlighter att få ett provsvar redan inom 5-10 minuter. Dessa tester bygger på lateralkromatografi, är enkla att utföra och kan göras av en veterinär på plats. Själva testsystemet består av en plaststicka (cirka 7 x 2 centimeter) innehållande ett membran som har immobiliserats med antikroppar riktade mot mul- och klövsjukeviruset. Provet blandas med antikroppar kopplade till en detektorpartikel och sätts sedan till membranet. Om provet innehåller virus kommer antikropparna som finns i provblandningen att binda till viruspartiklarna. Dessutom kommer de antikroppar som finns fastsatta på membranet att binda till viruset, vilket innebär att ett komplex med antikropp, virus och antikropp-detektorpartikel kommer att bildas i händelse av ett positivt prov. Det blir synligt i och med detektorpartiklarnas signifikanta färg och därmed går det att avgöra om ett prov är positivt eller negativt. Syftet med det här projektet är att utveckla en prototyp till ett snabbtest för mul- och klövsjuka. Resultat och iakttagelser av testsystemet ska kunna ligga till grund för en vidare utveckling av produkten.
Examensarbete 20 p i Molekylär bioteknikprogrammet
Uppsala Universitet april 2006

4
TABLE OF CONTENTS
1 INTRODUCTION................................................................................................................................................. 5 1.1 FOOT AND MOUTH DISEASE ...................................................................................................................... 5 1.2 MONOCLONAL ANTIBODIES...................................................................................................................... 5 1.3 PICORNAVIRUSES ..................................................................................................................................... 6 1.4 VIRUS SEROTYPES .................................................................................................................................... 7 1.5 VIRUS STRUCTURE ................................................................................................................................... 8
1.5.1 Antigenic mapping .......................................................................................................................... 9 2 THE LATERAL CHROMATOGRAPHIC SYSTEM..................................................................................... 10
2.1 THE NEED OF RAPID TEST METHODS ....................................................................................................... 10 2.2 RAPID DIPSTICK TESTS ........................................................................................................................... 11 2.3 LATERAL CHROMATOGRAPHY................................................................................................................ 11
2.3.1 Sample pad ................................................................................................................................... 12 2.3.2 Conjugate pad............................................................................................................................... 12 2.3.3 Membrane..................................................................................................................................... 12 2.3.4 Conjugate...................................................................................................................................... 13
3 AIM OF THE PROJECT................................................................................................................................... 15 3.1 PROJECT GOALS ..................................................................................................................................... 15
4 MATERIALS AND METHODS ....................................................................................................................... 15 4.1 TEST SAMPLES........................................................................................................................................ 15 4.2 PURIFICATION AND CHARACTERIZATION OF ANTIBODY ......................................................................... 15
4.2.1 Verification of antibody product................................................................................................... 16 4.2.2 Immunoglobulin class verification................................................................................................ 16 4.2.3 Isoelectric focusing....................................................................................................................... 16
4.3 LATERAL FLOW DEVICES........................................................................................................................ 16 4.3.1 Latex coupling .............................................................................................................................. 17 4.3.2 Colloidal gold coupling ................................................................................................................ 17 4.3.3 Conjugate application................................................................................................................... 17 4.3.4 Membrane immobilization ............................................................................................................ 18 4.3.5 Lateral flow device construction and testing ................................................................................ 18 4.3.6 Stability tests................................................................................................................................. 19 4.3.7 Tests with live viruses ................................................................................................................... 19
4.4 ELISA ................................................................................................................................................... 19 4.5 PROXIMITY LIGATION ASSAY ................................................................................................................ 20
5 RESULTS ............................................................................................................................................................ 20 5.1 ANTIBODY PURIFICATION AND CHARACTERIZATION .............................................................................. 20
5.1.1 Verification of antibody product................................................................................................... 21 5.1.2 Immunoglobulin class verification................................................................................................ 21 5.1.3 Isoelectric focusing....................................................................................................................... 21
5.2 LATERAL FLOW DEVICES........................................................................................................................ 22 5.2.1 Latex conjugate devices ................................................................................................................ 22 5.2.2 Gold conjugate devices................................................................................................................. 24 5.2.3 Stability tests................................................................................................................................. 24 5.2.4 Tests with live viruses ................................................................................................................... 24
5.3 ELISA ................................................................................................................................................... 26 5.4 PROXIMITY LIGATION ASSAY ................................................................................................................ 27
6 DISCUSSION ...................................................................................................................................................... 27 7 ACKNOWLEDGEMENTS................................................................................................................................ 29 8 REFERENCES.................................................................................................................................................... 30 9 APPENDIX.......................................................................................................................................................... 33
9.1 APPENDIX 1............................................................................................................................................ 33

5
1 Introduction
1.1 Foot and mouth disease Foot and mouth disease virus (FMDV) is a highly contagious disease which infects cloven-hoofed animals as cattle, pigs and sheep, goats, buffalo and various wildlife species. All cloven-hoofed animals can suffer from the disease, but cattle normally get the most obvious symptoms. These are vesicles on feet, tongue and mucous membranes, which often lead to painful blisters, lameness and loss of appetite. Mortality is low but can occur in young animals and this is often due to circulatory failure caused by heart muscle infection [1]. There are several factors which contribute to the risk of an epidemic outbreak. Only a small infectious dose is required for developing the disease. This fact in combination with the short incubation period and the viral diversity makes it difficult to control. Moreover, the virus has a wide host range including all domestic and wild cloven-hoofed animals. The virus can be airborne and there are three major transmission routes: oral, transepithelial and inhalation [2]. Vaccination is possible and is used in South America, Africa and Asia, but is not permitted in Europe [3]. There is an ongoing discussion whether vaccination would be used in Europe or not; reasons contradicting vaccination is that the virus is highly mutable, resulting in a possibly non-working vaccine if the animal is infected with a mutated strain. Besides this, problems to distinguish infected from vaccinated animals may arise [3], and vaccination demands a very accurate surveillance both in the region where animals are infected or vaccinated and in the areas around. To avoid these problems and still have the advantages of a vaccine, the use of a DNA vaccine may be the future solution. As earlier mentioned, mortality is low, but there is an obvious loss of yield in animals which have once suffered from FMDV. The milk production decreases and pregnant animals which were previously exposed to the virus often abort. Even when an animal has recovered, the virus can remain for up to two years and possibly infect other animals. All together, since a lot of the animals exposed to FMDV are raised for food or other products, an outbreak may lead to large economic consequences since countries with ongoing epidemics often are submitted to trade restrictions [4]. Therefore the control of the disease is of high importance. Today FMDV is endemic in parts of Africa, Asia and South America, and in many of these places the disease is uncontrollable. Europe has, at the moment, no ongoing outbreaks, but in the last big outbreak in Great Britain 2001, more than 4 million animals were slaughtered [1]. For such a world-spread and contagious disease, the controlling and follow-up is crucial. Routine diagnosis is carried out at the OIE/FAO World Reference Laboratory for Foot-and-Mouth Disease in Pirbright, United Kingdom [5]. Since FMDV can not be differentiated clinically from other similar diseases as swine vesicular disease, vesicular exanthema and vesicular stomatitis, the use of laboratory methods are very important. Basic techniques used for diagnosing FMDV are complement fixation (CF), PCR tests and enzyme-linked immunosorbent assay (ELISA). Nowadays, ELISA and reverse transcriptase PCR (RT-PCR) are the most common methods due to their high specificity and sensitivity. However, in some cases it is necessary to find more rapid methods to get quicker diagnosis.
1.2 Monoclonal antibodies Antibodies are produced from B-cell clones. There are five different classes of antibodies, or immunoglobulins: IgA, IgD, IgE, IgG and IgM. IgG consists of four subunits, which are two identical light chains and the two identical heavy chains. The light chains have been found to
6
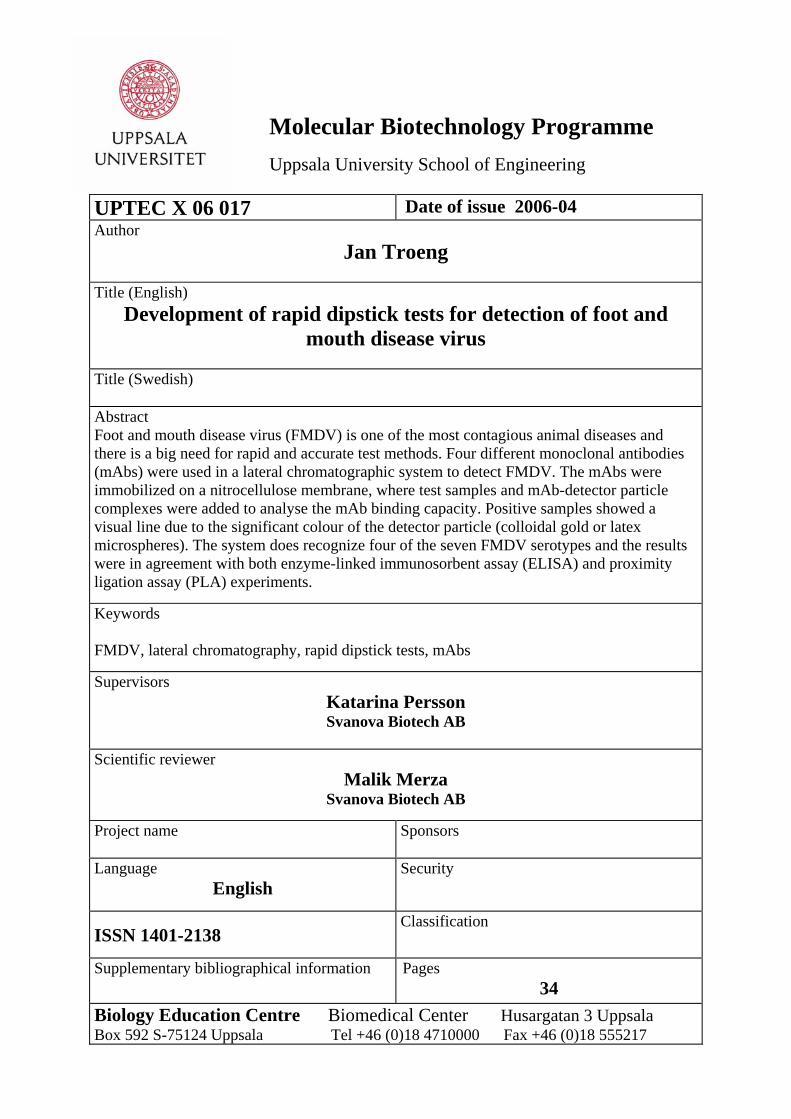
Figure 1. Simplified drawing of an IgG molecule with heavy chains, light chains, variable regions (V) and constant regions (C). Disulfide bonds are marked with dotted lines.
exist in two different types called γ and κ, but there is only one type present in one IgG molecule. Immunoglobulins are held together by disulfide bonds and each immunoglobulin has two antigen binding sites, called Fabs, including one constant region (C) and one variable region (V), where the variable region makes out the extreme diversity of an antibody. Typical for the IgG class are the intrachain disulfide bonds, present in both the light and the heavy chains and found in no other immunoglobulin class. In the Fab fragments, these bonds link together the constant and the variable regions of the antibody. The class of IgG includes four subclasses named IgG 1-4 with few differences in the heavy chain structure [6]. IgG is a very important molecule in the immune defense system, and is normally the most abundant immunoglobulin in cattle sera with approximately 14 mg/ml [7]. The molecular weight of IgG is 146 kDa and it comprises about 660 amino acids: 450 residues in the heavy chain and 212 residues in the light chain. Figure 1 shows a simplified picture of an IgG molecule.
Normally, antibodies arise from many different B-cell clones, each of them having high affinity to a certain epitope of a current antigen. These antibodies are called polyclonal, since they come up from different cells. When an antibody is monoclonal, all antibody-producing cells are identical and descendant from one single cell [8]. A monoclonal antibody recognizes only one single antigenic site, in contrast to the identification of various antigenic sites of polyclonal antibodies. Regarding these facts, using monoclonal antibodies (mAbs) is a very sensitive and specific method to find particular antigens, and even if it was not known until the 1970s, it has already lots of applications in biochemistry experiments [6]. Many biochemical techniques used today employ the advantages of mAbs. In immunotherapy assays,
mAbs can be used either alone or coupled to different molecules. Often these molecules function as markers, giving the possibility to receive a signal and thus detect if binding has occurred. To find antigenic sites within the FMDV virus, the use of mAbs is very effective and important. A mAb which neutralise an antigen directly provides the chance to deactivate the virus, and in an experimental view, raises the possibility to investigate and draw conclusions about certain virus epitopes further [9]. More obvious, the high sensitivity of mAbs is a very powerful tool for neutralising viruses. Another method to map antigenic sites is the use of synthetic peptides, giving the possibility to characterize and neutralise sequential epitopes on the virus. However, this has the disadvantage of only finding linear epitopes and no structural; experiments with mAbs directed against FMDV can give information about both linear and conformation dependent epitopes on the virus [10].
1.3 Picornaviruses The FMDV is an Aphthovirus and belongs to the family Picornaviridae. Other well-known viruses in this family are Polio, rhinoviruses and Hepatitis A virus. The FMDV is about 30 nm in diameter and has a viral genome consisting of single stranded RNA [11]. Production of
7
new virions normally takes about 8 hours for picornaviruses, making it to one of the most rapid reproduction cycles known among viruses [6]. On cellular level, some of the main characteristics of picornaviruses are the generation of intracellular vesicles, disrupted protein transport between the endoplasmic reticulum (ER) and the Golgi apparatus and a swelling of the ER [12].
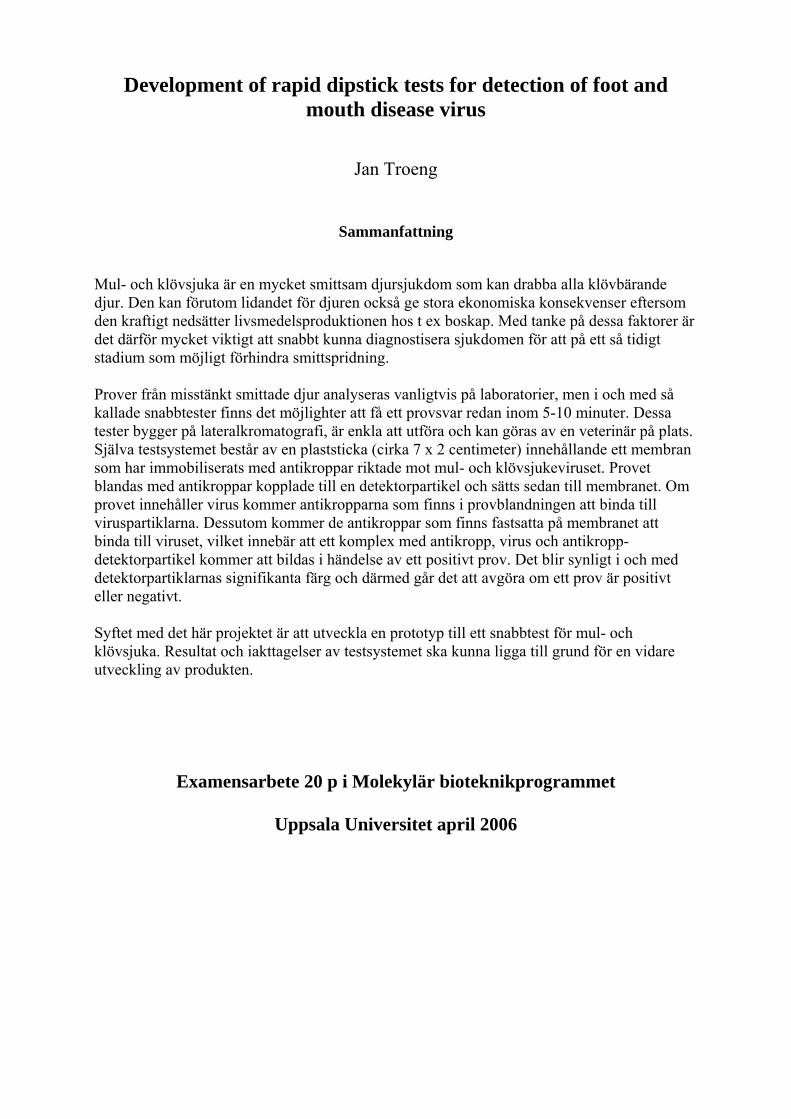
1.4 Virus serotypes FMDV includes seven different serotypes; these are named A, Asia 1, C, O and SAT 1-3, each of them divided into several subclasses with deviations from the original serotype. If there is a genome difference of more than approximately 15%, the genotypes are considered as separate, whereas a 95% conserved sequence is a sign of an epizootical relationship [13]. The homology between two different serotypes can be as low as 25-40% and subclasses within the same serotype normally have more than 60-70% sequence homology [14]. Animals infected with one of these virus serotypes will not confer immunity against the others [15], showing the variability of the different FMDV antigens. The different serotypes have evolved in different parts of the world, explaining names as Asia 1 and SAT (South African Territories). In Africa all the serotypes but Asia 1 are present. O, A and C are spread all over the world and are the most common serotypes of FMDV today [16] (Table 1). Relationships between serotypes are described in Figure 2.
Figure 2. FMDV is an Aphthovirus which belongs to the family Picornaviridae. It comprises seven different serotypes: A, Asia 1, C, O, SAT-1, SAT-2 and SAT-3. Within each serotype there are several subclasses which have deviations from the original serotype.
8
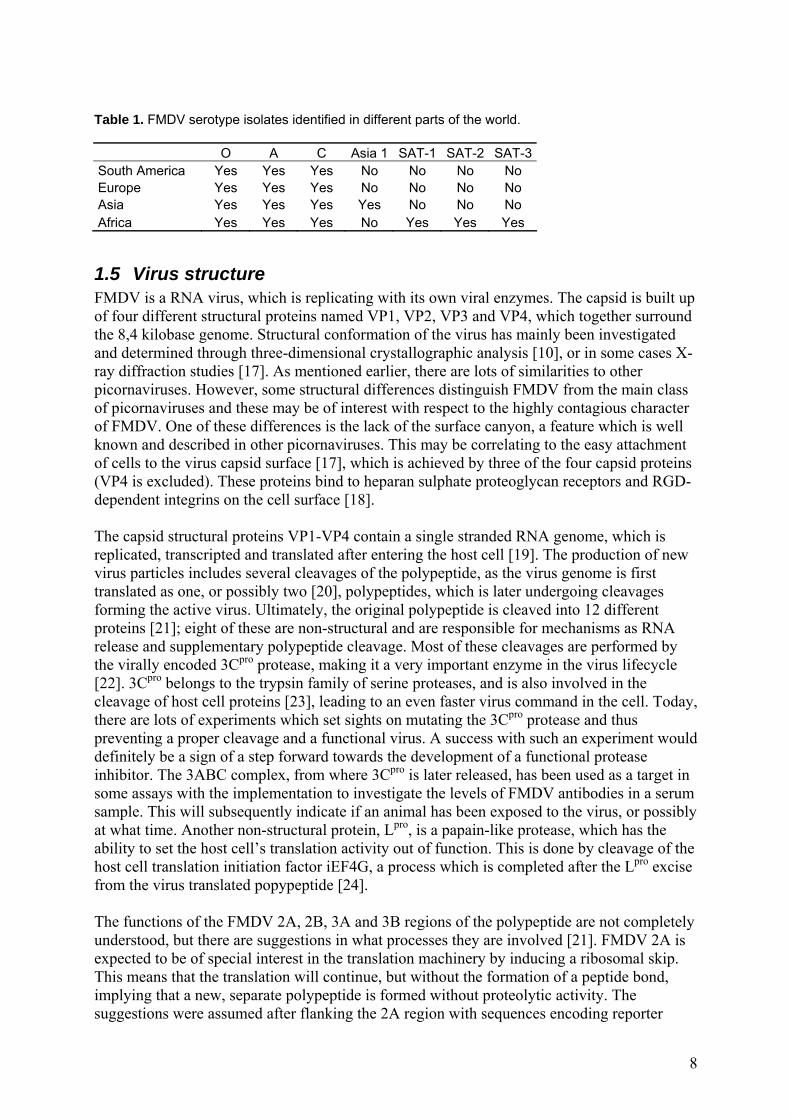
Table 1. FMDV serotype isolates identified in different parts of the world. O A C Asia 1 SAT-1 SAT-2 SAT-3South America Yes Yes Yes No No No No Europe Yes Yes Yes No No No No Asia Yes Yes Yes Yes No No No Africa Yes Yes Yes No Yes Yes Yes
1.5 Virus structure FMDV is a RNA virus, which is replicating with its own viral enzymes. The capsid is built up of four different structural proteins named VP1, VP2, VP3 and VP4, which together surround the 8,4 kilobase genome. Structural conformation of the virus has mainly been investigated and determined through three-dimensional crystallographic analysis [10], or in some cases X-ray diffraction studies [17]. As mentioned earlier, there are lots of similarities to other picornaviruses. However, some structural differences distinguish FMDV from the main class of picornaviruses and these may be of interest with respect to the highly contagious character of FMDV. One of these differences is the lack of the surface canyon, a feature which is well known and described in other picornaviruses. This may be correlating to the easy attachment of cells to the virus capsid surface [17], which is achieved by three of the four capsid proteins (VP4 is excluded). These proteins bind to heparan sulphate proteoglycan receptors and RGD-dependent integrins on the cell surface [18]. The capsid structural proteins VP1-VP4 contain a single stranded RNA genome, which is replicated, transcripted and translated after entering the host cell [19]. The production of new virus particles includes several cleavages of the polypeptide, as the virus genome is first translated as one, or possibly two [20], polypeptides, which is later undergoing cleavages forming the active virus. Ultimately, the original polypeptide is cleaved into 12 different proteins [21]; eight of these are non-structural and are responsible for mechanisms as RNA release and supplementary polypeptide cleavage. Most of these cleavages are performed by the virally encoded 3Cpro protease, making it a very important enzyme in the virus lifecycle [22]. 3Cpro belongs to the trypsin family of serine proteases, and is also involved in the cleavage of host cell proteins [23], leading to an even faster virus command in the cell. Today, there are lots of experiments which set sights on mutating the 3Cpro protease and thus preventing a proper cleavage and a functional virus. A success with such an experiment would definitely be a sign of a step forward towards the development of a functional protease inhibitor. The 3ABC complex, from where 3Cpro is later released, has been used as a target in some assays with the implementation to investigate the levels of FMDV antibodies in a serum sample. This will subsequently indicate if an animal has been exposed to the virus, or possibly at what time. Another non-structural protein, Lpro, is a papain-like protease, which has the ability to set the host cell’s translation activity out of function. This is done by cleavage of the host cell translation initiation factor iEF4G, a process which is completed after the Lpro excise from the virus translated popypeptide [24]. The functions of the FMDV 2A, 2B, 3A and 3B regions of the polypeptide are not completely understood, but there are suggestions in what processes they are involved [21]. FMDV 2A is expected to be of special interest in the translation machinery by inducing a ribosomal skip. This means that the translation will continue, but without the formation of a peptide bond, implying that a new, separate polypeptide is formed without proteolytic activity. The suggestions were assumed after flanking the 2A region with sequences encoding reporter
9
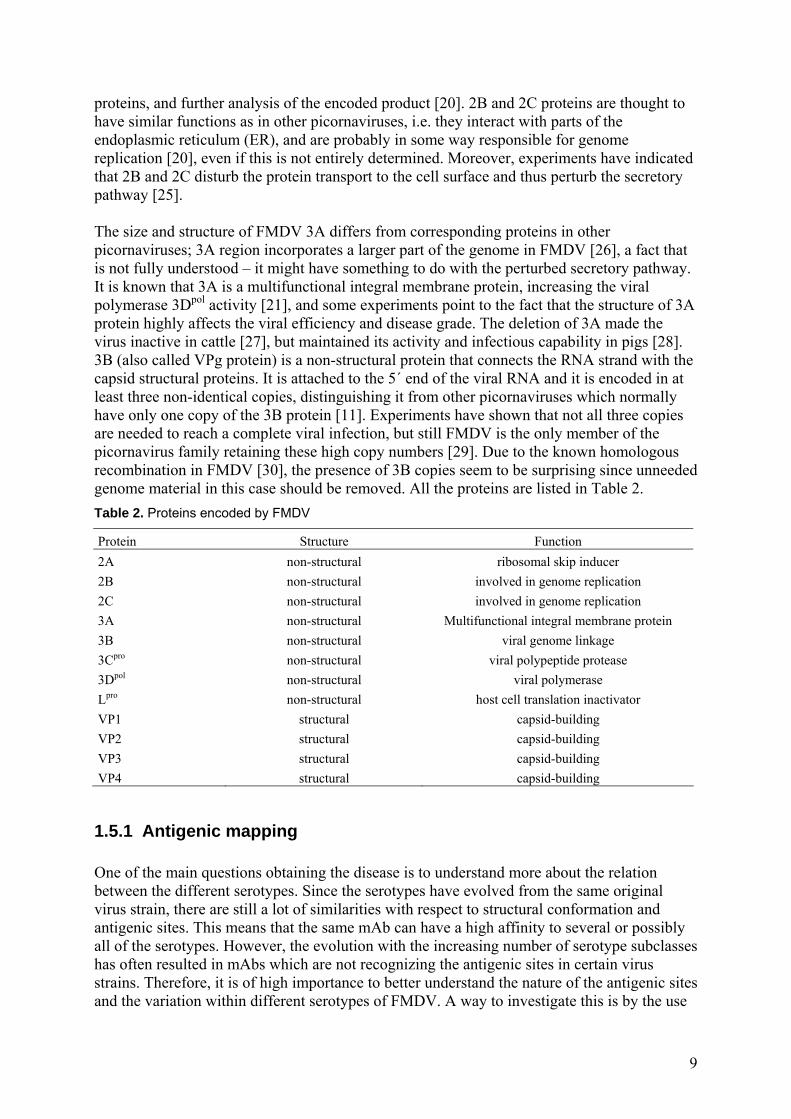
proteins, and further analysis of the encoded product [20]. 2B and 2C proteins are thought to have similar functions as in other picornaviruses, i.e. they interact with parts of the endoplasmic reticulum (ER), and are probably in some way responsible for genome replication [20], even if this is not entirely determined. Moreover, experiments have indicated that 2B and 2C disturb the protein transport to the cell surface and thus perturb the secretory pathway [25]. The size and structure of FMDV 3A differs from corresponding proteins in other picornaviruses; 3A region incorporates a larger part of the genome in FMDV [26], a fact that is not fully understood – it might have something to do with the perturbed secretory pathway. It is known that 3A is a multifunctional integral membrane protein, increasing the viral polymerase 3Dpol activity [21], and some experiments point to the fact that the structure of 3A protein highly affects the viral efficiency and disease grade. The deletion of 3A made the virus inactive in cattle [27], but maintained its activity and infectious capability in pigs [28]. 3B (also called VPg protein) is a non-structural protein that connects the RNA strand with the capsid structural proteins. It is attached to the 5´ end of the viral RNA and it is encoded in at least three non-identical copies, distinguishing it from other picornaviruses which normally have only one copy of the 3B protein [11]. Experiments have shown that not all three copies are needed to reach a complete viral infection, but still FMDV is the only member of the picornavirus family retaining these high copy numbers [29]. Due to the known homologous recombination in FMDV [30], the presence of 3B copies seem to be surprising since unneeded genome material in this case should be removed. All the proteins are listed in Table 2. Table 2. Proteins encoded by FMDV
Protein Structure Function 2A non-structural ribosomal skip inducer 2B non-structural involved in genome replication 2C non-structural involved in genome replication 3A non-structural Multifunctional integral membrane protein 3B non-structural viral genome linkage 3Cpro non-structural viral polypeptide protease 3Dpol non-structural viral polymerase Lpro non-structural host cell translation inactivator VP1 structural capsid-building VP2 structural capsid-building VP3 structural capsid-building VP4 structural capsid-building
1.5.1 Antigenic mapping One of the main questions obtaining the disease is to understand more about the relation between the different serotypes. Since the serotypes have evolved from the same original virus strain, there are still a lot of similarities with respect to structural conformation and antigenic sites. This means that the same mAb can have a high affinity to several or possibly all of the serotypes. However, the evolution with the increasing number of serotype subclasses has often resulted in mAbs which are not recognizing the antigenic sites in certain virus strains. Therefore, it is of high importance to better understand the nature of the antigenic sites and the variation within different serotypes of FMDV. A way to investigate this is by the use

10
of virus neutralising test (VNT), which is a helpful method to investigate the ability of the mAb to neutralize the infectivity of the virus strains as well as the affinity of an antibody to a certain virus particle. The test is carried out in a mixture of mAb, virus and susceptible virus-infected cells and is a useful experiment in the selection of what antibodies to be used in the next-following step. In short terms, it is possible to see what antibodies will neutralise virus serotypes. These observations may be a good initial approach to the study of antigenic sites. Immunoblotting is a method which can be used to investigate on what antigenic sites or epitopes antibodies are binding. The antigen proteins are denaturated and loaded onto a gel. After running the gel they are transferred to a nitrocellulose blot, where antibody with radiolabelled conjugate is added. This gives the opportunity to see where antibody-viral peptide complexes are formed. A disadvantage of this method is the denaturation of the viral peptides, only giving the possibility to recognize linear epitopes. For a long time it was considered that the FMDV only contained one major antigenic site. This site, named site A or site 1, is continuous and located in the G-H loop of VP1 [10], which is a trypsin sensitive area. Previous serological studies have showed that this area (residues 135-155) is extremely variable in various serotypes, once again confirming the low crossreactivity between the serotypes [31]. Experiments with mAbs on FMDV serotypes O, A, C and Asia 1 showed that there are different antigenic sites on VP1, VP2 and VP3 [10]. The sites in the different serotypes were all corresponding to each other, indicating that they are conserved from the original FMDV strain. The serotypes and its subclasses have then been established through mutations in critical residues in the antigenic sites. The above mentioned experiments were performed through the use of mAb-resistant mutants (MAR-mutants), which are mutated at particular positions in the nucleotide sequence, giving the possibility to map the antigenic sites [10]. This also helps to understand whether the sites in a certain serotype are independent of each other or not. In contrast to the immunoblotting system, experiments with MAR-mutants also can lead to the identification of conformation-dependent sites. This makes it a powerful tool for antigenic mapping. Experiments with MAR-mutants also contributed to the detection of a new antigenic site in Asia 1, not analogous to any of the other serotypes [10], once again showing the variability of the virus and the importance and difficulties of developing strategies for finding reliable diagnostic tools. From this point of view, conclusions about the stability of the antigenic sites may be a matter of urgency to understand whether a mAb will be useful, i.e. being able to neutralise an antigen, or not. This indicates that the mapping of antigenic sites and its properties is significant for the selection of mAbs, especially when the number of mutations and subclasses are increasing.
2 The lateral chromatographic system
2.1 The need of rapid test methods FMDV is a very contagious disease, having the possibility to spread fast. To control the disease as good as possible, rapid diagnostic test methods are of high importance. There are today several methods being able to give answers about FMDV infections [15]. ELISA is reliable and has both accurate sensitivity and selectivity, but needs the use of a laboratory, which for FMDV analysis requires 3 or 4 hours of work [15]. The development of DNA techniques in the last decade has also made RT-PCR an ordinary laboratory method for the diagnosing of FMDV [32]. fluid In a first diagnostic step, the main question is whether the animal is infected or not. In the case of a positive test, a fast and consistent answer combined with appropriate decisions can
11
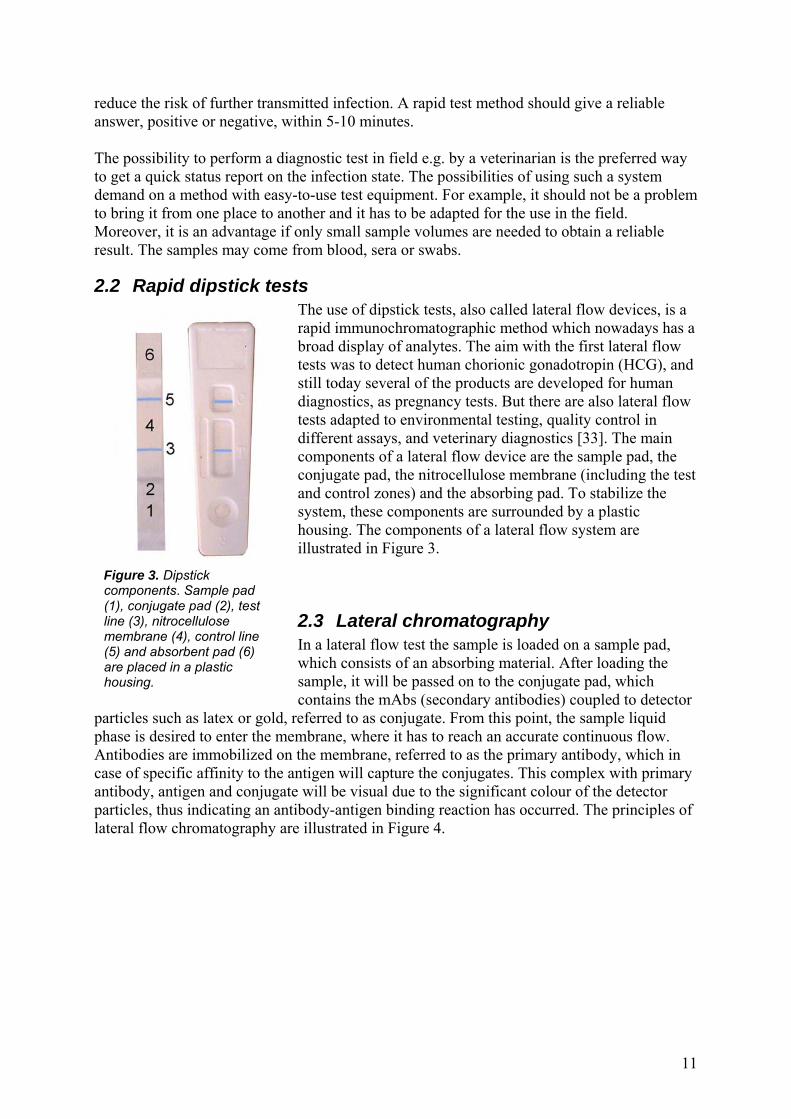
Figure 3. Dipstick components. Sample pad (1), conjugate pad (2), test line (3), nitrocellulose membrane (4), control line (5) and absorbent pad (6) are placed in a plastic housing.
reduce the risk of further transmitted infection. A rapid test method should give a reliable answer, positive or negative, within 5-10 minutes. The possibility to perform a diagnostic test in field e.g. by a veterinarian is the preferred way to get a quick status report on the infection state. The possibilities of using such a system demand on a method with easy-to-use test equipment. For example, it should not be a problem to bring it from one place to another and it has to be adapted for the use in the field. Moreover, it is an advantage if only small sample volumes are needed to obtain a reliable result. The samples may come from blood, sera or swabs.
2.2 Rapid dipstick tests The use of dipstick tests, also called lateral flow devices, is a rapid immunochromatographic method which nowadays has a broad display of analytes. The aim with the first lateral flow tests was to detect human chorionic gonadotropin (HCG), and still today several of the products are developed for human diagnostics, as pregnancy tests. But there are also lateral flow tests adapted to environmental testing, quality control in different assays, and veterinary diagnostics [33]. The main components of a lateral flow device are the sample pad, the conjugate pad, the nitrocellulose membrane (including the test and control zones) and the absorbing pad. To stabilize the system, these components are surrounded by a plastic housing. The components of a lateral flow system are illustrated in Figure 3.
2.3 Lateral chromatography In a lateral flow test the sample is loaded on a sample pad, which consists of an absorbing material. After loading the sample, it will be passed on to the conjugate pad, which contains the mAbs (secondary antibodies) coupled to detector
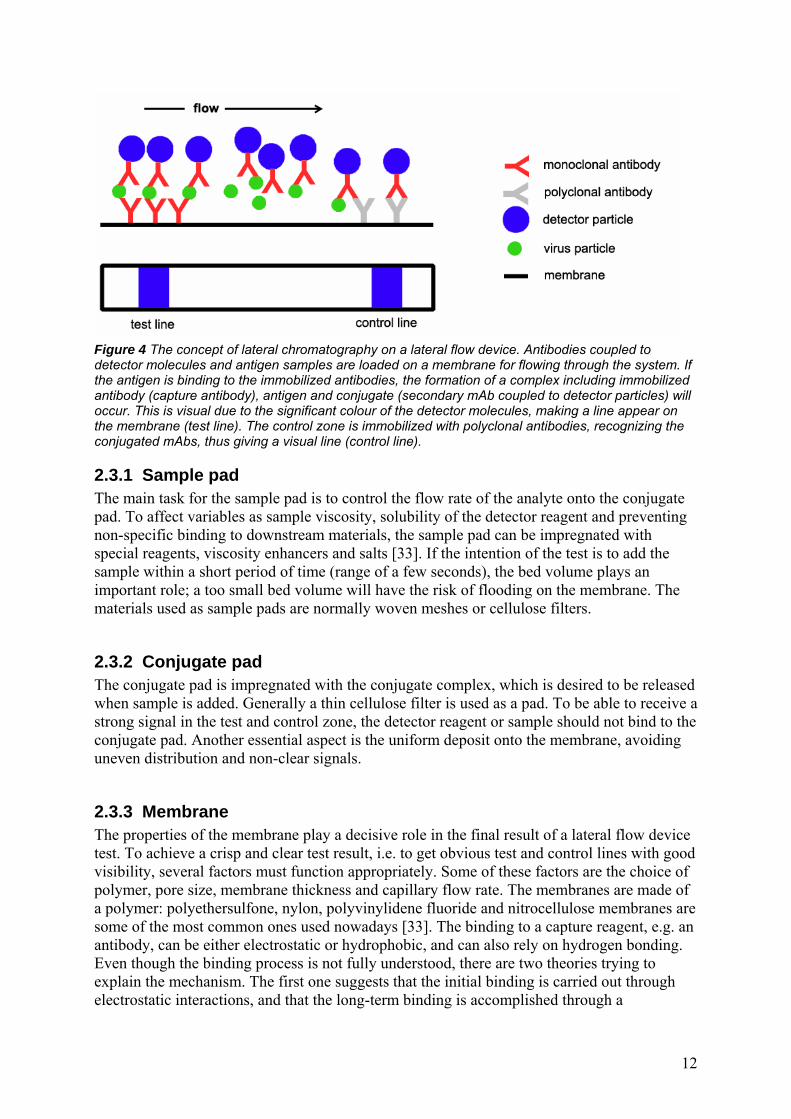
particles such as latex or gold, referred to as conjugate. From this point, the sample liquid phase is desired to enter the membrane, where it has to reach an accurate continuous flow. Antibodies are immobilized on the membrane, referred to as the primary antibody, which in case of specific affinity to the antigen will capture the conjugates. This complex with primary antibody, antigen and conjugate will be visual due to the significant colour of the detector particles, thus indicating an antibody-antigen binding reaction has occurred. The principles of lateral flow chromatography are illustrated in Figure 4.
12
Figure 4 The concept of lateral chromatography on a lateral flow device. Antibodies coupled to detector molecules and antigen samples are loaded on a membrane for flowing through the system. If the antigen is binding to the immobilized antibodies, the formation of a complex including immobilized antibody (capture antibody), antigen and conjugate (secondary mAb coupled to detector particles) will occur. This is visual due to the significant colour of the detector molecules, making a line appear on the membrane (test line). The control zone is immobilized with polyclonal antibodies, recognizing the conjugated mAbs, thus giving a visual line (control line).
2.3.1 Sample pad The main task for the sample pad is to control the flow rate of the analyte onto the conjugate pad. To affect variables as sample viscosity, solubility of the detector reagent and preventing non-specific binding to downstream materials, the sample pad can be impregnated with special reagents, viscosity enhancers and salts [33]. If the intention of the test is to add the sample within a short period of time (range of a few seconds), the bed volume plays an important role; a too small bed volume will have the risk of flooding on the membrane. The materials used as sample pads are normally woven meshes or cellulose filters.
2.3.2 Conjugate pad The conjugate pad is impregnated with the conjugate complex, which is desired to be released when sample is added. Generally a thin cellulose filter is used as a pad. To be able to receive a strong signal in the test and control zone, the detector reagent or sample should not bind to the conjugate pad. Another essential aspect is the uniform deposit onto the membrane, avoiding uneven distribution and non-clear signals.
2.3.3 Membrane The properties of the membrane play a decisive role in the final result of a lateral flow device test. To achieve a crisp and clear test result, i.e. to get obvious test and control lines with good visibility, several factors must function appropriately. Some of these factors are the choice of polymer, pore size, membrane thickness and capillary flow rate. The membranes are made of a polymer: polyethersulfone, nylon, polyvinylidene fluoride and nitrocellulose membranes are some of the most common ones used nowadays [33]. The binding to a capture reagent, e.g. an antibody, can be either electrostatic or hydrophobic, and can also rely on hydrogen bonding. Even though the binding process is not fully understood, there are two theories trying to explain the mechanism. The first one suggests that the initial binding is carried out through electrostatic interactions, and that the long-term binding is accomplished through a
13
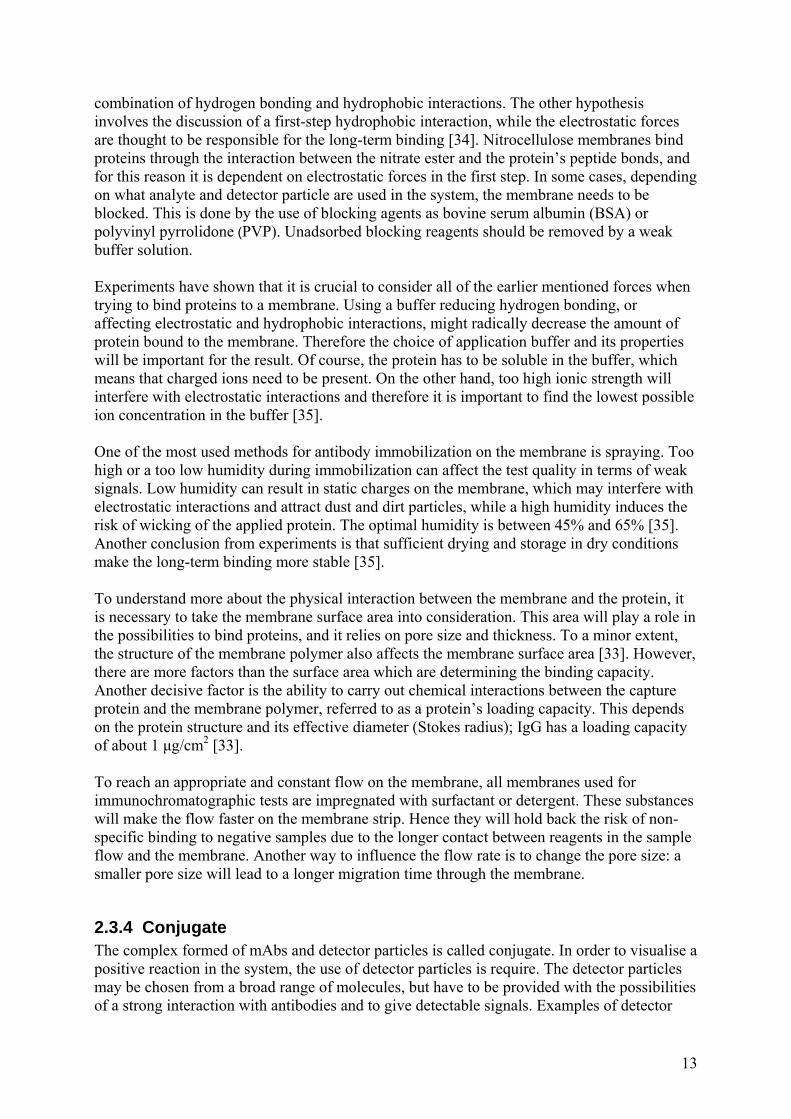
combination of hydrogen bonding and hydrophobic interactions. The other hypothesis involves the discussion of a first-step hydrophobic interaction, while the electrostatic forces are thought to be responsible for the long-term binding [34]. Nitrocellulose membranes bind proteins through the interaction between the nitrate ester and the protein’s peptide bonds, and for this reason it is dependent on electrostatic forces in the first step. In some cases, depending on what analyte and detector particle are used in the system, the membrane needs to be blocked. This is done by the use of blocking agents as bovine serum albumin (BSA) or polyvinyl pyrrolidone (PVP). Unadsorbed blocking reagents should be removed by a weak buffer solution. Experiments have shown that it is crucial to consider all of the earlier mentioned forces when trying to bind proteins to a membrane. Using a buffer reducing hydrogen bonding, or affecting electrostatic and hydrophobic interactions, might radically decrease the amount of protein bound to the membrane. Therefore the choice of application buffer and its properties will be important for the result. Of course, the protein has to be soluble in the buffer, which means that charged ions need to be present. On the other hand, too high ionic strength will interfere with electrostatic interactions and therefore it is important to find the lowest possible ion concentration in the buffer [35]. One of the most used methods for antibody immobilization on the membrane is spraying. Too high or a too low humidity during immobilization can affect the test quality in terms of weak signals. Low humidity can result in static charges on the membrane, which may interfere with electrostatic interactions and attract dust and dirt particles, while a high humidity induces the risk of wicking of the applied protein. The optimal humidity is between 45% and 65% [35]. Another conclusion from experiments is that sufficient drying and storage in dry conditions make the long-term binding more stable [35]. To understand more about the physical interaction between the membrane and the protein, it is necessary to take the membrane surface area into consideration. This area will play a role in the possibilities to bind proteins, and it relies on pore size and thickness. To a minor extent, the structure of the membrane polymer also affects the membrane surface area [33]. However, there are more factors than the surface area which are determining the binding capacity. Another decisive factor is the ability to carry out chemical interactions between the capture protein and the membrane polymer, referred to as a protein’s loading capacity. This depends on the protein structure and its effective diameter (Stokes radius); IgG has a loading capacity of about 1 µg/cm2 [33]. To reach an appropriate and constant flow on the membrane, all membranes used for immunochromatographic tests are impregnated with surfactant or detergent. These substances will make the flow faster on the membrane strip. Hence they will hold back the risk of non-specific binding to negative samples due to the longer contact between reagents in the sample flow and the membrane. Another way to influence the flow rate is to change the pore size: a smaller pore size will lead to a longer migration time through the membrane.
2.3.4 Conjugate The complex formed of mAbs and detector particles is called conjugate. In order to visualise a positive reaction in the system, the use of detector particles is require. The detector particles may be chosen from a broad range of molecules, but have to be provided with the possibilities of a strong interaction with antibodies and to give detectable signals. Examples of detector

14
Figure 5. The three main forces contributing to interaction between antibody and colloidal gold particles: charge, hydrophobic interactions and dative forces.
particles used in immunochromatographic assays are gold, silver, carbon and latex [36]. The population of detector particles needs to be of uniform sized particles, since a system with different particle sizes will result in an uneven flow on the membrane; smaller particles will move faster than larger, and the sensitivity and selectivity of the test may be inconsequent.
2.3.4.1 Colloidal gold A colloidal system involves a distribution of small solid phase particles in a solvent, referred to as dispersion. Colloidal gold particles, also known as gold nanoparticles, are generally produced by reduction of tetrachloroaurate in a liquid [37]. Through this reduction, the Au3+ ions change to plain, or even weakly negative charged, gold particles. If the solution then becomes highly saturated with these, precipitation forming gold nanoparticles will occur. If having colloid gold, there are mainly three forces involved in the coupling to an antibody (Figure 5). One of these is the charge attraction. The colloidal gold particles have a thin ion layer of negative charge on the surface, which may attract amino acids of the antibody. This happens when pH is below the antibody’s isoelectric point and particular amino acids are positively charged. A second force contributing to the coupling is general hydrophobic binding, which may occur if the gold particles and the antibody are close enough to each other
(< 1 nm) [38]. A third and a very strong force is the covalent dative bonding, which demands high content of sulphur-containing amino acids in the antibody. If this is the case, a strong attraction between the conductive electrons of the gold atoms and the valence electrons of the sulphur atoms will appear.
2.3.4.2 Latex particles Latex is often used in immunological applications due to its uniform size distribution and the ability to adsorb antibodies. One of the main advantages of latexes is that most proteins adsorb strongly to it. This is because of the plenteous local interactions available, and generally only small overlaps are needed to create a stable interaction [39]. The best adsorption is reached when the protein is close to its isoelectric point [40], indicating that also hydrophobic interactions are of relevance. Studies have shown that hydrophobic effects even can superimpose the electrostatic ones [41]. Disassociation is rare due to the high number of interactions, but it can occur if the buffer solution is changed and when temperature differences are too big. A risk in the conjugate complex could be the conformation changes of the protein when binding to the latex particles, an incident which in most cases leads to a smaller affinity to the antigen [41]. Without the above mentioned factors, there are several other properties being of high relevance when handling antibody binding to latex particles. The functional groups of the antibody play a key role when designing the experiments, as well as its positions and characteristics. Some may lead to steric hindrance, which means slighter chances to binding [42]. As usual, knowledge from earlier performed experiments with similar approaches needs to be taken into consideration, i.e. to study empirical results from related systems. A reaction temperature 10-15° C above room temperature has been shown to increase the affinity, and other factors which contribute to a strong binding are buffer pH and ionic strength.
15
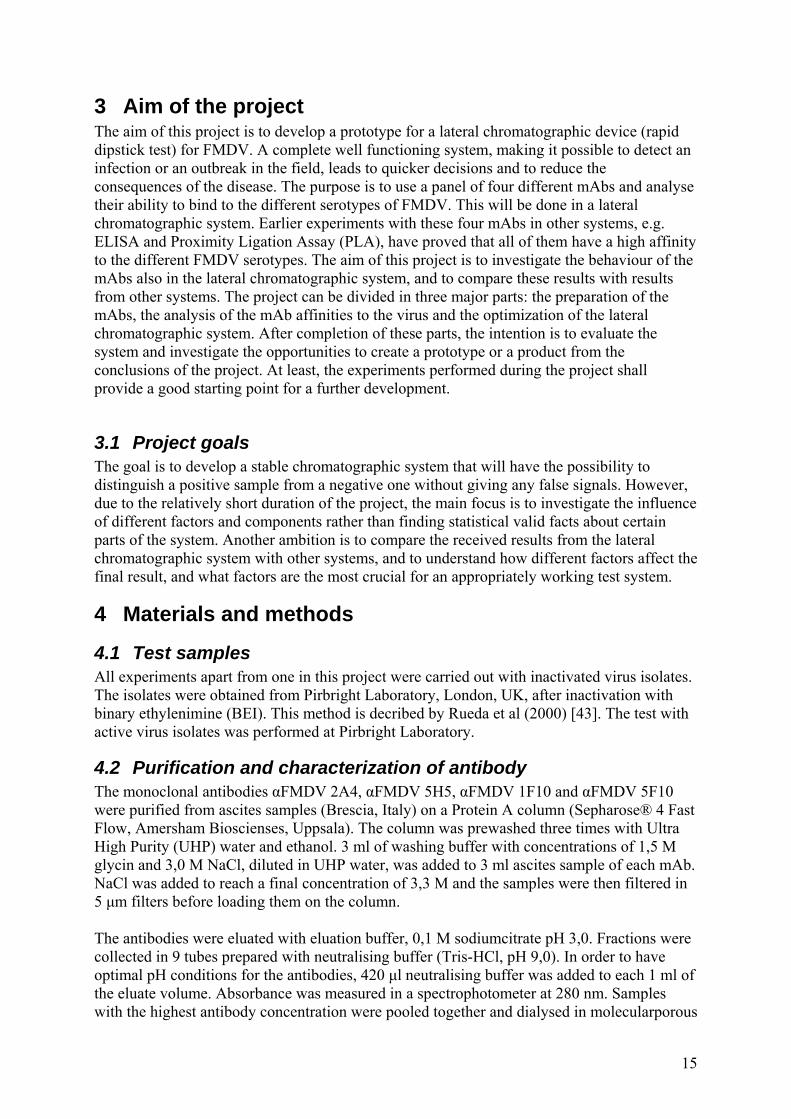
3 Aim of the project The aim of this project is to develop a prototype for a lateral chromatographic device (rapid dipstick test) for FMDV. A complete well functioning system, making it possible to detect an infection or an outbreak in the field, leads to quicker decisions and to reduce the consequences of the disease. The purpose is to use a panel of four different mAbs and analyse their ability to bind to the different serotypes of FMDV. This will be done in a lateral chromatographic system. Earlier experiments with these four mAbs in other systems, e.g. ELISA and Proximity Ligation Assay (PLA), have proved that all of them have a high affinity to the different FMDV serotypes. The aim of this project is to investigate the behaviour of the mAbs also in the lateral chromatographic system, and to compare these results with results from other systems. The project can be divided in three major parts: the preparation of the mAbs, the analysis of the mAb affinities to the virus and the optimization of the lateral chromatographic system. After completion of these parts, the intention is to evaluate the system and investigate the opportunities to create a prototype or a product from the conclusions of the project. At least, the experiments performed during the project shall provide a good starting point for a further development.
3.1 Project goals The goal is to develop a stable chromatographic system that will have the possibility to distinguish a positive sample from a negative one without giving any false signals. However, due to the relatively short duration of the project, the main focus is to investigate the influence of different factors and components rather than finding statistical valid facts about certain parts of the system. Another ambition is to compare the received results from the lateral chromatographic system with other systems, and to understand how different factors affect the final result, and what factors are the most crucial for an appropriately working test system.
4 Materials and methods
4.1 Test samples All experiments apart from one in this project were carried out with inactivated virus isolates. The isolates were obtained from Pirbright Laboratory, London, UK, after inactivation with binary ethylenimine (BEI). This method is decribed by Rueda et al (2000) [43]. The test with active virus isolates was performed at Pirbright Laboratory.
4.2 Purification and characterization of antibody The monoclonal antibodies αFMDV 2A4, αFMDV 5H5, αFMDV 1F10 and αFMDV 5F10 were purified from ascites samples (Brescia, Italy) on a Protein A column (Sepharose® 4 Fast Flow, Amersham Bioscienses, Uppsala). The column was prewashed three times with Ultra High Purity (UHP) water and ethanol. 3 ml of washing buffer with concentrations of 1,5 M glycin and 3,0 M NaCl, diluted in UHP water, was added to 3 ml ascites sample of each mAb. NaCl was added to reach a final concentration of 3,3 M and the samples were then filtered in 5 µm filters before loading them on the column. The antibodies were eluated with eluation buffer, 0,1 M sodiumcitrate pH 3,0. Fractions were collected in 9 tubes prepared with neutralising buffer (Tris-HCl, pH 9,0). In order to have optimal pH conditions for the antibodies, 420 µl neutralising buffer was added to each 1 ml of the eluate volume. Absorbance was measured in a spectrophotometer at 280 nm. Samples with the highest antibody concentration were pooled together and dialysed in molecularporous

16
membrane tubes (Spectra/Por, Los Angeles, USA) against a PBS volume of 100 times sample volume over night, temperature +4°C. PBS was changed after 12 hours and substituted with the same volume of PBS. Additional 3 hours of dialysing was then performed. Antibody samples with concentrations below 2,5 mg/ml were concentrated in a 30000 Da regenerated cellulose filter (Millipore, Bedford, USA) in an Amicon® 8200. Out-filtered samples were analyzed in spectrophotometer to confirm that there was no loss with amount of antibody.
4.2.1 Verification of antibody product The verification of antibody product was done with SDS-PAGE and silver staining of the gel. Both procedures were performed in PHAST-SYSTEM (Pharmacia, Uppsala, Sweden) and according to the PHAST SYSTEM System Guide. Each antibody sample was diluted in UHP water to get a final concentration of 1,0 mg/ml; 15 µl diluted antibody sample was added to 15 µl of reducing sample cocktail (20 mM Tris/HCl, 2 mM EDTA, 0,17 M SDS, 0,02 mM brom phenol blue and 5% β-mercaptoethanol) diluted in UHP water. The samples were loaded on a PhastGel Gradient 10-15 (Pharmacia Biotech, Uppsala, Sweden) together with two samples of molecular weight markers (Amersham Bioscienses, Uppsala), the sample volume was 2 µl. SDS-PAGE separation was performed with 80 Vh. The following solutions were used in the silver staining (all diluted in UHP water): 12,5% Na2CO3, 50% EtOH 10% HAc, 10% EtOH 5% HAc, 8,3% glutardialdehyde, 0,25% AgNO3, 1,25% Na2CO3 0,05% formaldehyde and 10% HAc 5% glycerol.
4.2.2 Immunoglobulin class verification Roche Applied Science’s IsoStrip Mouse Monoclonal Antibody Isotyping Kit (Roche Applied Science, Bromma, Sweden) was used for rapid characterization of immunoglobulin class of the four mAbs. 150 µl of a 1 µg/µl antibody concentration, diluted in phosphate-buffered saline (PBS), was pipetted into the development tube and incubated for 30 seconds at RT. Subsequently, the isostrip was placed in the development tube for 10 minutes and then analysed.
4.2.3 Isoelectric focusing To be able to do a covalent coupling between antibody and colloidal gold, the antibody’s isoelectric point (ip) is of high importance. Even if a covalent coupling was not carried out in this project, it might be of interest in succeeding experiments. Therefore, an isoelectric focusing was performed in the PHAST-SYSTEM. Experiment procedure was performed accordning to the PHAST-SYSTEM System Guide. Two ip focusing gels (pH range 3-10 and 5-10,5) from Pharmacia Biotech, Uppsala, were used and 2 µl samples from each of the four mAbs were loaded onto the gel. One molecular weight marker, corresponding to the gel pH range, was also added to each gel. The bands were visualised with silver staining in PHAST-SYSTEM.
4.3 Lateral flow devices Construction and assembly of the lateral flow devices were divided into a number of steps like latex coupling, colloidal gold coupling, conjugate application and membrane immobilization. These processes are outlined below.
17
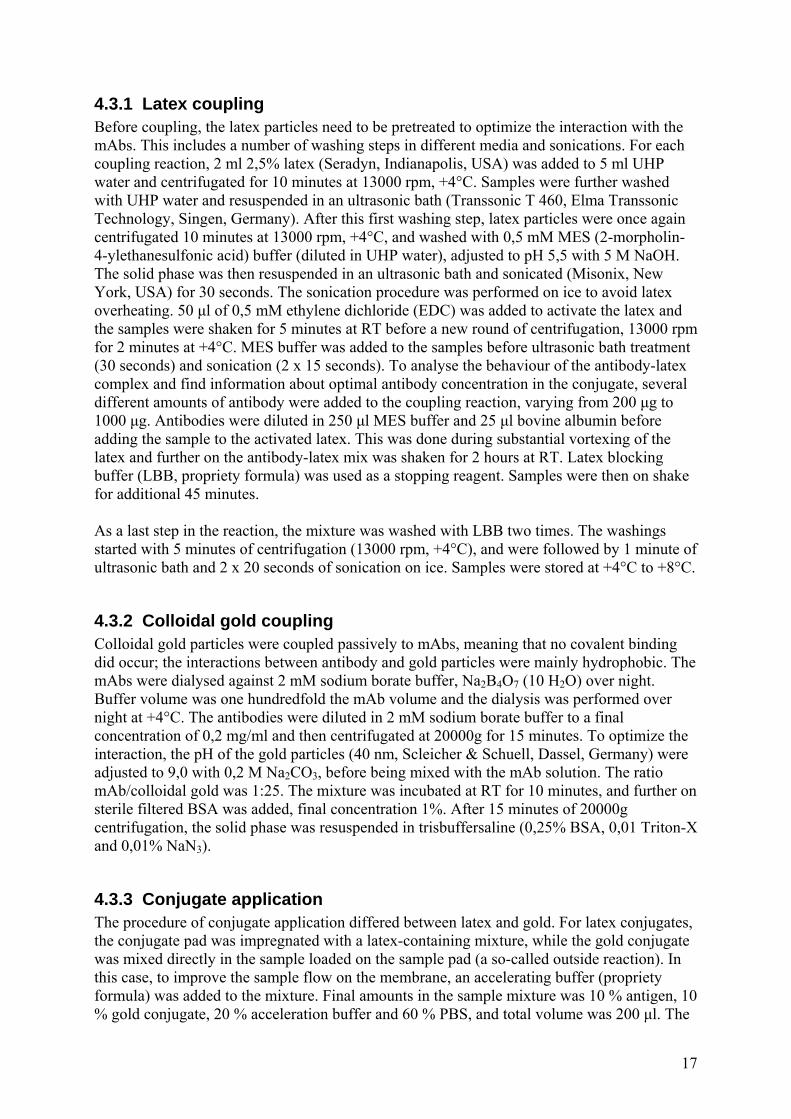
4.3.1 Latex coupling Before coupling, the latex particles need to be pretreated to optimize the interaction with the mAbs. This includes a number of washing steps in different media and sonications. For each coupling reaction, 2 ml 2,5% latex (Seradyn, Indianapolis, USA) was added to 5 ml UHP water and centrifugated for 10 minutes at 13000 rpm, +4°C. Samples were further washed with UHP water and resuspended in an ultrasonic bath (Transsonic T 460, Elma Transsonic Technology, Singen, Germany). After this first washing step, latex particles were once again centrifugated 10 minutes at 13000 rpm, +4°C, and washed with 0,5 mM MES (2-morpholin-4-ylethanesulfonic acid) buffer (diluted in UHP water), adjusted to pH 5,5 with 5 M NaOH. The solid phase was then resuspended in an ultrasonic bath and sonicated (Misonix, New York, USA) for 30 seconds. The sonication procedure was performed on ice to avoid latex overheating. 50 µl of 0,5 mM ethylene dichloride (EDC) was added to activate the latex and the samples were shaken for 5 minutes at RT before a new round of centrifugation, 13000 rpm for 2 minutes at +4°C. MES buffer was added to the samples before ultrasonic bath treatment (30 seconds) and sonication (2 x 15 seconds). To analyse the behaviour of the antibody-latex complex and find information about optimal antibody concentration in the conjugate, several different amounts of antibody were added to the coupling reaction, varying from 200 µg to 1000 µg. Antibodies were diluted in 250 µl MES buffer and 25 µl bovine albumin before adding the sample to the activated latex. This was done during substantial vortexing of the latex and further on the antibody-latex mix was shaken for 2 hours at RT. Latex blocking buffer (LBB, propriety formula) was used as a stopping reagent. Samples were then on shake for additional 45 minutes. As a last step in the reaction, the mixture was washed with LBB two times. The washings started with 5 minutes of centrifugation (13000 rpm, +4°C), and were followed by 1 minute of ultrasonic bath and 2 x 20 seconds of sonication on ice. Samples were stored at +4°C to +8°C.
4.3.2 Colloidal gold coupling Colloidal gold particles were coupled passively to mAbs, meaning that no covalent binding did occur; the interactions between antibody and gold particles were mainly hydrophobic. The mAbs were dialysed against 2 mM sodium borate buffer, Na2B4O7 (10 H2O) over night. Buffer volume was one hundredfold the mAb volume and the dialysis was performed over night at +4°C. The antibodies were diluted in 2 mM sodium borate buffer to a final concentration of 0,2 mg/ml and then centrifugated at 20000g for 15 minutes. To optimize the interaction, the pH of the gold particles (40 nm, Scleicher & Schuell, Dassel, Germany) were adjusted to 9,0 with 0,2 M Na2CO3, before being mixed with the mAb solution. The ratio mAb/colloidal gold was 1:25. The mixture was incubated at RT for 10 minutes, and further on sterile filtered BSA was added, final concentration 1%. After 15 minutes of 20000g centrifugation, the solid phase was resuspended in trisbuffersaline (0,25% BSA, 0,01 Triton-X and 0,01% NaN3).
4.3.3 Conjugate application The procedure of conjugate application differed between latex and gold. For latex conjugates, the conjugate pad was impregnated with a latex-containing mixture, while the gold conjugate was mixed directly in the sample loaded on the sample pad (a so-called outside reaction). In this case, to improve the sample flow on the membrane, an accelerating buffer (propriety formula) was added to the mixture. Final amounts in the sample mixture was 10 % antigen, 10 % gold conjugate, 20 % acceleration buffer and 60 % PBS, and total volume was 200 µl. The

18
quantity of latex conjugate per pad was around 1 µl, and this volume was sprayed with a BioDot (Biodot, West Sussex, UK) airbrush machinery. To reach an even application and to simplify the procedure, filters with approximate length of 30 cm was sprayed and then cut into smaller pieces. The latex conjugate application mixture was prepared through centrifugations and soncations: first, the latex conjugate was centrifugated at 13000 rpm for 5 minutes. The liquid phase was removed and a latex application buffer (LAB, propriety formula), 1,75 times the volume of the conjugate, was added to the remaining solid phase. To resuspend the latex pellet, it was put in an ultrasonic bath for 1 minute. After this procedure, the mixture was sonicated in a number of different time intervals (all sonications performed on ice): 2x15 seconds, 2x30 seconds, 6x5 seconds etc. This was due to the suggestion that this sonication step was important to the conjugation flow on the membrane, regarding the possible formation of aggregates at certain sonication times. Following this preparation of the conjugate, it was sprayed onto the conjugate pads, which were later stored at room temperature and in dry conditions.
4.3.4 Membrane immobilization The antibody immobilization on the membrane is crucial in the immunochromatographic system. To receive a proper signal, it is of high importance to find the right antibody concentration. Even if there is a high affinity between antibody and virus, a too low mAb concentration will result in a weak signal. In contrast, a too high concentration will incorporate the risk of unspecific binding of negative samples. All immobilizations were performed on nitrocellulose membranes, NC membrane 135 (Millipore, Bedford, USA), in a BioDot apparatus. The flow time on such a membrane is 135 seconds (+/- 34 seconds) per 4 cm. mAb samples, used for immobilization in the test zone, were diluted in PBS and mixed with 0,1 M trishydroxymethylaminomethan (Tris). To be able to make a quantitative analysis of mAb concentrations on the membrane, several different mAb concentrations were immobilized, ranging from 0,5 mg/ml to 2,6 mg/ml. For immobilization in the control zone, a concentration of 3 mg/ml of polyclonal rabbit anti-mouse immunoglobulins (Dako, Glostrup, Denmark) was used (diluted in PBS and mixed with Tris, final concentration 0,1 M). The antibody mixtures were then sprayed on the NC membrane with a Biodot airbrush, approximately 1 µl per centimetre of the membrane. The width of the antibody band formed from the immobilization was about 1 mm; this was true for both test band and control band. The membranes were put in +40°C for 1 hour and then stored at RT and dry conditions.
4.3.5 Lateral flow device construction and testing The components of the lateral flow devices were put together manually. The membrane was attached to a tape, making it possible to fasten sample pad and conjugate pad. The absorbent pad was attached in the same manner. Long pieces of immobilized membranes with pads were created and later on cut into smaller segments, matching the plastic housing. After assembly of the device, inactivated virus samples were loaded on the sample pad and results checked after 5 and 10 minutes. Four virus serotypes were analysed and samples from them were diluted in casein buffer (propriety formula) for latex devices and acceleration buffer for gold devices. The concentrations were ranging from 1:2 to 1:100. In a practical view, a well-functioning test with small virus quantities (corresponding to highly diluted samples), is preferred due to the probable small amounts of swabs in clinical testing. The test volume after buffer addition, were always between 150 and 200 µl in this project. Samples were added
19
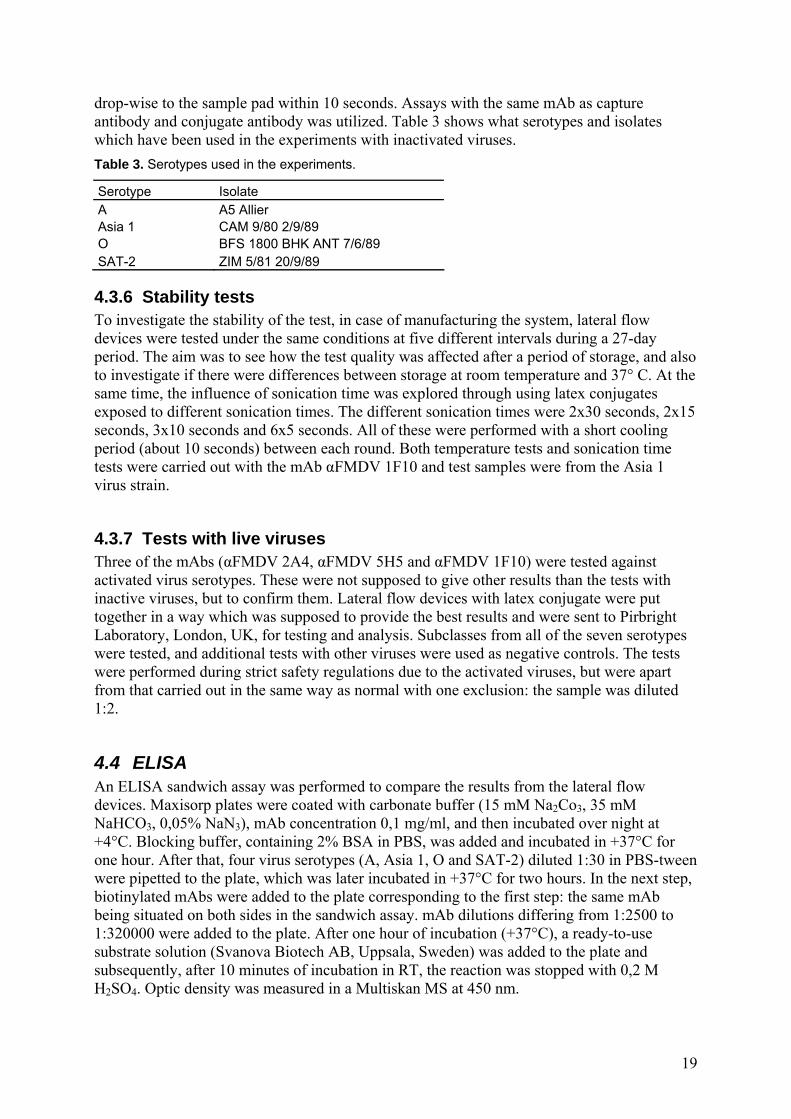
drop-wise to the sample pad within 10 seconds. Assays with the same mAb as capture antibody and conjugate antibody was utilized. Table 3 shows what serotypes and isolates which have been used in the experiments with inactivated viruses. Table 3. Serotypes used in the experiments.
Serotype Isolate A A5 Allier Asia 1 CAM 9/80 2/9/89 O BFS 1800 BHK ANT 7/6/89 SAT-2 ZIM 5/81 20/9/89
4.3.6 Stability tests To investigate the stability of the test, in case of manufacturing the system, lateral flow devices were tested under the same conditions at five different intervals during a 27-day period. The aim was to see how the test quality was affected after a period of storage, and also to investigate if there were differences between storage at room temperature and 37° C. At the same time, the influence of sonication time was explored through using latex conjugates exposed to different sonication times. The different sonication times were 2x30 seconds, 2x15 seconds, 3x10 seconds and 6x5 seconds. All of these were performed with a short cooling period (about 10 seconds) between each round. Both temperature tests and sonication time tests were carried out with the mAb αFMDV 1F10 and test samples were from the Asia 1 virus strain.
4.3.7 Tests with live viruses Three of the mAbs (αFMDV 2A4, αFMDV 5H5 and αFMDV 1F10) were tested against activated virus serotypes. These were not supposed to give other results than the tests with inactive viruses, but to confirm them. Lateral flow devices with latex conjugate were put together in a way which was supposed to provide the best results and were sent to Pirbright Laboratory, London, UK, for testing and analysis. Subclasses from all of the seven serotypes were tested, and additional tests with other viruses were used as negative controls. The tests were performed during strict safety regulations due to the activated viruses, but were apart from that carried out in the same way as normal with one exclusion: the sample was diluted 1:2.
4.4 ELISA An ELISA sandwich assay was performed to compare the results from the lateral flow devices. Maxisorp plates were coated with carbonate buffer (15 mM Na2Co3, 35 mM NaHCO3, 0,05% NaN3), mAb concentration 0,1 mg/ml, and then incubated over night at +4°C. Blocking buffer, containing 2% BSA in PBS, was added and incubated in +37°C for one hour. After that, four virus serotypes (A, Asia 1, O and SAT-2) diluted 1:30 in PBS-tween were pipetted to the plate, which was later incubated in +37°C for two hours. In the next step, biotinylated mAbs were added to the plate corresponding to the first step: the same mAb being situated on both sides in the sandwich assay. mAb dilutions differing from 1:2500 to 1:320000 were added to the plate. After one hour of incubation (+37°C), a ready-to-use substrate solution (Svanova Biotech AB, Uppsala, Sweden) was added to the plate and subsequently, after 10 minutes of incubation in RT, the reaction was stopped with 0,2 M H2SO4. Optic density was measured in a Multiskan MS at 450 nm.

20
4.5 Proximity Ligation Assay Proximity Ligation Assay (PLA) was performed at Rudbeck Laboratory, Uppsala University, to compare lateral flow results with another immunodiagnostic method. αFMDV 1F10 was tested against four serotypes. Streptavidin-conjugated oligonucleotides (with free 3’ and 5’ ends) were coupled to the biotinylated αFMDV 1F10. This was done through dilution of the mAb in 1 % BSA (Sigma, St Louis, USA) to a final concentration of 30 nM. This was later mixed with the streptavidin-oligonucleotide conjugates in a 1:1 ratio and incubated for 1,5 hour in room temperature. The probes were then diluted in a PBS probe-dilution buffer, containing PBS, 1% BSA, 16 µg/ml sheared polyA bulk nucleic acid (Sigma), 1 mM D-biotin (Molecular Probes, Eugene, USA), and stored at 4° C. Four virus serotype samples (O, A, Asia 1 and SAT-2) were diluted in PBS buffer to two different concentrations (10x and 500x) and each sample was duplicated to get more reliable results. 1 µl sample was then mixed with 4 µl of the pair of proximity probes, concentration 24 pM (diluted in probe-dilution buffer), and incubated for 1 hour in 37° C in optical PCR tubes. Later on, 45 µl PCR mixture [50 mM KCl, 10 mM Tris-HCl pH 8,3, 3,15 mM MgCl2, 0,4 Weiss-units T4 DNA ligase (Fermentas, Hanover, USA), 400 nM connector oligonucleotide (biomers.net GmbH), 100 nM Taqman® MGB probe (Applied Biosystems) and 1,5 units Platinum Taq DNA polymerase (Invitrogen, Carlsbad, USA)] were added to perform ligation and amplification. Tubes were sealed with optical PCR lids (Applied Biosystems) and put into a real time PCR machine (Stratagene’s MX 3000P, ABI 7700, Applied Biosystems). The reactions were then incubated at 95° C for 2 minutes, followed by 45 cycles at 95° C for 15 seconds and 60° C for 1 minute.
5 Results It is worth to notice that this project is in an early development step. Due to the relatively short period of project time and no previous experiments of same kind at the laboratory where the tests have been carried out, these results need to be taken as a first-step approach to a rapid dipstick test for FMDV and not as significant.
5.1 Antibody purification and characterization Peaks of high protein concentrations were found in the first two or three fractions of each sample (Figure 6). The yield of antibody after purification was about the same for three of the antibodies: αFMDV 2A4, αFMDV 5H5 and αFMDV 1F10. For the fourth, αFMDV 5F10, the yield was noticeably smaller. See Table 4.
0,0
1,0
2,0
3,0
4,0
0 5 10
Sample
Abs
orba
nce
[OD
uni
ts]
αFMDV 2A4αFMDV 5H5αFMDV 1F10αFMDV 5F10
Figure 6. Eluation curves for the four mAbs. Antibody was mainly collected at samples 2-4.
21
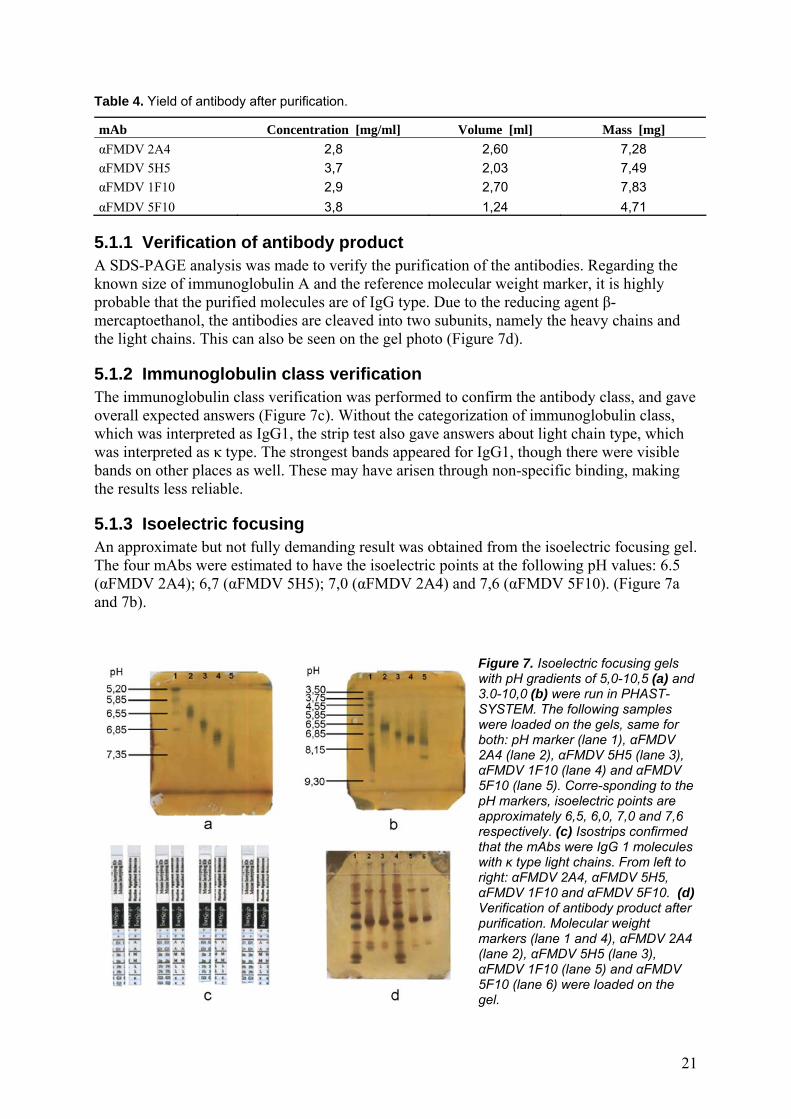
Table 4. Yield of antibody after purification.
mAb Concentration [mg/ml] Volume [ml] Mass [mg] αFMDV 2A4 2,8 2,60 7,28 αFMDV 5H5 3,7 2,03 7,49 αFMDV 1F10 2,9 2,70 7,83 αFMDV 5F10 3,8 1,24 4,71
5.1.1 Verification of antibody product A SDS-PAGE analysis was made to verify the purification of the antibodies. Regarding the known size of immunoglobulin A and the reference molecular weight marker, it is highly probable that the purified molecules are of IgG type. Due to the reducing agent β-mercaptoethanol, the antibodies are cleaved into two subunits, namely the heavy chains and the light chains. This can also be seen on the gel photo (Figure 7d).
5.1.2 Immunoglobulin class verification The immunoglobulin class verification was performed to confirm the antibody class, and gave overall expected answers (Figure 7c). Without the categorization of immunoglobulin class, which was interpreted as IgG1, the strip test also gave answers about light chain type, which was interpreted as κ type. The strongest bands appeared for IgG1, though there were visible bands on other places as well. These may have arisen through non-specific binding, making the results less reliable.
5.1.3 Isoelectric focusing An approximate but not fully demanding result was obtained from the isoelectric focusing gel. The four mAbs were estimated to have the isoelectric points at the following pH values: 6.5 (αFMDV 2A4); 6,7 (αFMDV 5H5); 7,0 (αFMDV 2A4) and 7,6 (αFMDV 5F10). (Figure 7a and 7b).
Figure 7. Isoelectric focusing gels with pH gradients of 5,0-10,5 (a) and 3.0-10,0 (b) were run in PHAST-SYSTEM. The following samples were loaded on the gels, same for both: pH marker (lane 1), αFMDV 2A4 (lane 2), αFMDV 5H5 (lane 3), αFMDV 1F10 (lane 4) and αFMDV 5F10 (lane 5). Corre-sponding to the pH markers, isoelectric points are approximately 6,5, 6,0, 7,0 and 7,6 respectively. (c) Isostrips confirmed that the mAbs were IgG 1 molecules with κ type light chains. From left to right: αFMDV 2A4, αFMDV 5H5, αFMDV 1F10 and αFMDV 5F10. (d) Verification of antibody product after purification. Molecular weight markers (lane 1 and 4), αFMDV 2A4 (lane 2), αFMDV 5H5 (lane 3), αFMDV 1F10 (lane 5) and αFMDV 5F10 (lane 6) were loaded on the gel.
22
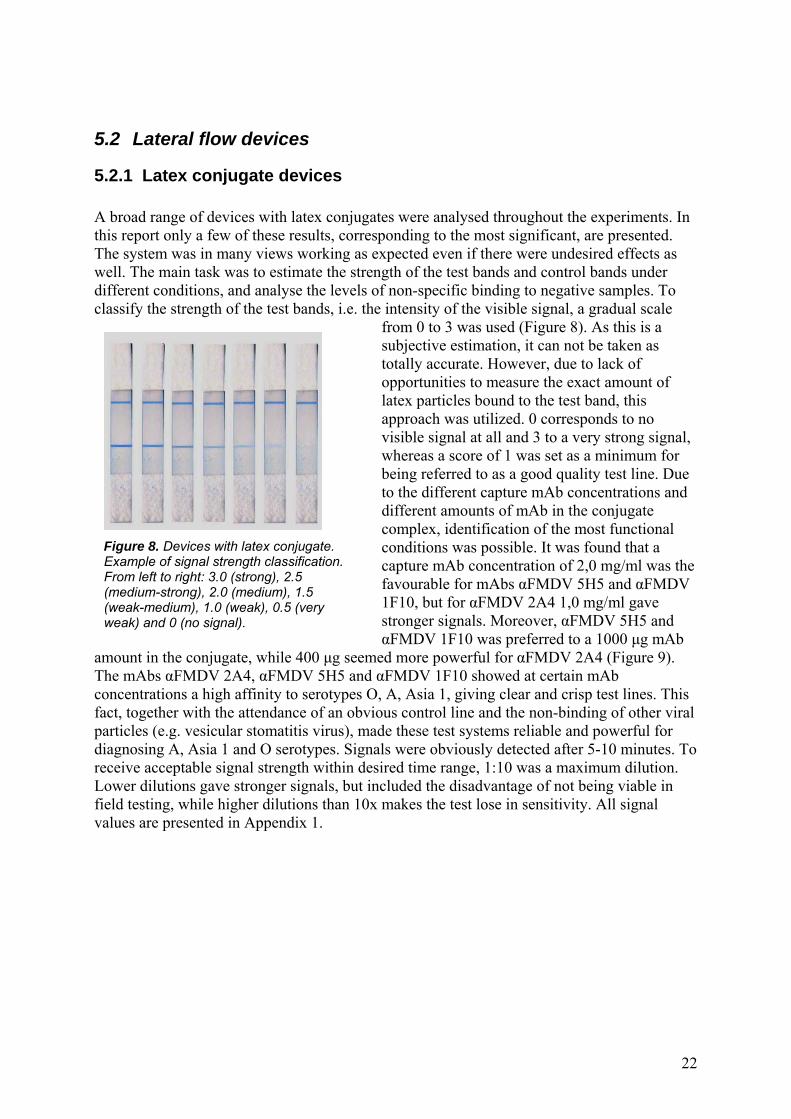
Figure 8. Devices with latex conjugate. Example of signal strength classification. From left to right: 3.0 (strong), 2.5 (medium-strong), 2.0 (medium), 1.5 (weak-medium), 1.0 (weak), 0.5 (very weak) and 0 (no signal).
5.2 Lateral flow devices
5.2.1 Latex conjugate devices A broad range of devices with latex conjugates were analysed throughout the experiments. In this report only a few of these results, corresponding to the most significant, are presented. The system was in many views working as expected even if there were undesired effects as well. The main task was to estimate the strength of the test bands and control bands under different conditions, and analyse the levels of non-specific binding to negative samples. To classify the strength of the test bands, i.e. the intensity of the visible signal, a gradual scale
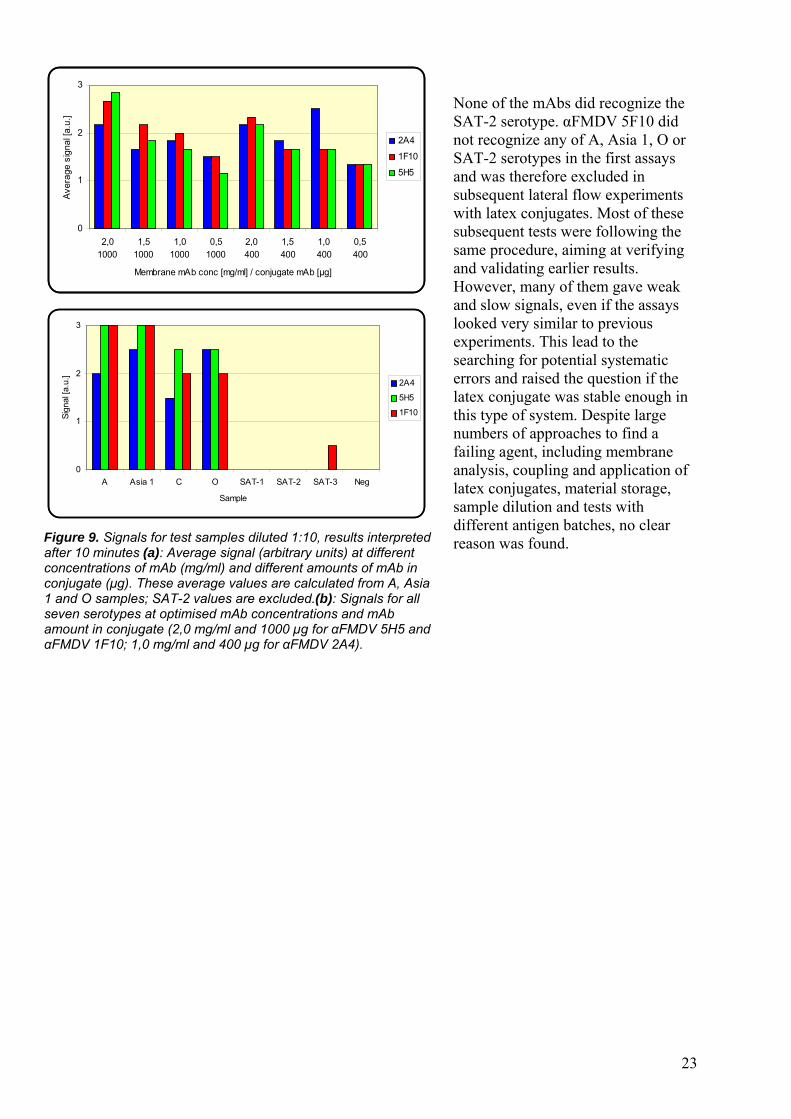
from 0 to 3 was used (Figure 8). As this is a subjective estimation, it can not be taken as totally accurate. However, due to lack of opportunities to measure the exact amount of latex particles bound to the test band, this approach was utilized. 0 corresponds to no visible signal at all and 3 to a very strong signal, whereas a score of 1 was set as a minimum for being referred to as a good quality test line. Due to the different capture mAb concentrations and different amounts of mAb in the conjugate complex, identification of the most functional conditions was possible. It was found that a capture mAb concentration of 2,0 mg/ml was the favourable for mAbs αFMDV 5H5 and αFMDV 1F10, but for αFMDV 2A4 1,0 mg/ml gave stronger signals. Moreover, αFMDV 5H5 and αFMDV 1F10 was preferred to a 1000 µg mAb
amount in the conjugate, while 400 µg seemed more powerful for αFMDV 2A4 (Figure 9). The mAbs αFMDV 2A4, αFMDV 5H5 and αFMDV 1F10 showed at certain mAb concentrations a high affinity to serotypes O, A, Asia 1, giving clear and crisp test lines. This fact, together with the attendance of an obvious control line and the non-binding of other viral particles (e.g. vesicular stomatitis virus), made these test systems reliable and powerful for diagnosing A, Asia 1 and O serotypes. Signals were obviously detected after 5-10 minutes. To receive acceptable signal strength within desired time range, 1:10 was a maximum dilution. Lower dilutions gave stronger signals, but included the disadvantage of not being viable in field testing, while higher dilutions than 10x makes the test lose in sensitivity. All signal values are presented in Appendix 1.
23
0
1
2
3
2,01000
1,51000
1,01000
0,51000
2,0 400
1,5 400
1,0 400
0,5 400
Membrane mAb conc [mg/ml] / conjugate mAb [µg]
Aver
age
sign
al [a
.u.]
2A4
1F10
5H5
0
1
2
3
A Asia 1 C O SAT-1 SAT-2 SAT-3 Neg
Sample
Sign
al [a
.u.] 2A4
5H5
1F10
Figure 9. Signals for test samples diluted 1:10, results interpreted after 10 minutes (a): Average signal (arbitrary units) at different concentrations of mAb (mg/ml) and different amounts of mAb in conjugate (µg). These average values are calculated from A, Asia 1 and O samples; SAT-2 values are excluded.(b): Signals for all seven serotypes at optimised mAb concentrations and mAb amount in conjugate (2,0 mg/ml and 1000 µg for αFMDV 5H5 and αFMDV 1F10; 1,0 mg/ml and 400 µg for αFMDV 2A4).
None of the mAbs did recognize the SAT-2 serotype. αFMDV 5F10 did not recognize any of A, Asia 1, O or SAT-2 serotypes in the first assays and was therefore excluded in subsequent lateral flow experiments with latex conjugates. Most of these subsequent tests were following the same procedure, aiming at verifying and validating earlier results. However, many of them gave weak and slow signals, even if the assays looked very similar to previous experiments. This lead to the searching for potential systematic errors and raised the question if the latex conjugate was stable enough in this type of system. Despite large numbers of approaches to find a failing agent, including membrane analysis, coupling and application of latex conjugates, material storage, sample dilution and tests with different antigen batches, no clear reason was found.

24
Figure 10. Dilution series of gold conjugate lateral flow devices. From left to right dilutions 1:10, 1:20, 1:40 and 1:80. Samples were of type A5 Allier (6/11/90) and detected with αFMDV 1F10.
5.2.2 Gold conjugate devices As a comparison to the latex-based system, a system with gold particles as detector agent was developed. This was of special interest due to the sometimes non-functional latex devices. The gold-based systems showed a higher quality from the tests performed. These were too few to draw conclusions, but did confirm that colloidal gold can be used as a detector particle. Only one of the mAbs (αFMDV 1F10) was tested as capturing agent and from the few tests carried out it seemed to be at least the same reliability as the latex-based system. Still there was no signal for the SAT-2 serotype, but all other tested serotypes (A, Asia 1 and O) gave clear and fast signals. Since the gold coupling was passive, i.e. without covalent binding, it was only stable for a few days. Dilution series showed that a dilution of 1:10 is preferable (Figure 10) to higher dilutions. Moreover, the use of acceleration buffer in the samples was crucial for receiving a fast and strong signal. Samples excluding this buffer gave weak signals and a very slow flow on the membrane.
5.2.3 Stability tests These were performed only in the latex-based system. The stability tests gave some answers about test quality after storage, and also how sonication times and storage temperatures affected the results. Nevertheless, there are few results and it is difficult to draw any unquestionable conclusions. The storage does not seem to affect the test control within a 27-day period, neither does the storage temperature. What can be seen from the tests performed is that 2x15 seconds sonication time is higher performance than 2x30 seconds. The average score at 2x15 seconds sonication was 2.9, and for 2x30 seconds 2.3. For the shorter sonication durations (3x10 seconds and 6x5 seconds) the sample flow was obviously decreased and a vast majority of the conjugate complexes did not pass the test zone. This was especially true for conjugates exposed to 6x5 seconds of sonication. The reason might be conformational changes in antibody-detector particle complexes when repeating the sonication too many times, which may lead to binding to the nitrocellulose membrane. About the weaker signals for 2x30 seconds, it is probable that the long sonication time results in damage of the complexes. This will due to the lower ratio of antibody-latex complex lead to a weaker signal.
5.2.4 Tests with live viruses The tests with live virus isolates were performed at Pirbright Laboratory. The results were well corresponding to the tests with inactivated viruses, even if the signals were interpreted to be a little bit stronger. Serotypes A, Asia 1, C and O gave clear signals, while the three SAT serotypes gave weaker signals. Unfortunately, αFMDV 1F10 gave a positive signal for a non detected virus (NDV) sample, indicating that non-specific binding did occur, a fact that decreases the reliability of the test. The testing was performed with samples diluted 1:2, and with a variety of subclasses (Figure 11). Interestingly, subclasses within the same serotype gave different signal strength. However, this observation is not definite due to the small number samples tested and these results should be seen as a first-step analysis of lateral flow devices and far away from statistical significant; to draw such conclusions much more testing needs to be performed.

25
0
1
2
3
O O
SA
T1
SA
T1
SA
T1
SA
T1
SA
T2
SA
T2
SA
T2
SA
T 2S
AT 3
SA
T 3
SVD
V
SVD
V
NV
D
SAU1/02
KEN6/02
BOT2/68
KEN1/05
TAN36/99
BUN2/99
KEN7/04
CAR5/00
SAU4/00
KEN10/04
SAR7/80
ZIM6/91
UKG64/75
ITL4/77
IRL3/05
Samples
Sig
nal s
treng
th [a
.u.]
2A41F105H5
0
1
2
3
A A A A Asia1
Asia1
Asia1
Asia1
C C C C O O O
SYR8/02
BHU27/03
MAY3/03
ARG3/01
GRE2/00
IRN31/04
TUR3/00
BAN2/96
BAN1/92
PHI3/88
ARG4/84
CEY1/74
TAW84/97
BAN3/96
IRN12/03
Samples
Sign
al s
treng
th [a
.u.]
2A4
1F10
5H5
0
1
2
3
A Asia 1 C O SAT-1 SAT-2 SAT-3 SVDV NVD
serotype
aver
age
sign
al [a
.u.]
0
1
2
3
AAsia
1 C OSAT-1
SAT-2SAT-3
SVDVNVD
Samples
aver
age
sign
al [a
.u.]
2A4
1F10
5H5
(a)
(b)
(c)
(d)
Figure 11. (a) and (b): Signal strength (arbitrary units) from tests with live virus isolates of various serotypes and subclasses with mAbs αFMDV 2A4 (1,0 mg/ml membrane concentration, 400 µg in conjugate complex), αFMDV 5H5 (2,0 mg/ml; 1000 µg) and αFMDV 1F10 (2,0 mg/ml, 1000 µg). Results were interpreted after ca 1 hour. Swine vesucular disease virus (SVDV) and non- detected-virus sample (NDV) were used as negative controls. (c): Average signal (arbitrary units) for different serotypes. (d): Average signal (arbitrary units) for serotypes with different detection mAbs. All virus samples were diluted 1:2.
26
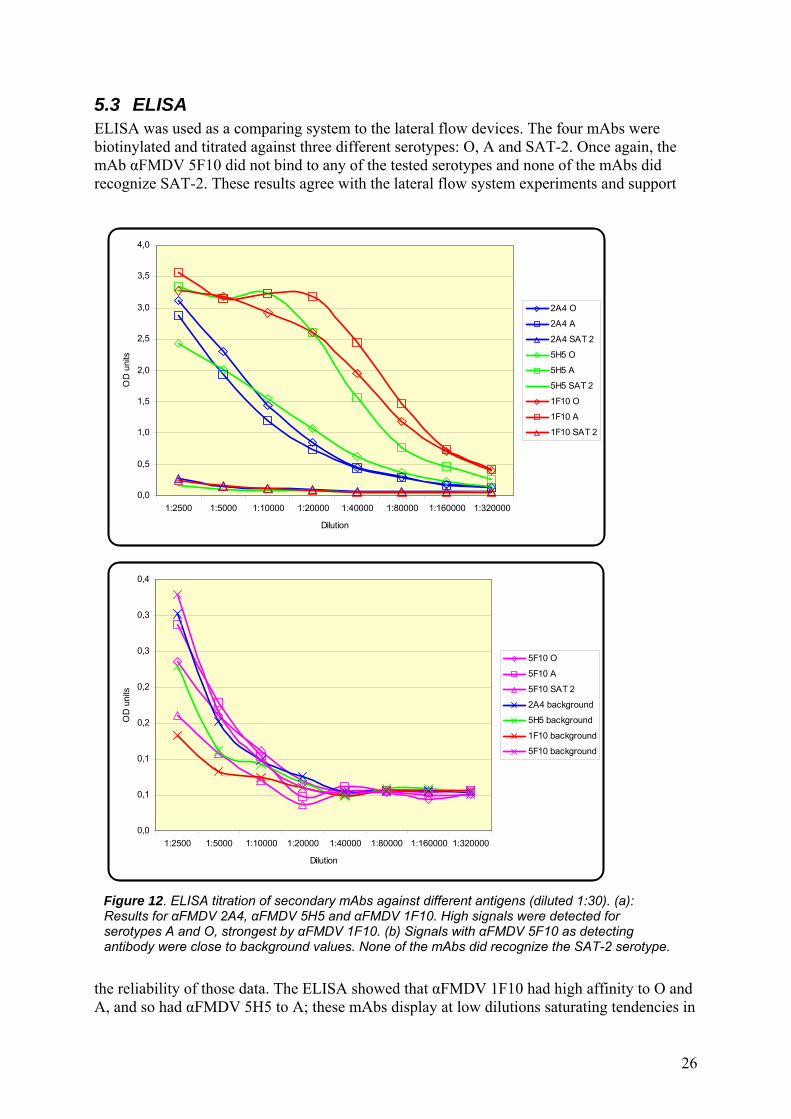
5.3 ELISA ELISA was used as a comparing system to the lateral flow devices. The four mAbs were biotinylated and titrated against three different serotypes: O, A and SAT-2. Once again, the mAb αFMDV 5F10 did not bind to any of the tested serotypes and none of the mAbs did recognize SAT-2. These results agree with the lateral flow system experiments and support
the reliability of those data. The ELISA showed that αFMDV 1F10 had high affinity to O and A, and so had αFMDV 5H5 to A; these mAbs display at low dilutions saturating tendencies in
0,0
0,5
1,0
1,5
2,0
2,5
3,0
3,5
4,0
1:2500 1:5000 1:10000 1:20000 1:40000 1:80000 1:160000 1:320000
Dilution
OD
uni
ts
2A4 O
2A4 A
2A4 SAT 2
5H5 O
5H5 A
5H5 SAT 2
1F10 O
1F10 A
1F10 SAT 2
0,0
0,1
0,1
0,2
0,2
0,3
0,3
0,4
1:2500 1:5000 1:10000 1:20000 1:40000 1:80000 1:160000 1:320000
Dilution
OD
uni
ts
5F10 O
5F10 A
5F10 SAT 2
2A4 background
5H5 background
1F10 background
5F10 background
Figure 12. ELISA titration of secondary mAbs against different antigens (diluted 1:30). (a): Results for αFMDV 2A4, αFMDV 5H5 and αFMDV 1F10. High signals were detected for serotypes A and O, strongest by αFMDV 1F10. (b) Signals with αFMDV 5F10 as detecting antibody were close to background values. None of the mAbs did recognize the SAT-2 serotype.
27
26
28
30
32
34
36
A Asia 1 O SAT 2 NegSample
Ct v
alue
10X
500x
Figure 13. Results from PLA. All serotypes were detected with αFMDV 1F10. A, Asia 1 and O gave clear signals, while SAT-2 signal was in the range of background values.
the system, meaning that all exposed virus particles are occupied by biotinylated mAbs (Figure 12). αFMDV 2A4 displayed a smaller affinity to O and A, and αFMDV 5H5 to O, but still far more than the background values. Interestingly, there is still a significant signal at dilutions of 40 000-80 000, demonstrating the high sensitivity of ELISA.
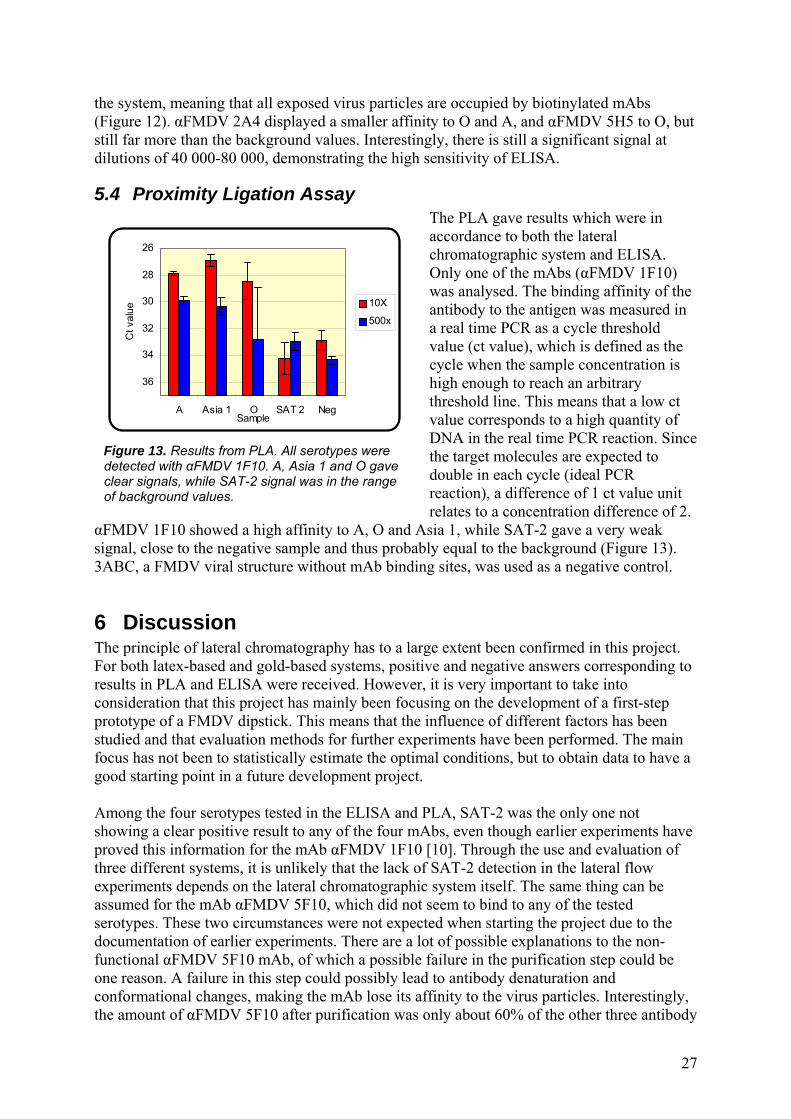
5.4 Proximity Ligation Assay The PLA gave results which were in accordance to both the lateral chromatographic system and ELISA. Only one of the mAbs (αFMDV 1F10) was analysed. The binding affinity of the antibody to the antigen was measured in a real time PCR as a cycle threshold value (ct value), which is defined as the cycle when the sample concentration is high enough to reach an arbitrary threshold line. This means that a low ct value corresponds to a high quantity of DNA in the real time PCR reaction. Since the target molecules are expected to double in each cycle (ideal PCR reaction), a difference of 1 ct value unit relates to a concentration difference of 2.
αFMDV 1F10 showed a high affinity to A, O and Asia 1, while SAT-2 gave a very weak signal, close to the negative sample and thus probably equal to the background (Figure 13). 3ABC, a FMDV viral structure without mAb binding sites, was used as a negative control.
6 Discussion The principle of lateral chromatography has to a large extent been confirmed in this project. For both latex-based and gold-based systems, positive and negative answers corresponding to results in PLA and ELISA were received. However, it is very important to take into consideration that this project has mainly been focusing on the development of a first-step prototype of a FMDV dipstick. This means that the influence of different factors has been studied and that evaluation methods for further experiments have been performed. The main focus has not been to statistically estimate the optimal conditions, but to obtain data to have a good starting point in a future development project. Among the four serotypes tested in the ELISA and PLA, SAT-2 was the only one not showing a clear positive result to any of the four mAbs, even though earlier experiments have proved this information for the mAb αFMDV 1F10 [10]. Through the use and evaluation of three different systems, it is unlikely that the lack of SAT-2 detection in the lateral flow experiments depends on the lateral chromatographic system itself. The same thing can be assumed for the mAb αFMDV 5F10, which did not seem to bind to any of the tested serotypes. These two circumstances were not expected when starting the project due to the documentation of earlier experiments. There are a lot of possible explanations to the non-functional αFMDV 5F10 mAb, of which a possible failure in the purification step could be one reason. A failure in this step could possibly lead to antibody denaturation and conformational changes, making the mAb lose its affinity to the virus particles. Interestingly, the amount of αFMDV 5F10 after purification was only about 60% of the other three antibody
28
quantities (Table 4), raising the possibility that something went wrong during the purification step. On the other hand, it was purified at the same time and in the same manner as the other mAbs, contradicting systematic errors in this process. The fact that αFMDV 5F10 was detected in the verification experiments (Figure 6) also shows that this mAb was present after purification, although it was in a smaller amount. Another conceivable reason to the low virus affinity could be a poor ascites sample, from where the mAb was purified. Not surprisingly, these results were obtained with both latex-based and gold-based lateral chromatographic systems, as the detector particles should not affect to the binding if the coupling procedure has turned out well. Regarding the lack of SAT-2 detection, no distinct explanation could be seen. Since it was not detected in any of the three systems, the sample batch may have been of bad quality or exposed to conditions inducing conformational changes in the virus structure. The development of lateral flow devices includes a lot of steps, which all need to be performed in the right way to reach a good final result. It is therefore of importance to notice, that only one single mistake in one of the steps may lead to undesired effects in the system, and to the difficulty to locate the wrong-performed step or steps. Some of these potential error steps may be the antibody immobilization, the conjugate application, inappropriate flow on the membrane due to conjugate aggregation, non-specific binding or incorrect storage conditions for the components. Lateral chromatography, the method which this system is built upon, is in the right conditions a well-established method and there should not be any doubts about its potential. But still, a lot of the final result relies on the ability to design the experiment in a skilful way and to understand what critical points the system contains. Lateral flow devices intended to detect human or animal diseases have been developed since the 1980s, but for every new task there are normally new circumstances, leading each project to take new aspects into consideration. Of course, with the right conclusions, most of the problems can be solved theoretically, such as finding a good panel of mAbs, to use a membrane with the right conditions etc. However, in many cases of lateral flow device development, plenty of empiric experiments need to be performed to confirm the assumptions and to investigate the performance in real conditions. As a first approach in this project, a latex-based system was developed. It gave a lot of reliable test results and in general the system worked as expected, with respect to the theory of lateral chromatography. Results from ELISA and PLA showed similar results, clearly agreeing with the results from the lateral flow devices. It was however necessary to investigate how to adjust the system to achieve improvements of the detection. Moreover there is a need of numerous tests, since a system has to show statistical stability to be considered as reliable. Unfortunately, further tests with latex-based systems did not show the same accuracy; the signals got weaker and a clear test line did not appear until 20-30 minutes after sample loading, sometimes even longer time elapsed. With the earlier results in mind, this fact indicated that something was wrong, or at least that some part of the system could be improved; a statement which raised the question of finding a probable error in the developing steps. This is a task which may take a lot of time, since there are plenty of steps before the final product. To avoid a too big time consumption the analysis and understanding of the system components are of high importance. Ideally, a multivariate analysis would have been performed, aiming to decrease both time and material consumption. A potential and possible reason to the slow and weak results is the aggregation of the latex conjugates. In case of this incident, conjugates will form big complexes unable to reach an appropriate flow rate through the membrane pores. This hypothesis was tested by treating the latex conjugates with an increased sonication time, even if this is a risky method due to the

29
possible damage of antibody-latex complexes leading to lack of signal in the system. With respect to the received results, this probably explains why 2x15 seconds sonication gave better results than 2x30 seconds. Going the other way around and use membranes with large pores might also eliminate this problem, but at the same time larger pores also provides the non-complex formations to migrate very fast through the membrane and thus not contribute to a stronger signal. Another potential reason to the slow migration is the difficulties with conjugate release from the conjugate pad. The first suggestion that the pressure from the plastic housing was affecting the release was later eliminated since devices without housing showed the same lack of ability. The test signal strength is the most important outcome of the test. Ideally, a test should give a strict positive or a strict negative answer, and even if the test lines in most of the tests showed a distinguished answer, the line differed in strength. If having the possibility to measure the amount of conjugate-virus complex bound to the capture antibody, the system would definitely be even more reliable and useful. In this case, settings of standard values for a particular serotype would make it easier to draw conclusions and confirm results. Differences in test line strength may also be due to the illness grade of the animal and in what phase of the infection the test is performed. However, exact measurement of test line strength would probably make the need of more advanced equipment, which thereby would make the test system less attractive to the field veterinarian. The quickness of the test would also be decreased, since it will then include additional diagnosing steps, probably at specialiced laboratories. But even if the quickness is an important parameter in this system, the reliability always needs to be in the priority position, making it necessary to strive for measuring the test line exactly and not subjectively by the eye. In the developing and testing steps, the possibility to exact measurement also is of high importance. Exact values would make it easier to draw conclusions with a better consistency, which can further lead to a powerful optimisation of the system. From a statistical point of view, an approach with subjective evaluation is not good enough to find the optimal conditions of the system. Moreover, error estimation is difficult to do before having exact measurement values.
7 Acknowledgements I would like to thank Katarina Persson for her very kind and patient supervision throughout the project. Many thanks to everyone at Svanova for their support and practical advice, which have helped me a lot during my laboratory work. I would also like to thank Andreas Cederlund for guiding me through the PLA experiments at Rudbeck laboratory. Finally, thanks to my scientific reviewer Malik Merza for valuable feedback on the report.

30
8 References
1. Foot-and-mouth disease: scientific problems and recent progress 1st annual report (2003) prepared for DEFRA, Science Directorate.
2. Diagnostic Techniques and Vaccines for Foot-and-Mouth Disease, Classical Swine Fever, Avain Influenza and some other important OIE List A Diseases.
3. Brownlie, J, Sibley, D., (2001). Foot and mouth – do we vaccinate or not. Veterinary Times 10L, 290c.
4. Knowles, N.J., Samuel, A.R., Molecular epidemiology of foot-and-mouth disease virus (2002). Virus Research 21, 65-80.
5. Reid, S.M., Ferris, N.P., Brüning, A., Hutchings, G.H., Kowalska, Z., Åkerblom, L., (2001). Development of a rapid chromatographic strip test for the pen-side detection of foot-and-mouth disease virus antigen. Journal of Virological Methods 96, 189-202.
6. Roitt, I., Brostoff, J., Male, D.. Immunology, 5th edition, 1998. Mosby international ltd, London.
7. Mowrey, C.M., (2001). Influence of feeding cooled colostrums or colostrums replacement on IgG levels and evaluation of animal plasma as a milk replacer protein source.
8. Campbell, N.A., Biology, 6th edition, 1996. Pearson Education, San Fransisco. 9. Aggarwal, N., Barnett, P.V., (2002). Antigenic sites of foot-and-mouth disease virus
(FMDV): an analysis of the specificities of anti-FMDV antibodies after vaccination of naturally susceptible host species. Journal of General Virology 83, 775-782.
10. Grazioli, S., Fallacara, F., Brocchi, E., (2004). Mapping of neutralising sites on FMD virus type Asia 1 and relationships with sites described in other serotypes. Instituto Zooprofilattico Sperimentale, Brescia, Italy.
11. Madigan, M.T., Martinko, J.M., Parker, J.. Brock Biology of Microorganisms, 9th edition, 2000. Prentice Hall, New Jersey.
12. Pacheco, J.M., Henry, T.M., O’Donnel, V.K., Gregory, J.B., Mason, P.W., (2003). Role of nonstructural proteins 3A and 3B in host range and pathogenicity of foot-and-mouth disease virus. Journal of Virology 77(24):13017-27.
13. Vosloo, W., Knowles, N.J., Thomson, G.R., (1992). Genetic relationships between southern African SAT-2 isolates of foot-and-mouth disease virus. Epidemiol Infect 109, 547-558.
14. Grubman, M.J., Zellner, M., Wagner, J., (1987). Antigenic comparison of the polypeptides of foot-and-mouth disease virus serotypes and other picornaviruses. Virology 158, 133-140.
15. Foot and mouth disease Chapter 2.1.1. of the OIE Manual of Standards for Diagnostic Tests and Vaccines, adopted May 2005.
16. Knowles, N.J., Samuel, A.R., Davies, P.R., Midgley, R.J., Valarcher, J., (2005). Pandemic strain of foot-and-mouth disease virus serotype O. Emerging Infextious Diseases.
17. Acharya, R., Fry, E., Stuart, D., Fox, G., Rowlands, D., Brown, F., (1989). The three-dimensional structure of foot-and-mouth disease virus at 2.9 Å resolution. Nature 337, 709-716.
18. Jackson, T., King, A.M.Q., Stuart, D.I., Fry, E., (2003). Structure and receptor binding. Virus Research 91:33-46.
31
19. Freiberg, B., Rahman, Mostafizur M., Marquardt, O., (1999). Genetical and Immunological Analysis of Recent Asian Type A and O Foot-and-Mouth Disease Virus Isolates. Virus Genes 19:3, 167-182.
20. Donnelly, M.L.L., Luke, G., Mehrotra, A., Li, X., Lorraine, E.H., Gani, D., Ryan, M. D., (2001). Analysis of the aphthovirus 2A/2B polyprotein ‘cleavage’ mechanism indicates not a proteolytic reaction, but a novel translational effect: a putative ribosomal ‘skip’. Journal of General Virology, 82:1013-1025.
21. Carillo, C., Tulman, E.R., Delhon, G., Lu, Z., Carreno, A., Vagnozzi, A., Kutish, G.F., Rock, D.L., (2005). Comparative Genomics of Foot-and-Mouth Disease Virus. Journal of Virology 79:10, 6487-6507.
22. Birtley, J.R., Curry, S., 2004. Crystal structure analysis of a picornaviral protease. 23. Vakharia, V., Devaney, D.M., Moore, D.M., Dunn, J.J., Frubman, M.J., (1987).
Proteolytic processing of foot-and-mouth disease virus polyproteins expressed in a cell-freee system from clone derived transcripts. Journal of Virology 61:3199-3207.
24. Lopez de Quinto, S., Martinez-Salas, E., (2000). Interaction of the eIF4G initiation factor with the aphthovirus IRES is essential for internal translation initiation in vivo. RNA 6:1380-1392.
25. Moffat, K., Howell, G., Knox,C., Belsham, G.J., Monaghan, P., Ryan, M.D., Wileman, T., (2004). Effects of Foot-and-Mouth Disease Virus Nonstructural Proteins on the Structure and Function of the Early Secretory Pathway: 2BC but Not 3A Blocks Endoplasmic Reticulum-to-Golgi Transport. Journal of Virology, 79(7):4382-4395.
26. Pacheco, J.M., Henry, T.M., O’Donnel, V.K., Gregory, J.B., Mason, P.W., (2003). Role of nonstructural proteins 3A and 3B in host range and pathogenicity of foot-and-mouth disease virus. Journal of Virology 77(24):13017-27.
27. Beard, C. W., Mason, P.W., (2000). Genetic determinants of altered virulence of Taiwanese foot-and-mouth disease virus. J. Virol. 74:987-991.
28. Dunn, C. S., Donaldson, A.I., (1997). Natural adaption to pigs of a Taiwanese isolate of foot-and-mouth disease virus. Veterinary Record. 141:174-175.
29. Falk, M. M., Sobrino F., Beck, E., (1992). VPg gene amplification correlates with infective particle formation in foot-and-mouth disease virus. Journal of Virology 66:2251-2260.
30. King, A. M. Q., McCahon, D., Slade, W.R., Newman, J.W.I., (1982). Recombination in RNA. Cell 29:921-928.
31. Cheung, A., DeLamarter, J, Weiss, S., Küpper, H., (1983). Comparison of the major antigenic site determinants of different serotypes of foot-and-mouth disease virus, Journal of Virology 48, 451-459.
32. Reid, S.M., Forsyth, M.A., Hutchings, G.H., Ferris, N.P., (1997). Comparison of reverse transciption polymerase chain reaction, enzyme linked immunosorbent assay and virus isolation for the routine diagnosis of foot-and-mouth disease. Journal of Virology Methods 70:213-217.
33. Rapid Lateral Flow Test Strips – considerations for product development, (2002). Publication from Millipore Corporation, Bedford, MA.
34. Harvey, M.A., (1991). Optimization of Nitrocellulose Membrane Based Immunoassays. Publication from Schleicher & Schuell, Keene, New Hampshire.
35. Jones, K.D., (1999). Troubleshooting protein binding in nitrocellulose membranes. IVD Technology 5, 32-42.
36. Chandler, J., Gurmin, T., Robinson, N., (2000). The place of gold in rapid tests. IVD Technology 6, 37-49.

32
37. Wessling, B., (1996). Conductive Polymer / Solvent Systems: Solutions or Dispersions.
38. Chandler, J., Robinson, N., Whitling, K., (2001). Handling false signals in gold-based rapid tests. IVD Technology 7, 34-45.
39. Brooks, D.E., Olal, A.D., (1996). Protein adsorption and coupling to latexed, parts 1 & 2. Published in The Latex Course 1996.
40. Norde, W., (1986). Advances in Colloid and Interface. Science 25:267-340. 41. Bangs, L.B., (1996). Immunological Applications of Microspheres. Published in The
Latex Course 1996. 42. Sackrison, J. L., (1996) Covalent coupling and Diagnostic Development Using
Microspheres. Published in The Latex Course 1996. 43. Rueda, P., Fominaya, J., Langevald, J. P. M., Bruschke, C., Vela, C., Casal, I.,
(2000). Effect on different baculovirus inactivation procedures on the integrity and immunogenicity of porcine parvovirus-like particles. Vaccine 19:2001 (726-734).

33
9 Appendix
9.1 Appendix 1 Signal strength for mAbs tested against different serotypes at different membrane concentrations (mg/ml) and mAb amount in conjugate (µg).
0
1
2
3
2,01000
1,51000
1,01000
0,51000
2,0400
1,5400
1,0400
0,5400
A A A A A A A A
Sample
Sig
nal [
a.u.
]
2A4Neg 2A41F10Neg 1F10 5H5 Neg 5H5
0
1
2
3
2,01000
1,51000
1,01000
0,51000
2,0 400 1,5 400 1,0 400 0,5 400
Asia 1 Asia 1 Asia 1 Asia 1 Asia 1 Asia 1 Asia 1 Asia 1
Samples
Sig
nal [
a.u.
]
2A4Neg 2A41F10Neg 1F10 5H5 Neg 5H5

34
0
1
2
3
2,01000
1,51000
1,01000
0,51000
2,0400
1,5400
1,0400
0,5400
O O O O O O O O
Sample
Sig
nal [
a.u.
]
2A4Neg 2A41F10Neg 1F10 5H5 Neg 5H5
0
1
2
3
2,01000
1,51000
1,01000
0,51000
2,0 400
1,5 400
1,0 400
0,5 400
SAT-2 SAT-2 SAT-2 SAT-2 SAT-2 SAT-2 SAT-2 SAT-2
Sample
Sig
nal [
a.u]
2A4Neg 2A41F10Neg 1F10 5H5 Neg 5H5