STUDENT WORKBOOK QNET Mechatronic Sensors Trainer of NI ...
17
STUDENT WORKBOOK QNET Mechatronic Sensors Trainer of NI ELVIS PART 1 CONTROL AND INSTRUMENTATION LABORATORY DEPARTMENT OF ELECTRICAL ENGINEERING AND INFORMATION TECHNOLOGY UNIVERSITAS GADJAH MADA
Transcript of STUDENT WORKBOOK QNET Mechatronic Sensors Trainer of NI ...

STUDENT WORKBOOK
QNET Mechatronic Sensors Trainer of NI ELVIS
PART 1
CONTROL AND INSTRUMENTATION LABORATORY
DEPARTMENT OF ELECTRICAL ENGINEERING AND INFORMATION TECHNOLOGY
UNIVERSITAS GADJAH MADA
QNET MECHKIT WorkBook CONTROL AND INSTRUMENTATION LABORATORY DEPARTMENT OF ELECTRICAL ENGINEERING AND INFORMATION TECHNOLOGY UNIVERSITAS GADJAH MADA
1 INTRODUCTION
Mechatronics engineering is a cross-disciplinary field that combines mechanical and electronic design
in control systems architecture though the application of computer programming. One of the most useful
topics that can be covered in an introductory mechatronics course is the understanding and application
of sensors. Various sensors are used in all types of industries. For example, in the automotive industry
magnetic field transducers are used for throttle, pedal, suspension, and valve position sensing. In
assembly line and machine automation, optical sensors are used for non-contact position sensing and
safety. Piezo film sensors are installed in packages to log vibration history of a shipment.
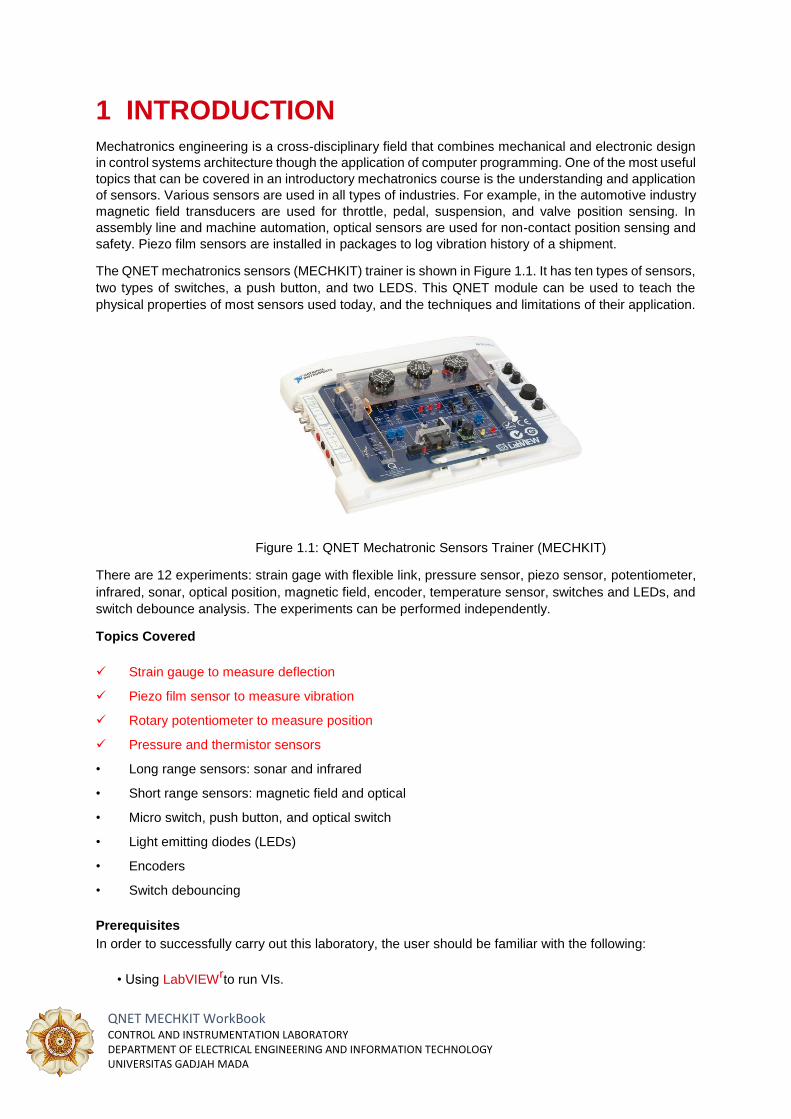
The QNET mechatronics sensors (MECHKIT) trainer is shown in Figure 1.1. It has ten types of sensors,
two types of switches, a push button, and two LEDS. This QNET module can be used to teach the
physical properties of most sensors used today, and the techniques and limitations of their application.
Figure 1.1: QNET Mechatronic Sensors Trainer (MECHKIT)
There are 12 experiments: strain gage with flexible link, pressure sensor, piezo sensor, potentiometer,
infrared, sonar, optical position, magnetic field, encoder, temperature sensor, switches and LEDs, and
switch debounce analysis. The experiments can be performed independently.
Topics Covered
Strain gauge to measure deflection Piezo film sensor to measure vibration Rotary potentiometer to measure position Pressure and thermistor sensors • Long range sensors: sonar and infrared • Short range sensors: magnetic field and optical • Micro switch, push button, and optical switch • Light emitting diodes (LEDs) • Encoders • Switch debouncing
Prerequisites In order to successfully carry out this laboratory, the user should be familiar with the following:
• Using LabVIEWrto run VIs.
QNET MECHKIT WorkBook CONTROL AND INSTRUMENTATION LABORATORY DEPARTMENT OF ELECTRICAL ENGINEERING AND INFORMATION TECHNOLOGY UNIVERSITAS GADJAH MADA
2 SENSOR PROPERTIES
This section discusses various sensor properties that are often found in technical specifications.
2.1 Resolution
The resolution of a sensor is the minimum change that can be detected in the quantity that is being
measured. For instance a sensor that measures angular position of a motor shaft may only be able to
detect a 1 degree change. Thus if the motor moves 0.5 degrees, it will not be detected by the sensor.
Depending on the precision needed for the application, this may be adequate.
2.2 Range
Range sensors can only take measurements of a target within a certain operating range. The operating
range specifies a maximum, and sometimes also a minimum, distance where the target can be from
the sensor in order to obtain an accurate measurement. Sensors with a small range are the magnetic
field and optical position sensors. Sensor with a relatively larger range are infrared and sonar.
2.3 Absolute and Incremental
Absolute sensors detect a unique position. Incremental sensors measure a relative position that
depends on a prior position or last power on/off. For example, if an incremental rotary encoder is used
to measure the position of wheel, the encoder will measure zero every time its power is reset. If an
absolute sensor such as a rotary potentiometer is used, then it will detect the same angle regardless if
it has just been powered.
2.4 Analog Sensor Measurement
Analog sensors output a signal that correlates to the quantity it is measuring. The relationship between
the output signal of the sensor and the actual measurement varies depending on the type of sensor.
For example, the voltage measured by a potentiometer is directly proportional to the angle it is
measuring. However, the resistance of a thermistor decreases exponentially as the temperature
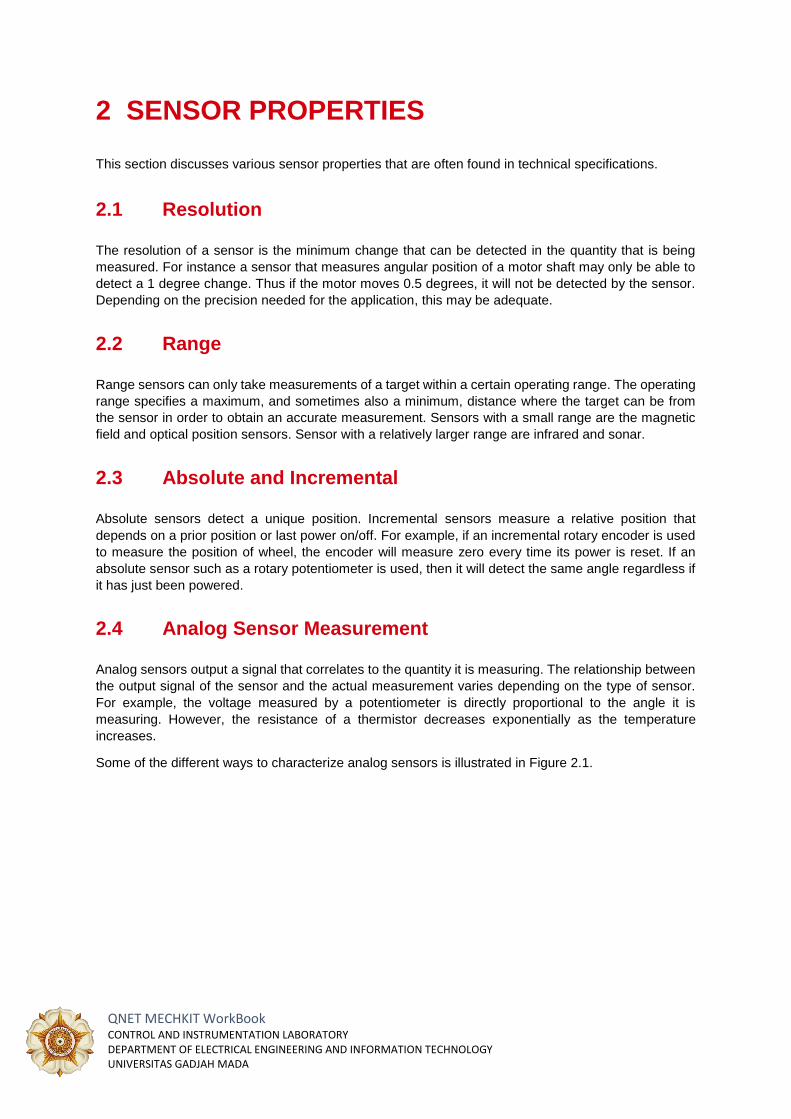
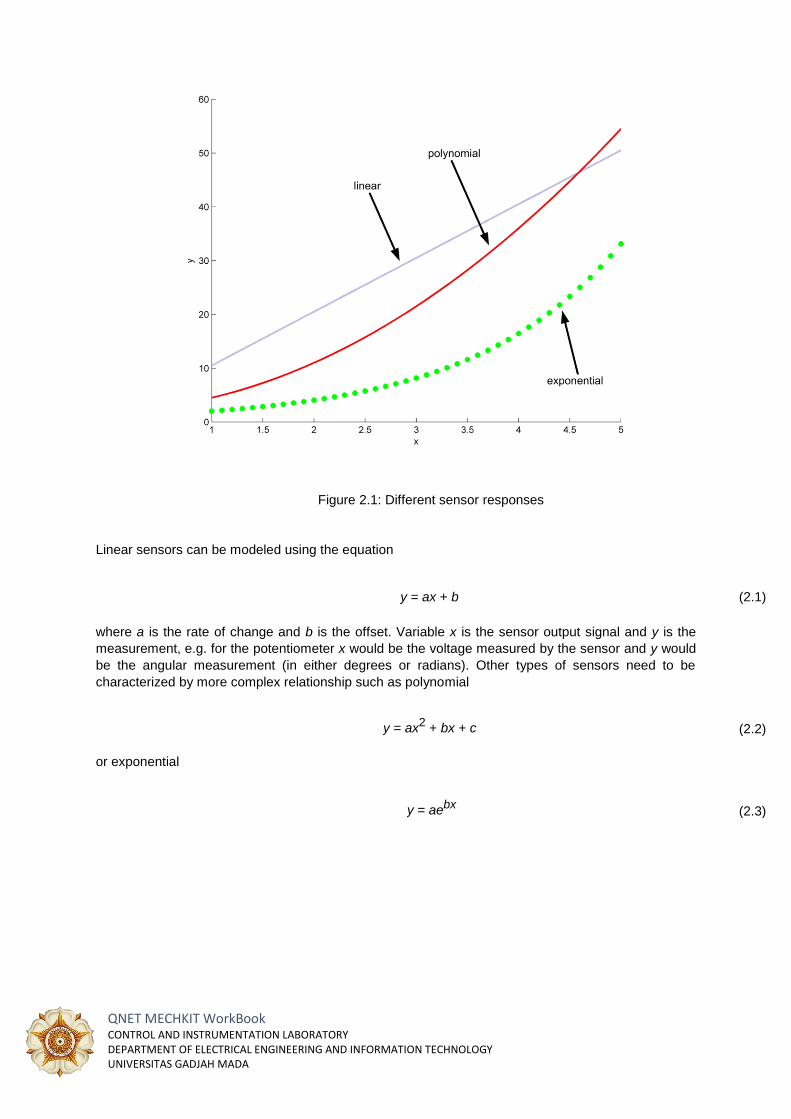
increases. Some of the different ways to characterize analog sensors is illustrated in Figure 2.1.
QNET MECHKIT WorkBook CONTROL AND INSTRUMENTATION LABORATORY DEPARTMENT OF ELECTRICAL ENGINEERING AND INFORMATION TECHNOLOGY UNIVERSITAS GADJAH MADA
Figure 2.1: Different sensor responses
Linear sensors can be modeled using the equation
y = ax + b (2.1)
where a is the rate of change and b is the offset. Variable x is the sensor output signal and y is the
measurement, e.g. for the potentiometer x would be the voltage measured by the sensor and y would
be the angular measurement (in either degrees or radians). Other types of sensors need to be
characterized by more complex relationship such as polynomial
y = ax2 + bx + c (2.2)
or exponential
y = aebx (2.3)

QNET MECHKIT WorkBook CONTROL AND INSTRUMENTATION LABORATORY DEPARTMENT OF ELECTRICAL ENGINEERING AND INFORMATION TECHNOLOGY UNIVERSITAS GADJAH MADA
QNET MECHKIT WorkBook CONTROL AND INSTRUMENTATION LABORATORY DEPARTMENT OF ELECTRICAL ENGINEERING AND INFORMATION TECHNOLOGY UNIVERSITAS GADJAH MADA
3 STRAIN GAGE WITH FLEXIBLE LINK
3.1 Background
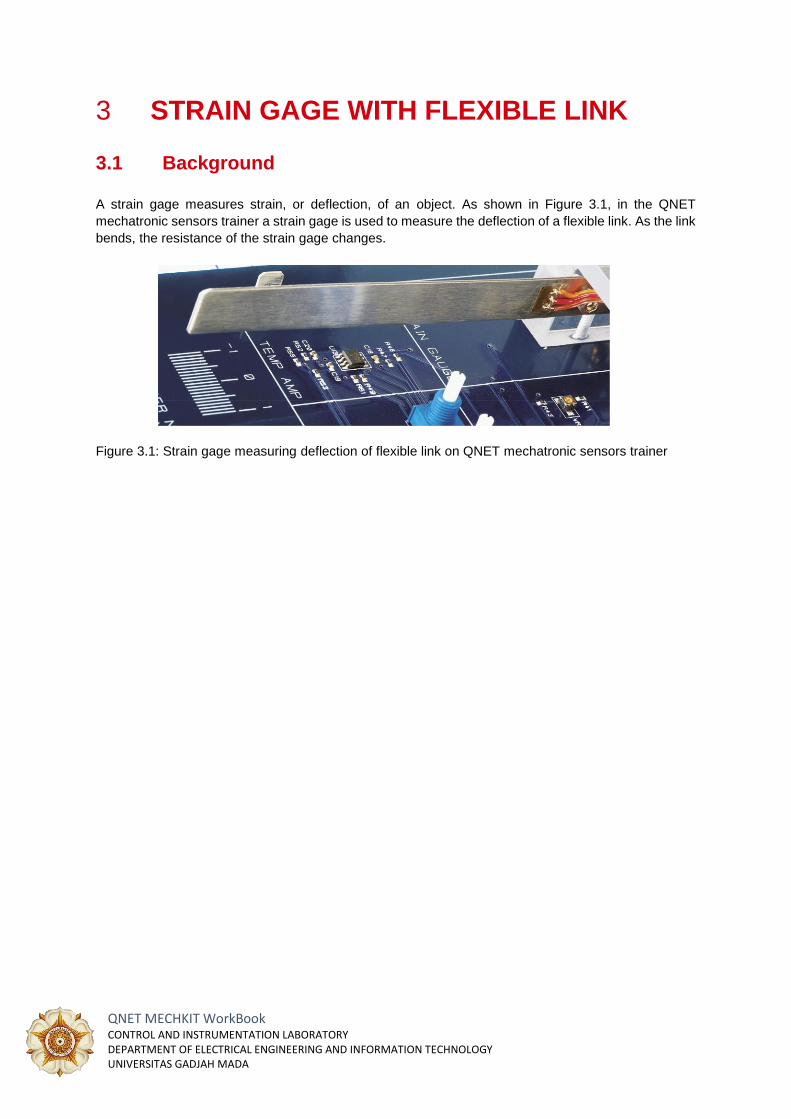
A strain gage measures strain, or deflection, of an object. As shown in Figure 3.1, in the QNET
mechatronic sensors trainer a strain gage is used to measure the deflection of a flexible link. As the link
bends, the resistance of the strain gage changes.
Figure 3.1: Strain gage measuring deflection of flexible link on QNET mechatronic sensors trainer
QNET MECHKIT WorkBook CONTROL AND INSTRUMENTATION LABORATORY DEPARTMENT OF ELECTRICAL ENGINEERING AND INFORMATION TECHNOLOGY UNIVERSITAS GADJAH MADA
3.2 Strain Virtual Instrument
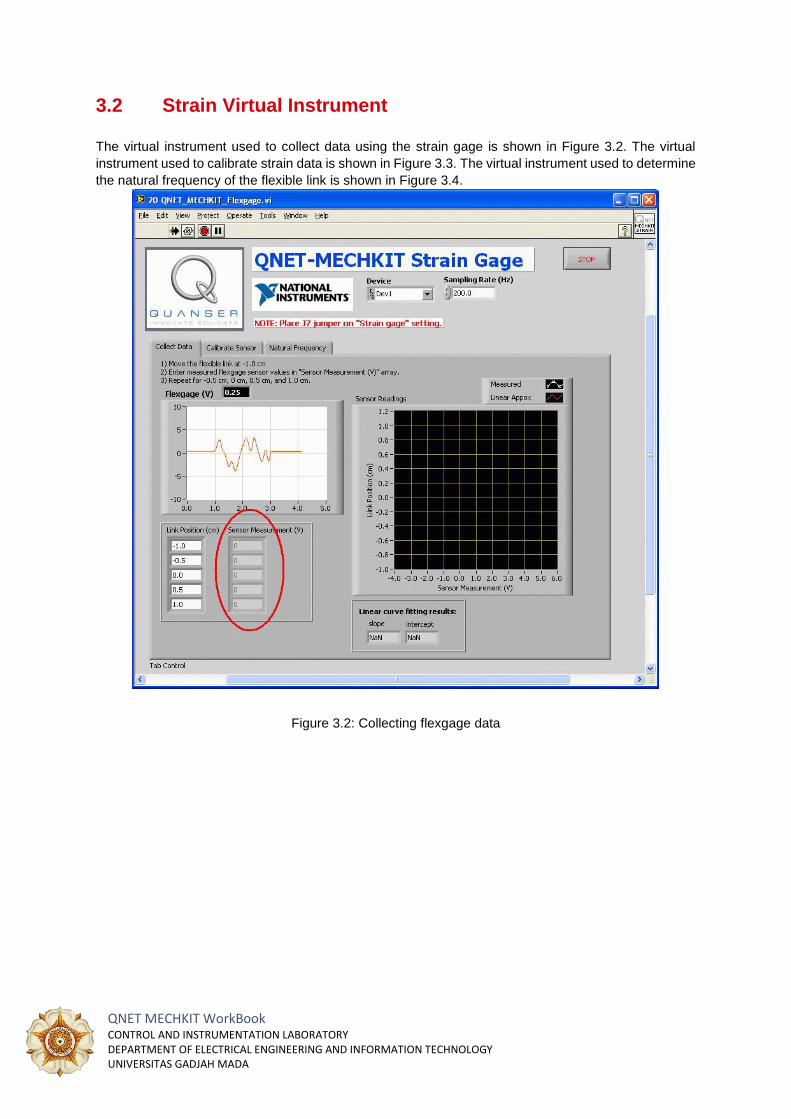
The virtual instrument used to collect data using the strain gage is shown in Figure 3.2. The virtual
instrument used to calibrate strain data is shown in Figure 3.3. The virtual instrument used to determine
the natural frequency of the flexible link is shown in Figure 3.4.
Figure 3.2: Collecting flexgage data
QNET MECHKIT WorkBook CONTROL AND INSTRUMENTATION LABORATORY DEPARTMENT OF ELECTRICAL ENGINEERING AND INFORMATION TECHNOLOGY UNIVERSITAS GADJAH MADA
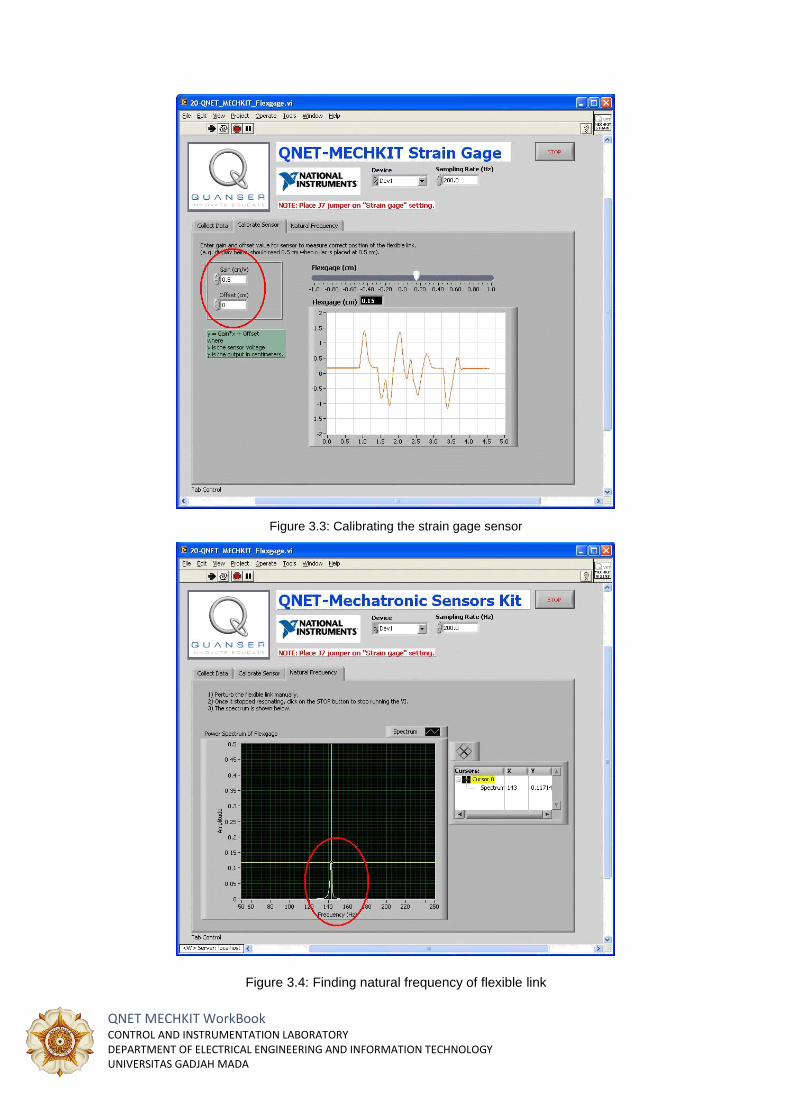
Figure 3.3: Calibrating the strain gage sensor
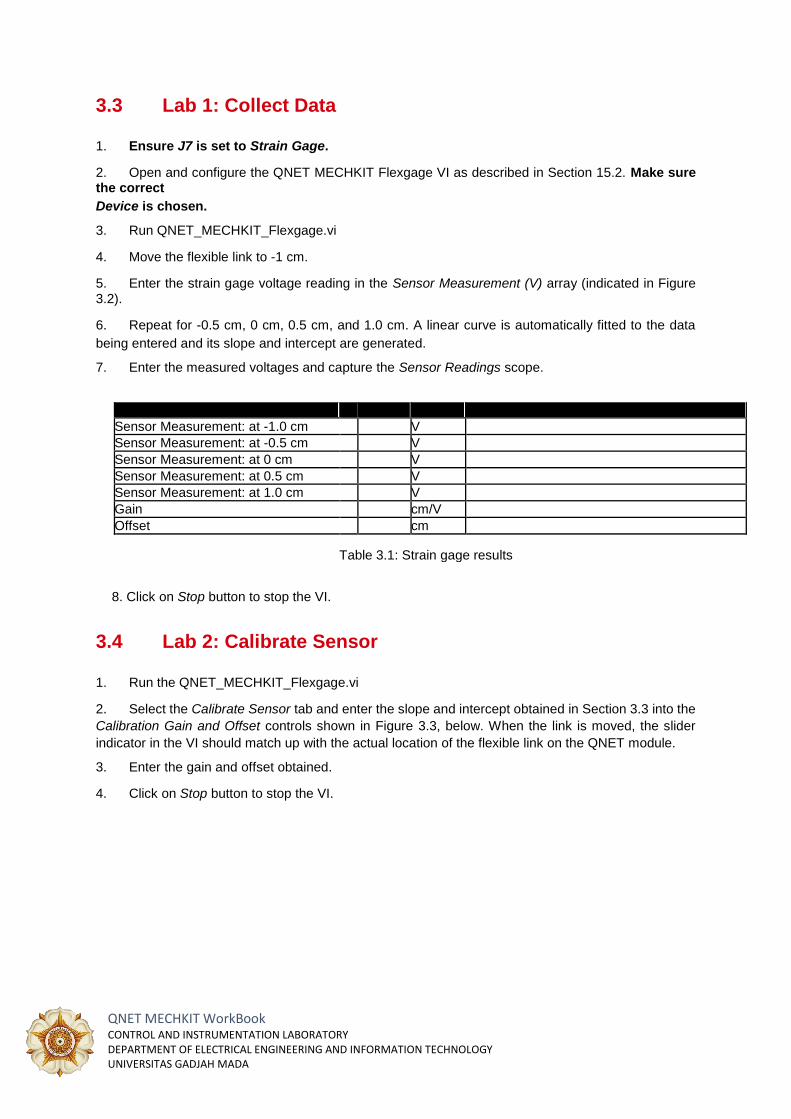
Figure 3.4: Finding natural frequency of flexible link
QNET MECHKIT WorkBook CONTROL AND INSTRUMENTATION LABORATORY DEPARTMENT OF ELECTRICAL ENGINEERING AND INFORMATION TECHNOLOGY UNIVERSITAS GADJAH MADA
3.3 Lab 1: Collect Data
1. Ensure J7 is set to Strain Gage. 2. Open and configure the QNET MECHKIT Flexgage VI as described in Section 15.2. Make sure the correct Device is chosen. 3. Run QNET_MECHKIT_Flexgage.vi 4. Move the flexible link to -1 cm. 5. Enter the strain gage voltage reading in the Sensor Measurement (V) array (indicated in Figure 3.2). 6. Repeat for -0.5 cm, 0 cm, 0.5 cm, and 1.0 cm. A linear curve is automatically fitted to the data
being entered and its slope and intercept are generated. 7. Enter the measured voltages and capture the Sensor Readings scope.
Sensor Measurement: at -1.0 cm V
Sensor Measurement: at -0.5 cm V
Sensor Measurement: at 0 cm V
Sensor Measurement: at 0.5 cm V
Sensor Measurement: at 1.0 cm V
Gain cm/V
Offset cm
Table 3.1: Strain gage results
8. Click on Stop button to stop the VI.
3.4 Lab 2: Calibrate Sensor
1. Run the QNET_MECHKIT_Flexgage.vi 2. Select the Calibrate Sensor tab and enter the slope and intercept obtained in Section 3.3 into the
Calibration Gain and Offset controls shown in Figure 3.3, below. When the link is moved, the slider
indicator in the VI should match up with the actual location of the flexible link on the QNET module. 3. Enter the gain and offset obtained. 4. Click on Stop button to stop the VI.
QNET MECHKIT WorkBook CONTROL AND INSTRUMENTATION LABORATORY DEPARTMENT OF ELECTRICAL ENGINEERING AND INFORMATION TECHNOLOGY UNIVERSITAS GADJAH MADA
3.5 Lab 3: Natural Frequency
1. Run the QNET_MECHKIT_Flexgage.vi 2. Select the Natural Frequency tab. 3. Manually perturb the flexible link and stop the VI when it stops resonating (after about 5 seconds).
The spectrum should then load in the chart, as shown in Figure 3.4 (the value shown is incorrect). 4. Enter natural frequency found and capture the resulting power spectrum response. Hint: You can
use the cursor to take measurements off the graph. 5. Click on Stop button to stop the VI.
3.6 Results
Parameter
Value Units Notes
Gain cm/V
Offset cm
Natural Frequency Hz
Table 3.2: Strain gage results summary
QNET MECHKIT WorkBook CONTROL AND INSTRUMENTATION LABORATORY DEPARTMENT OF ELECTRICAL ENGINEERING AND INFORMATION TECHNOLOGY UNIVERSITAS GADJAH MADA
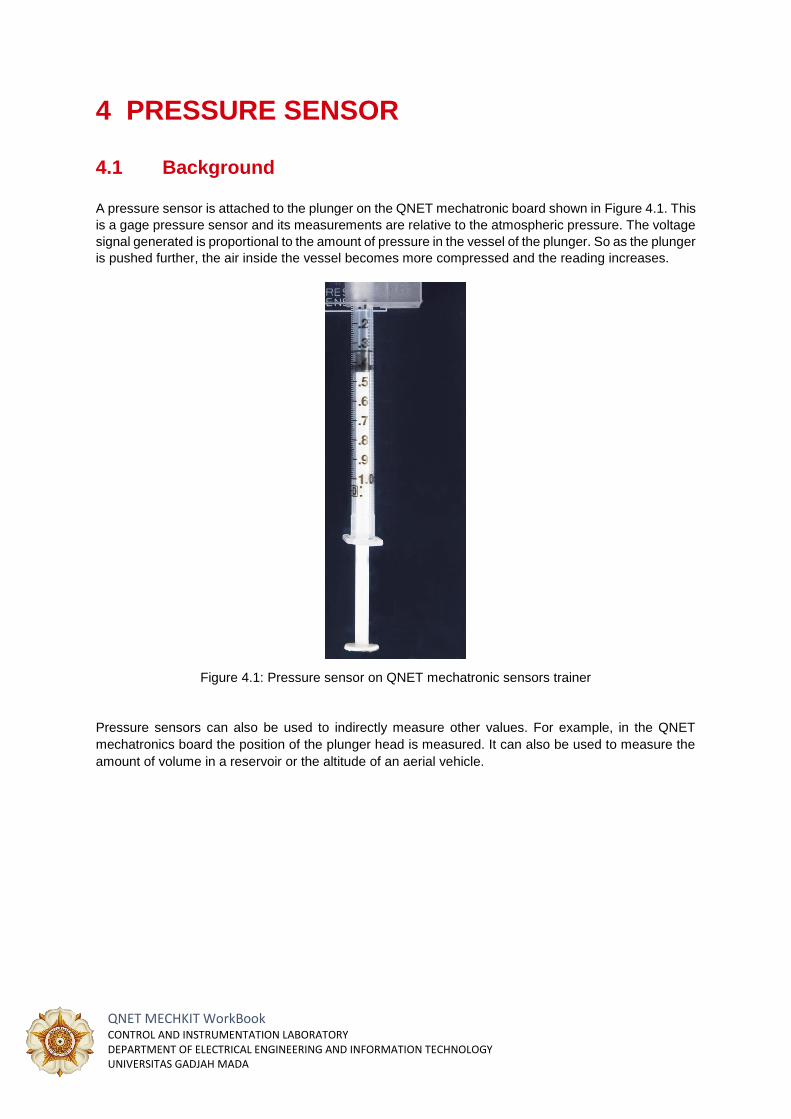
4 PRESSURE SENSOR
4.1 Background
A pressure sensor is attached to the plunger on the QNET mechatronic board shown in Figure 4.1. This
is a gage pressure sensor and its measurements are relative to the atmospheric pressure. The voltage
signal generated is proportional to the amount of pressure in the vessel of the plunger. So as the plunger
is pushed further, the air inside the vessel becomes more compressed and the reading increases.
Figure 4.1: Pressure sensor on QNET mechatronic sensors trainer
Pressure sensors can also be used to indirectly measure other values. For example, in the QNET
mechatronics board the position of the plunger head is measured. It can also be used to measure the
amount of volume in a reservoir or the altitude of an aerial vehicle.
QNET MECHKIT WorkBook CONTROL AND INSTRUMENTATION LABORATORY DEPARTMENT OF ELECTRICAL ENGINEERING AND INFORMATION TECHNOLOGY UNIVERSITAS GADJAH MADA
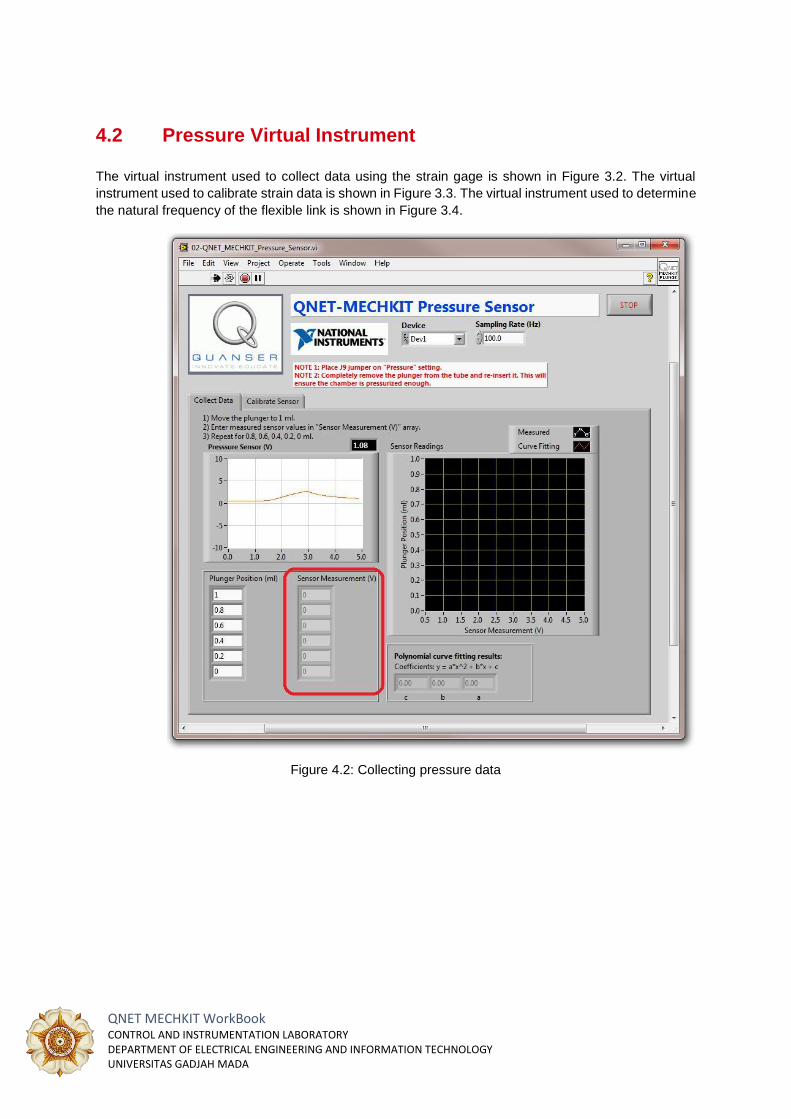
4.2 Pressure Virtual Instrument
The virtual instrument used to collect data using the strain gage is shown in Figure 3.2. The virtual
instrument used to calibrate strain data is shown in Figure 3.3. The virtual instrument used to determine
the natural frequency of the flexible link is shown in Figure 3.4.
Figure 4.2: Collecting pressure data
QNET MECHKIT WorkBook CONTROL AND INSTRUMENTATION LABORATORY DEPARTMENT OF ELECTRICAL ENGINEERING AND INFORMATION TECHNOLOGY UNIVERSITAS GADJAH MADA
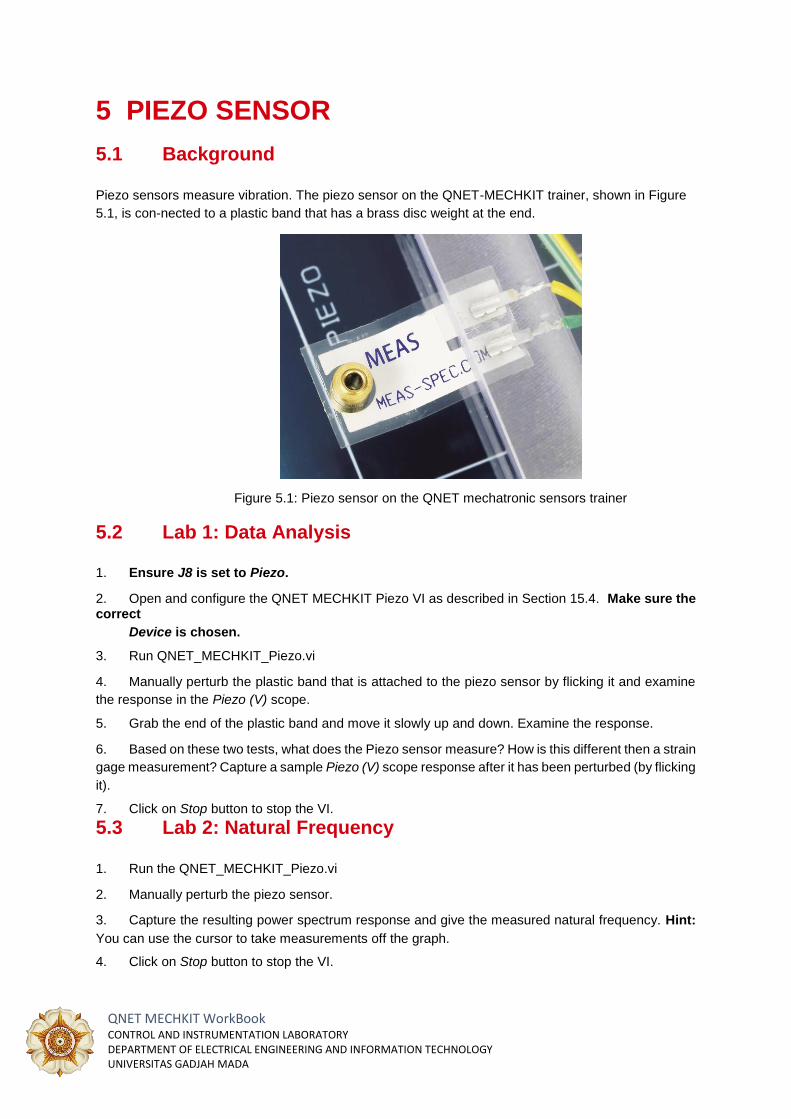
5 PIEZO SENSOR
5.1 Background
Piezo sensors measure vibration. The piezo sensor on the QNET-MECHKIT trainer, shown in Figure
5.1, is con-nected to a plastic band that has a brass disc weight at the end.
Figure 5.1: Piezo sensor on the QNET mechatronic sensors trainer
5.2 Lab 1: Data Analysis
1. Ensure J8 is set to Piezo. 2. Open and configure the QNET MECHKIT Piezo VI as described in Section 15.4. Make sure the correct
Device is chosen. 3. Run QNET_MECHKIT_Piezo.vi 4. Manually perturb the plastic band that is attached to the piezo sensor by flicking it and examine
the response in the Piezo (V) scope. 5. Grab the end of the plastic band and move it slowly up and down. Examine the response. 6. Based on these two tests, what does the Piezo sensor measure? How is this different then a strain
gage measurement? Capture a sample Piezo (V) scope response after it has been perturbed (by flicking
it). 7. Click on Stop button to stop the VI.
5.3 Lab 2: Natural Frequency
1. Run the QNET_MECHKIT_Piezo.vi 2. Manually perturb the piezo sensor. 3. Capture the resulting power spectrum response and give the measured natural frequency. Hint:
You can use the cursor to take measurements off the graph. 4. Click on Stop button to stop the VI.
QNET MECHKIT WorkBook CONTROL AND INSTRUMENTATION LABORATORY DEPARTMENT OF ELECTRICAL ENGINEERING AND INFORMATION TECHNOLOGY UNIVERSITAS GADJAH MADA
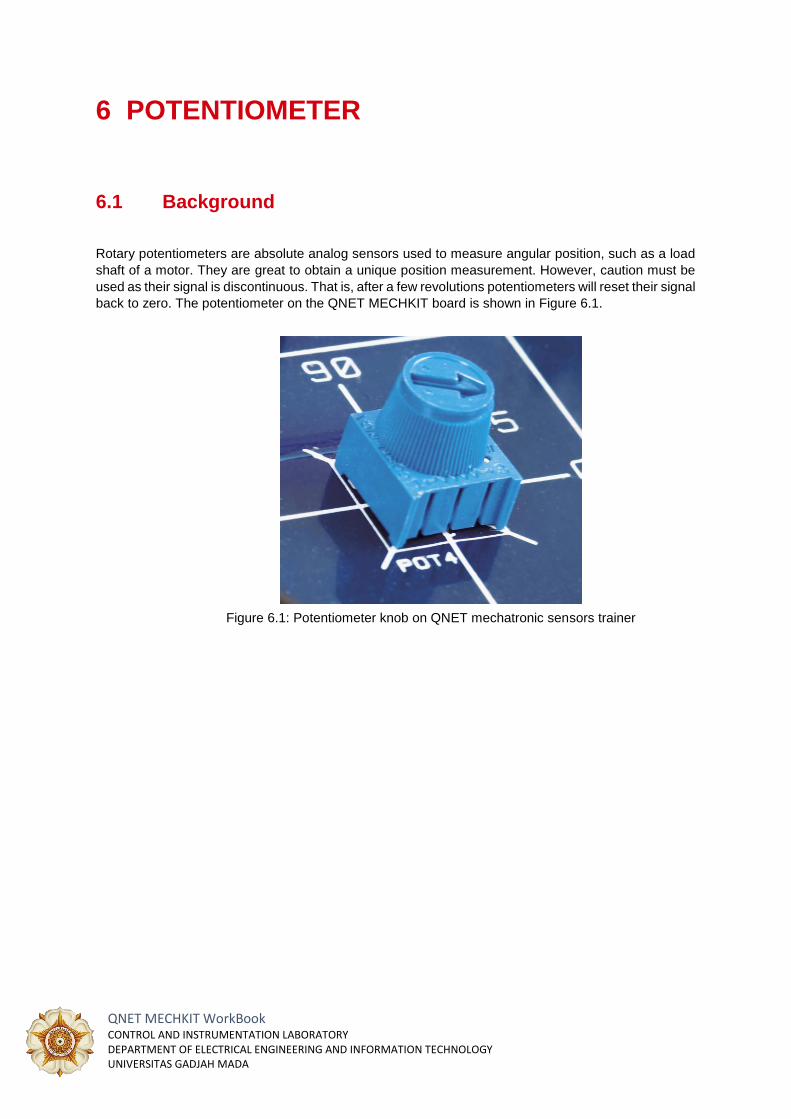
6 POTENTIOMETER
6.1 Background
Rotary potentiometers are absolute analog sensors used to measure angular position, such as a load
shaft of a motor. They are great to obtain a unique position measurement. However, caution must be
used as their signal is discontinuous. That is, after a few revolutions potentiometers will reset their signal
back to zero. The potentiometer on the QNET MECHKIT board is shown in Figure 6.1.
Figure 6.1: Potentiometer knob on QNET mechatronic sensors trainer
QNET MECHKIT WorkBook CONTROL AND INSTRUMENTATION LABORATORY DEPARTMENT OF ELECTRICAL ENGINEERING AND INFORMATION TECHNOLOGY UNIVERSITAS GADJAH MADA
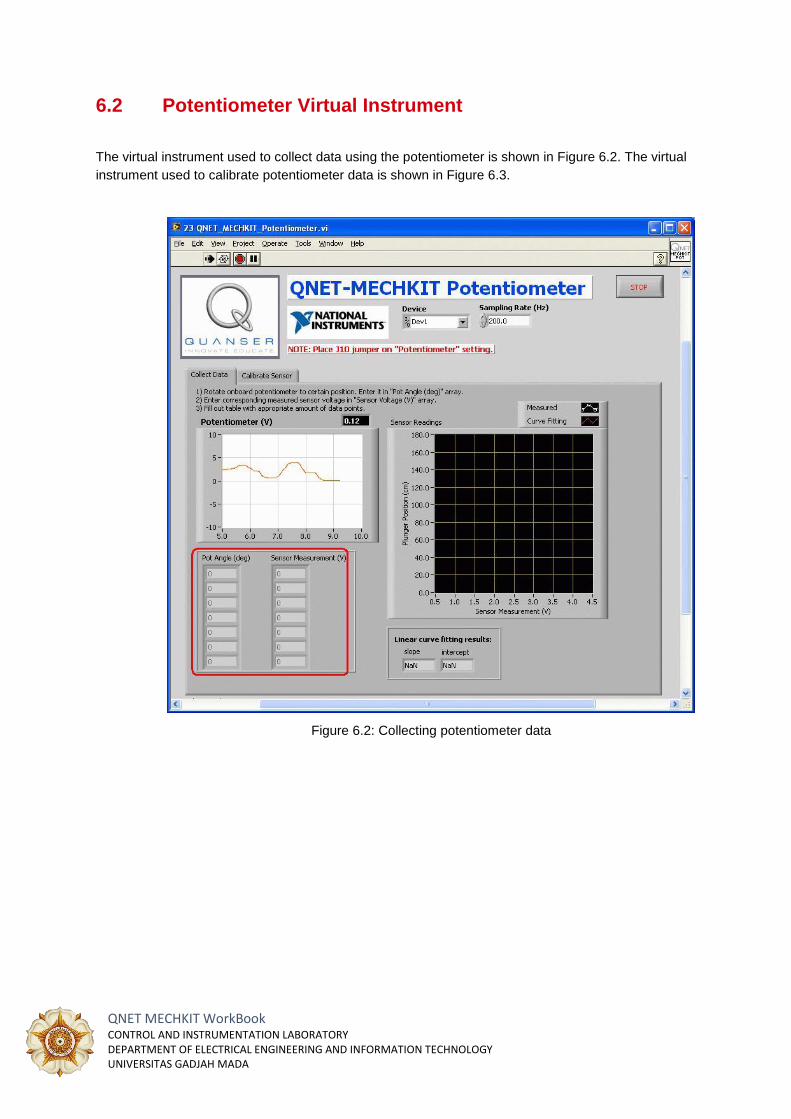
6.2 Potentiometer Virtual Instrument
The virtual instrument used to collect data using the potentiometer is shown in Figure 6.2. The virtual
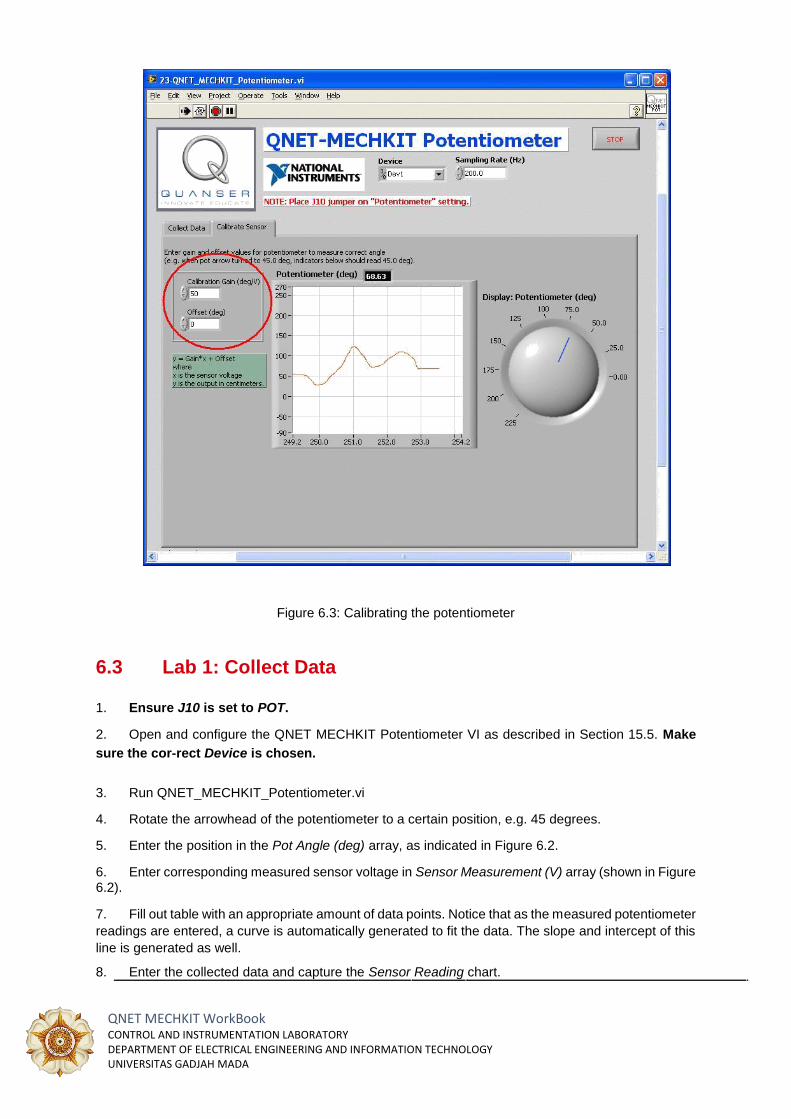
instrument used to calibrate potentiometer data is shown in Figure 6.3.
Figure 6.2: Collecting potentiometer data
QNET MECHKIT WorkBook CONTROL AND INSTRUMENTATION LABORATORY DEPARTMENT OF ELECTRICAL ENGINEERING AND INFORMATION TECHNOLOGY UNIVERSITAS GADJAH MADA
Figure 6.3: Calibrating the potentiometer
6.3 Lab 1: Collect Data
1. Ensure J10 is set to POT. 2. Open and configure the QNET MECHKIT Potentiometer VI as described in Section 15.5. Make
sure the cor-rect Device is chosen.
3. Run QNET_MECHKIT_Potentiometer.vi 4. Rotate the arrowhead of the potentiometer to a certain position, e.g. 45 degrees. 5. Enter the position in the Pot Angle (deg) array, as indicated in Figure 6.2. 6. Enter corresponding measured sensor voltage in Sensor Measurement (V) array (shown in Figure 6.2). 7. Fill out table with an appropriate amount of data points. Notice that as the measured potentiometer
readings are entered, a curve is automatically generated to fit the data. The slope and intercept of this
line is generated as well. 8. Enter the collected data and capture the Sensor Reading chart.
QNET MECHKIT WorkBook CONTROL AND INSTRUMENTATION LABORATORY DEPARTMENT OF ELECTRICAL ENGINEERING AND INFORMATION TECHNOLOGY UNIVERSITAS GADJAH MADA
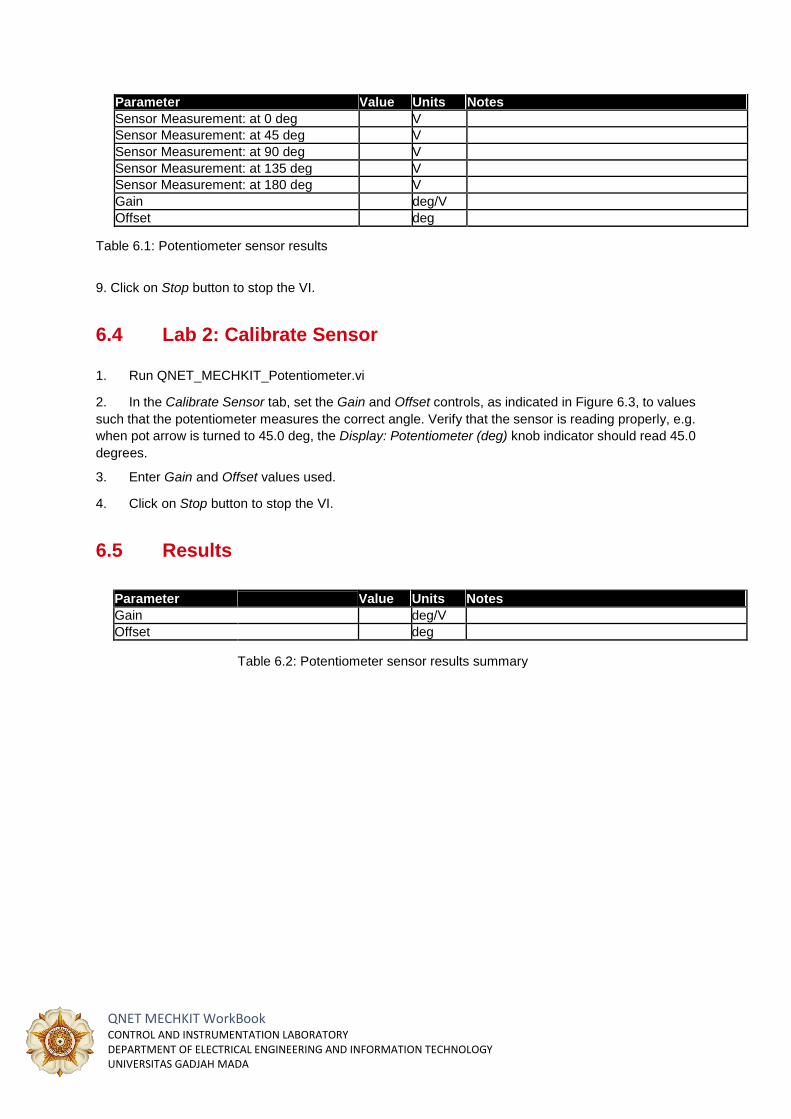
Parameter Value Units Notes
Sensor Measurement: at 0 deg V
Sensor Measurement: at 45 deg V
Sensor Measurement: at 90 deg V
Sensor Measurement: at 135 deg V
Sensor Measurement: at 180 deg V
Gain deg/V
Offset deg
Table 6.1: Potentiometer sensor results
9. Click on Stop button to stop the VI.
6.4 Lab 2: Calibrate Sensor
1. Run QNET_MECHKIT_Potentiometer.vi 2. In the Calibrate Sensor tab, set the Gain and Offset controls, as indicated in Figure 6.3, to values
such that the potentiometer measures the correct angle. Verify that the sensor is reading properly, e.g.
when pot arrow is turned to 45.0 deg, the Display: Potentiometer (deg) knob indicator should read 45.0
degrees. 3. Enter Gain and Offset values used. 4. Click on Stop button to stop the VI.
6.5 Results
Parameter
Value Units Notes
Gain deg/V
Offset deg
Table 6.2: Potentiometer sensor results summary