Structural Health Monitoring of Bridges - IIBE
85
Presentation on Structural Health Monitoring of Bridges Dr. Abhay Bambole Professor Department of Structural Engineering Veermata Jijabai Technological Institute (VJTI) Matunga, Mumbai, [email protected] ORGANIZED BY Indian Institution of Bridge Engineers – IIBE in association with Department of Structural Engineering, VJTI 24 th October 2018 IIBE Lecture
Transcript of Structural Health Monitoring of Bridges - IIBE

Presentation on
Structural Health Monitoring of Bridges
Dr. Abhay BamboleProfessor
Department of Structural Engineering
Veermata Jijabai Technological Institute (VJTI)
Matunga, Mumbai,
ORGANIZED BY
Indian Institution of Bridge Engineers – IIBE
in association with
Department of Structural Engineering, VJTI 24th October 2018
IIBE Lecture

2
What is Structural Health Monitoring (SHM)
“The process of implementing a damage
detection and characterization strategy for
engineering structures”
SHM Involves:
➢Health monitoring
➢Operational Evaluation
➢Data Feature Extraction
➢Statistical Models Development

3
Structural Health Monitoring
Human body like a structure. Damage or problem with body, the unhealthy condition is detected by the nervous system and it signals is sent to brain.
Synonymously the sensors act as the nervous system and the acquisition system act as a brain. The Structural expert is like an doctor for the structure who deices the SHM system and listens to the responses and proposes a solution/repair strategy.

4
Health Monitoring of a Patient in ICU

5
Health Monitoring of a Bridge in ICU

Wearable Body Area Network
6

Smart Wearable Health Monitoring
7

8
Bandra-Worli Sea LinkVidyasagar Setu in Kolkata,
the longest cable-stayed bridge of India
Chenab bridge, world’s highest rail bridge,Pamban Bridge is India’s first sea bridge
Bridges in India
9
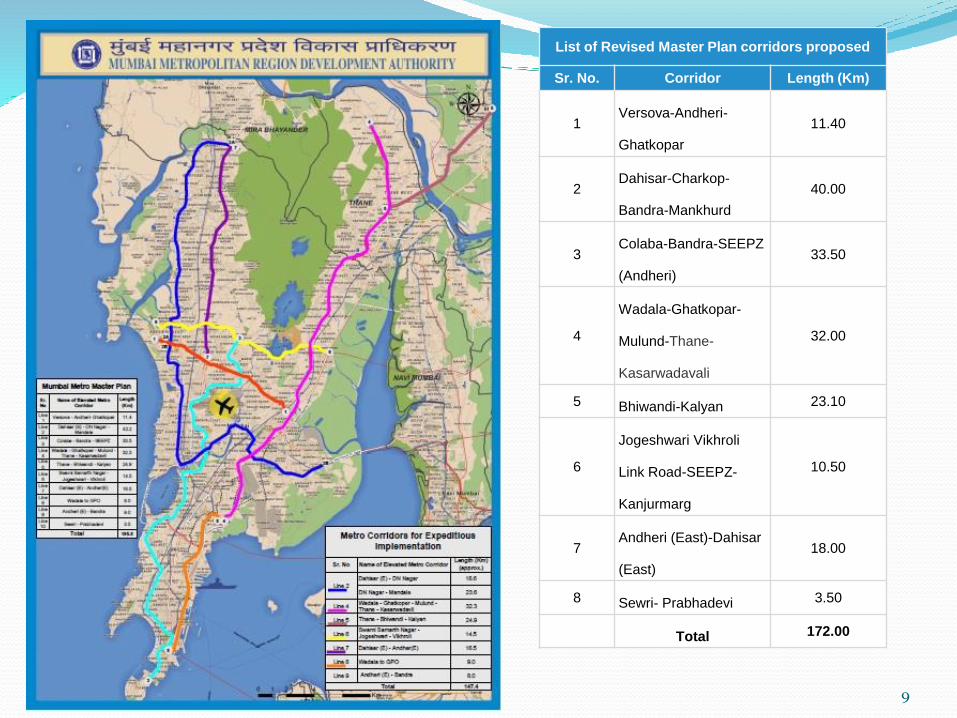
List of Revised Master Plan corridors proposed
Sr. No. Corridor Length (Km)
1Versova-Andheri-
Ghatkopar
11.40
2Dahisar-Charkop-
Bandra-Mankhurd
40.00
3Colaba-Bandra-SEEPZ
(Andheri)
33.50
4
Wadala-Ghatkopar-
Mulund-Thane-
Kasarwadavali
32.00
5 Bhiwandi-Kalyan 23.10
6
Jogeshwari Vikhroli
Link Road-SEEPZ-
Kanjurmarg
10.50
7Andheri (East)-Dahisar
(East)
18.00
8 Sewri- Prabhadevi 3.50
Total 172.00

10
SHM – Some Case Studies
The three-tower suspension bridge,
with two main spans of 1,080 m each
and side spans of 390 m, crosses the
Yangtze River
Monitoring of the Taizhou Yangtze River Bridge
Robo-Control monitoring system - user interface on the internet.
Presentation of measured data (graph form).

11
SHM – Some Case Studies
A new cable stayed bridge on Yamuna River
in Wazirabad, Delhi, length of 675 metres,
with a main span of 251 metres. Its steel-
concrete composite deck
Signature Bridge, Wazirabad, Delhi
A total of 104 sensors, usingdata 171 channels, to measureenvironmental, load andstructural response factors

12
SHM – Some Case Studies
The Hunter Expressway is situated in mining
area. The bridges on the new road are at risk of
settlement due to mining subsidence, The
structures are mainly concrete box girder
bridges
Hunter Expressway Bridges, Australia
Data is measured and recorded at the abutments and piers:i. At the abutments: displacement in longitudinal and transverse direction of theexpansion joint, settlements and temperatureii. At the piers: settlements relative to the right or left abutment and temperature
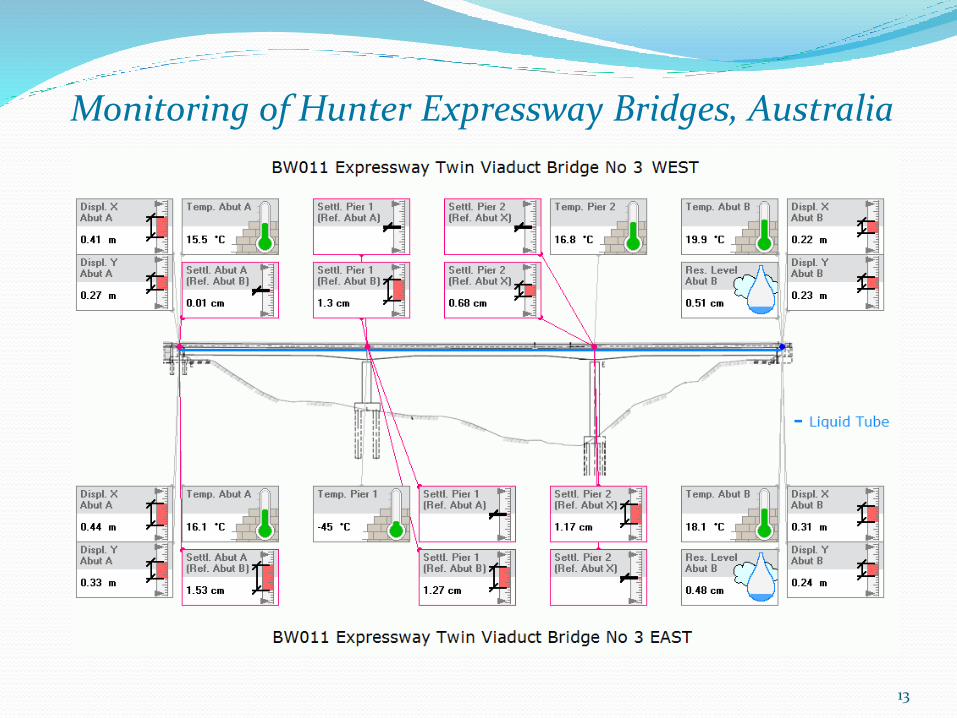
13
Monitoring of Hunter Expressway Bridges, Australia

14
Motivation for Structural Health Monitoring
▪ Move from time-based maintenance to condition-based maintenance
▪ Combat asset readiness
▪ New business models, Manufacturers of large capital investment hardware can charge by the amount of life used instead of a time-based lease.

15
Objective, Needs and Benefits of SHM
• Monitor the in-situ behaviour of a structure accurately and efficiently to assess its performance under various service loads, to detect damage or deterioration, and to determine the health or condition of the structure.
•The SHM system should be able to provide, on demand, reliable information pertaining to the safety and integrity of a structure.
•The information can then be incorporated into bridge maintenance and management strategies, and improved design guidelines.

16
Static Response based SHM
Static-Based SHM
• Based on the premise that damage will alter the static
properties of the structure.
– e.g. displacements, rotations
• Drawback
Considerable static deflection requires
large amount of static force

17
Vibration-Based SHM
• Based on the premise that damage will alter the dynamic
properties of the structure.
– e.g. structural response, frequencies, mode shapes, damping
or modal strain energy change
• By measuring the structural response by means of sensors
strategically placed on the structure, and intelligently
analyzing these measured responses, it is possible to
identify damage occurrence.
• It can be done either in modal domain or physicaldomain
Dynamic Response Based SHM

18
Advantages and positive ramifications of including SHM in civil structures
1. Confirm the design parameter: Detection of damages during construction which can cause any change in properties than expected by design.
2. Quality Assurance: By providing continuous and quantitative data, a monitoring system
3. Complex Structures are well managed: Learning how a structure performs in real Conditions
4. To Ensure safety of people, nature and property: Early detection of performance Degradation
5. Monitoring reveals hidden resources: Many times the structure performance is better than what it is designed for and this gives an extra freedom to play with for further designs and construction.

19
Steps Involved with SHM
▪ Identify structures needing monitoring
▪ Acquire information on probable degradation mechanisms and risks from design engineers or owners of structure.
▪ Establish expected responses to degradations.
▪ Design SHM system to detect such conditions and select appropriate sensors.
▪ Install and calibrate system.
▪ Acquire, Analyse and manage data. This involves alarming the concerned people whenever there is an emergency.

Vibration Based SHM: Sensors• Different forms of dynamic structural response:
– Displacement, Velocity, Acceleration,Strain.
– Which ones to measure depends on monitoring conditions and
objectives.
• Sensing technology: an ever emerging field of study
• Based on what to measure, different sensors available:
– Laser Displacement Sensors (LDS)
– Velocity Transducers
– Seismometers
– PiezoelectricAccelerometers
– Strain Gauges
• Most of these sensors can be wirelessly connected 14

Accelerometer (Acceleration)
Load Cell (Force)Displacement Sensors
Strain Gauge (Strain)
Collection of Sensory Information21
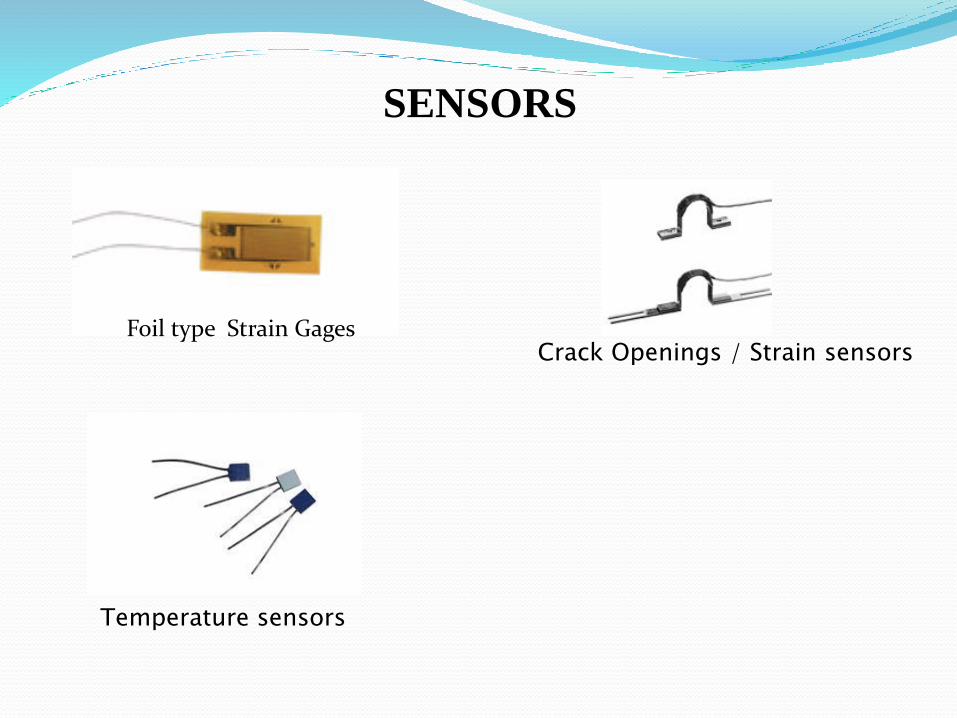
SENSORS
Foil type Strain GagesCrack Openings / Strain sensors
Temperature sensors

Monitoring of Cable stayed Bridges
23
Adige Bridge, Italy

Elasto-Magnetic Sensors
24

Bridge Health Monitoring System Using Advanced Laser Technology & Accelerometer

Bridge Health
Monitoring
Hardware SoftwareData
Analytics

Hardware
MicrocontrollerWifi mopdule Sensors
Laser
[range 80m, accuracy 1 1mm]
Accelerometer
Temperature & Humidity
[DHT11]
[DS18B20]
Single Board Computer WiFi Router / GPRS
Server / Cloud

# Nomenclature Technique Purpose Follow-up
1 Deflection (Distance) Measurement
Ultrasonic Sensor[HC SR04]
It won’t shine any light on the surface of referenceMicrocontroller has many additional ports available, hence this can be parallelly attempted in addition to Laser Sensor for R&D comparison purpose
Price is Rs. 99 to Rs. 120
2 Deflection (Distance) Measurement
Microwave radar Microwave radar is presently used in Large Petrol storgage in Reliance, Adani Petroleum division, etc
Data sheet, resolution and price needs to be explored
3 Camera IP Camera Capture the vehicle number plate,when the acceleration sensor sensing certain threshold value
Data sheet of IP Camera needs to be explored
4
5
Scope for Near future possible R&D - Prototype Version 2.0

Laser
Accelerometer
Temperature & Humidity
[DHT11]
[DS18B20]
Microcontroller Wifi module Single Board
Computer
Server / Cloud
Sensor Node
WiFi / GPRS
WiFiRout
er
WiFiRout
er
Wireless protocol 802.11

Development of indigenous wireless sensor node (Displacement, Acceleration, Temperature)
30

Amar Mahal Flyover
31
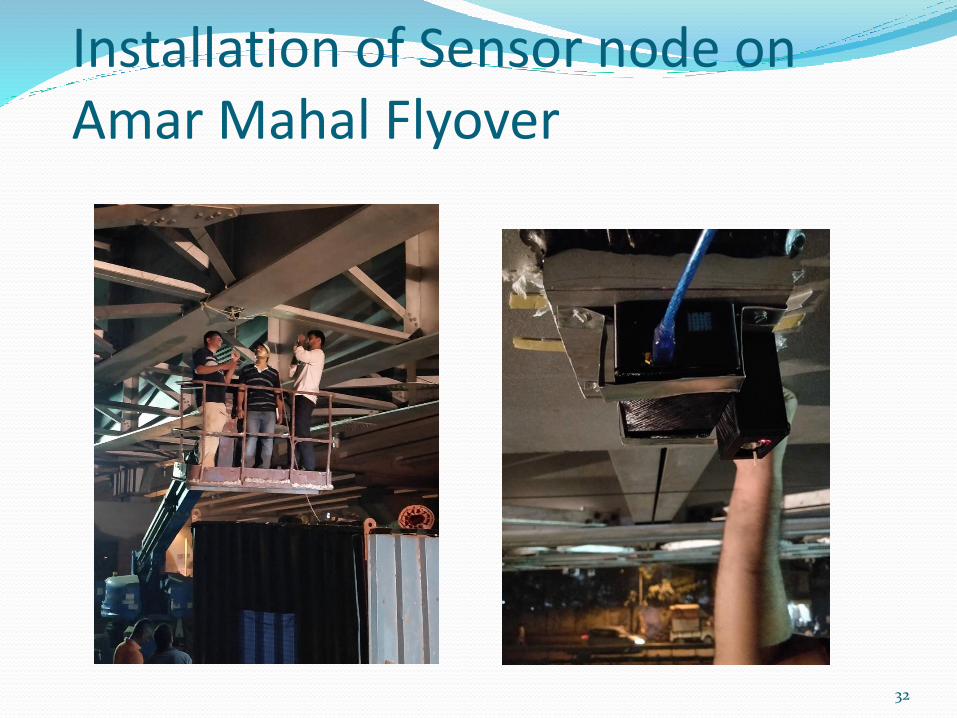
Installation of Sensor node on Amar Mahal Flyover
32
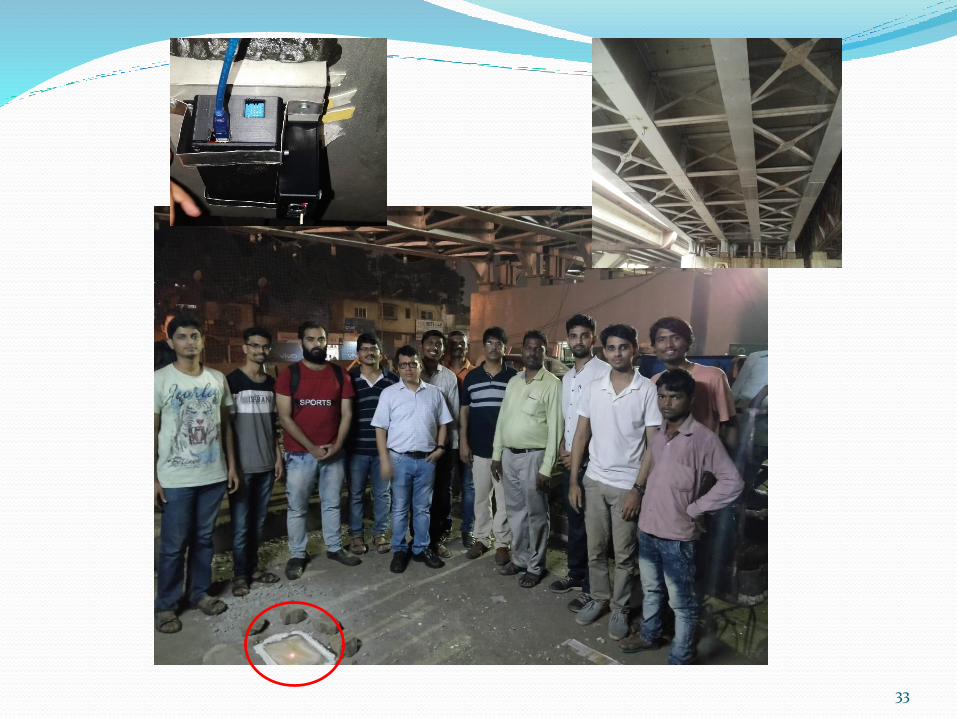
33

28 November 2018 34
DAMAGE LOCALIZATION
Determining location of crack/damage from frequencies is a difficult task.
Cracks/ damage at two different locations may cause the same amount of frequency change. Therefore parameter other than frequency need to investigated and studies which shall enable to identify the location of damage in structure.
Curvature mode shape of the structure may be used for establishing damage location.
The difference in the curvature mode shapes between intact and the damaged case is utilized to detect the location of crack in the structure.

28 November 2018 35
CURVATURE MODE SHAPES
Curvature mode shapes are related to the flexural stiffness of
the beam cross-sections.
Curvature at a point is given by:-
ʋʺ =𝑀
𝐸𝐼Where,
ʋʺ= Curvature at a section
M= Bending moment at a section
The changes in the curvature are local in nature and hence can
be used to detect and locate a crack in the structure.

28 November 2018 36
CURVATURE MODE SHAPES
The change in curvature increases with the reduction
in the value of (EI), and therefore, the amount of
damage can be obtained from the magnitude of
change in curvature.
The curvature mode shapes are obtained from the
displacement mode shapes through central difference
approximation
Where, h is the length of the element
Finally the difference in the curvature mode shapes
between undamaged and the damaged case is used to
detect location of the crack.
ʋʺ = ʋ𝑖 +1−2ʋ𝑖
+ʋ𝑖−1
(ℎ2)

Study of damaged and undamaged steel beam
37

28 November 2018 38
DAMAGE LOCALISATION BY CURVATURE DIFFERENCE METHOD
Case 1: Location of Damage 1
The location of damage 1 (Flange cut of 50mm in the centre)
studied by plotting the absolute curvature difference between
damaged and undamaged condition. Higher modes are more
sensitive to damage than lower modes.

28 November 2018 39
DAMAGE LOCALISATION BY CURVATURE DIFFERENCE METHOD
It is clear from the above plots that difference between
the absolute curvature of damage and undamaged,
helps in depicting the exact location of damage.

28 November 2018 40
DAMAGE LOCALISATION BY CURVATURE DIFFERENCE METHOD
Case 2: Location of Damage 2
The location of damage 2 (100mm cut on bottom flange at
the centre (i.e. at 3000mm)) found by plotting the absolute
difference curvature of damage 2 with the undamaged
condition.

28 November 2018 41
DAMAGE LOCALISATION BY CURVATURE DIFFERENCE METHOD
The difference increases with the reduction in the stiffness
of the damaged zone. Therefore, one can analyse the degree
of damage from the difference in absolute curvature mode
shape.

28 November 2018 42
DAMAGE LOCALISATION BY CURVATURE DIFFERENCE METHOD
Case 3: Location of Damage 3
The damage 3 contains web crack of 50 mm x 50 mm at the
quarter span i.e. at the location of 1500 mm. The absolute
curvature for Damage 3 conditions are plotted as shown
below

28 November 2018 43
DAMAGE LOCATION:-CURVATURE DIFFERENCE METHOD
The above plots speaks that some damage is observed near
1500mm i.e. this method also helps in depicting the
damages in the web portion.

Optical fibre based measurement of Curvature
44

Case Study-IMonitoring of Structural Rehabilitation of
the Karal Bridge
ROB ( Rail Over Bridge ) at Karal, JNPT, Navi Mumbai

Structural Details Bridge is made up of beam-slab RCC system (Pre-cast beams) with diaphragm
beam.
Each span consists 8 no. of beams/girders of an average length of 16m.
36 spans of varying lengths having 37 expansion joints in this bridge. Total length 700 m.
2400 2400 2400 2400 2400 2400 2400 2400
Main Girders
Diaphragm
Plan
180 mm
2400
mm
1120 mm
8-32mm

Monitoring
❖ Monitoring of Deflection: As the primary indicator of the strengthening effect.
❖ Monitoring of flexural strain: To measure strengthening effect with regard to enhancement in flexural stiffness of girders.
❖ Monitoring of shear strain/crack width: To measure strengthening effect with regard to enhancement in shear stiffness of girders.
❖ Monitoring of vibration: Frequency measurement will indicate the strengthening effect with regard to enhancement in overall stiffness superstructure.

Different sensor used
Foil type Electric Resistance Strain
Gage
Linear Potentiometer for
Displacement Measurement
Piezoelectric Accelerometer Omega Type Displacement
Transducer

Strain gauge at the Bottom of the Beam Soffit to measure Flexure strain gage
Deflection Sensor at the Bottom of the Beam Soffit

Omega type Displacement Transducers at the surface of the Beam
at an angle of 45
Piezoelectric accelerometers at the Bottom of the Beam Soffit
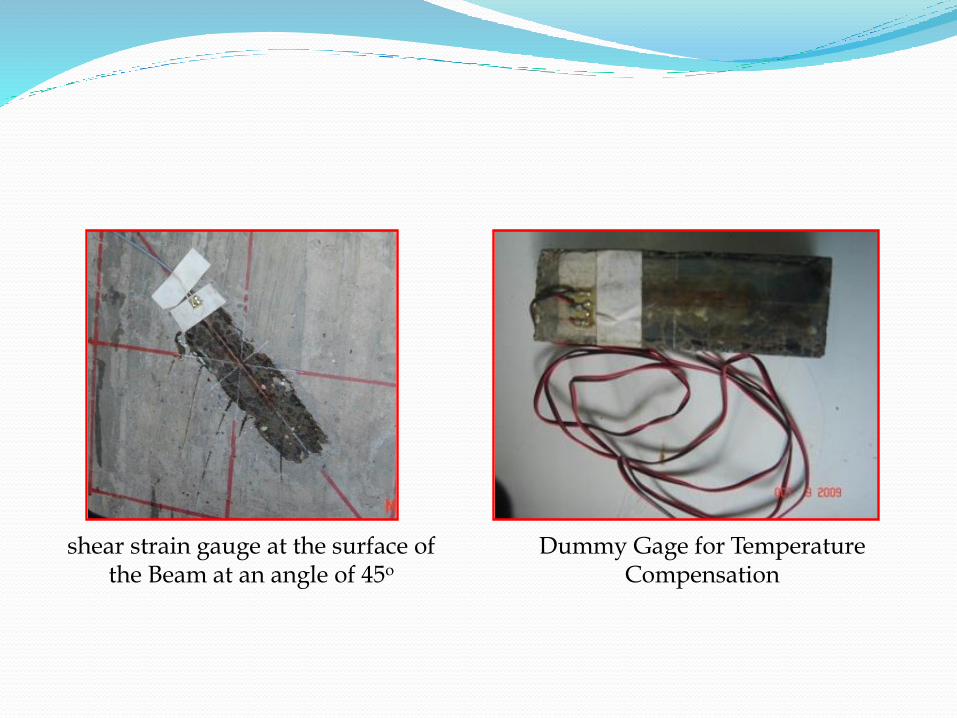
shear strain gauge at the surface of the Beam at an angle of 45ο
Dummy Gage for Temperature Compensation

Instrument use for Data Acquisition

Load case 7 and 8 – For Vibration

Results
Span-1 Span 2 Span 3
Before
strengthening5.38 mm 5.18 mm 5.08 mm
After
strengthening3.93 mm 3.65 mm 3.95 mm
Reduction in
defection1.46 mm 1.53 mm 1.13 mm
% reduction in
deflection-27.10% -29.50% -22.20%
Average Central Deflection (mm)

Span 1 Span 2 Span 3
Before
strengthening450 µε 407 µε 311 µε
After
strengthening198 µε 188 µε 160 µε
Reduction in
Flexural Strain262 µε 219 µε 151 µε
% Reduction in
Flexural Strain-58.20% -53.80% -48.50%
Average Flexural Strain (µε)

Span 1 Span 2 Span 3
Before
strengthening80 µε 90 µε 72 µε
After
strengthening42 µε 28 µε 15 µε
Reduction in
Shear Strain38 µε 52 µε 47 µε
% Reduction in
Shear Strain47.5 (%) 57.8 (%) 65.3(%)
Crack Width of Diagonal Cracks near Support(Change in change width over a gauge length of 200mm in µε)

Span 1 Span 2 Span 3
Before
strengthening5.301 Hz 5.344 Hz 5.520 Hz
After
strengthening5.737 Hz 5.964 Hz 5.833 Hz
Increase in
Fundamental
Frequency
0.436 Hz 0.620 Hz 0.313 Hz
% Increase in
Fundamental
Frequency
8.2 (%) 11.6 (%) 7. (%)
Natural Frequency of Vibration (Hz)

Case II
Monitoring of Deflection and Strains in Transfer Girders of Proposed Hotel Building at Mumbai
58

59
Progress of Construction work

Layout of sensors
60

61
Embedded strain gages

62
Surface strain gage

63
Girder
No.
Flexural strains at the
Soffit of beam in mid section
Shear strains at 1.25 M
depth near supportCentral Deflection
Theoretical
value
Measured
value
Theoretical
value
Measured
value
Theoretical
value
Measured
value
3 163.4 µε 67 µε 31.29 µε 47 µε 10.7 mm 13 mm
4 164.6 µε 74 µε 31.49 µε 56 µε 10.75 mm 10 mm
Monitoring of Strains and Deflections of Girder:Reading due to self weight of Girders after release jacks

Case IIIMonitoring of Deflection and Strains in Mahatma
Gandhi Setu at Patna During Rehabilitation
64
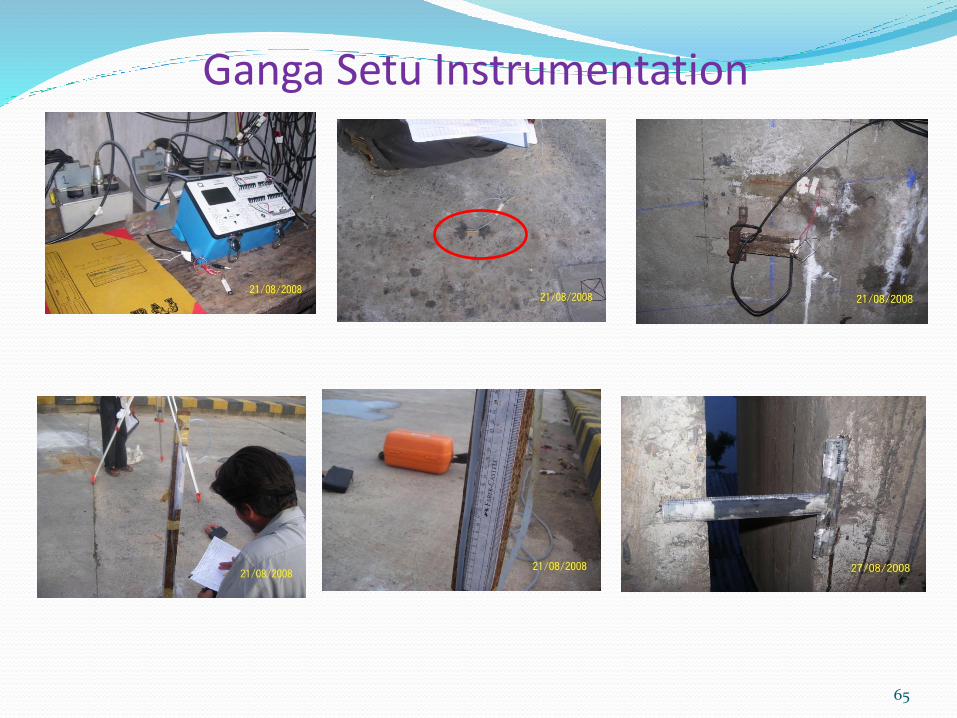
65
Ganga Setu Instrumentation

Location of Strain Gauges
66

Bridge Girder Deflection Measurement
67
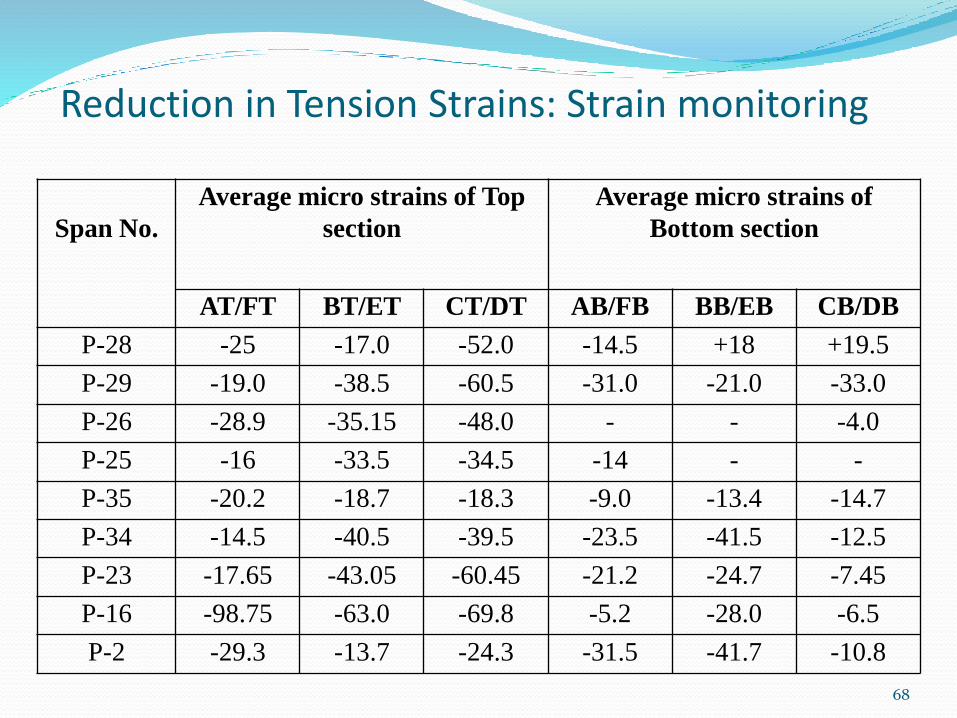
Span No.
Average micro strains of Top
section
Average micro strains of
Bottom section
AT/FT BT/ET CT/DT AB/FB BB/EB CB/DB
P-28 -25 -17.0 -52.0 -14.5 +18 +19.5
P-29 -19.0 -38.5 -60.5 -31.0 -21.0 -33.0
P-26 -28.9 -35.15 -48.0 - - -4.0
P-25 -16 -33.5 -34.5 -14 - -
P-35 -20.2 -18.7 -18.3 -9.0 -13.4 -14.7
P-34 -14.5 -40.5 -39.5 -23.5 -41.5 -12.5
P-23 -17.65 -43.05 -60.45 -21.2 -24.7 -7.45
P-16 -98.75 -63.0 -69.8 -5.2 -28.0 -6.5
P-2 -29.3 -13.7 -24.3 -31.5 -41.7 -10.8
68
Reduction in Tension Strains: Strain monitoring
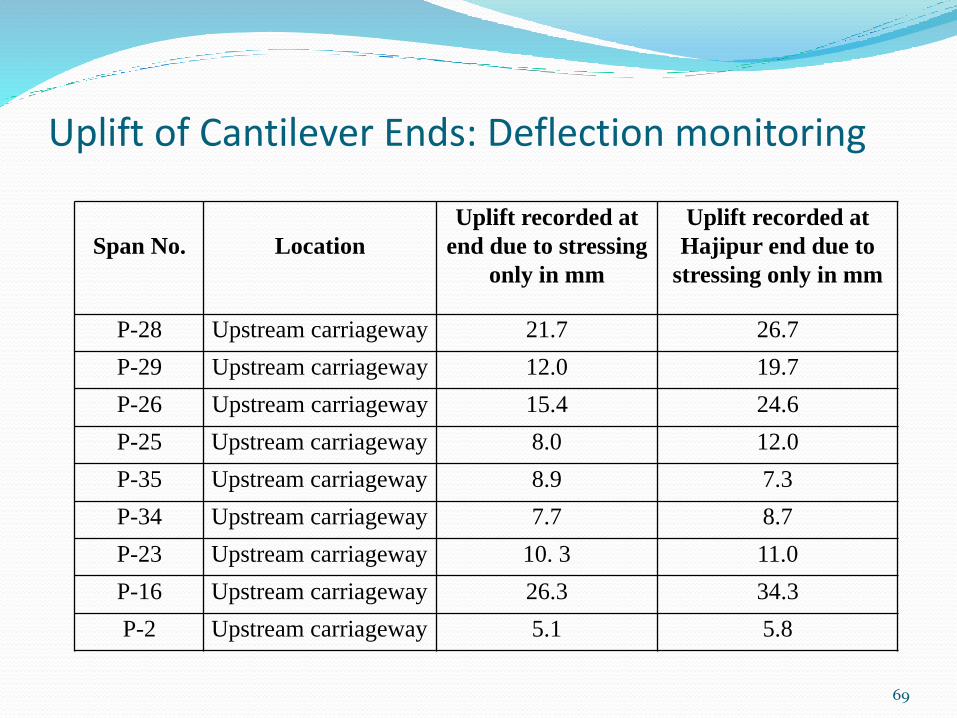
Uplift of Cantilever Ends: Deflection monitoring
Span No. Location
Uplift recorded at
end due to stressing
only in mm
Uplift recorded at
Hajipur end due to
stressing only in mm
P-28 Upstream carriageway 21.7 26.7
P-29 Upstream carriageway 12.0 19.7
P-26 Upstream carriageway 15.4 24.6
P-25 Upstream carriageway 8.0 12.0
P-35 Upstream carriageway 8.9 7.3
P-34 Upstream carriageway 7.7 8.7
P-23 Upstream carriageway 10. 3 11.0
P-16 Upstream carriageway 26.3 34.3
P-2 Upstream carriageway 5.1 5.8
69

PWD Maharashtra
70

LOCATION
This flyover is located at Turbhe junction of Navi Mumbaiwhich connects Mumbai to Thane & Panvel
Turbhe Flyover is an important link between Mumbai-PuneHighway
Mumbai
Thane
Panvel
71

LAYOUT PLAN OF TURBHE FLYOVER
72

73
Typical single cell trapezoidal box girder section of Turbhe Bridge

VISUAL OBSERVATION
74
Undulations on riding surface due to central sagging
Sagging of crash barrier Side view of deformed girder
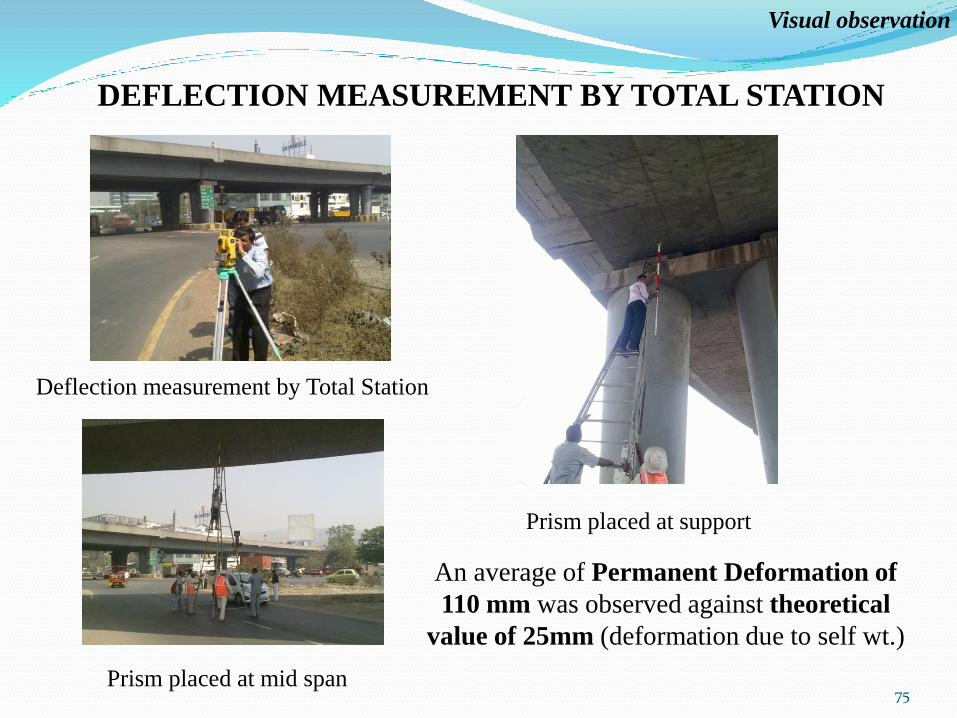
DEFLECTION MEASUREMENT BY TOTAL STATION
An average of Permanent Deformation of
110 mm was observed against theoretical
value of 25mm (deformation due to self wt.)
75
Prism placed at support
Prism placed at mid span
Deflection measurement by Total Station
Visual observation

VIBRATION MEASUREMENTS
▪ The objective of vibration testing is to co-relate the defects in
the bridges due to the changes in its dynamic characteristics.
The vibration analysis of a structure carried out over a period
of time measures loss of stiffness and not the loss of strength.
▪ Accelerometers are temporarily attached to the bridge and the
traffic induced vibrations are recorded. The modes of vibration
and damping can then be determined by computerised analysis.
▪ Natural frequency (f) of simply supported beam is calculated
by
76
Non destructive test
Where,
n = mode number
l = length of beam
E = modulus of elasticity
I = Second moment of area
𝝆 = Mass per unit length
21
2
n EIf
l
=
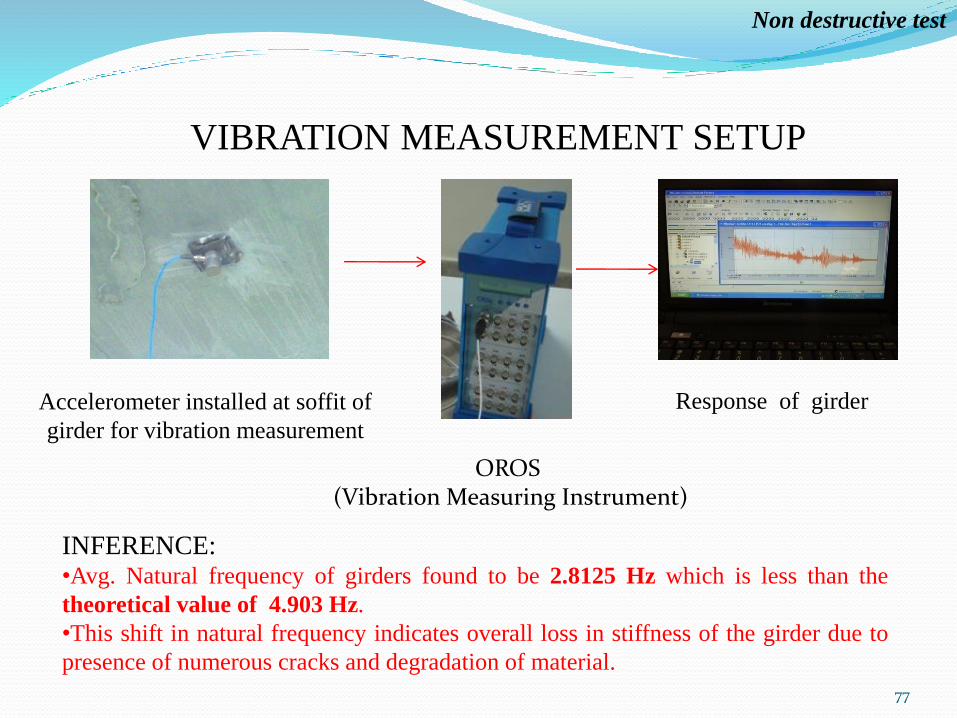
VIBRATION MEASUREMENT SETUP
Response of girder
OROS (Vibration Measuring Instrument)
INFERENCE:•Avg. Natural frequency of girders found to be 2.8125 Hz which is less than the
theoretical value of 4.903 Hz.
•This shift in natural frequency indicates overall loss in stiffness of the girder due to
presence of numerous cracks and degradation of material.
77
Non destructive test
Accelerometer installed at soffit of
girder for vibration measurement

Class 70R Loading Support Condition
78
Finite Element Model

UPDATION OF FEM MODEL
▪ Considering existing deteriorated condition of concrete the FEmodel was updated.
▪ The present condition of bridge superstructure have numerouscracks which leads to significant decrease in stiffness of girder aswell as dynamic parameters such as natural frequencies.
▪ The results from FEM after updating the model were matchingactual field test values.
▪ Simulating the existing condition of superstructure is necessary tocheck the effectiveness of strengthening with FRP rather thanapplying it on ideal conditions of girder which do not exist on site.
▪ This updated FE model of girder was used to modelstrengthening with FRPC wraps and laminates.
79
FEM analysis
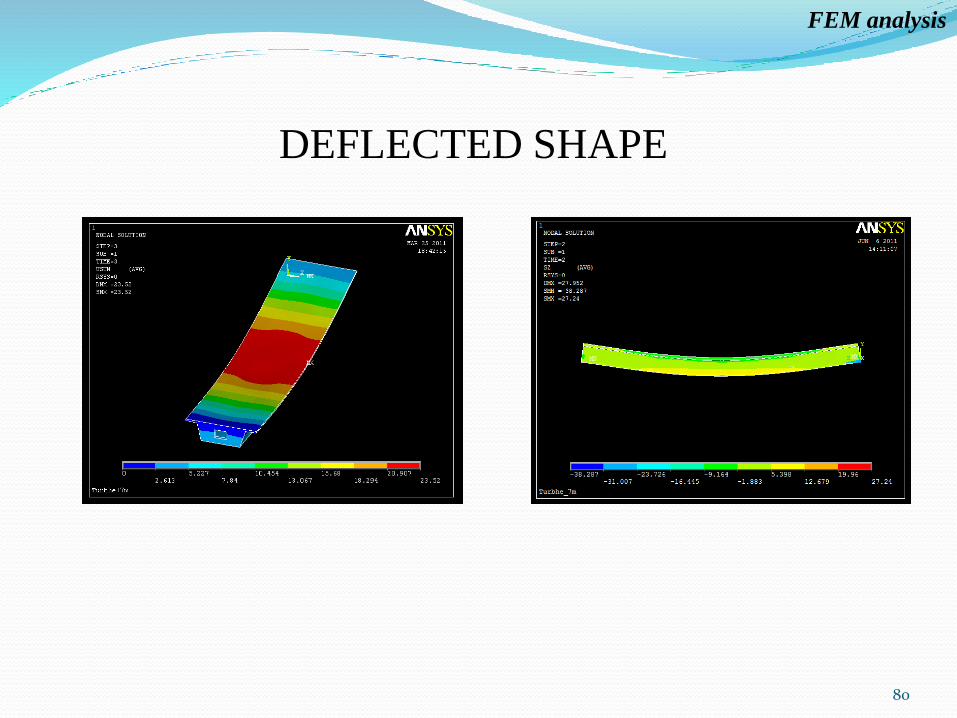
DEFLECTED SHAPE
80
FEM analysis

81
FREE VIBRATION ANALYSIS RESULTS
NATURAL FREQUENCY OF VIBRATION
Idealized 7m box girder model Natural Frequency (Hz)
Before strengthening 4.8295
After strengthening 5.0502
(%) Increase in natural frequency 4.4%
Updated 7m box girder model Natural Frequency (Hz)
Before strengthening 2.8484
After strengthening 3.0767
(%) Increase in natural frequency 8.01%
Experimental value of natural frequency = 2.8125 Hz
FEM analysis

SENSORS
Strain Gages
Linear Potentiometers, LVDT -Displacement
Thermocouples-Temperature
Accelerometers – Modal vibration
Tiltmeters
◦ Uni-axial
◦ Bi-axial
Crack Openings


Thank you.
84

85