Structural conditions of intraorganizational power - … · Structural conditions of...
54
PRE-PUBLICATION DRAFT' Please do not quote without permission from the authors: l, _______ _ Sl1tUCTURAL CONDITIONS OF INTRAORGAJUZATIONAL POWER C Robin Hinings 1 David J Hickson, J H Pennings cmd R E Schneck
Transcript of Structural conditions of intraorganizational power - … · Structural conditions of...

PRE-PUBLICATION DRAFT'
Please do not quote without permission from the authors:
l, _______ _
Sl1tUCTURAL CONDITIONS OF INTRAORGAJUZATIONAL POWER
C Robin Hinings 1 David J Hickson, J H Pennings cmd R E Schneck

- 1 -
STRUCTURAL CO~1J)ITIONS OF INTRAORGANIZATIONAL pm-lER
The strategic contingencies theory of intraorganizational pOvler proposed I
by Hickson et al. (1971) hypothesizes that the power of subunits results
from ,contingent dependences among them created by unspecified combinations
~ of coping with uncertainty, workflmv ~entra1ity (immediacy and pervasive-
ness), and non-substitutability. This paper reports the devising of
methods to test this theory with alternative forms of data on seven
organizations, or power systems, of four subunits each. The "theory is
refined by the exploration of different patterns of variables related to
successive levels of power, and the tentative ordering of these variables
in terms of their consequences for power.1

The nineteen sixties sm·, a fresh perspective in organization
theory which regarded organizations as decision making power systems
interacting \'lith their environments in conditions of uncertainty. It
is a perspective which can be most simply traced from the examination
of dysfunc'tions and cognitive rationality by Barch and Simon (1958),
through ~he study of organizational decision processes by Cyert and
March (1963), to the attempt by Thompson (1967) to more thoroughly spell
out its theoretical implications.
Since organizations are control systems in which power is
. perpetuall.y omnipresent', the implications of the above prespective
for the understanding of power must be '-lorked out. Hopefully, it may
add dramatically to the comprehension of this contentious concept.
Crozier (1964) was quick to grasp ~he opportunity by explaining the
apparent power of sections of maintenance engineers by their control
of uncertainty. However, the difficulties with this explanation were
such that Hickson et al. (1971) were stimulated to develop the idea
itself into a \vider explanation of <wbunit power vlhich they put forward
as a strategic contingencies theory. The project reported here is an , attempt to test this theory against data.
Theory of pO\17er . "
The theory proposed in detail by Hickson et a1. (1971) is
srulple in essence and is summarized in Figure 1 reproduced from their
paper.
Figure 1 here

o - 3 -
They argue that the concept of coping is crucial to understanding any
relationship between uncertainty arid pmver, for it is not the uncertainty,
but what is done about it that in some way confers power. Together with
centrality of workflows and substitutability of activities, coping with
uncertainty gives rise to dependences of one subunit upon another because
the activities performed by one are contingencies for the activities of
another. Some combinations of uncertainty, coping, centrality, and
substitutability bring these contingencies to strategic intensities
which differentiate power . As Hickson et a1. (1971: 222) put it: 'The
. independe~t variables are each necessary but not sufficient conditions
for control of strategic contengencies, but together they determine the
varia tion in interdependence bet\veen subunits I •
Any relationship between. coping wit,h uncertainty and power
must in some degree rest upon the centrality of that coping-to the
outputs of the rest of the organization. Hickson et al. (1971)
provisionally dissect centrality into two further concepts, frnmediacy
and pervasiveness. As an example of low immediacy, a research department .
may solve a technical uncertainty yet the consequences for production of
finished goods are so remote that this successful coping brings little
pmver. Likewise, power rests in some way upon the pervasiveness of a
subunit's links with other subunits. For example, the tentacles of a
finance department may reach every\vhere to increase its power. At the
same time, Hickson et al. (1971) stress substitutability, pointing out
that the maintenance engineers noticed by Crozier (1964) might not have
been so pOYler~ul had it been possible to contract maintenance work to
external·elJgineering firms, that is, to substitute another meqns of its
performance. They also cite the pm~er of the engineers to expose the
fallacy of assuming that a po~er distribution in accord with the strategic

- 4 -
contingencies theory is necessarily efficient, or rational, or functional
fCl>r an organizat.ion. The power of the engineers to impede the introduc-
tion of routinized progrMlmed maintenance was presumably none of these.
Routinization is introduced into-the theory in two ways. It
is thought to indirectly effect pm.,er either by reducing uncertainty or
by increasing substitutability. Routinization is therefore either 'of
~- coping by prevention, which prevents the occurrence of uncertain'ty'
(Hickson et al. 1971: 224), for example long term sales contracts which
stabilize orders, or 'of coping by information or absorption which define
how the uncertainty which does occur shall be coped with' (Hickson et al.
1971: 224), for example routine task instructions which enable replace-
ment personnel to cope.
The theory focuses on structural sources of power and is not
'concerned with psychological attributes of members as explanations of
P?wer differences. As Hickson et al. (1971) recognize, structural sources
are considered to have unique explanatory power, regardless of _individual
differences in psychological dispositions and other excluded factors.
The design of the study now to be described follows Hickson et
al. (1971) not only in treating power as the dependent variable to be
explained but in applying the theory specifically to subunits of work
organizations. These particular units of analysis exist by definition
within bounded interactive organizational systems. Research on subunits
avoids the obstacles ,.,hich beset studies of power in conrrnunities where
the institutions \vhich make up the geographical connnunity do not necessarily
constitute an interr~lated power system.
Sample
Dealing with a unique set of variables "Ii th few previous guides
to operationalization demands exploratory work and empirical simplicity.

- 5 -
Having a formal theory leads to a hypothesis testing research design. "
With both together insight from a close knowledge of the units studied
is needed and also precision of sampling and measurement. The research
design 'tv-as accordingly a cross between systematic, comparative research
and case study analysis.
The accounting, engineering, marketing and production sub-
units of manufacturing organization~ were selected where" these were the
only departments, that is, 100 percent samples of population of four
subunits in ~ach of several comparatively simple social systems. Each
system was" completely interactive, that is, each subunit interacted
with all three others.
An explicit theory suggests crucial variables on which to
sample: in this case, uncertainty., The primary variation in uncertainty
was taken as likely to occur between the subunits within each organiza-
tional sy~tcm, as indeed it did, though no prior data were available to
predict its range. Secondly, attempts were made to select organizations
so as to vary the uncertainty faced by the marketing subunits in each,
that is, pre-selected across-organization variation for'one type of sub-
unit. But environmental uncertainty has no publicly available unequi-
vocal empirical referent to rely on for srunpling purposes, and secondary
and tertiary indicators may be unreliable. Even so, public regulation
and market conditions were hopefully used as prior indicators of uncertainty.
Case-study conditions were met most nearly by three branch
bre\v-eries in Western Canada, each with less than 100 employees. This
gave twelve subunits. Thre breweries were chosen because they all
operated in the same market prescribed by and controlled by public regula-
tion, '''ith a simple product (beer al(me) and almost identical technologies
and sizes. So in three c1ose~y similar systems the likeness and differ-
ences within and bet\veen them might be followed, and critical factors

- 6 -
stand out. A fair knowledge of each was acquired, and measures developed q
on them.
To provide a contrast of greater environmental uncer~ainty,
t't-1O further breweries were selected from mid-\vest American States where
market conditions are less officially controlled. One employed 300, the
other 60. But when data collection was almost complete it became apparent
that in these States there was hardly more uncertainty, since overall
consumption was linked more to steady population trends than to govern-
mental restraints • A second and more 'successful attempt to increase the
. range of environmental uncertainty added t-.;vo s.emi-autonomous divisions of
'an organization in the Canadian container packaging industry, employing
300 people. One division manufactured folding cartons, the other
corrugated cases, two distinctiv~ products and markets. Each had
production and marketing subunits, but used the services of common
engineering and accounting subunits. Data on the latter were collected
appropriate to each division, to give two systems of four subunits each.
Outputs of both were geared to largely jobbing orders in highly competitive
markets.
Thus the final data covered twentyeight subunits, seven of
each function (counting engineering and accounting in the container
divisions twice each as appropriate to the divisions), constituting
seven systems of four subunits each.
Data collection methods
Foll~wing on from the aim of hypothesis testing and case
analysis, the strategy for data collection was multimethod and multi-
measure. By using more than one dat.a collection method, it was hoped
that coverage of the.empirical phenomena would be extended. The same

- 7 -
aim led to the use of different measures of each variable.
Initially) prolonged expioratory interviews with chief
executives and department heads in the Candadian breweries we~e held
to obtain a 'feel' for these organizations~ In all organizations
semistructured but open-ended interviews based on a standard schedule
were then carried out. The schedule covered information on every
variable in the theory except routinization (Table 1).
Table 1 'here
A further data set was collected by means of a questionnaire.
This obtained information on every variable, including routinization,
being completed by the head of each subunit (in each organization).
All questionnaire items are 'perceptions of facts', asking each respond
ent for his perceptions of uncertainty, immediacy, power, tee., not foJ;.
his attitudes.
Thus there are two data sets, one from interviews, giving
comparatively impersonal and extensive information, and the other from
questionnaires, giving 'perceived' data. As Gilmartin and Brown (1970)
point out, too often perceptual data collection via questionnaires is
used to denote conditions of social systems, when the relationship
between this kind of data and more 'objective' data has not been shown.
An advantage of studying small organizations was that depart
ment heads had a good enough knowledge 0 f all subunits to provide the
kind of nonpersonal data required.
With regard to the questionnaire data, a mean score for each
subunit in each organization "laS constructed from the responses of the
four department heads. Each responded on his own and the other three
departments in the organization, using five category response sets as

- 8 -
summarized in Table 1. The scores given a department by its mm head
did not differ consistently from those given by other heads; except
on power vlhere all heads rated their own departments slightly -higher
than others did. Since this latter bias ~as consistent it did not
differentially affect total scores.
As has been pointed out, these data are not attitude data
but perceptions of a supposed reality. It is important to look for
consistency of responses as an indication of their.validity as representa-
tions of inter-subunit systems. The aim is agreement between respondents
on discrimination bettveen subunits, not di scrimination bet"een respondents.
Checks vlere carried out on each set of four responses on the
"independent variables:
(a) A visual check item by item to see whether the four
respondents perceived the ~cores and/or orderings of
the subunits in the same direction.
(b)
(c)
A check to see whether there was substantial disagreement
on anyone subunit, assuming the ideal to be all four
respondents giving the same score to any single subunit.
'. Scores were converted to rank orders and examined for
differences in scoring levels characteristics of individual
respondents.
There were negligible divergencies sho"m by these checks, having no
systematic effect on the data. Thus there was substantial agreement
between respondents both within and between organizations. They were
agreed on the ordering of the subunits in their organizations on each
variable, and on the levels of scores attributed to each. Therefore
summed questionnaire responses were taken as exprE;::ssing a common per
ception of each subunit.
- 9 -
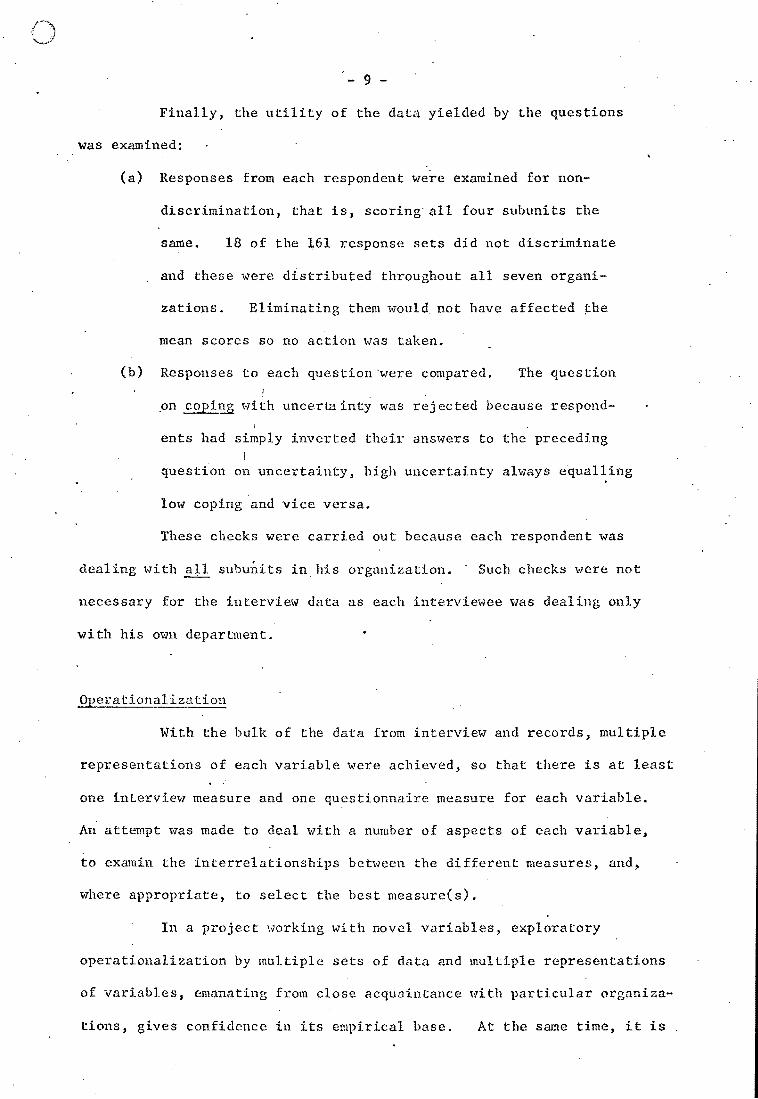
Finally, the utility of the data yielded by the questions
was examined:
(a) Responses from each respondent were examined for non-
discrimination, that is, scoring all four subunits the
same. 18 of the ~6l response sets did not discriminate
and these were distributed throughout all seven organi-
zations. Eliminating them ,vou1d. not have affected the
mean scores so no action was taken.
(b) Responses to each question 'were compared. The question I
,on copi~ ,·lith uncerta inty was rej ected because respond-
ents had simply inverted their answers to the preceding
question on uncertainty, high uncertainty always equalling
low coping and vice versa.
These checks were carried out because each respondent "18S
dealing with all subunits in his organization. ' Such checks 'vere not
necessary for the intervie,v data as each interviewee was dealing only
wi th his ovm departmen t.
9perationalization
With the bulk of the data from interview and records, multiple
representations of each variable were achieved, so that there is at least
one intervievl measure and one questionnaire measure for each variable.
An attempt was made to deal ,-lith a number of aspects of each variable,
to examin the interrelationships bet\.,;reen the different measures, and,
where appropriate, to select the best measure(s).
In a project \vorking with novel variables, exploratory
operationalization by multiple sets of data and mUltiple representations
of variables, emanating from close acquaintance with particular organiza-
tions, gives confidence in its empirical base. At the same time, it is

- 10 -
thereby limited in another direction. Normal scaling procedures were
rules out for two reasons. First, the number of subunits available
was inadequate for such techniques. Second, though several tentative
ordinal scales are proposed and used, on some indicators there was no
standardization of items beo.;reen subunits. The use of terms such as
-'measure' or 'score' is therefore for conventional simplicity but is
not al\\lays to be taken at its full value.
At some points, correlations are used as an economical sUllmlary.
These correlations are for data on twenty brewery subunits only, and do
not include the subunits from container organizations. Brewery sub-
units are in very similar organizations and for correlation may be
regarded, provisionally, as being drawn from a population of subunits
in such organizations. The introduction of ,container subunits would
introduce an unkno~m additional effect without justifying any pretence
of a broad representation 0 f "lork organi-za tions.
variable are described at some length since they are unfamiliar and
exploratory as follows.
Substitutabilitl
Substitutability is the ability of the organization to obtain
alternative performance for the activities of a subunit. A standard
set of items was used to measure this dealing with how easy or difficult
it is to obtain personnel, both in previously experienced and in hypo-
thetical terms. A distinction can also be made betVleen the substituta-
bility of managers, covering the head of dqpartment and his immediate
supervisory deputies, and staff, meaning the technical, administrative
and manual personnel in the department.
Interview data \\I::;re collected on five items for actual
substitutability: level of fonnal education requir~d for the job;

(j
- 11 -
length of experience and training required; difficulties of hiring in
~
the current labor market; existence of legal restrictions; number of
tasks contracted out. The first four items were used for managerial
substitutability, and all five for staff. Three further items dealt
with hypothetical substitutability on the assumption that the degree to
which subunits might be substituted for, ,even if this has never yet
occurred, may affect pmver. The items were internal substitutability,
the possibility of particular tasks being done by other me.."Tlbers of the
same department; departmental substitutability, whether other' subunits
. could carry out any of the tasks; and external substitutability,
whether tasks could be done from outside the organization.
As a guide to their potentialities, these items, seven for
managers, and eight for staff, were examined for unidimensionality by
Guttman cumulative scaling procedure~. This resulted in two sets of
items, representing o~erall managerial substituability, and overall
staff substitutability.
The questionnaire item is shmvn in Table 1.
Workflow pervasiveness
Pervasiveness, an aspect of centrality, is the degree to which
the workflmvs of a subunit are linked to the workflm'lS of other subunits.
It describes the extent of task interconnections between subunits. For
all subunits in an organization it amounts to the flow-chart of a complete
systems analysis.
For each type of subunit (that is, for accounting, engineeYing,
marketing, ,and production departments) a set of inputs and outputs was
gathered by in te'rview . Data on ,,,here inputs came from and outputs went
to, and their frequency, gave a matrix of interconnections of each sub-
unit "t-Jith every other subunit, parent companies, suppliers, customers,

- 12 -
govenment agencies, etc.
From this data numerous counts and ratios are possible, and
seventeen kinds 0 f measures "lOre examined. These are b~st represented
by the five included in Table 2.
Table 2 here
The correlatiomin Table 2 shows that pervasive subunits are
pervasive in all ~ays, that is, inwards, outwards, internally, externally,
· etc., and .that one measure can be used to represent all. Total links
,-lith other subunits in the organization vlere selected as closest to the
inter-subunit pm\ler system.
Two measures were derived from the questionnaire item (see
Table 1), perceived pervasiveness of the subunit as seen by its own
head, and perceived pervasiveness as seen by the heads of other subunits.
The correlation betv7cen the tvlO was low, so pervasiveness as seen by
other heads was selected for the fu11 analysis since it best represented
the concept with the most data: subsequently, it was found to have a
stronger relationship to power.
Workflow immediacy'
Immediacy, a further aspect of centrality, is the speed and
severity with which the workflm\-s of a subunit affect the final outputs
of the organization. This was operationalized as the effect of
activities of a subunit on the organization's output of finished
goods.· The definition solves the problem of separating the activities
of a production dcparbnent from the output of an organization, a
distinction which has to be made if production departments are to
be analyzed along with the other subunits. It can then be asked

- 13 -
how long the shipping of finished goods (such as bottles and casks of
beer) could continue if particular tasks in the various subunits were
not done. Each department has outputs which have greater or lesser
effect on this. Accounting sends cash returns to head office,
engineering has to repair machinery, marketing prepares sales forecasts,
and produc tion (in a brewery) brc.vJs beer. Every au tput deal t ,,,i th in
pervasiveness was examined and classified in terms of having a,n immediate
effect (wi thin a few weeks), a long run effect (within a fe\'l months) or
. no effect. This scale of in~ediacy '(speed) produced a total score for I
the output,s of each subunit.
A second measure of immediacy (severity) was attempted also
from the intervieiv data. As an example of the difference between
severity and speed, lack of a cash forecast may not affect finished
goods for many months, but eventual lack of cash could cripple everything.
A machine breakdown may be immediate in terms of speed, but can be put
right within the hour having a very limited effect. Each subunit out-
put was rated on severity, but dou~t persisted over the adequacy of the
data particularly since it did not include direct financial comparisons
of consequences. As speed correlated much higher with pow'er~ the severity
measure was not carried into the final data analysis important though the
.notion may be.
The questionnaire item is sho,vu in Table 1.
Uncertaint:z:
Uncertainty is a lack of information about future events, so
that alternatives and their outcomes are unpredictable. Here the data
concern present uncertainty about future variability, derived from known
past variability. It is assumed that the greater the variability

- 14 -
previously experienced, the .greater the inherent uncertainty for any
department. Such an operationalization separates the nature of the
environmental and task situation facing each department from the
personal anxieties of its members. But it cannot include any anticipa-
tion of some t.otally unprecedented event, though no such anticipations
were found in the organizations studied.
From the interviews a list of ten inputs to the organizations
was compiled, being only those inputs which varied and as such"had
degrees of unpredictability of occurreJ;lce in the organizations studied.
"They ranged over such variable organizational inputs as market share,
capital supply, equipment operation, and quality of raw materials
(see Table 3).
These inputs were then "examined for patterning, defined as
the degree of constancy or variability in three elements, trend, range,
and regularity. The basic element is trend, for so long as some
direction can be discerned then a pattern exists and in principle could
be projected into the future. Add some constancy of range around the
trend line and there is more pattern present; if in addition the variations
,~thin the range are regular, there is complete patterning and prediction is
possible. Thus variation does not necessarily mean uncertainty if the
variation is patterned and predictable.
Table 3 here
Fro~ this a six-category scale of unpatterned variability was
devised (Table 3). It is a first attempt at dealing with this concept
leaving definition imprecise and sev~r.:ll problems unresolved. The
categorization does not explicitly include time, either in recency of
variations or their duration. Nor is the relative size of variations
..

- 15 -
explicitly included. But the scale does provide useful discrimination
with inputs in the organizations studied falling into categories one to
five. There is some bunching around 'Infrequent variation from regularity
o.r range, trend constant' '\Thich is to be expected due to the government
control of breweries' markets, and batch production with a high degree
of technological stability.
The unpatterned variability scores 'of the inputs in each suba
unit's area were summed to give! subunit score derived botl} from the
number of relevant inputs entering tne'scale and from their scores on
it. 'rhe range is from an accounting department facing no uncertainty,
to a marketing deparbnent facing frequent variations in various aspects
of demand such as market share, volume, and order mix.
Following Lawrence and 'Lorsch (1967) a further indicator of
uncertainty was 'definitive feedback', assuming that the less the feed-
back to a subunit on its results, the more likely it is to be working
in a vague, unknown, unpredictable task area. A measure of feedback
assurance was derived from three binary items; causal knm\Tledge, the
.degree to which the results that occur are known to have been produced
by the department's activities; specificity, the degree to which a
department's own activities are the sole determinant of feedback data;
speed, the 1e~gth of time elapsing before a subunit receives feedback
on its activities. Production and engineering departments have causal
knowledge, the feedback they get on.what they do is least contaminated
by the effects of ",hat other department do, and their feedback is fast.
Marketing departments have least assurance in these respects. It ,\Tas
found that feeback assurance correlated with unpatterned variability'
and ,·lith pm-Ier measures, so like the severity aspect of workflow
immediacy it was not carried into the final analysis though of itself
..

- 16 -
it may well be a useful idea and a likely operationalization.
The questionnaire item is shown in Table 1.
Coping is defined as effectively dealing with uncertainties.
Each subunit is faced with uncertainties which it must deal with, and
in so doing it provides pseudo certai::1ty for .other subunits in the
organization. For each variable input (as previously used for measuring
uncertainty), infonnation was collected on what th e relevant subunit( s)
did about .it, building up a list of coping responses for each subunit.
The engineering department in one brewery coped 'vi th uncertainties in
equipment operation by forecasting parts and replacements needs, by
routine maintenance and by having a maintenance crew for breakdowns.
A marketing department coped with market share uncertainties by an
explicit marketing policy, regular.markej:: share forecasting, and selective
. advertising directed at a specific market segment.
These coping activities were divided into three categories:
(a) coping by prevention, activities which reduce the
probabilities of variations occurring in the organization's
inputs.
(b) coping by information; activities which provide fore,varning
of probably variations occurring in the organization's inputs.
(c) coping by absorption; activities which offset the effects of
those variations which occur in the organization's inputs.
A quantification of number of coping mechanisms for each subunit 'vas
arrived at by adding them. Coping by absorption 'vas given double
wei.ght, because this is a positive response to variati.ons which are
no longer hypothetical. In an exploratory study, alternative manipula-
tions of data were tried, and this particular quantification \Vas justified

- 17 -
as an attempt to see whether its outcome had any relationship to anything
else. ,
But this figure takes no account of the amount of uncertainty
faced by each department. The theory states that the r~lationship
~etweeu coping and uncertainty is important for pO\.,er • Strategic
. contingencies arise in part from uncertainty~ and control of them
arises from coping. A measure of coping with uncertainty is necessary.
For this unpatterned variability l·las divided into quartiles
of low, lower middle, upper middle, rind high. A similar procedure was
'folloHed f.or number of coping mechanisms, and the two sets of categories
were combined. The categories range from high patterned variablity
with high coping to 10\., patterned variabilit:Y with low coping. The
resul ting categories were then ordered, adop~ing tl'e principle that any
moderate coping with high uncertainty was of more consequence to the
orgimization than ful1er coping with les.s uncertainty. To the sixtee.n
possible categories a seventeenth viaS added to deal with a department .
facing high patterned variability but having no coping. There \Vere
subunits in ten categories, ~vhich were scored ore to ten.
Routinization
Routinization, the process of rationalization and procedural-
ization, is linked to the theory in two ways, according to whether it
is preventive or coping. As it was beyond the resources of the project
to collect interview' data 011 the detailed mechanisms of routinization,
it is the only variable represented by questionnaire data alone. The
three questions asked are shown in Table 1: they do not distinguish
betw'een preventive, and coping routini~ation.
Responses to questions (b) and(c) were combined into a single
perceived procedures score, justified by their 0.90 correlation.

- 18 -
Question (a) correlated 0.13 with both (b) and (e), but also 0.10 with "
the uncer~ainty question. Since its wording on 'circumstance change' , .. might refer as much to uncertainty as to routinization it was abandoned
as not being clearly either.
PO'tver determination of the
Power is defined by Hickson et al. (1971) as the/behavior of
one social unit by another. Following Kaplan (1964) it is seen as
having three dimensions, weight (or a:rnount), scope (or ranges bver
behaviors)· and domain (number of persons or collectivities \.,hose behavior
is determined). In this research domain is constant, since for anyone
subunit it is the three other subunits in the organization.
Due to controversy over the measurement of pO\ver (for example
Clark 1968), the multimethod, multim~asure strategy is especially appro-
priate for this variable. From the interviews data were collected on
position power, that is, formal, legitimate authority, and participation
power, that is, involvement in four postulated stages of decision:
.initiation, information provision, choosing the course of action, and
implementing action. From the questionnaires, perceived power data
were collected, that is, influence reputed to the subunit.
Recognizing complexity of power in internally fragmented
or~llizations and the likely invalidity of respondents generalizing
across unstated areas, power data were gathered with the use of a list
of seventeen 'issues' (amended to eighteen issues for container
organiza tions)'.
These are listed in Table 4.
Table 4 here

o - 19 -
They form as comprehensive a statement as possible of (all
those) recognized and recurrent problem areas in the organizations
studied in which more than one department was usually involved. The
list was compiled from exploratory interviews in breweries and checked
with all chief executives. All four areas of finance, sales, engin-
eering and production are represented. was
The aim/to produce a set of
issues which 'vould allow statements to be made about po\l1er ove the most
central and frequent problems.
From the data on position pO\ver two measures were extracted,
position power (scope) and position power (status}. The former is
the number of issues from among the seventeen over which a subunit has
formal. authority as defined by the chief executive. The latter is
the hierarchical status of the department heads, scoring through levels
from vice-president down to being subordinate to one of the other
department heads.
For participation power each department head was asked about
the role that his department and the others played in each of the four
postulated stages of decision on each issue. From the accounts of
the four heads a composite story '-las derived through cross-checking. ,
In these small systems of four subunits each, the accounts tallied
oven.;rhelmingly. Questionnaire data on perceived power were collected
using the format developed by Tannenbaum (1968), as shOvnl in Table 1.
In all, nine main measures Here developed, as defined in
Table 8. The third, sixth and seventh of these on 'net deviation'
require additional explanation. The theory suggests that by control
of contingencies a subunit may gain pmver over the issues which are
formally in the area of another subunit. The three measures deal
with this by counting how often a subunit participates outside its
area,offset by any participation of others in its area. Issues were

- 20 -
allocated to functional areas as shmm in Table 5.
, ' -----------------------------------------------------------------------
Tables 5 and 6 here
Table 5 is an example of the perceived power (weight) scores
of the four subunits in one bre\very, sho1;ving both scores on each deci-
sion issue and the overall means which are the scores used in the full
data analysis with the other variables. The underlinings emphasize
how the production subunit has power'right across the board whereas
marketing,- for example, whilst povlerful in its own area, has a lesser'
place outside that. It is this kind of picture which the issues list
was designated to reveal, rather than to leave it obscured behind a
single question.
Finally, Table 6 shows the scores obtained on those measures #
selected from many operationalizat~ons for the exploratory analysis of
relationships between variables.
Methodolo2i'l.
A methodological objective of the pr.oject was to represent
every concept by more than one measure, the measures to cover at least
two broad classes of data, questionnaire and non-questionnaire. This
was achieved for all concepts except coping and routinization. The
results on the other principal. independent variables are summarized
in Table 7. Here and with subsequent correlation levels of confidence
are not given: with a small n, the correlations are looked to primarily
for guidance.
Table 7 here

- 21 -
The question is ~jhat equivalence there may be bet'veen the
dual measures, questionnaire and non-questionnaire? There are the
knO\·m differences not only in data collection method but in form of
operationalization. Unpatterned variability, the past variation in
organization inputs in the subunit task area, differs markedly from
the question on 'uncertainties' with which it is compared: non-sub
stitutability of managerial members differs from responses to a general
question on how easy it would be 'to replace (a) closed department'.
The other dual measures match more exactly. . WorkflO\v immediacy,
calculated on speed of subunit effect on organization output 0.£ finished
goods, goes with questionnaire responses on precis~ly that: workflow
pervasiveness calculated on activity' Hults between subunits goes with I
responses on 'connections'.
Whatever the prior presumptions of equivalence, the correlations
obtained are of moderate magnitude. This implies that in research designs
neither of these forms of data alan should be casually taken to fully
'indicate a variable, as they so often are. In particular, results
are taken to be the 'whole truth' when they are derived solely from
questionnaire responses. This is not a case for mul.tiple forms of
data in ~ll research, but for frank acknowledgement in projects that
~ny one form of data used is unlikely to be the only data available
and meaningful. In the present project, Table 7 may be interpreted
in two ways. On the one hand, there is not sufficient equivalence
to justify dropping one or other set of measures; impersonal data is
contributing something different from individual perceptions. On the
other hand, there is sufficient equivalence to infer that fundamental
organizational variables common to both measures are indicated; and
to sustain an assumption of their mutual validation which gives a much
stronger overall data base f~r the project than would be provided by
either form of data alone.
Larger correlations are obtained between most of the nine
measure of pOYler in Table 8. A more detailed analysis of al ternative
measurments 0,£ power is to appear in Binings at al. (1973), but even a
superficial glance at Table 8 8ho\'7s the wide agreement between the
meaSures used. Questionnaire and non-questionnaire measures are
highly correlated, perceived pO':17cr (weight) correlating 0.92 ',,1th
participation power (involvement) and 0.80 with position pO\<ler (scope).

o - 21a -
.. Table 8 here
---------------------------------------------------------~---------------~-
So participation in stages of the decision process is more often than
not tantamount to exercising power, at least as pm..rer is seen by those
involved. The breweries are shown to be stable power systems in
which actual power as seen by subunit heads is close to authority
(positional power) as defined by the chief executive.
The follm..ring analyses will .focus on the three measures
mentioned above, perceived pOHer (vleight), participation power (invol ve
ment) > and position pmver (scope), which though highly intercorrelated
nevertheless indicate three different aspects of power with correspond
,ing1y different operationalizatibns.
Correlational analysis
A previous paper (Hickson et a1. 1971) defined the research
task as elucidating which combinations of values of the independent
variables might lead to po\ver.
tations towards this end.
The data available allow first interpre-
It is possible to analyse the data both across O'ii'"ganizations
and within organizations. The resul ts vli11 be examined first in the
form of correlations across organizations (on twenty brewery subunits).
Table 9 here
-------------------~----------------------------------------------------
Table 9 shows the correlations betwee~ the main independent
variables and nine measures of pO\ver. I t 'is immediately obvious that
with a few exceptions, each independent variable relates to any or all

'- 22 -
the pO"tver measures to much the same extent. Thus for exploration
towards explanation, little is to be gained by fine di~tinctions among
the full range of power measures, for the three measures suggested
above will suffice. In particular, in these small and stable organiza-
tions the idea that povler in the nominal spheres of others is crucial is
not borne out by the correlations with net scope deviations.
Hmvever, though each independent variable relates consistently
to povler, a second and equally obvious consistency in the correlations
is that non-questionnaire data correlates more highly with all data on i
power than does questionnaire (perceived) data. The difference is not
great enough to suggest that the questionnaire data may be ignored, and
both sets of measures will continue to be used. But, if anything, non-
questionnaire data tends to give the most favorable test of the theory. , .
The exception is workflow pervasiveness, where the perceived
measure correlates highest \.;rith power. _ Any interpretation is speculation
when first using crude measures of the kinds devised, but this difference .
'-lith pervasiveness suggests tha t perceptions recorded on questionnaires
might reflect 'informal organization' in the form of interpersonal inter-
action) which could be important to subunit pow'er but is not covered by
the non-questionnaire counts of workflow links.
Only two variables do not relate positively to power. Perceived
procedures (non-routinization) shmvs inconsistent and negligible coefficients.
Th(;'! use of merely two questionnaire items to represent so complex a concept
as routine \-lould seem to have failed. The same reservations must be made
about the single item scored for perceived uncertainty, which also gives
very small correlations. There is the extra difficulty that this question
may be picking up an unknm"rn proporti.on of the personal uncert:ainties
of respondents their anxieties and insecurities.
Unpatterned variability, coping 'vith uncc.rtainty, immediacy,

- 23 -
non-substitutability, and pervasiveness all relate positively to power
as the theory p~edicts. Gaping corr~~lates most highly with povler, a
result predicted by the theory of organization survival in uncertainty.
Since the coping with uncertai~1ty score includes unpatterned variability,
this latter measure can now be dropped.
Thus the correlatiorsaccord with an interpretation that coping
plays the lead in power, supported 1;>y immediacy, non-substitutability,
and pervasiveness in that order.
Th~s interpretation is reinforced by the partial correlations !
in Table 1.0) using those measures most highly correlated with pO\ver.
Table 10 here
Coping's. relationship with power ( r = 0.81 ) is affected
more by h?lding immcdtacy constant (p = 0.65) than it is by holding
non-substitutability constant (p = 0.74). The relationship of
innnediacy with pmver falls when it 'is isolated from that of coping,
but in turn immediacy appears to overwhelm the relationship betv]een
non-substitutability and power. Coping's leading role is underlined
by its correlation w·ith pO\-Jer ~vhen both the other variables are held
constant. Though too much should not be read into correlations on a
small n, trial ulultiple regressions suggest the same interpretations,
\·1ith coping having the major effect upon coefficients with power.
Taking these analyses overall, immediacy and no~-substitutability
,...,ould appear to play secondary and possibly interdependent parts,
with pervasiveness a \veak third.
Further corroboration appears from the groupings of variables
by successive magnitudes of correlation in hierarchical linkage analysis.

- 24 -
Hilgendorf et al. (1967) argue that this technique as developed
by Mcquitty (1964) is useful for offering hints about the comparative
strengths of interrelationships, and about likely causal patterns.
Hierarchical linkage analysis may clarify linkages between clusters of
variables> an -improvement upon elementary l.inkage analysis (NcQuitty 1957).
Again, coping a::ands out in such an analysis, w"ith immediacy and non-
substitutability of managerial. staff appearing to act together in its
support.
The data were also subjected' to regression analysis -'vhich i .
produced the same result 'as the linkage analysis and pointed to the
possible interactive relationships between the main variables. Again
such analysis with this data can only be regarded as suggestive.
Non-correlational analysis
Analyses sO,far have relied on correlation of scores of
twenty subunits irrespective of the organizations in which all subunits
are parts. Since th·,;! bre\very organizations and their subunits were so
ali.ke in product and in function, it is possible to drmv guidance from
these correlations with the implicit- assumption of a sa.-nple from a homo-
geneous population of subunits. But from another point of view, such
analyses can be challenged. Power exists among interrelated units,
that is, within pOv7er systems. Since the four subunits from each
\ organization are 100 percent samples of the subunits in that power
system but do not necessarily have a pm;7er relationship with other
subunits in other systems, the most valid measure of a subunit's power
should be its relative pmver ranking solely within its 0\,'11 system of
four subunits. This further analysis within each organization therefore
\vas carried out independently by a member of the research team \vho was
not fami1:i.ar ,<lith the correlation results.

- 25 -
" An advantage of this analysis 'vas that the available data
could be ~nlarged by the inclusion of the two divisions of the container ,
organization, since these could be examined separately from the breweries
and not merged with them as correlation would have required. This also
tested the theory in a second and different industrial situation.
Whereas ~he breweries were branches of large combines and in predictable
markets with detailed public regulation, t~e container organization was
a remaining independent survivor in a rapidly changing industry with
unpredictabl/e supply and demand and comparatively much less governmental
restraint., The t,vo divisions of the container firm were treated as two
systems of four subunits each. Though the accounting and engineering
subunits vlere common to both (that is, an actual total of six subunits),
separate data \.;rere obtained from and on these subunits for each division
where appropriate ' .
. An a!1aJ.ysis' of seven small organizational power sys tems of
four subunits each can be done almost case-study fashion, case by case,
as the project design intended. Comprehension Has visually aided by
the comparison of profiles of scores.
Profiles put flesh and blood on the probabilities of
correlational analyses. They show whether or not apparently coincidental
variables'do in fact come together in specific cases, and encourage
greater confidence in causcl suppositions from their occurrence in specific
, combinations with pmver.
Five recurrent strategic profiles appeared. To visually
highlight the' differences between them, their simplified outlines are
given in the fi~st row of Figure 2 where they are called initial-types
to indicate that they are in tended for continual al teration by further
empirical research.

- 26 -
------------------------------~----------------------- -----------------
Figure 2 here
These types appear in Figure 2 alongside three sets of examples which
illustrate most of the variations found.
Both forms of data (questionnaire and non-questionnaire) are
plotted) and profiles pass through midpoints between scores if these
differ. The points plotted are the orderings of each subunit in first,
second, third or fourth place within.its organization on each measure,
'which standardizes for comparison. The procedure was to rank the sub-
units within each organization on power (t~vo measures used here), and
then to see whether any uniformity of'patterns appeared at each power
level among the strategic contingencies variables.
numbers of subunits with profiles 'of each type.
Table 11 here
Table 11 shows the
---------~-------------------------------------------------------------
First rank top pQ\.;rer (both pO'lver scores in first place) is
achieved only with strategic profile A, that is, top scores on all
strategic contingencies variables. Nothing less than top rank coping
with uncer,tainty, and immediacy, and non-substitutability, and pervasive
ness will do for dominant power.
However, this says that if you have everything, you get every-
thing! Equally interesting is the question how much do you get if you
have something but not everything? It is clear that copiug with uncert-
aintY,alone does not give first rank power, but it does occur in profile
B with second ra'nk pmver (see especially the profiles of the first and
third of the three marketing subunits in Figure 2. The importance of
coping to high power is implied v,hen it is realized that all subunits

- 27 -
in the first and second pOvlCr ranks have first or second rank coping,
but none of the others do.
Strategic profile C shows high non-substitutability, with
moderate immediacy and coping, and it occurs Hith power scores spanning
the second and third ranks. Speculatively, it suggests a subunit at a
point 'where with just a little more coping and immediacy it might approach
top rank power.
Profile D is a weak pattern vlith lower coping than more power-
ful subunits, and little or no compensation from other variables. It
goes with ,third rank power.
Finally, profile E typifies subunits in the fourth rank of
power, or those with one power score in each of the third and fourth
~anks. The feature of this lea~t powerful profile is high pervasiveness,
as high as the pervasiveness of the most powerful subunits. This
suggests tha t pervasiveness on its 0\'111 is of little or no consequence.
More than that, by itself it appears to relate negatively to pmver, a
burden of task links without reward in pmver terms. The analogy is
plain \vi th the power ful guy \v!lO has contac ts everywhere through \vhich
he exercises his other sources of pm,Ter, versus the po\verless guy who
has contacts every,,,here but not other sources of power so he remains
I all talk' ..
Figure 2 al so shm'ls an engineering subunit which has only fourth
rank power despite its highly ranked immediacy and non-substitutability.
This case appears to have a particular explanation. Though organizations
were selected to minimize the risk of major ~dnship or other individual
effects, in this case the head of the production subunit acted beyon'd
thts subunit in a-general manager role. Through his dominant personal
position he limited the range of activities of th<:: engineering subunit

'.
.,
. - 28 -
in the planning, obtaining, and maintaining of equipment, thereby
limiting its coping score and its power.
From 28 subunits (see Table 11) this leaves three other low
pOvler engineering subunits similar to the above case but unexplained
(the engineering subunit of organization Be in Figure 2 is one of these,
.being omitted from the figure for simplification). Despite their high
immediacy and non-substitutability, they are among the least powerful.
Why? One possibility is that the result is due to especially inadequate
coping data. Their scores on the questionnaire item on perceived
. uncertain~y are exceptionally high, as if they do face more uncertainty
than the coping with hncertainty scores indicate, yet cope with it less
than is indicated. I f so, this \vould be a weak posi tion.
In summary, the strategic contingencies' theory variables
explain 24 of 28 subunit power rankings. The profiles suggest that
high scores on all variables in combinat:ion are essential to top power:
coping is foremost in importance to all high power, with immediacy
frequently contributing to second rank power: non-substitutability
appears in the top pml1er combination, but thereafter contributes mainly
to second/third rank power: pervasiveness above a general I!linimum is a
nec,essary condition of top pOlver but is by itself an impediment.
,Table 11 summarizes from Figure 2 which subunits have which
initial-type profiles and \vhat povler rankings. The pmverfulness of
production subunits and the powerlessness of accounting subunits is
conspicuous in these bre\lery and container organizations. In the latter,
which make and sell packaging mostly to order, marketing might have
been anticipated to rival production. Since the production subunits
could do little until the marketing subunits had obtained and fed in
the orders, since the marketing subunits influenced design order by

C)
...
- 29 -
order, and since 'without orders the main production workflows would
cease, marketing ,,,ere in a vital position. 'This was reflected in
higher workflow immediacy scores than the brewery marketing subunits
obtained (see Figure 2 marketing subunits with second rank power) for
in brewing production was not to order and the marketing departments
'were less immediately rclevant to it. In line with the contrasting
economic environment for which the container~divisions were selected,
marketing had higher coping with uncertidnty scores, than in the bre'Yl-
eries. Yet as the marketing subunit in the container organization
in Figure ,2 shows clearly (Figure 2, organization Be), marketing '\vere
still too substitutable and not sufficiently pervasive to match pro
duction IS pQ\vcr. Narketing staff picked up the job wi thout the
technical training required for brewers, nor did they inherit the
almost mystical image of an age-old skill which still attached to
brewing: and they lac;:ked the all-pervasive involvements with the
engineering and accounti.ng subunits which were characteristic of
production Hhose equipment had to be maintained and whose every activity
had to be recorded and costed .
. Unfortunately, there are no obvious clues from the data,
which when quantified is in non-equal interval form, as to how close
to production 1 s pow'er the marketing subunits came. Here they closer
in container organizations than in breweries? It is clear only that
five came into second place .
The weakness of accounting departments may be held to fo110\'1
from v7hat they did. They kept records of everything, and sent reports
to and collected infonnation from everyone (see Figure 2, high pervasive
ness of accounting subunits ,-lith third to fourth ,rank potver), but took
no action on this themselves and hence influenced no-one.

- 30 -
It must be emphasized that there can be no generalizing from
Table 11 that production subunits are the most powerful in all manufac
turing organizations. For e)rample, Perro"1(1969) found that marketing
subunits dominated the American firms he studied. The project reported
here ,';ras designed for refining theory rather than for descriptive
generalizations. Only far more extensive samples can tell how much
power given kinds of subunits do have, as well as whether the patterns
continue to accord with the theory now developed.
Conclusion
The results of an exploratory empirical study accord with
the plausibility of the strategic contingencies explanation of power,
',,,i thin organizations. The design for this project aimed at offsetting
sample 1imi tations vIi th comparatively intensive data. On the one
hand, confidence is l~estrained by the coverage of only two kinds of
organization, and these both industrial. On the other hand, the sample
covers seven complete (small) potver systems; variables have multipe
representation in forms of data and in measures; and the data are
consistent in successive correlational analyses across organizations
and in profiles organization by organization.
Refinement of the theory comes from the examination of combina
tions of variables and of the apparent relative contribution of each.
Strongest support for the theory is from the evidence that only a combina
t ion of high values on all the variables postulated by it gives dominant
first rank power. 'Uth this combination, a subunit I s activities become
contirigencies for others upon which they are critically dependent.
Unless it copes, ;:hey suffer the uncertainty: what it does has immediate
consequences for the ultimate common outputs: the other subunits cannot

C) - 31 -
look else~vhere for alternatives: and much or most of what they do is
linked to what it does.
Neither coping alone (that is, combined .vith low values of
other variables), nor immediacy ,vith non-substitutability, gives such
pO\\fer. Immediacy of activities makes its greatest impression upon
power when the activities fend off the impact of uncertainty from othelS;
and non-substitutability is of little consequence if the non-substitut-
able activities absorb little uncertainty and are not immediate.
Pervasive task links are a necessary' condition for the pOi\ferfu1 combina-
i tion of the other variables, but by themselves are at best irrelevant·,
I
at worst a hindrance to power.
In importance to power, the strategic contingencies va:iables
are probably ',,,eighted' or ordered with coping first, then immediacy,
then non-substitutability, and lasty pervasiveness.
Up to a point, this is in line with C~ozierls (1964) stress
on uncertainty. Coping with uncertainty is the variable most critical
to power, and is the best single ptedictor of it. But it is far from
being the only factor contributing to pO'wer: the maintenance engineer-
ing sections studied by Crozier (1964) must presumably have obtained
power with a strategic profile A (high on all variables) or, more likely,
Crozier WaS inferring not first rank pm'ler but unexpectedly high second
rank power with a high-coping profile B (Figure 2).
Clarification of the likely parts played by the variables ....
included in the theory exposes the need for direct operationalization
of the contingencies concept, defined by Hickson et al. (1971: 222) as
'a requirement of the activities of one subunit "'hieh is affected by
the activities of another subunit'. The project reported here did not
attempt this, and so has no measures directly describing the risks and

o - 32 -
consequences of each subunit's performance for the others. How do wotk
activities vary in their effects on other activities? The project
relies on inferences from the values of variables \vhich appear to make
such contingencies strategic for pO'tver by 'creating dependences (Emerson
1962).
To switch the perspective, future research might create from
the strategic contingencies theory, which iS,an hypothesized theory of
why pOvler is dl£ferE:ntiated in an organizational power sy.stem, models
of how the power system works. In other words, it should be possible
to use this explanation of power to trace the processes by which power
is won in the 'power game'. The implications of the refined theory
for models of ,p.0Hcr attainment can be brought out with a touch of
'melodralua: if you want dominant power, go f?r everything - take advant-
age of inmlediacy, reduce your substitutability, and then make a bid for
a decisive area of uncertainty - or alternatively, first go for the
vital high coping with uncertainty, though this carries a risk of being
left frustrated in second place unable to increase immediacy and decrease .
substitutability sufficiently to move up - but whatever you do, don't
get involved in a netw'ork of interaction links before you can dominate.
it, or it may hold you down.
,Speculative though this language may be, it suggests two
models of routes to power as in Figure 3,(a)and (b). Of course, there
c '~il1 be morc. These two are no more than guesswork inspired by a
descriptive knowledge of the subunits studied.
Figure 3a and b here
- 33 -
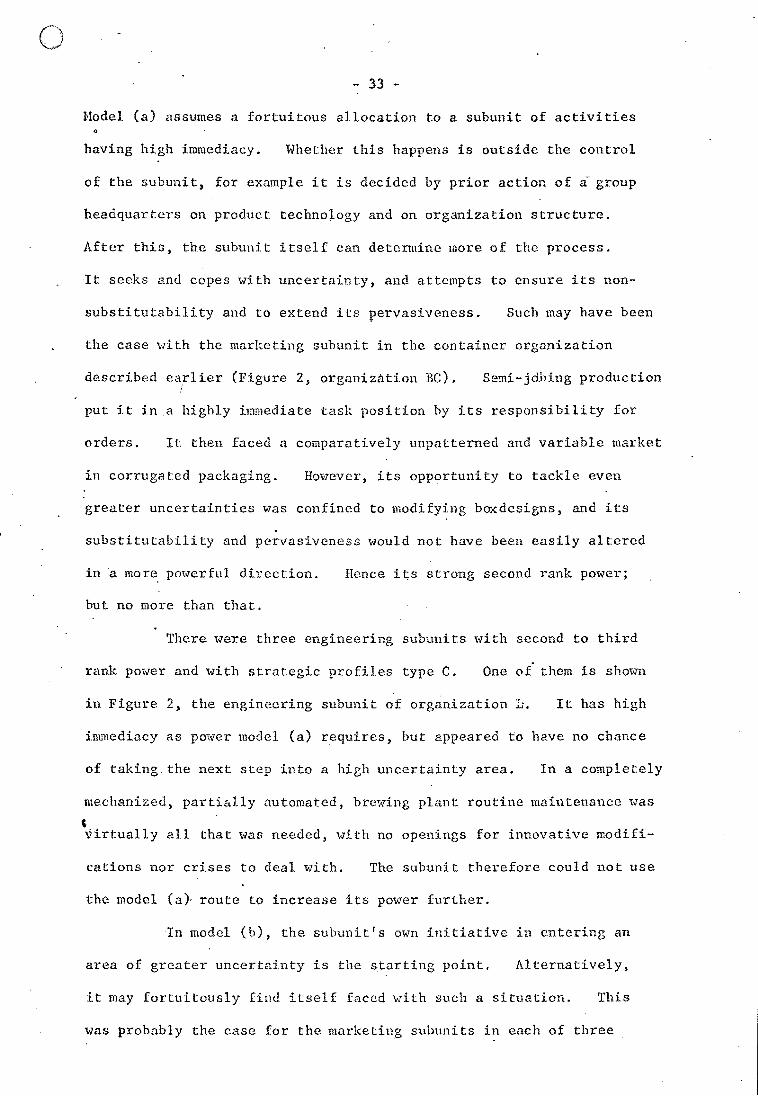
Hodel (a) assumes a fortuitous allocation to a subunit of activities
having high immediacy, Whether this happens is outside the control
of the subunit, for example it is decided by prior action of a group
headquarters on product techno~ogy and on organization structure.
After this, the subunit itself can detennine more of the process.
It seeks and copes \vith uncertainty, and attempts to ensure its non-
substitutability and to extend its pervasiveness. Such may have been
the case 't\lith the marketing subunit in the container organization
described earlier (Figure 2, organization BC). Semi-jdbing production
put it in.a highly immediate task position by its responsibility for
orders. It then faced a comparatively unpatterned and variable market
in corrugated packaging. Ho,\vever, its opportuni ty to tackle even
greater uncertainties was confined to modifying boxdesigns, and its
substitutability and pervasiveness "lOuld not have been easily altered
in a more, powerful direction. Hence it;s strong second rank power;
but no more than that.
There were three engineering subunits with second to third
rank power and 'with strategic profiles type C. One of them is shown
in Figure 2, the engineering subunit of organization ~. It has high
immediacy as pmver model (a) requires, but appeared to have no chance
of taking. the next step into a high uncertainty area. In a completely
mechanized, parti&lly automated, brewing plant routine maintenance was , ~irtually all that was needed, with no openings for innovative modifi-
cations nor crises to deal with. The subunit therefore could not use
the model (a). route to increase its power further.
In model (b), the subunit's own initiative in entering an
area of greater uncertainty is the starting point. Alternatively,
it may fortuitously find itself faced with such a situation. This
was probably the case for the marketing subunits in each of three

()
, - 34 -
competing breweries. The trend of overall beer consumption was
extremely stable, so that any market uncertainty would arise from
shifts of brand allegiance within the total. When the third of
the breweries entered this market, its marketing subunit (also referred
to earlier) adopted an explicitly thought out range of coping activities,
including deliberate utilization of market research information, aiming
for one sector of the market rather, than others, and advertising care
fully designed for that aim. Hence the subunit's high coping in
Figure 2, organization L. But in terms of model (b), the subunit
appeared unable to rai.se its immediacy (this is where the model requires
, fortuitous circumstances to support the subunit's power) to decrease its
substitutability or to extend its pervasiveness enough to rival production's
.paiver. Though its forecasts Here followed by production, this was not
with the order by order immediacy of a jobbing firm: sales staff were
comparatively easy to find and so to substitute: and its contacts with
the engineering and accounting subunits Here minimal.
The theory implies that 6i fferent subunits ,·Jill travel such
routes to paiver at different tiraes as the circumstances in and around
organizations change. ~ndeed, resistance to change or advocacy of
change may stem from intutitive understanding of its impact upon power
in terms of theory. Charfging fields of operation (markets), changing
technologies, changing outputs, will all affect pm\'er. In this con-
tinual shifting 9f power, uncertainty plays a role which places the
strategic contingencies theory firmly in Hhat Thompson (1967) called
the net., tradi tion of analyzing organizations as systcrn s in l,ndeterminacy.

Table 1
EXAMPLES OF STRUCTURED INTERVIEW TOPICS AND QUESTIONNAIRE ITENS I
INTERVIEW TOPICS (for guidance only; interviewers were not required to, follmo1 standard wordings)
Unpatterned Variability of Organization: Inputs (and see Table 3)
Does this input ever vary from normal previous experience? ,How do you try to deal \-lith this variation? Is it possible to adopt any routines for dealing with this? Hmv, and ho\v quickly, is it possible to evaluate success in
(subunit activities) ?
Workflow Pervasiveness and I~~ediacy of Subunit Inputs and Outputs
Where does each come froo1/go to (that is, to which department or organization) ?
How often does it occur? How quickly would the shipping of finished goods be affected if this was not done?
Substitutability
Hmo1 easy or difficult is it to obtain people for this job? What training/experience/formal education, if any, is required? In principle, how easy or difficult would it be ~o hire agents, consultants, etc., to do the work in this job category?
Participation Power
Stages of decision process:
i. ii. iii.
l~ho
Who Hho
raises the issue or initiates discussion? is involved in providing infol~ation or services? chooses the final course of action taken?
iv. l<Jho Who
implements physical action or keeps track of paperwork? carries out the action?
Position Power .
Which department has primary formal authority for this (problem)?
. QUESTIONNAIRE lTEHS (each item followed by the title of four departments in standard alphabetical order, that is, accounting) engineering, marketing, production)
Perceived Uncertainty
How many uncertainties does each of the £ollO\o1ing departments, including ypur mvo,have to cope with in the course of its work?
5 points: Very many uncertainties ... to ..• Almost no uncertainties
'1continued

Table 1 (continued)
Perceived Workflmv Innnediacy
Hm" quickly \'JOuld the closing of each 'of the departments affect the shipping of finished goods from the plant?
5 points: Instantly ... In a fe\v hours/days/weeks ... Not for a long time
Perceived \vorkflmv Pervasiveness
How far is the flow of work of your own department connected to the ,york of each of the following departments?
5 points: Very many connections ... to ..• Almost no connections
Perceived Non-substitutability
How e:asy \'lOuld it be to replace (a) closed de.partment - by any means - for example, by ne\v recruitment within the company, or externally, or by hiring agents or consultants?
5 points: Easy ... through ... Difficult ... to Impossible
Perceived Procedures (non-routinization)
Hmv far do circumstances change from day to day in each of the the following departments? .
5 points: Very often change to ... Seldom change
Hmv much of the ,York fo11O\vs set procedures in each of the following departments?
5 points: Almost none ... to ..• Most
How far does each of the following departments do the same vlOrk in the same way every day?
5 points: Seldom the S2me ..• to ... Very often the same
Perceived Power.
How much influence do you think each of the following departments has on problems about 'k product packaging?
5 points: Very great influence ... to ... Little influence
* Question repeatrid for each of 17 (or 18) issues (see Table 4)

Table 2
WQRKFLOl.J PERVASIVENESS: INTERCORRELATIONS OF 5 SETS OF NON-_QUESTIONNAlRE
INTERVlmv DATA
n = 20 subunits
1 2 3 4 5
l. To'tal links with other subunits
2. Total links with other subunits and chief executive .92
i , 3. Total links ,vith other
subunits, chief executive and external to organization .83 .94
4. Total input links .73 .81 .9l
,5. Total output links .76 .88 .89 .62

Table ·3
UN PATTERNED VARIABILITY OF ORGANIZATION INPUTS
(non-questionnaire interview data)
Organization inputs used in the measurement of Unpat:.terned Variability:
1. Demand: market share
2. Demand: volume
3. Demand: order mix
4. Demand: design requirements
5. Materials: quality
6. Equipment and parts: supply
7. Equipment: operation
8. Utilities: supply
9. Captial and/or cash supp~y
10. Customer creditworthiness
Scale of Unpatterned Variability applied to each input:
1. No variation
2. Patterned variation: regularity of occurrence within constant
range and trend
3. Infrequent variation from regularity or range, trend constant
4. Frequent variations from regularity or range, trend constant,
that is, incipient ehange of pattern around trend
5. Variation in trend: irrespective of regularity and range,
basic trend changes
6. Unpatterned variation: no trend

Table 4
ISSUES USED IN THE l1EASUREMENT OF POHER
(non-questionnaire and questionnaire data)
BreHing Organizations
a. marketing strategies
b. introduction of neH products
c. product packaging
d. interpretation of liquor regulations
e. . price
f. obtaining ra\ .. ma terials
g. obtaining equipment
h. operating performance 'of equipment
i. product quality
j. production efficiency
k. overall production plan
1. overall capital budget
m.overall non-capital budget
n.revie'\vs of the non-capital budget
o. salary revision
p. personnel training and development
q. personnel and labor relations
Container Organizations
Changes as follows:
Issue c. changed to product design
Issue d.omitted
Two issues added in response to emphasis by organization members in intel'vie\ls:
1. personnel recruitment
2. cost control

'n ~ t'l :1-"1i t~ DJ ::s n 0 ~~ til (l
fr 1-'- 0 CD ~ 5 0 cl' !J
It .. '" fD rt-.... ~'; h ~,
0 I.Q ..... rj ::s ::s til til
~ [t':l ------------) l~ ~il' ll~ ~ I ~: marketIng strategies I iN 0 N /" Vl
ll!~ I i~ I ~. ~ , 1-..1 I \0 -..I I Vl I IVl Vl
! \,;:, IVJ Itt,) I ~ ., !) i' 0
! ,0 V1 ID; ()l
N lw ~ I I~
introduction of ne .. ." products
product packaging
price I 0 jo 0 I I~ I N 1';-' ~ J N I interpretation of
J} t) cOl . V1 • ()l V1 ~ liquor regulations
i ,----'1----------!}~ '0
(Ul
!,p;. '0
Iv'
1-I· ~Jl I 1-:"
Iv' 10
I~ i?:-1°
1--'
-.l V1
N o o
It IVI
I~ I
r;1~-I ON
N I ~ • -.J VI
N ,)
o
N o
o -.l V1
l~~ j -.]' 1V1
N o V1
I tv • -.l V1
~..l. o -.J VI
tv • o
~
• o
N u 1\) v, N
obtaining equipment
uperating performance of equipment
obtaining ri1W materials
prodUct quality
production t~fficiency
overall produd:iori plan
Ll Pl ..... rv (/l
fll 11 c 01
g' 1O ....
r~ !:l 11 Q r;; (i) PI 1'1
1-" ::s LQ
"0 a o. c:: () IT .... o :::l ~~ 11 CD Pl
;0 .
1-:-1- '" I~-! -------
! {, I 0 \"
N 01
o -.J V1
I~ hj
overdll capital budget .... :::l
I :U1 I ~ (,.'1
N N N . ~ . _1 I -l -.l
V1 V1 V1
l~ l~
overall non-C2pital budget
reviews of the non-capital budget
fJ !:l () m Cl I, (!) p.! ~ I ~ ~
'~--. 1-------------.---------N • N VI
l~ N 1m
N " 1',) V1
I~ N
~ • -.] VI
N • -.]
V1
I-'
l~v [\.\
V1
I~
salary revlsion
personnel training and dCNclopment
....... "0 t~ (!) III t1 1-'00 8 0 1< 5
Q n- ..... 11
• V1
• N V1 l~
{:':I OJ 1-" 11 ::s (j t·p.! ::s til
!VJ
I \0 I, ~
~I' w ~- tv ~~- 0'~
persopnel ffi1d labor rel.:J.f:ions
• • 0 0 l'l ~ m 'D -..I -.J ~, ""
.:!f. . ~~ ----_.. .. ... _..... -- ----
l ~ H
I ~ t'1 ell '!
OJ (I)
CJ , ...... ..... o n (11 (";(tJ 0.
no rt (J {I)
A
('J 11 o rJ
. U) ,
........ o 1'1
I-ll § n-1-" o ::s (/l '--'
~ ~ rrs ~. g. n-
O tr I-n '< !J"~ ('.>
()) "". p. t'l ({l Ul
r; o rv ~. (,I)
Cl ....... ..... (1) ........ fD
CD .p;.
1-3 (;1 ;11 s::: tt tr' 1-' s::: (;) ::s 1-" ,,":. n- ....... (/l ::3 ~~
~ g o (/l Ii Q 0 (I) ~n
Cl (1-rr ~1' o (!)
'i .n C
('J (J tt L? o n-
,.--: 14 •
(II 0
ri" 9 =:t f:;) til rJ ,
:;:, ((,
11 ('v
g t1 rr r:, ~ I.
o ~ 1'10.0
(It
.n:;......,. (1., 111
(;) rJ ill
6-1-3 I-' ~J D tr ..... c:: () :3 o..~ (,)'-' 1"1 1-10 , ..... I-h OJ o ro 0.<: '-'ill
~
1-3
~ V1
'el t'l !:l:I 0' M
~ t"1 tj
'U o fii :::0 ........ s' r;1 H (t)
~' ........
o "lJ .p,.
[f) ,G
~ ~,
'Ej .tll
!;?1
£ tJ) '-;.0
Z H '--I l. '-l H o Z ~
~ ~l
~ f< '-'

Table 6
sconES OBTAINED ON SELECTED HEASURES
(non-questionnaire and questionnaire 'perceived' data)
n = 20 subunits
Mean Range Standard Deviation
1. Unpatterned Variability 5.8 o - 12 3.0
Perceived Uncertainty 3.0 2.0- 4.3 0.8
2. Coping with Uncertainty 5.5 1 - 10 3.1
3. Workflmv Immediacy (Speed) 10.9 3 - 19 4.1
Perceived \.Jorkflm'l Immediacy 2.8 1.5- 4.3 1.1
4. Non-Substitutability (overall managerial) 3.0 0 - 6 2,1
Perceived Non-Substi.tutability 2',6 1.5- 3.5 0.6
5. Workflow Pervasiveness (1 inks \vi th other subunits) 22.8 12 - 33 7.8
Perceived 'vorkflow Pervasiveness (perceived by others) 3.2 2.0-4.3 0.8
6. Perceived Procedures (non-routinization) 1.9 1.3 ... 3.0 0.5
7. Perceived Power (\<7eight) 2.9 2.1- 3.9 0.5
Participation POHer (1n,,01 vcment) 30.2 3 - 56 12.6
Position Power (scope) 4.3 3 - 6 1.3

Table 7
INTERCORRELATIONS OF SELECTED MEASURES OF I1~EPENDENT VARIABLES
USING NON-QUESTIONNAIRE AND QUESTIONNAIRE (I PERCEIVED I') DATA
n ::: 20 subunits
Unpattern~d Variability with Perceived Uncertainty
Workflow Immediacy (speed) with Perceived Horkflow Immediacy
Non-substitutability (overall managerial) with perceived Non-Substitutability
WorkflO't'l Pervasiveness (links tvith other subunits) w'ith Workflow Pervasiveness (perceived by others)
== 0.49
= 0.64
:: 0.52
= 0.38

TABJ.:E 8. TIJTE...'1CORrrELATIJlfS OF 9 !{E..\.S1J:'~S OF P01f.'ER
n =: 20 subu.'lits
f 8 -1---___ _ 1 1 2 3
I j. PERGZIV,SD por.~mI1.
4 r S ! 6 17 I I -~- • ., -.
I 1 ,... ho!-. " ',~elgJ. I.J
I I ? <-. C' . 2 0cope .93
3. Scope Deviation 3 .81 .93 •
~?;~~TI~~_I1~~;~~prT p~orlER
4· 5· 6.
7.
.,....., [1
.l.nVOl.VE~ment t
r: SCOPG ;J
,
:Get
Invol vGl!1cnt Deviation 6
Scope Deviation 7
.92
.86
.73
.47
.B4
.76
.62
.
.67
·59 .48 .33
.96
.87 I .94-I 51"1 I .:; .60 .68
1 PQSrrIOn pf)1imR
• 80 ',71 ·44 .86 Il' 87 ;
I j 8.
I 9. L
estionnaire~1.
,tn !:: -J-qu,estion- H. ire Data
5. .... b.
7.
~~ . t) ~
.55 .50 .33 .66 .67
I
~34 ~ 73
I .. 38 ·50 .68
8
'::::LqJ.U ." 9 Lr t,...l."" V ~J ,
____ '----_,_._, - __ - ___ ._.---'-___ -!-__ --l_.
I.'Iaan rating across 5 poin'ts by head.s of 4 subunits, including "self-rating", on each of 17 issues.
Nur:l:)~r of issues on .vi.-1ieh submlit rc.ted c.:t or above mean soore for all subtmi+.n in org,;:,niz8.tion.
lJur:lber of issues outside O':in tusk. area, 2..8 in ~rable 5, on which subu.'lit rated e.t or above me<?n, less issues in ovm are;:. 'rated below' mean. Numbor of decisicn stages in which subtmH participated in each of 17 issues, weighting as 2 any mentions in the
1!cho()sing action" staGe. Ih:.:nber of issues in which subunit part:i.ci~,)2..ted, irrespe0ti.:ve of "hieh st;':;1.Go of participation.
of decizion ste.Gels outside orrn -;;,").81;: area (See Table 5) in which su1nmit participated, less SC.::t.3es 1m O'\ITl area in vihicIl it did not participate: weiglrbinc as 2 Im.y tlentions in the :!choosing action" stage.
Nu::tc,cr: of isst:cs., c2.1culated C.~; 6 above.
TT"'b 0' <-' ·"C··'~· r·,"· 'h'~h '" b'" }" .. " f' "-"1' i'11"~"')"d 'l"I"C' o"-~"'l';" ... ,.\...Un 8 ... OJ.. ~"'·,~"".\;"hJ • C,t. ,~ l\"... ,,-,U UJ."1J .. T, .I. ... ,:.. .. ..., Ol...J,.h:" _y c~ J.V' .• ct.lI€. _...:: • ...rI'> .. l":) .... LI~ - TtJ" ,.
lI:~ .t; O~~· 1(,781 of to y;b.ic~l t is a";j"t:-:C:lv(],.

.. I •
2.
'/',
I ... "
-,,-
6.
TiillLl. 9~ CQRtt~L.'J,r~IQi\;o OF S~J.:;GT~D j.lE; ... STjl:~:::3 OJ.P l~'n)EP~lE)3£JT -vtJ~I~ill1b8* ~';lJ:!~r l"O~r~J:~
Dnp2,ttv:rncd Vo.riubili ty: POTcci ,,"'cd U'ncc:rt2.i11t3''':
CopinC{ l.:i til Ul1ccl~tJirJ.ty:
" . ~l I ,. ( - ') "o1"t;-r 0" a i'~r''1 r. 'yo i.:;l' 'coo. • , .... ~,l. ~i •• ~V\",.\. ..... <..;. "" l' •
)i.T LJ; cdiacy:
!~Oll-St~osti tJ."0abj,J.ity (Ovvr.:;~ll iJ.t:lilJ.[;Gl ial) : .I.'0J,'Cc:i'lGd iiol1-SUbsti-Ctt<lbili ty:
'~'~' o!:}r f1 Ct·1 ?OJ:'1 asi V0110 S~ ',,' ,.~ .;.." "'.c;." ..•• <::",o" .. ,\~ ts)' :..J ~I.J.. \I.U .J l.,i .. ", ..... ..I.. \.,JV- 1.01.1... • ..1. til
~;"o:l.'kflo~; ?orV<lSiVCn0SS: ( r,:'rf"'; -. "'c' bOT O.!..'l-·'''S) }:'''-'' .... v_~....... ,J \,.oj. u .....
PO~C0~V0d Proc0duT0S ( .. ;on-houtL·~izut:Lon) ;
n 20 ,subunits
I ip-"-r-_'!."..c;. PO'!9l: I -g .l"n:~~a_tiq.~ Pm!",- r:~ii.:l;.i_OA -"2't_'l.1
If " 0::1 12::1 rol r-I l:l o~1
P..O I .. : 0 0 I 0 0 P.o o .,-1 ':) r-! +> :>.r-! 0 'r-!l +> I o+> :>fao.r:: ~.:..)+> {)..;..:; t'l
I -2' 0 C) c~ r-I'r-! i:l? t.() 0 H I::i (j (I), d, (J :::J ~" P.. 'r-! 0 0 rJ -.-1 I .j:)", ',~) 'r-! 'ri P" +'
"r:! 0 :> I :> () +' • ) 0 +.):1::-' +>;> 0 rj ~ ! ,0 .() /1 ''0 m ;:: I Y .:~;> i) S~ do+,
~ • .c;. .:I). ,::'l!.-I "--' 1.,1) c'-';> • '4,.:., :"':)1 If.l iJ)
" , ~II·· 1 0 ! ••• , •.
-..----+-- (\!~ ~~.-i-. ".~ i-"':':::- ;:0 __ !'-_t_f_.~ _..i..f::..._
, 70 I 56 33 I 70 I 70 64 Zi I 78 3/~ 1C: '02 -10 I "'/3 1'2 13 ';" ?() 0"2 i .!...l 1-,--- -...1-'2. _lS. I _.,.I.. •• _- J...? I ....!.~. .~
I I ' I 81 ,69 54 i 74 I 73 64
i
73 75 68 I 65 I 54 52 .52 le7 A?. ,.3A I JJI. ).J~
60 ')!," .f:t.~
Z7 5.1
.0..6
I ' I I II ,
I 56 61 40 i 31 24
I'.fa ).7 .u . f .06 -.oJ~
,I
I
I 32 39 31 ' 26 28 (. r t! J ,- t Ji'~' 2'/ ,')2 ,;.0. I i·..... 't.:I 0
, -_. -- -.:..<. I - ---I I I I ' ~ -?-Q -26 1.9..4 ! Q2 9.2.
I I
44
le.o . .:u
13 -.til
52 ,98
02 ! -_.. I I
67
44-,2.5..
17 0':1: .::..t.
-01 l:2.
.:11.
44
13 0 ", •. .£
11 .o_Q
19 )J.
II
*Ccl~rolaticl1s -vlit:l qUGstionnc:irc .o.2<.,":::'u undo:dinQd
"
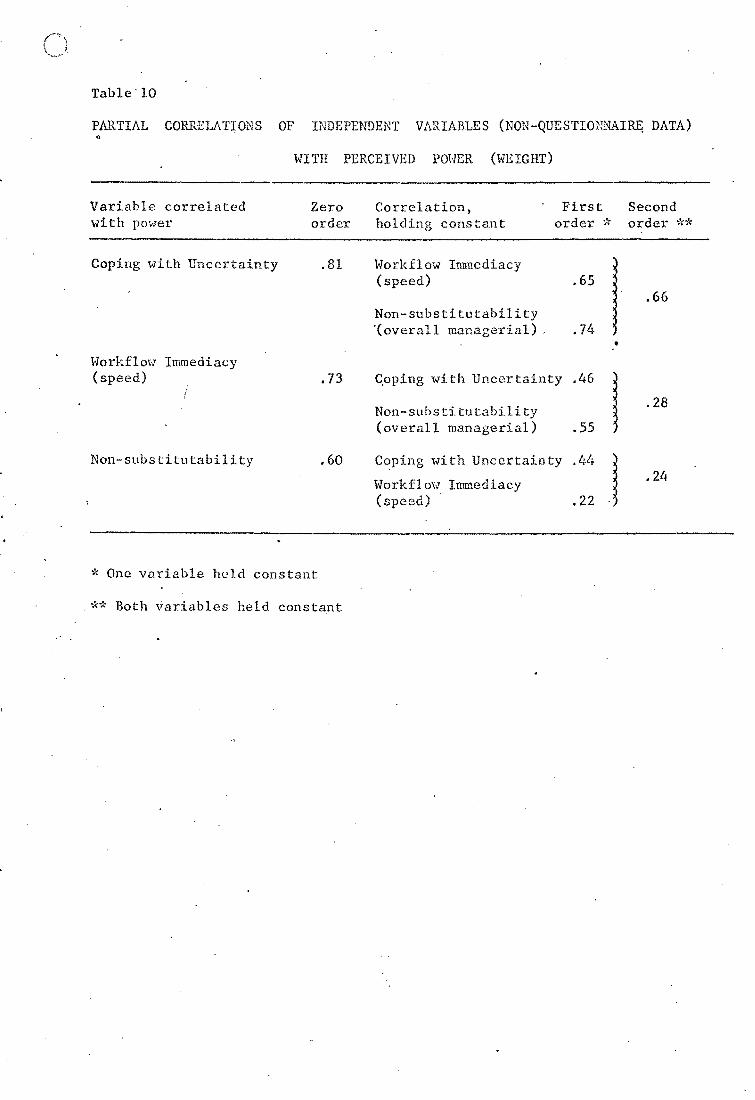
Table'IO
PARTIAL CORREJ .. ATIONS OF INDEPENDENT VARIABLES (NON-QUESTIONNAIRE; DATA) .. WITH PERCEIVED POHER (HIUGHT)
Variable correlated Zero Correlation) First Second with power order holding constant order "'k order **
Coping with Uncertainty .81 Workflow Immediacy
I (speed) .65 .66
Non-substitutability '(overall managerial) . .74
"
Vlorkflmv Immediacy (speed) .73 Cpping wi th Uncer tainty .46
1 Non-substitutability .28
(overall managerial) .55
Non-substitutability .60 Coping with Uncertainty .l~4
l Workflow Immediacy .24
(speed) .22
* One variable held constant
** Both variables held constant

Table. 11
~UBUNITS APPROXI~L~TING TO INITIAL-TYPE PROFILES
PROFILE * Type A (1st rank pm'ler): 7 production subunits
Type B (2nd rank power): 5 marketing subunits
Type C .(2nd/3rd rank power) 3 engineering and 2 marketing subunits
Type D (3rd rank power): 2 accounting subunits
Type E {3rd/Lfth and 4th rank pOHer): 5 accounting subunits
Total: i !
24 subunits (plus 4 engineering subunits unexplained)
* as in Figure 3

<moss
j + I ~ r'--- .,.t'
Uncortdnty ",.I:> v.!.
I~Pllts
./'.
noutin:i zCltion of Coping by Pr'v7.:: .. 11 'l i 021
Centrality of .Jor!::flo·..;s
I +
It v
GO~;'l'~101 OF of-
S l'ILl.T:8GI C . CJ~·{.c.IJ.~'(:Dl"CIES
--.~
I"
. I
BubGtit!ltability of l ... ctJ. vi tics
. /j"-'---"---
+ .. 1.
Houtiniz8.tion of Coping by LlforrJation .:>.11<.:: : .. bool'ption" , .
... ... !
Pm-Tor of subUiii t;
Height Dorl~~ill
Seopo
•
· •
, !lOtzlor . being (;:qu~:l'l YG.l'J.o.blc.:s, i..:.g.~OJ;';'':~l:1izc:('ionc'.,1 c:istal1co CoJ..l,J.bo:"'GtiY .. rCOiilpO-ci ti vo
tiO:1S~Ji ps Indi vic1i..'..:11 ci . .: .. :l.:co.c"C,vri :;,ti es
1)"':; l"S onnul _ ........ -.. -_ ..... _ .. _. -.. , .... ---.. ~-., ..... _- ... _--_ ........ '_ ...... ,-
j~::~~[G~ _0 __ .:r ..$, .. ,_~1;~;l ~~~,~~~~:iit·'~~~,~ fl~~,,:\~~)~,~~i .. ! .. C_=0:l;:t_ 'K:,~~~QrlI..l.~~llllb'1J~ J~~!J~2~1'c~ 011
( P .. ('t""\':l ,.~i'.; ·\~,'·OOl.., ..... _ \,:.... .1.;).,_ t,,; .. Ao;:':> __ v~ c.~l, .' ,.,,. .. ,. ! ';' I I • :22;;)
) :Jiroct relationship '\.":tt~l
.... ·r'; - •. ,. - - - - -j,' -.Wl.!'0ct :rolc. .. l.Onsn.l.p
.......... , vl th povwr
li.01::.t.iOl:ahip 'do -(;h ct:l.;r tJ.1<::..."1. by
of coating(:ncj.os

t') 1
.... \, . ~,
..
1
:> :
:,
.1 J I
i f
41 oj
~ I
i '. · · .'
, .
.. .;
?
.' h
;-; ..
.jj ~ ;..
,., r
'" ~ t-, :~
-. ;~ "'. -'" f
''; . · "
t
"
f r-:" · . !
:~ , 1
FIGURE"2.. TIlrrrAL-TYPE STRATSGJC PROFILES p,r!!) PO',':ER
K~y 0 marks score on ~~cstionr.aire data X marks ccore on no~-qu~stion~aire data
Ac En f!,k Pd
Accountin(j l:uhunit !::n1ineerinr) $'lbu;-:it !';~rketi!'1g s\l~unit
Producti-:.n subunit
i/C '" ranlc orders of suhunit scores ',,:i thin each organization
CR,<=r.N ,ZA" t';:;N CC;:''::
VAR,IAe>LES
(1.",1 t;tkl> (,t V<-l)
.N.T.",I..- 'TYPE 1 S'\"~''''lEc:.,C. 'I
p.<Orll..es ~<t L (bre.WU>1) l...K(1 '~ 6C (:.c'*'':;'f'>.cr:..~
<'1 ? .... r': C':;';>HJ(.. ,JI Tt-I VNC.CKT I A jMME"DIJ'lC.Y
NON'~~STtT!';7i\B'LI11JPt.:KVA'~1 YeN!:!!:S -
4 :.
Pd ...
:2.. I 4.
o~ Pd
:.. .;tl 4- ~ :.l. I
0f:~ Pc.!, f
Q)
. ,:,~6 . O~
! 1st RANI" POWeR '. ® ® ® J~------.------------~--------+--------r--------+-------~------~
I :2nd
i CCi"N(~ v/l,,, \JUc..lI<T
IMr..~E'OlI\C.V
N~~"SU 2.S" tVif,IloU1Y1
PI:.Rv"~I\JeNes;s
c..Ol',Nb W1TrI \iNu;RT,l
lM"1 E Di "c.y
B
/
_
1 I
o I c)
\
S~~··--~' . - . - ~
_ .. , - .".- --
M~XMK~ .. 0 X 0 X
XO 0 x. X 0 ..
~
0)(
Ac
Ac
~-XO
OX j
)<0-.. X " X· \:~ ~
CEn)(.
G )( x~.~
'It\R1P.BLCS: COPING ':iIT~i ';!iC:;RT Corin\! '.vith l:ncertainty n"IEDIACY =' i'/orj.:fl C\'/ (Sp(>ed) a'1d Perc'.'i v('d~'!<'rk: flo',-'
Ir.l'11~"j:i ;'.cy !~ON-SlJljS'!'ITUTABILT'PY '" tlon-Sub,tit'.lb:;)ility (0'.rcr~11 ~":>:'.i:1'=',r:.al)
anr. Pr-r"cf'i ".red Non-Sub~t5. t'2 tabU i ty PERVASTlfi':NESS '" ';!orf~n0':! Per .... asiv<'fle"':s (to'::i'll 1i;;1:5 ';;il::, 0rh.'r
subu!1 i.ts) an::! P('rcei VN! 'i/.:>r!( fI0';1 Per/ns! 'rG"-'~;"
PO','/ER (as perr.:ci·J~d by othprs)
Participation Power (lnvol'J!':!:cnt) and P~rcf;d,v0d PC':'<::-!:' (\':pir;ht)

Figure 3(n)
., di'l:i.siOl1 of t'~slw brinGS i),llocat:i.on of act:Lviti0s hav1.nl1 ;'dGh :i..,rl.ir.l0 (3.:L a, C 'jT
.-- ----_ ...... _\ j ___ r __ ~~. ___ • ___ ,--.._. _ •• _"~ J~ -~ t! .
" Ii: I ! tako opportunity i j cope u5_ tIl j , bOC01":10
-:.::.~;;:;; to O;:ltor <.U'u':.\ of' i :;-~ u;1cGrtail1t~r H pO'.TOrful ! h . , + . J ' ; ••• ----•• ---. • • t J.&,"1 unco~c ,,':~J.n GY : '-'-- ...... "
i
... ·~ .. h ... _~._ ..... ,~'" ~.~ __ ...... ..- ....... ~ ... ~.
··----r-· -----, 1 1"---- .~---.. -'-"--"'-- _.--,. i . '''.-'' - '-_. - ...... , ....... ---'.-_ ... ·· .. ·"-1
/
2.void .::mbsti ·~c.bili tj: !
(0. G· acquiro sp0c:tal I'-){l:' s1d.lls)
I I I .. __ .. _--- --..... --.-.---~--~ ... ------~.-,---_\ !
sin~ul tz:c:J.uouoly c:xtC!nd \)o:-clr linlcs :jOl-'~'!8.si"'.Toly (unL1-:;:.~·\;,,::;.lw .::.:-;ti
Otl101"*S
. I
s
I I., _, _A .... _~ __ ~ __ •• _ •• _,_~ ••• ,
Figure 3(b)
.,.,-.. , .. ,. "-'"'--''-''' ... , , c;')n.:Jl~tuni tV' I I
_*.L • v :::i "':.0 Ol1'l:,o~:, arC2- of '----/ I , 11le,11 l!rl.~,:;rtc.:Ll!~::Y •.
copa 1.fi th Ul1CDXt.:dl1ty
copinG (1~cro':i.s8S sub!:.ltit.utc..bility (c C' ~t r~ov'''·lo'.)'· \ t>r; • .l.. ~ .ow! l;J
sp-JcL.l skills)
i . ! copin.g activities' bOCO:rilC --->: bCC::E!lO ~ll; hly .-7; ''''o··r·>''fu' • ...., ;,;"J , .. \..;;....... .... ..
1 ir!ll.J0 di.J .. to
si, ~ul to.nQously oj~tvnc.l uorl;:
t t"-·--~~~-
.. _. __ ,_ ......... ___ .. _J .
FlqtJRE 3 TENTATIVE OUl1 .. INES OF THO HODELS OF POHER ATTAI11-l:E'NT

Footnotes
1. This research '!;las carried out at the Faculty of Business
Administration, University of Alberta, with the support of
Canada Council Grants No.67-0253 and No.69-0714; and concluded
at the Organizational Analysis Resear~h Unit, University of
Bradford, England, and the Industrial Administration Research
Unit, The University of Aston in Birmingham, England.

()
Clark, Terry No (edo) 1968 COffir:lunity St.J.:ucture and Decision-Baking: Comparative
k,-a"J.yses.. San Francisco: Chandler.,
Crozier, Michel 1964 The Bureaucratic Pheno:nen()no Londo;:).: Tav:i..stoc.~o
Cyert. Richard. 11" a'1d Ja'TIes Go March 1963 A BehaviOl,~al Theory of the Firm.. Engle\'lfood Cl:tffs, N"Jn:
Emerson, Ro 1962
P:r:e.."1.tice-HaJ.L
Ee lPower-depG~dence relations', &'nerican Sociological Revle\'If, 27: 31-41.,
Gilma r'cin t 1970
B .. Go and Jo So Brovm 'Society To.jay: LacJJ1ae Emp!1ases and Surseits', A;ner:i.cnn Sociology, 4~ 283-2910
HicksC'n, David J", ,Co Ro Hini.'1gs, Co /t" Lee, Ro Eo Sci'.t"1ed,,;: and J .. t-l .. Pennings 1971 'A, Strategic Contingencies Theory of L'1traorganiza'cional
}?O\ver'" l!dnri.niot,rative Sc:ience Quarterly, 16, 2: 216-229"
H5.C:~son, David J .. , Co Ro Hinjrlgs, Co Jo IJJd1illan and J., Po SC".hwitter 1973 (1) ~The CuI ture-f'ree context of orgat1ization structure: a
tri-r~ntional comparison., (To appear)
L:Lnden, A .. \',,, Clark, and Be La Irving IThe C01T!Dined Use of Lin.tcage and Path Analysis', HUinan Relations, 20 7 4: 375-386",
Einings, Co Ro, D" Jo Hickson, a'1d J" M .. Pennings 1973(1) :The Measurement of Power' (to appear:)
Kapli'L'1, Abraham 1964 'Power in perspective'.. In Robert L., Kahn, e.ad Elise Bou}.ding
Lm.,r.cence, J.967
(eds .. ) PO'd2r and Conflict i.., Ol.'g<mizai:io:ls: 1'1-22" Londen: Tc:V'istccko
P21J.l P.., ar..d 'vl o Lornch ! D:i,fferc::::::,,5,<::ltion ald I":l:.::egrat:i.on in GJmp:'ex Orgili'li~a-cio::-.i.s'"
l.lkri.~5.:::;'t.rZ',U.ve Seier-co Quarterly, 12: 1-47"
()
March} J3Ti19S Go al"\d }ie~~J0:;:-l: f" 4 Sim .... ..Jn 1958 OrgcmizaU.ons 0 NevI York! Hi.ley ..
MCQuitty, Lo L .. 1957 i KI.eJn0lltar'l Linkage Analysis for Isolating bot.h
1964
.. PcrrO\4 , IS70
OrtJ10g(mal 'J:-:,pcs a'1d 'I'ypal ReI e-,rand. E:S ~ "
Educatj_o~1al Pr.:YCt'1o'-{)g~.c.:al 11'eusuL't};c1'~"l'I:l' 20: 29~~···3(l4 ..
~Capabilitj.e8 2.:J.d Improvements in Linkage h"1nlysis as a cluster:i.nc..:; 1~:ethoc1l.. Educaticnal Psycllolog::Lr.:::al Neasuremcnt~ 211.= 441-456.,
Cha,.6.es f Departmental Pow~r a.'1d Perspectives i!1 L'1dustr5.al Firms t, in ~ald, }1e No 1 (ed,,) s FoV/or In Organizations: 59--890 Nashville: Vc,nderhilt University Press"
'l'annenbaum, A.rrold So 1968 Control in Organizations.. Ne\V York: McGraw-Hill ..
Tho::npscn, James Do 1967 Ol:ganizatio:1s in Action" NeVI York: McGra\;,-Hill.,