Tilburg University Structural conditions of intraorganizational power … · ·...
25
Tilburg University Structural conditions of intraorganizational power Pennings, J.M.; Hinings, C.R.; Hickson, D.J.; Schneck, R.E. Published in: Administrative Science Quarterly Publication date: 1974 Link to publication Citation for published version (APA): Pennings, J. M., Hinings, C. R., Hickson, D. J., & Schneck, R. E. (1974). Structural conditions of intraorganizational power. Administrative Science Quarterly, 19(1), 22-44. General rights Copyright and moral rights for the publications made accessible in the public portal are retained by the authors and/or other copyright owners and it is a condition of accessing publications that users recognise and abide by the legal requirements associated with these rights. - Users may download and print one copy of any publication from the public portal for the purpose of private study or research - You may not further distribute the material or use it for any profit-making activity or commercial gain - You may freely distribute the URL identifying the publication in the public portal Take down policy If you believe that this document breaches copyright, please contact us providing details, and we will remove access to the work immediately and investigate your claim. Download date: 07. Jul. 2018
Transcript of Tilburg University Structural conditions of intraorganizational power … · ·...

Tilburg University
Structural conditions of intraorganizational power
Pennings, J.M.; Hinings, C.R.; Hickson, D.J.; Schneck, R.E.
Published in:Administrative Science Quarterly
Publication date:1974
Link to publication
Citation for published version (APA):Pennings, J. M., Hinings, C. R., Hickson, D. J., & Schneck, R. E. (1974). Structural conditions ofintraorganizational power. Administrative Science Quarterly, 19(1), 22-44.
General rightsCopyright and moral rights for the publications made accessible in the public portal are retained by the authors and/or other copyright ownersand it is a condition of accessing publications that users recognise and abide by the legal requirements associated with these rights.
- Users may download and print one copy of any publication from the public portal for the purpose of private study or research - You may not further distribute the material or use it for any profit-making activity or commercial gain - You may freely distribute the URL identifying the publication in the public portal
Take down policyIf you believe that this document breaches copyright, please contact us providing details, and we will remove access to the work immediatelyand investigate your claim.
Download date: 07. Jul. 2018

http://www.jstor.org
Structural Conditions of Intraorganizational PowerAuthor(s): C. R. Hinings, D. J. Hickson, J. M. Pennings, R. E. SchneckSource: Administrative Science Quarterly, Vol. 19, No. 1, (Mar., 1974), pp. 22-44Published by: Johnson Graduate School of Management, Cornell UniversityStable URL: http://www.jstor.org/stable/2391786Accessed: 11/04/2008 06:50
Your use of the JSTOR archive indicates your acceptance of JSTOR's Terms and Conditions of Use, available at
http://www.jstor.org/page/info/about/policies/terms.jsp. JSTOR's Terms and Conditions of Use provides, in part, that unless
you have obtained prior permission, you may not download an entire issue of a journal or multiple copies of articles, and you
may use content in the JSTOR archive only for your personal, non-commercial use.
Please contact the publisher regarding any further use of this work. Publisher contact information may be obtained at
http://www.jstor.org/action/showPublisher?publisherCode=cjohn.
Each copy of any part of a JSTOR transmission must contain the same copyright notice that appears on the screen or printed
page of such transmission.
JSTOR is a not-for-profit organization founded in 1995 to build trusted digital archives for scholarship. We enable the
scholarly community to preserve their work and the materials they rely upon, and to build a common research platform that
promotes the discovery and use of these resources. For more information about JSTOR, please contact [email protected].
Structural Conditions of Intraorganizational Power
C. R. Hinings, D. J. Hickson, J. M. Pennings, and R. E. Schneck
1 This research was carried out at the Faculty of Business Administration, University of Alberta, with the support of Canada Council Grants No. 67-0253 and No. 69-0714, and concluded at the Organi- zational Analysis Research Unit, University of Bradford, England, and the Industrial Administration Research Unit, The University of Aston in Birmingham, England.
The strategic-contingencies theory of intraorganizational power proposed by Hickson et al. hypothesizes that the power of subunits results from contingent dependences among them created by unspecified combinations of coping with uncer- tainty, workflow centrality (immediacy and pervasiveness), and nonsubstitutability. This paper reports on methods devised to test this theory with alternative forms of data on seven organizations, or power systems, of four subunits each. The theory is refined by the exploration of different patterns of variables related to successive levels of power, and the tentative ordering of these variables in terms of their con- sequences for power.1
The 1 960s saw a fresh perspective in organization theory, which regarded organizations as decision-making power systems interacting with their environments in conditions of uncertainty. It is a perspective which can be traced from the examination of dysfunctions and cognitive rationality by March and Simon (1 958), through the study of organizational decision processes by Cyert and March (1 963), to the attempt by Thompson (1 967) to develop the theoretical implications of the perspective more thoroughly.
Crozier (1 964) was among the first to use the perspective in explaining the apparent power of sections of maintenance engineers by their control of uncertainty. However, the diffi- culties with this explanation led Hickson et a!. (1 971 ) to develop the perspective into a broader explanation of subunit power; the strategic-contingencies theory. The project reported here is an attempt to test this theory against data.
STRATEGIC-CONTINGENCIES THEORY
In the theory proposed by Hickson et al. (1 971), summarized in Figure 1 of their paper, they argued that the concept of coping is crucial to understanding any relationship between uncertainty and power, for it is not the uncertainty, but what is done about it that confers power. Together with centrality of workflows and substitutability of activities, coping with uncertainty gives rise to dependences of one subunit upon another, because the activities performed by one are con- tingencies for the activities of another. Some combinations of uncertainty, coping, centrality, and substitutability bring these contingencies to strategic intensities, which differentiate power. As Hickson et a!. (1 971 : 222) put it: "The independent variables are each necessary but not sufficient conditions for control of strategic contingencies, but together they determine the variation in interdependence between subunits."
Any relationship between power and coping with uncertainty must in some degree rest upon the importance of the coping to the outputs of the rest of the organization. Hickson et al. (1 971 ) provisionally divided centrality of workflow into two further concepts, immediacy and pervasiveness. For example, a research department may solve a technical uncertainty, yet the consequences for production of finished goods are very remote, this is an example of low immediacy, and the success- ful coping brings little power. Likewise, power rests in some way upon the pervasiveness of the links of a subunit to other subunits; for example, a finance department may reach everywhere, and so have power.
Hickson et al. (1 971 ) also stressed substitutability, pointing out that the maintenance engineers studied by Crozier (1 964)
22/ASQ

INTRAORGANIZATIONAL POWER
might not have been so powerful, had it been possible to contract maintenance work to external engineering firms; that is, to substitute another means of performance. They also cited the power of the engineers to expose the fallacy of assuming that a power distribution in accord with the strategic- contingencies theory is necessarily efficient, or rational, or functional for an organization; the power of the engineers to impede the introduction of routinized programmed mainte- nance was presumably none of these.
Routinization is introduced into the theory in two ways. It is thought indirectly to affect power either by reducing uncer- tainty or by increasing substitutability. Routinization is there- fore either (1 ) "coping by prevention, which avoids the occurrence of uncertainty" (Hickson et al. 1 971: 224); for example, long-term sales contracts that stabilize orders; or (2) "coping by information or absorption which defines how the uncertainty which does occur shall be coped with" (Hickson et a!. 1 971: 224): for example, routine task instruc- tions that allow replacement personnel to cope.
The strategic-contingencies theory focuses on structural sources of power and is not concerned with psychological attributes of members as explanations of power differences. The design of the present study follows Hickson et al. (1 971) not only in treating power as the dependent variable to be explained, but in applying the theory specifically to subunits of work organizations. Research on subunits avoids the obstacles to studies of power in communities, where the institutions which make up the geographical community do not necessarily constitute an interrelated power system. One needs to point out, of course, that power is given, as anteced- ent power relationships exist, and is also constantly created de novo as those relationships change. For the purposes of this project, the existence of subunits was necessarily accepted as given.
METHODOLOGY
Sample
The sample consisted of 28 subunits; four subunits, the only subunits in seven manufacturing organizations; that is 100 percent samples of small populations of four subunits (engi- neering, marketing, production, and accounting) in each of seven comparatively simple social systems. Each system was completely interactive; that is, each subunit interacted with all three others. The organizations selected were three branch breweries in western Canada, each with less than 100 employees; two breweries in the American midwest, one with 300 and the other 60 employees; and two semi-autonomous divisions of a container company in Canada, employing 300 people. In the container company one division manufactured folding cartons, the other corrugated cases, two distinctive products and markets. Each division had its own production and marketing subunits, but used the services of common engineering and accounting subunits.
The aim in the selection of organizations was to vary the uncertainty faced by the subunits and in particular the market- ing subunits. Public regulation and market conditions were used as prior indicators of uncertainty. Thus, the three branch breweries in western Canada operated in the same market, closely prescribed and controlled by
23/ASQ

public regulation, with a simple product and almost identical technology and size. The two American breweries operated in market conditions that were much less officially controlled; however, their market uncertainty was found to be only marginally greater than in western Canada since overall con- sumption was linked more to population trends than to governmental restraint. The two container divisions represented the greatest of environmental uncertainty, output being geared largely to jobbing orders in highly competitive markets.
Data Collection Methods
With hypothesis testing and case analysis as the objective, more than one data collection method and different measures were used for each variable, with the hope of broader empirical coverage. This multimethod and multimeasure data collection make the research exploratory. Initially, prolonged exploratory interviews with chief executives and department heads in the Canadian breweries were held to develop some understanding of these organizations. Semi- structured but open-ended interviews based on a standard schedule were then carried out in all organizations. The schedule covered information on every variable in the theory except routinization (Appendix A). A further set of data was collected by means of a questionnaire completed by the head of each subunit in each organization. The questionnaire obtained information on every variable, including routinization. All items were perceptions of facts, asking each respondent for his perceptions of uncertainty, immediacy, power, and so forth, not for his attitudes. Thus there are two sets of data from seven chief executives and 26 department heads; one set from interviews, giving comparatively impersonal and extensive information, and the other from questionnaires, giving perceptions. These two types of data were collected because, as Gilmartin and Brown (1 970) point out, too often perceptual data collection through questionnaires is used to denote conditions of social systems, when the relationship between such data and more objective data has not been shown. An advantage of studying small organizations was that department heads had a good enough knowledge of all subunits to provide the kind of impersonal data required.
For the questionnaire data, a mean score for each subunit in each organization was constructed from the responses of the four department heads. Each responded on his own and the other three departments in the organization, using five cate- gory response sets as summarized in Appendix A. The scores given to a department by its own head did not differ con- sistently from those given by other heads; except on power, where all heads rated their own departments slightly high>- than the others did. Since this bias was consistent, it did not affect total scores differentially. As has been pointed out, these data are not attitude data but perceptions of a supposed reality. It is important to look for consistency of responses as an indication of the validity of the responses for representations of systems with interactive subunits. What is wanted is agreement between respondents on discrimination between subunits, not discrimination be- tween respondents; with a high degree of consistency one can assume common perceptions. Checks were carried out on each set of four responses on the independent variables:
24/ASQ
INTRAORGANIZATIONAL POWER
(1 ) A visual check item by item, to see whether the four respondents perceived the scores and/or orderings of the subunits in the same direction. (2) A check to see whether there was substantial disagree- ment on any one subunit, assuming the ideal to be all four respondents giving the same score to any single subunit. (3) Scores were converted to rank orders and examined for differences in scoring levels characteristic of individual respondents. There was substantial agreement between respondents both within and between organizations, on the ordering of the subunits in their organizations on each variable, and on the levels of scores attributed to each. Therefore summed ques- tionnaire responses were taken as expressing a common perception of each subunit.
Finally, the utility of the data yielded by the questions was examined: (1 ) Responses from each respondent were examined for nondiscrimination, that is, scoring all four subunits the same. Of the 1 61 response sets, .1 8 did not discriminate and were distributed throughout the seven organizations. Eliminating them would not have affected the mean scores so they remained in the analysis. (2) Responses to each question were compared, and the question on coping with uncertainty was rejected, because respondents had simply inverted their answers to the preceding question on uncertainty, high uncertainty always equalling low coping and vice versa. These checks were carried out because each respondent was dealing with all subunits in his organization. Such checks were not necessary for the interview data, as each interviewee was dealing only with his own department.
Operationalization
With the bulk of the data from interview and records, multiple representations of each variable were achieved, so that there was at least one interview measure and one questionnaire measure for each variable. An attempt was made to deal with a number of aspects of each variable, to examine the inter- relationships between the different measures, and, where appropriate, to select the best measure(s).
In a project working with new variables, exploratory opera- tionalization by multiple sets of data and multiple representa- tions of variables, derived from close acquaintance with particular organizations, gives confidence in the empirical base of the study. However, the method has limitations. Normal scaling procedures were ruled out because: (1 ) the number of subunits available was inadequate for such tech- niques; and (2) though several tentative ordinal scales were proposed and used, on some indicators there was not standardization of items between subunits. The use of terms such as "measure" or 'score" is therefore for a convention for simplicity. At some points, product-moment correlations were used as an economical summary. These correlations were for data on 20 brewery subunits only, and did not include the subunits of the container organizations. Brewery subunits were in very similar organizations and for correlation could be regarded, provisionally, as being drawn from a population of subunits in such organizations. The introduction of container subunits would introduce an unknown additional effect without
25/ASQ
justifying any pretense of a broad representation of work organizations. The theoretical sources of these measures are described in Hickson et a!. (1 971 ). With the exception of routinization and definitive feedback, they are original, because of the lack of previous operationalization of these concepts. The data on each variable are described at some length since they are not familiar.
VARIABLES Substitutability Substitutability is the ability of the organization to obtain alternative performance for the activities of a subunit. A standard set of items was used to measure this, dealing with how easy or difficult it was to obtain personnel, both in previous experience and in hypothetical terms. A distinction could also be made between the substitutability of managers, covering the head of department and his immediate super- visory deputies; and staff, meaning the technical, administra- tive, and manual personnel in the department. Interview data were collected on five items for actual sub- stitutability: level of formal education required for the job, length of experience and training required, difficulties of hiring in the current labor market, existence of legal restric- tions, number of tasks contracted out. The first four items were used for managerial substitutability, and all five for staff. Three further items dealt with hypothetical substituta- bility, on the assumption that the degree to which subunits might be substituted for, even if this had never occurred, might affect power: (1 ) internal substitutability, whether particular tasks could be done by other members of the same depart- ment; (2) departmental substitutability, whether other subunits could do any of the tasks; and (3) external substitutability, whether tasks could be done from outside the organization. A Guttman scale was constructed for overall staff substituta- bility, consisting of all the items, and for overall managerial substitutability, consisting of all the items except tasks con- tracted out. The questionnaire item is shown in Appendix A.
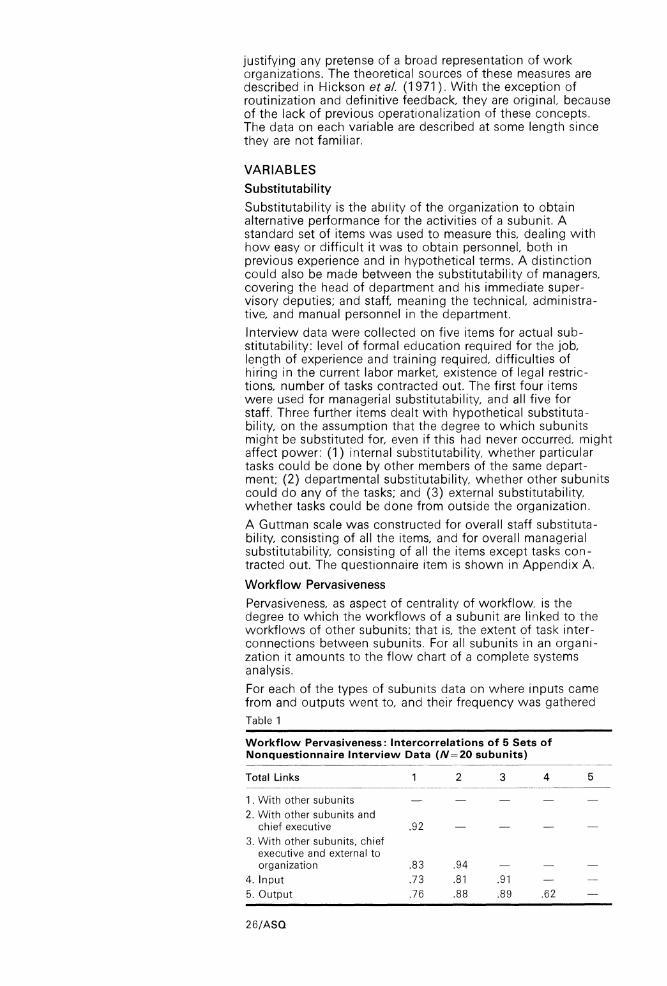
Workflow Pervasiveness Pervasiveness, as aspect of centrality of workflow, is the degree to which the workflows of a subunit are linked to the workflows of other subunits; that is, the extent of task inter- connections between subunits. For all subunits in an organi- zation it amounts to the flow chart of a complete systems analysis. For each of the types of subunits data on where inputs came from and outputs went to, and their frequency was gathered Table 1
Workflow Pervasiveness: Intercorrelations of 5 Sets of Nonquestionnaire Interview Data (N=20 subunits)
Total Links 1 2 3 4 5
1. With other subunits -
2. With other subunits and chief executive .92
3. With other subunits, chief executive and external to organization .83 .94 -
4. Input .73 .81 .91 -
5. Output .76 .88 .89 .62
2 6/ASQ
INTRAORGANIZATIONAL POWER
by interview. These data gave a matrix of interconnections of each subunit with every other subunit, parent companies, suppliers, customers, government agencies, and so on. From these data numerous counts and ratios were possible, and 1 7 kinds of measures were examined, which are best represented by the five included in Table 1. The correlations in Table 1 show that pervasive subunits are pervasive in all ways; that is, inwardly, outwardly, internally, externally, and so forth, and that one measure can be used to represent all. Total links with other subunits in the organization were selected as closest to the intersubu nit power system. Two measures were derived from the questionnaire item (see Appendix A), pervasiveness of the subunit as seen by its own head, and as seen by the heads of other subunits. The correla- tion between the two was low, so pervasiveness as seen by other heads was selected for the full analysis, since it best represented the concept with the most data. It was sub- sequently found to have a stronger relationship to power.
Workflow Immediacy
Immediacy, a further aspect of centrality of workflow, is the speed and severity with which the workflow of a subunit affects the final outputs of the organization. This was opera- tionalized as the effect of activities of a subunit on the organi- zation's output of finished goods. The definition solves the problem of separating the activities of a production depart- ment from the output of an organization, a distinction which has to be made if production departments are to be analyzed along with the other subunits. It can then be asked how long the shipping of finished goods (such as bottles and casks of beer) could continue if particular tasks in the various subunits were not done. Each department has outputs which have greater or lesser effect on this output. Accounting sends cash returns to the head office, engineering has to repair machinery, marketing prepares sales forecasts, and production (in a brewery) brews beer. Every output dealt with in pervasiveness was examined and classified in terms of immediacy, as having an immediate effect (within a few weeks), a long-run effect (within a few months) or no effect. This scale of immediacy (speed) produced a total score for the outputs of each subunit. A second measure of immediacy (severity) was also attempted from the interview data. As an example of the difference between severity and speed, lack of a cash forecast may not affect finished goods for many months, but eventual lack of cash could stop everything. A machine breakdown might be immediate in terms of speed, but could be adjusted within an hour and have a very limited effect. Each subunit output was rated on severity, but doubt persisted over the adequacy of the data, particularly since they did not include direct financial comparisons of consequences. As speed correlated much higher with power than severity, the severity measure was not carried into the final data analysis, important though the notion might be. The questionnaire item is shown in Appendix A.
Uncertainty
Uncertainty is a lack of information about future events, so that alternatives and their outcomes are unpredictable. Here the data concerned present uncertainty about future varia- bility, derived from known past variability. It is assumed that the greater the variability previously experienced, the greater the inherent uncertainty for any department. Such an opera- tionalization separates the environmental and task situation
27/ASQ

of each department from the personal anxieties of its members; but it cannot include any anticipation of some totally un- precedented event, though no such anticipations were found in the organizations studied.
From the interviews, a list of 1 0 inputs to the organizations was compiled, being only those inputs that varied and as such had degrees of unpredictability of occurrence in the organiza- tions studied: 1. Demand: market share 6. Equipment and parts: supply 2. Demand: volume 7. Equipment: operation 3. Demand: order mix 8. Utilities: supply 4. Demand: design requirements 9. Capital and/or cash supply 5. Materials: quality 1 0. Customer credit-worthiness
These inputs were then examined for patterning, defined as the degree of constancy or variability in three elements, trend, range, and regularity. The basic element is trend, for so long as some direction can be discerned, then a pattern exists and in principle could be projected into the future. Add some constancy of range around the trend line and there is more pattern present; if in addition the variations within the range are regular, there is complete patterning, and prediction is possible. Thus variation does not necessarily mean uncertainty, if the variation is patterned and predictable.
A 6-category scale of unpatterned variability was devised: (1 ) No variation (2) Patterned variation: regularity of occurrence within constant range and trend (3) Infrequent variation from regularity or range, trend constant (4) Frequent variations from regularity or range, trend constant; that is, incipient change of pattern around trend (5) Variation in trend: irrespective of regularity and range, basic trend changes (6) Unpatterned variation: no trend
This scale is a first attempt at dealing with this concept, leaving definition imprecise and several problems unresolved. The categorization does not explicitly include time, either in recency of variation or duration; nor the relative size of varia- tions. But the scale does provide useful discrimination, with inputs in the organizations studied falling into categories 1 to 5. There is some bunching around "infrequent variation from regularity or range, trend constant" which is to be expected because of the government control of breweries' markets, and because of batch production, with its high degree of technological stability.
The unpatterned variability scores of the inputs in each subunit were summed to give a subunit score derived both from the number of relevant inputs entering the scale and from their scores on it. The range is from an accounting department facing no uncertainty, to a marketing department facing frequent variations in various aspects of demand, such as market share, volume and order mix.
Following Lawrence and Lorsch (1 967) a further indicator of uncertainty was "definitive feedback," on the assumption that the less feedback to a subunit on its results, the more likely it was to be working in a vague, unknown, unpredictable task area. A measure of feedback assurance was derived from three binary items: causal knowledge, the degree to which the results were known to have been produced by the de- partment's activities; specificity, the degree to which a depart- ment's own activities were the sole determinant of feedback data; speed, the length of time elapsing before a subunit
28/ASQ
INTRAORGANIZATIONAL POWER
received feedback on its activities. Production and engineering departments had causal knowledge, the feedback they got on what they did was least contaminated by the effects of what other departments did, and their feedback was fast. Marketing departments had least feedback in these respects. It was found that feedback correlated with unpatterned varia- bility and with power measures, so, like the severity aspect of workflow immediacy, it was not carried into the final analysis. The questionnaire item is shown in Appendix A.
Coping
Coping is defined as effectively dealing with uncertainties. Each subunit must deal with uncertainties, and in so doing provides some certainty for other subunits. For each variable input information was collected (as previously used for measuring uncertainty), or how the relevant subunit(s) coped; so that from interviews, a list of items of coping was produced for each subunit. The engineering department in one brewery coped with uncertainties in equipment operation by fore- casting parts and replacements needs, by routine maintenance, and by having a maintenance crew for breakdowns. A marketing department coped with market-share uncertainties by an explicit marketing policy, regular market-share fore- casting, and selective advertising directed at a specific market segment.
The coping activities were divided into three categories: (1 ) Coping by prevention: activities which reduced the probabilities of variations occurring in the inputs of the organization; for example, advertising aimed at offsetting a possible fall in sales. (2) Coping by information: activities which provided fore- warning of probable variations in the inputs of the organiza- tion; for example, calculating probabilities of machine breakdown. (3) Coping by absorption: activities which offset the effects of those variations in the inputs of the organization; for example, reworking or recombining raw materials so that a substandard batch could be used and production not be held up.
The number of coping mechanisms were added for each subunit. "Coping by absorption" was given a double weight. Of the three kinds of coping, it alone comes after a variation has unequivocally occurred and is causing trouble or is about to cause trouble. At that state it is imperative to do something, as when Crozier's (1 964) maintenance engineers came in to repair broken-down machines. The consequences of coping by prevention or by information are more speculative and less obvious to the subunits who might thereby be protected.
But the number of coping mechanisms takes no account of the amount of uncertainty faced by each department. The strategic-contingencies theory states that the relationship between coping and uncertainty is important for power. Strategic contingencies arise in part from uncertainty, and control of them arises from coping. A measure of coping with uncertainty is therefore necessary.
For this, unpatterned variability was divided into quartiles of low, lower middle, upper middle and high. A similar procedure was followed for number of coping mechanisms, and the two sets of categories were combined. The categories ranged from high patterned variability with high coping to low patterned variability with low coping. The resulting categories were
29/ASO
then ordered, adopting the principle that any moderate coping with high uncertainty was of more consequence to the organization than fuller coping with less uncertainty. To the 1 6 possible categories another was added to deal with a department having high patterned variability but no coping. There were subunits in 1 0 categories, scored 1 to 1 0.
Routi nization
Routinization, the process of rationalization and procedurali- zation, is linked to the theory according to whether it is preventive or coping. As it was beyond the resources of the project to collect interview data on the detailed mechanisms of routinization, it is the only variable represented by ques- tionnaire data alone. The three questions asked are shown in Appendix A; they do not distinguish between preventive and coping routinization.
Responses to questions 2 and 3 were combined into a single perceived procedures score, justified by their .90 correlation. Question 1 correlated .73 with both 2 and 3, but also .70 with the question on perceived uncertainty; however since wording on "circumstances change" might refer as much to uncertainty as to routinization, it was abandoned as not being clearly either.
Power
Power was defined by Hickson et a!. (1 971 ) as the deter- mination of the behavior of one social unit by another. Following Kaplan (1 964) it is seen as having three dimensions: weight, or amount; scope, or ranges over behaviors; and domain, number of persons or collectivities whose behavior is determined. In this research domain is constant, since for any one subunit it is the three other subunits in the organization. Due to controversy over the measurement of power (Clark, 1 968), the multimethod, multimeasure strategy is especially appropriate for this variable. From the interviews, data were collected on position power, that is, formal, legitimate authority; and participation power, that is, involvement in four postulated stages of decision; initiating, providing information, choosing the course of action, and implementing action. From the questionnaires data were collected on perceived power, that is, influence attributed to the subunit. Since power in internally fragmented organizations is complex and respondents generalizing across unstated areas are not likely to provide valid data, power data were gathered with the use of a list of 1 7 issues. These issues form as compre- hensive a statement as possible of all those recognized and recurrent problem areas in the organizations studied, in which more than one department was usually involved. The list was compiled from exploratory interviews in breweries and checked with all chief executives in all four areas of finance, sales, engineering and production. The aim was to produce a set of issues which would allow statements to be made about power over the most central and frequent problems. The 1 7 issues are listed in Table 2. For the container organizations, product design was used instead of product packaging; interpretation of liquor regulations was omitted; and personnel recruitment and cost control were added. Issues were allocated to functional areas, as shown in Table 2, which is an example of the perceived power (weight) scores of the four subunits in one brewery. The Table shows both scores on each decision issue and the overall means which are the scores used in the full data analysis with the
30/ASO

INTRAORGANIZATIONAL POWER
other variables. The italics emphasize how the production subunit has power right across the board; whereas marketing, while powerful in its own area, has a lesser place outside that. It is this kind of relationships that the issues list was designated to reveal.
Table 2
Perceived Power (Weight) of 4 Subunits in Organization S (Brewery)"
Task Area or Function Subunits Accounting Engineering Marketing Production
Sales Marketing strategies 1.5 1.25 5.0 3.25 Introduction of new products 1.5 1.75 5.0 3.75 Product packaging 1.5 3.25 3.5 4.0 Price 4.5 1.0 3.0 2.0 Interpretation of liquor regulations 2.75 1.5 4 5 2.5
Engineering Obtaining equipment 2.75 4.25 1.75 4.5 Operating performance of equipment 1.75 5.0 2.0 4.5
Production Obtaining raw materials 2.0 2.25 2.0 5.0 Product quality 1.0 2.75 2.75 5.0 Production efficiency 2.25 4.75 2.0 5.0 Overall production plan 2.75 2.5 2.25 4.0
Finance Overall capital budget 4.0 3.5 2.75 3.5 Overall non-capital budget 3.75 2.75 2.75 2.75 Reviews of the non-capital budget 3.5 2.5 2.5 2.5
Personnel (salary training) Salary revision 3.25 1.75 2.25 2.25 Personnel training and development 3.5 2.75 3.0 3.25 Personnel and labor relations 3.25 1.5 2.25 3.0
Overall Means 2.7 2.7 2.9 3.6
On each of 1 7 issues means of the questionnaire ratings (Appendix A) of every subunit by heads of all 4 subunits; scores at or above the mean in italics.
From the data on position power, two measures were extracted, scope and status. Scope was the number of issues from among the 1 7, over which a subunit had formal authority as defined by the chief executive. Status is the hierarchical position of the department heads, scoring from vice president down to subordinate to one of the other department heads.
For participation power, each department head was asked about the role of his department and the other departments in each of the four postulated stages of decision on each issue. From the accounts of the four heads, a composite story was derived by cross-checking. In these small systems of four subunits each, the accounts tallied overwhelmingly. Ques- tionnaire data on perceived power were collected using the format developed by Tannenbaum (1 968), as shown in Appendix A.
31/ASO

In all, nine main measures were developed, as defined in Table 3. The third, sixth and seventh of these on "net devia- tion" require additional explanation. The theory suggests that by control of contingencies a subunit may gain power over those issues which are formally not its concern, but come within the responsibility of another subunit. The three measures deal with this by counting how often a subunit participates in decisions which are the primary responsibility of another subunit, offset by any participation of others in its own formal decision area. Table 3
Intercorrelations of 9 Measures" of Power (N=20 subunits)
1 2 3 4 5 6 7 8
Perceived powert 1. Weight 2. Scope .93 3. Net Scope Deviation .81 .93
Participation power4 4. Involvement .92 .84 .67 5. Scope .86 .76 .59 .96 - - - -
6. Net Involvement Deviation .73 .62 .48 .87 .94 - - -
7. Net Scope Deviation .47 .38 .33 .60 .59 .68 - -
Position power4 8. Scope .80 .71 .44 .86 .87 .34 .73 -
9. Status .55 .50 .33 .66 .67 .38 .50 .68
"The measures used were: 1. Mean rating across 5 points by heads of 4 subunits, including self-
rating, on each of 1 7 issues. 2. No. of issues on which subunit rated at or above mean score for all
subunits in organization. 3. No. of issues outside own task area, as in Table 2, on which subunit
rated at or above mean, less issues in own area rated below mean. 4. No. of decision stages in which subunit participated in each of 1 7
issues, weighting as 2 any references to the "choosing action" stage. 5. No. of issues in which subunit participated, irrespective of stage of
participation.
6. No. of decision stages outside own task area (see Table 2) in which subunit participated, less stages in own area in which it did not participate: weighting as 2 any references to the "choosing action" stage.
7. No. of issues, calculated as in no. 6 above. 8. No. of issues for which subunit has formally allocated responsibility. 9. Height of level of hierarchy to which subunit is attached. tQuestionnaire data
4Nonquestionnaire data.
ANALYSIS
An objective of the methodology was to represent every concept by more than one measure, the measures to cover two classes of data, questionnaire and nonquestionnaire data. This was achieved for all concepts except coping and rou- tinization. Table 4 shows the scores obtained on those measures selected from many operationalizations for the exploratory analysis of relationships between variables. The
32/ASO

INTRAORGANIZATIONAL POWER
results of correlations for the other principal independent variables can be summarized as follows for the 20 subunits:
Unpatterned variability with perceived uncertainty .49 Workflow immediacy (speed) with perceived workflow immediacy .64 Non-substitutability (overall managerial) with perceived non -substitutability .52 Workflow pervasiveness (links with other subunits) with workflow pervasiveness (perceived by others) .38
Here and with subsequent correlations, levels of confidence are not given, since the sample was so small.
Table 4
Scores on Selected Measures (N=20 subunits)
Mean Range S.D.
1. Unpatterned variability 5.8 0-12 3.0 Perceived uncertainty 3.0 2.0-4.3 .8
2. Coping with uncertainty 5.5 1 -10 3.1 3. Workflow immediacy (speed) 10.9 3-19 4.1
Perceived workflow immediacy 2.8 1.5-4.3 1.1 4. Nonsubstitutability (overall managerial) 3.0 0-6 2.1
Perceived nonsubstitutability 2.6 1.5-3.5 .6 5. Workflow pervasiveness (links with
other subunits) 22.8 1 2-33 7.8 Perceived workflow pervasiveness (perceived by others) 3.2 2.0-4.3 .8
6. Perceived procedures (nonroui;nization) 1.9 1.3-3.0 .5 7. Perceived power (weight) 2.9 2.1 -3.9 .5
Participation power (involvement) 30.2 3-56 1 2.6 Position power (scope) 4.3 3-6 1.3
*Nonquestionnaire and "perceived" data of questionnaire measures.
Equivalence of Questionnaire and Nonquestionnaire Measures
The question is what equivalence there may be between questionnaire and nonquestionnaire measures. There are the known differences not only in data collection method but in form of operationalization. Unpatterned variability, the past variation in organization inputs in the subunit task area, differs markedly from the question on "'uncertainties" with which it was compared; nonsubstitutability of managerial members differs from responses to a general question on how easy it would be "to replace (a) closed department." The other pairs of dual measures match more exactly. Workflow immediacy, scored on speed of subunit effect on organization output of finished goods, and workflow pervasiveness scored on activity links between subunits each match the corresponding questions on the questionnaire.
Whatever the prior presumptions of equivalence, the correla- tions obtained were moderate. This implies that in research designs neither of these forms of data alone should be taken as fully indicating a variable, as they so often are, particularly for questionnaire responses. This is not a proposal for multiple forms of data in all research, but for acknowledgement that any one form of data used is not likely to be the only type of data available or meaningful. In the present project, the intercorrelations indicate that there is not sufficient equivalence to justify either set of measures; yet there is sufficient equiva- lence to infer that fundamental organizational variables common to both measures are indicated, and to sustain the
33/ASO

assumption of their mutual validation, which gives a much stronger overall base than would be provided by either form of data alone. Of course, it is also possible that one or both sets of data contain considerable random error, which would produce an unknown distortion of their relationship.
Higher correlations were obtained between most of the nine measures of power (Table 3). A more detailed analysis of alternative measurements of power is to appear, but even a superficial glance at Table 3 shows the agreement between the measures used. Questionnaire and nonquestionnaire measures are highly correlated, perceived power (weight) correlating .92 with participation power (involvement) and .80 with position power (scope).
Participation in stages of the decision process is frequently tantamount to exercising power, at least as power is seen by those involved. The breweries are shown to be stable power systems, in which actual power, as seen by subunit heads, is close to authority (positional power) as defined by the chief executive (Table 3). The following analyses focus on three power measures: perceived power (weight), participation power (involvement), and position power (scope), which, though highly inter- correlated, indicate three different aspects of power.
Correlational Analysis
A previous paper (Hickson et a!. 1 971 ) defined the research task as elucidating which combinations of values of the independent variables might lead to power. The data available allow preliminary interpretations. It is possible to analyze the
Table 5
Correlations of Selected Measures of Independent Variables with Power (N=20 subunits)
Perceived power Participation power Position power Involvement
Net (decision Net Net Scope stage Involvement Scope
Weight Scope Deviation weighted) Scope Deviation Deviation Scope Status
1. Unpatterned variability 70 56 33 70 70 64 27 78 34 Perceived uncertainty 15 -02 -18 18 13 18 15 30 03
2. Coping with uncertainty 81 69 54 74 73 64 44 67 44
3. Workflow immediacy (speed) 73 75 68 65 54 52 40 44 13 Perceived workflow immediacy 55 47 46 38 34 32 33 25 08
4. Nonsubstitutability (overall managerial) 60 56 61 40 31 24 18 1 7 11 Perceived nonsubstitutability 28 29 37 13 06 -08 -18 03 00
5. Workflow pervasiveness (links with other subunits) 27 32 39 31 26 28 52 -01 19 Perceived workflow pervasiveness (perceived by others) 53 62 54 45 36 26 08 42 31
6. Perceived procedures (nonroutinization) 02 -20 -26 04 05 09 02 17 12
"Correlations with questionnaire data in italics
34/ASQ

INTRAORGANIZATIONAL POWER
data both across organizations and within organizations. The results are examined first in the form of correlations across organizations (in 20 brewery subunits).
Table 5 shows the correlations between the main independent variables and nine measures of power. It is immediately obvious that with a few exceptions, each independent variable relates to any or all the power measures to much the same extent. Little is to be gained therefore by fine distinctions among the full range of power measures, for the three measures suggested will suffice. In particular, in these small and stable organizations, the idea that power in the nominal spheres of others is crucial, is not borne out by the correlations with net scope deviations.
An equally obvious consistency in the correlations is that nonquestionnaire data correlate more highly with all data on power than questionnaire (perceived) data. The difference is not great enough to suggest that the questionnaire data may be ignored, but the nonquestionnaire data tend to give the most favorable test of the theory.
The exception is workflow pervasiveness, where the perceived measure correlates highest with power. Any interpretation is speculative with the crude measures used here, but this difference with pervasiveness suggests that perceptions recorded on questionnaires might reflect informal organization in the form of interpersonal interaction, which could be im- portant to subunit power but would not be covered by the nonquestionnaire counts of workflow links.
Only two variables do not relate positively to power. Perceived procedures (nonroutinization) showed inconsistent and negligible coefficients. The use of merely two questionnaire items to represent so complex a concept as rountine seems to have failed, as also for the single item scored for perceived uncertainty, which also gives very small correlations. There is the added difficulty that the uncertainty might be picking up an unknown proportion of the personal uncertainties of respondents, their anxieties and insecurities.
Unpatterned variability, coping with uncertainty, immediacy, nonsubstitutability, and pervasiveness all relate positively to power, as predicted. Coping correlates most highly with power, a result predicted by the theory of organization survival in uncertainty. Since the score on coping with uncertainty includes unpatterned variability, this latter measure is dropped.
Thus the correlations accord with an interpretation that coping is most important in power, supported by immediacy, non- substitutability, and pervasiveness, in that order.
This interpretation is reinforced by the partial correlations in Table 6, using those measures most highly correlated with power. The relationship of coping to power (r=.81 ) is affected more by holding immediacy constant (p=.65) than by holding nonsubstitutability constant (p=.74). The relationship of immediacy with power falls when it is isolated from coping, but in turn appears to exceed the relationship between non- substitutability and power. That coping is most important is underlined by its correlation with power, when both the other variables are held constant. Though too much should not be read into correlations on a small sample, trial multiple regres- sions suggest the same interpretations, with coping having the major effect upon coefficients with power. Taking these analyses overall, immediacy and nonsubstitutability would
35/ASO

Table 6
Partial Correlations of Independent Variables (Nonquestionnaire Data) with Perceived Power (Weight)
Variable Correlated Zero Correlation First Second with Power Order Holding Constant Order" Ordert
Coping with Workflow immediacy .65 uncertainty .81 (speed) .66
Nonsubstitutability .74 (overall managerial)
Workflow immediacy (speed) .73 Coping with uncertainty .46 A .28
Nonsubstitutability .55 2
(overall managerial)
Nonsubstitutability .60 Coping with uncertainty .44 . 24 Workflow immediacy .22 1 (speed)
"One variable held constant.
tBoth variables held constant.
appear to play secondary and possibly interdependent parts, with pervasiveness a weak third.
Further corroboration appears from the groupings of variables by successive magnitudes of correlation in hierarchical-linkage analysis. According to Hilgendorf et a!. (1 967) this technique, as developed by McQuitty (1 964), is useful for offering hints about the comparative strengths of interrelationships, and about likely causal patterns, and is an improvement upon elementary-linkage analysis (McQuitty 1 957). Again, coping stands out in such an analysis, with immediacy and nonsub- stitutability c f managerial staff appearing to act together in its support.
The data were also subjected to regression analysis, which produced the same results as the linkage analysis and pointed to the possible interactive relationships between the main variables. Again such analysis with these data can only be regarded as suggestive.
Noncorrelational Analysis
Analyses so far have relied on correlation of the scores of 20 subunits irrespective of their organizations. Since the brewery organizations and their subunits were so alike in product and in function, these correlations can be suggestive; but such analyses can be challenged. Power exists among interrelated units, that is, within power systems. Since the four subunits from each organization were 1 00 percent samples of the subunits in that power system and did not necessarily have a power relationship with subunits in other systems, the most valid measure of the power of a subunit should be its relative power ranking solely within its own system of four subunits. This further analysis within each organization therefore was carried out independently by a member of the research team who was not familiar with the correlation results.
An advantage of this analysis was that the available data could be enlarged by the inclusion of the two divisions of the container organization, since these could be examined separately from the breweries and not merged with them as correlation would have required. This also tested the theory in a second and different industrial situation. The two divisions
36/ASO

INTRAORGANIZATIONAL POWER
of the container organization were treated as two systems of four subunits each. Though the accounting and engineering subunits were common to both (that is, an actual total of six subunits), separate data were obtained from and on these subunits for each division where appropriate.
An analysis of seven small organizational power systems of four subunits each can be done almost as a case study. Comparison of profiles of scores helps visually in understand- ing the relationships, since profiles will fill out the probabilities of correlational analyses. They show whether apparently coincidental variables do in fact come together in specific cases, and give greater confidence in causal suppositions from their occurence in specific combinations with power.
Five recurrent strategic profiles appeared. Their simplified outlines are given in the first row of Figure 1, where they are called initial types to indicate that they are intended for continual alteration by further empirical research. These types appear in Figure 1 alongside three sets of examples which illustrate most of the variations found.
1st rank 2nd rank 2nd/3rd rank 3rd rank 3rd/4th rank 4th rank power power power power power power a b c d e a b c d e a b c d e a b c d e a b c d e a b c d e
INITIAL 1 0 as 4th rank TYPE 2 0 STRATEGIC 3 0 0 0 PROFILES 4 0 0
Al B C DD E
BC .
21 X- l~x~LIXx~o
I x- T,6e T XI 1 2 0 3 V. 4 0 X~ 0
l ~~Pd M k AccE
LK 1 \X~.X~o x 2 Q X X X | x 3 \A M XX X 4 0 xx/
Pd M k EAc En L 1 Xq~oM x 0 x 2 0 X- XO 3 XX00 0 4 OX X XX M
Pd Mk En Ac
0 score on questionnaire data a = coping with uncertainty X score on nonquestionnaire data b workflow immediacy (speed) and perceived workflow immediacy 1 -4 rank orders of subunit scores c = nonsubstitutability (overall managerial) and perceived within each organization nonsubstitutability
d = pervasiveness=workflow pervasiveness (total links with other sub- units) and perceived workflow pervasiveness (as perceived by others)
Ac = accounting subunit e = power=participation power (involvement) and perceived power En = engineering subunit (weight) Mk = marketing subunit BC = Container company Pd = production subunit LK, L = Breweries
Figure 1 Initial type strategic profiles and specific profiles in relation to power
37/ASQ

Both questionnaire and nonquestionnaire data are plotted, and profiles pass through midpoints between scores if these differ. The points plotted are the orderings of each subunit in first, second, third or fourth place within its organization on each measure; a standardization which makes comparison possible. The procedure was to rank the subunits within each organization on power (two measures used here), and then to see whether any uniformity of patterns appeare at each power level among the strategic contingencies variables. The numbers of subunits with profiles of each type are as follows:
Profile A (1st rank power): 7 production subunits Profile B (2nd rank power): 5 marketing subunits Profile C (2nd/3rd rank power): 3 engineering and 2 marketing subunits Profile D (3rd rank power): 2 accounting subunits Profile E (3rd/4th and 4th rank power): 5 accounting subunits
First-rank power (both power scores in first place) is found only with strategic profile A; that is, top scores on all strategic contingencies variables. Coping with uncertainty alone does not give first-rank power, but high-ranked coping does occur in profile B with second-rank power (see especially the profiles of the first and third of the three marketing subunits in Figure 1). The importance of coping to high power is apparent when it is realized that all sub-units in the first and second power ranks have first- or second-rank coping, but none of the others do. Strategic profile C shows high non- substitutability, with moderate immediacy and coping; and this profile occurs with power scores in the second and third ranks. Speculatively, it suggests a subunit where with just a little more coping and immediacy it might approach top rank power. Profile D is a weak pattern with third-rank power, with lower coping than more powerful subunits, and little or no compensation from other variables. Finally, profile E typifies subunits in the fourth rank of power, or those with 1 power score in the third and fourth ranks. The feature of this least powerful profile is high pervasiveness, as high as the pervasiveness of the most powerful subunits, which suggests that pervasiveness of itself is of little consequence for power. Moreover, by itself it appears to relate negatively to power.
Figure 1 also shows an engineering subunit which had only fourth-rank power despite its highly ranked immediacy and nonsubstitutability. This seems to be a special case. Though organizations were selected to minimize the risk of individual effects, in this case the head of the production subunit acted beyond this subunit as a general manager. Through his dominant personal position, he limited the range of activities of the engineering subunit in the planning, obtaining, and maintaining of equipment, thereby limiting its coping score and its power.
From the 28 subunits in the list of profiles, this leaves three other low-power engineering subunits similar to the just described case but unexplained (the engineering subunit of organization BC in Figure 1 is one of these, being omitted from the figure for simplification). Despite their high im- mediacy and nonsubstitutability, they were among the least powerful. One possible explanation is that the lack of power is due to especially inadequate data on coping. Their scores on the questionnaire item on perceived uncertainty were exceptionally high, as if they did face more uncertainty than their scores on coping with uncertainty scores indicated, yet coped with uncertainty less than is indicated. If so, this would be a weak position.
38/ASQ

INTRAORGANIZATIONAL POWER
The strategic contingencies theory explains 24 of 28 subunit power rankings. The profiles suggest that high scores on all variables are essential to top power; coping is most important for high ranking power, with immediacy frequently contributing to second-rank power. Nonsubstitutability appears in the top power combination, but thereafter contributes mainly to second/third rank in power, and pervasiveness, while a necessary condition for first rank power, is an impediment when it is the only high score.
The profiles indicate the powerfulness of production subunits and the powerlessness of accounting subunits. In container organizations, marketing might have been anticipated to rival production; since production subunits could do little until the marketing subunits had obtained and sent the orders; since the marketing subunits influenced design order by order; and since without orders the main production workflows would cease. The influence of marketing was reflected in higher workflow immediacy scores than for the brewery marketing subunits (see Figure 1 marketing subunits with second-rank power); for in the breweries, production was not to order and the marketing departments were less immediately relevant. In line with the contrasting economic environment for which the container divisions were selected, marketing had higher scores on coping with uncertainty than in the breweries. Yet as the marketing subunit in theacontainer organization in Figure 1 (organization BC) clearly shows, marketing was still too substitutable and not sufficiently pervasive to match the power of production. Marketing staff lacked technical training required for brewers; they lacked the all-pervasive involve- ments with the engineering and accounting subunits, charac- teristic of production, whose equipment had to be maintained and whose every activity had to be recorded and costed.
Unfortunately, there are no obvious clues from the data, which when quantified are in nonequal interval form, as to how close to production the marketing subunits came in power. Were they closer in container organizations than in breweries? It is clear only that five came into second place.
The weakness of accounting departments follows from what they did. They kept records of everything, and sent reports to and collected information from everyone (Figure 1, high pervasiveness of accounting subunits with third- to fourth- rank power), but took no action on this themselves and hence influenced no one.
It must be emphasized that there can be no generalizing from the profiles that production subunits are the most powerful in all manufacturing organizations. For example, Perrow (1 969) found that marketing subunits dominated the American organizations that he studied. The project reported here was designed for refining theory rather than for descriptive general- izations. Only far more extensive samples can tell how much power different kinds of subunits have, as well as whether the patterns continue to accord with the theory now developed.
SUMMARY AND CONCLUSIONS
The results of this exploratory empirical study accord with the plausibility of the strategic-contingencies explanation of power within organizations. The design for this project aimed at offsetting sample limitations with comparatively intensive data. Confidence is restrained by the coverage of only two kinds of organization, both industrial. However, the sample covered seven complete (smallI) power systems; variables had
39/ASQ
multiple representation in forms of data and in measures; and the data were consistent in successive correlational analyses across organizations and in profiles organization by organi- zation.
Refinement of the theory comes from the examination of combinations of variables and of the apparent relative con- tribution of each. Strongest support for the theory is from the evidence that only a combination of high values on all the variables postulated gave dominant first-rank power. With this combination, the activities of a subunit become con- tingencies for other subunits, upon which they are critically dependent. Unless it copes, they suffer the uncertainty; what it does has immediate consequences for the ultimate common outputs; the other subunits cannot look elsewhere for alter- natives; and much or most of what they do is linked to what it does.
Neither high-scored coping alone (that is, combined with low values of other variables), nor immediacy with non- substitutability, gives such power. Immediacy of activities has its greatest influence upon power when the activities reduce the impact of uncertainty from others; and nonsub- stitutability is of little consequence if the nonsubstitutable activities absorb little uncertainty and are not immediate. Pervasive task links are a necessary condition for the powerful combination of the other variables, but without high scores on other variables are at best irrelevant, at worst a hindrance to power. In importance with respect to power, the variables are probably weighted or ordered with coping first, then im- mediacy, then nonsubstitutability, and last pervasiveness.
Up to a point, this is in line with Crozier's (1 964) stress on uncertainty. Coping with uncertainty is the variable most critical to power, and is the best single predictor of it; but it is far from being the only factor contributing to power. The maintenance engineering sections studied by Crozier (1 964) presumably obtained power with a strategic profile A (high on all variables) or, more likely, Crozier was inferring not first-rank power but unexpectedly high second-rank power with a high-coping profile B (Figure 1).
Clarification of the part played by the variables in the theory shows the need for direct operationalization of the contin- gencies concept, defined by Hickson et a/. (1 971 : 222) as ''a requirement of the activities of one subunit which is affected by the activities of another subunit." The project reported here did not attempt this, and so has no measures directly describing the risks and consequences of the per- formance of each subunit for the others. How do work activities vary in their effects on other activities? The project relies on inferences from the values of variables which appear to make such contingencies strategic for power by creating dependences (Emerson 1 962).
To switch the perspective, future research might develop from the strategic-contingencies theory, which is an hypoth- esized theory of why power is differentiated in an organi- zational power system, to models of how the power system works. In other words, it should be possible to use this explanation of power to trace the processes by which power is won. For dominant power, take advantage of immediacy, reduce your substitutability, and then make a bid for a decisive area of uncertainty; or alternatively, first go for the vital high coping with uncertainty, though this carries a risk of being
40/ ASO

INTRAORGANIZATIONAL POWER
left frustrated in second place unable to increase immediacy and decrease substitutability sufficiently to become first-rank, but don't get involved in a network of interaction links before you can dominate it.
Speculative though this language may be, it suggests two models of routes to power as in Figure 2(a) and (b). Of course, there will be more. These two are no more than guesswork inspired by a descriptive knowledge of the subunits studied.
division of take opportunity cope with become tasks brings to enter area of uncertainty powerful allocation of high uncertainty activities having high immediacy
avoid substitutability simultaneously (e.g. acquire special extend work links skills) pervasively
(undertake activities on which others may depend)
Figure 2(a)
take opportunity cope with coping activities become to enter area of uncertainty become highly powerful high uncertainty immediate
simultaneously coping decreases extend work substitutability links pervasively (e.g. it develops special skills)
Figure 2(b)
Figure 2. Tentative outlines of two models of power attainment
Model (a) assumes a fortuitous allocation to a subunit of activities having immediacy. Whether this happens is outside the control of the subunit, for example, it is decided by prior action of a group head-quarters on product technology and on organization structure. After this, the subunit itself can determine more of the process. It seeks and copes with un- certainty, and attempts to ensure its nonsubstitutability and to extend its pervasiveness. Such may have been the case with the marketing subunit in the container organization described earlier (Figure 1, organization BC). Semijobbing production put it in a highly immediate task position by its responsibility for orders. It then faced a comparatively un-
41 /ASQ

patterned and variable market in corrugated packaging. However, its opportunity to tackle even greater uncertainties was confined to modifying box designs, and its substituta- bility and pervasiveness would not have been easily altered in a more powerful direction. Hence its strong rank power, but no more than that.
There were three engineering subunits with second to third rank power and with strategic profiles type C. One of them is shown in Figure 1, the engineering subunit of organization L. It has high immediacy as power model (a) requires, but appeared to have no chance of taking the next step into a high uncertainty area. In a completely mechanized, partially automated, brewing plant routine maintenance was virtually all that was needed, with no openings for innovative modi- fications nor crises to deal with. The subunit therefore could not use the model (a) route to increase its power further.
In model (b), the subunit's own initiative in entering an area of greater uncertainty is the starting point. Alternatively, it may fortuitously find itself faced with such a situation. This was probably the case for the marketing subunits in each of three competing-breweries. The trend of overall beer con- sumption was extremely stable, so that any market uncertainty would arise from shifts of brand allegiance within the total. When the third of the breweries entered this market, its marketing subunit (also referred to earlier) adopted an explicitly thought-out range of coping activities, including deliberate utilization of market research information, aiming for one sector of the market rather than others, and advertising care- fully designed for that aim. Hence the subunit's high coping in Figure 1, organization L. But in terms of model (b), the subunit appeared unable to raise its immediacy (this is where the model requires fortuitous circumstances to support the subunit's power) to decrease its substitutability or to extend its pervasiveness enough to rival production's power. Though its forecasts were followed by production, this was not with the order by order immediacy of a jobbing organization: sales staff were comparatively easy to find and so to substitute: and its contacts with the engineering and accounting subunits were minimal. The theory indicates that different subunits will travel different routes to power at different times, as the circumstances in and around organizations change. Indeed, resistance to change or advocacy of change may derive from intuitive understanding of its impact upon power. Changing fields of operation (markets), changing technologies, changing outputs, will all affect power. In this continual shifting of power, uncertainty plays a role which places the strategic-contingencies theory firmly in what Thompson (1 967) called the new tradition of analyzing organizations as systems in indeterminacy.
C. R. Hinings is Senior Research Fellow in the Institute of Local Government Studies at the University of Birmingham, England. D. J. Hickson is Ralph Yablon Professor of Be- havioural Studies in the Management Centre at the University of Bradford, England. J. M. Pennings is assistant professor at Carnegie-Mellon University, Pittsburgh. R. E. Schneck is professor of organizational behaviour in the Faculty of Business Administration at the University of Alberta, Canada.
REFERENCES
Clark, Terry N. (ed.) 1 968 Community Structure and
Decision-Making: Com-
parative Analyses. San Francisco: Chandler.
Crozier, Michel 1 964 The Bureaucratic
Phenomenon. London: Tavistock.
Cyert, Richard M., and James G. March
42/ASQ

INTRAORGANIZATIONAL POWER
1 963 A Behavioral Theory of the Firm. Englewood Cliffs, N.J.: Prentice-Hall.
Emerson, R. E. 1 962 "Power-dependence
relations," American Sociological Review, 27: 31-41.
Gilmartin, B. G., and J. S. Brown 1 970 "Society today: lacunae
emphases and surseits," American Sociology, 4: 283-291.
Hickson, David J., C. R. Hinings, C. A. Lee, R. E. Schneck, and J. M. Pennings 1 971 "A strategic contingencies
theory of intraorganizational power," Administrative Science Quarterly, 1 6, 2: 21 6-229.
Hilgendorf, Linden, A. W. Clark, and B. L. Irving
1 967 "The combined use of linkage and path analysis," Human Relations, 20, 4: 375-386.
Kaplan, Abraham 1 964 "Power in perspective," in
Robert L. Kahn and Elise Boulding (eds.) Power and Conflict in Organizations: 11-32. London: Tavistock.
Lawrence, Paul R., and Jay W. Lorsch 1 967 "Differentiation and
integration in complex organizations," Adminis- trative Science Quarterly, 12: 1-47.
March, James G., and Herbert A. Simon 1 958 Organizations. New York:
Wiley.
McQuitty, L. L. 1 957 "Elementary linkage analysis
for isolating both orthogenal types and typal relevancies," Educational Psychological Measurement, 20: 293-304.
1 964 "Capabilities and improve- ments in linkage analysis as a clustering method," Educational Psychological Measurement, 24: 441-456.
Perrow, Charles 1 970 "Departmental power and
perspectives in industrial firms," in Zald, M.N. (Ed.), Power in Organizations: 59-89. Nashville Vanderbilt University Press.
Tannenbaum, Arnold S. 1 968 Control in Organizations.
New York: McGraw-Hill.
Thompson, James D. 1 967 Organizations in Action.
New York: McGraw-Hill.
APPENDIX A
Examples of Structured Interview Topics and Questionnaire Items Interview topics. (for guidance only; interviewers were not required to follow standard wordings) Unpatterned variability of organization: Inputs. (see text for listing) Does this input ever vary from normal previous experience? How do you try to deal with this variation? Is it possible to adopt any routines for dealing with this? How, and how quickly, is it possible to evaluate success in (subunit) activities? Workflow pervasiveness and immediacy of subunit inputs and outputs. Where does each come from/go to (that is, to which department or organization)? How often does it occur? How quickly would the shipping of finished goods be affected if this were not done?
Substitutability. How easy or difficult is it to obtain people for this job? What training/experience/formal education, if any, is required? In principle, how easy or difficult would it be to hire agents, consultants, etc., to do the work in this job category? Participation power. Stages of decision process: 1. Who raises the issue or initiates discussion? 2. Who is involved in providing information or services? 3. Who chooses the final course of action taken? 4. Who implements physical action or keeps track of paperwork?
Who carries out the action? Position power. Which department has primary formal authority for this
(problem)?
Questionnaire items. (each item followed by the title of four departments in standard alphabetical order; that is, accounting, engineering, marketing, production) Perceived uncertainty. How many uncertainties does each of the following departments, including your own, have to cope with in the course of its work? 5 points: Very many uncertainties ... to . . . Almost no uncertainties
Perceived workflow immediacy. How quickly would the closing of each of the departments affect the shipping of finished goods from the plant? 5 points: Instantly . . . In a few hours/days/weeks ... Not for a long time
43/ASQ
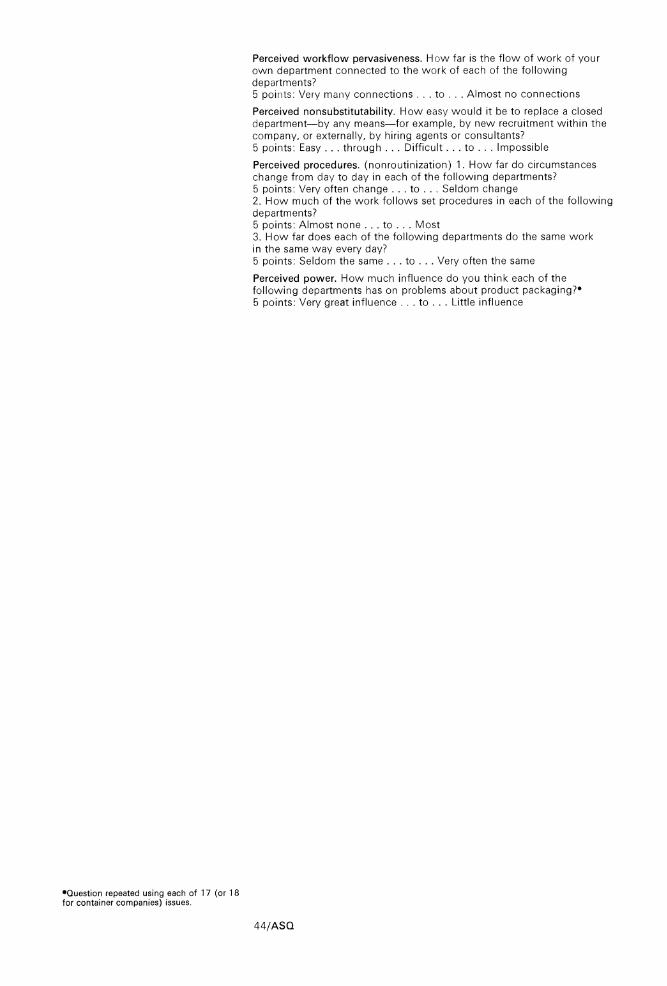
Perceived workflow pervasiveness. How far is the flow of work of your own department connected to the work of each of the following departments? 5 points: Very many connections ... to ... Almost no connections
Perceived nonsubstitutability. How easy would it be to replace a closed department-by any means-for example, by new recruitment within the company, or externally, by hiring agents or consultants? 5 points: Easy ... through ... Difficult ... to ... Impossible
Perceived procedures. (nonroutinization) 1. How far do circumstances change from day to day in each of the following departments? 5 points: Very often change ... to ... Seldom change 2. How much of the work follows set procedures in each of the following departments? 5 points: Almost none ... to ... Most 3. How far does each of the following departments do the same work in the same way every day? 5 points: Seldom the same ... to ... Very often the same
Perceived power. How much influence do you think each of the following departments has on problems about product packaging? 5 points: Very great influence . . . to . . . Little influence
*Question repeated using each of 1 7 (or 1 8 for container companies) issues.
44/ASQ