Studying a strontium MOT – group meeting 01-12-08 Studying a strontium MOT James Millen.

STRONTIUM DOPED CALCIUM PHOSPHATE BIOMIMETIC COATINGS ON
Ti6Al4V PLATES
A THESIS SUBMITTED TO
THE GRADUATE SCHOOL OF NATURAL AND APPLIED SCIENCES
OF
MIDDLE EAST TECHNICAL UNIVERSITY
BY
MUHAMMED AVCI
IN PARTIAL FULLFILLMENT OF THE REQUIREMENTS
FOR
THE DEGREE OF MASTER OF SCIENCE
IN
BIOMEDICAL ENGINEERING
DECEMBER, 2015

Approval of the thesis:
STRONTIUM DOPED CALCIUM PHOSPHATE BIOMIMETIC COATINGS
ON Ti6Al4V PLATES
submitted by MUHAMMED AVCI in partial fulfillment of the requirements for the
degree of Master of Science in Biomedical Engineering Department, Middle East
Technical University by,
Prof. Dr. Gülbin Dural Ünver ________________
Dean, Graduate School of Natural and Applied Sciences
Prof. Dr. Hakan Işık Tarman ________________
Head of Department, Biomedical Engineering
Prof. Dr. Zafer Evis ________________
Supervisor, Engineering Sciences Dept., METU
Prof. Dr. Hasan Göçmez ________________
Co-Supervisor, Materials Science and Engineering Dept., Dumlupınar University
Examining Committee Members:
Prof. Dr. Zafer Evis ________________
Engineering Sciences Dept., METU
Assoc. Prof. Dr. Ayşen Tezcaner ________________
Engineering Sciences Dept., METU
Assoc. Prof. Dr. Dilek Keskin ________________
Engineering Sciences Dept., METU
Assoc. Prof. Dr. Oğuzhan Yılmaz ________________
Mechanical Engineering Dept., Gazi University
Assist. Prof. Dr. İhsan Toktaş ________________
Mechanical Engineering Dept., Yıldırım Beyazıt University
Date: _______________

iv
I hereby declare that all information in this document has been obtained and
presented in accordance with academic rules and ethical conduct. I also declare
that, as required by these rules and conduct, I have fully cited and referenced all
material and results that are not original to this work.
Name, Last Name : Muhammed Avcı
Signature :

v
ABSTRACT
STRONTIUM DOPED CALCIUM PHOSPHATE BIOMIMETIC COATINGS ON
Ti6Al4V PLATES
Avcı, Muhammed
M.Sc., Department of Biomedical Engineering
Supervisor: Prof. Dr. Zafer Evis
Co-Supervisor: Prof. Dr. Hasan Göçmez
December 2015, 103 pages
In this study, strontium was added into the structure of calcium phosphate and coated
on Ti6Al4V plates with using biomimetic method. In order to form strontium doped
calcium phosphate coatings, 2×SBF with strontium was made with adding SrCl2 while
preparing normal 2×SBF. Ti6Al4V plates were used as substrates and their surfaces
were abraded and oxidized with pretreatment. These plates were coated in pure (no Sr
added), 0.15mM, 1mM and 5mM Sr added 2×SBF. Surface of the coated plates was
characterized and analyzed starting at 3rd day of immersion till 18th day by using EDS,
SEM, XRD, ICP-MS, FTIR and Raman spectroscopy. Human osteosarcoma cells were
used for in vitro analyses. In order to analyze durability of coatings, an aging procedure
was applied. According to the SEM results, nucleation already started on third day of
coating and by increased immersion time, precipitation increased on nucleation sites.
Surface analyses of samples soaked in 5mM Sr added 2×SBF at 6th day of immersion

vi
showed that no significant coating was formed on substrate plates and therefore,
immersion of 5mM Sr added samples was terminated. EDS and ICP-MS analyses
showed that Sr has successfully incorporated into the calcium phosphate structure for
both 1mM and 0.15mM Sr added samples. In addition, EDS analyses showed that,
with immersion time increased, Ca/P ratio of coatings increased for all types of
samples. XRD, Raman and FTIR analyses showed that crystallinity of calcium
phosphate coatings was increased with immersing time and hydroxyapatite structure
started to form. Crystallinity was seen in the highest for pure samples and higher for
0.15mM than 1mM Sr added samples. In case of in vitro analyses, both aged and non-
aged coated samples had similar SEM results. Although cell proliferation was
observed slightly higher for pure and 0.15mM Sr added samples than 1mM Sr added
samples, it was observed for all types of samples. MTT cell viability test results
showed that, pure, 0.15mM Sr added and 1mM Sr added samples had similar cell
viability and no significant toxicity was found for these samples.
Keywords: Strontium, SBF, Biomimetic Coating, Hydroxyapatite, Osteosarcoma

vii
ÖZ
Ti6Al4V PLAKALARI ÜZERİNE STRONSİYUM EKLENMİŞ KALSİYUM
FOSFATLARIN BİYOMİMETİK KAPLANMASI
Avcı, Muhammed
Yüksek Lisans, Biyomedikal Mühendisliği Bölümü
Tez Yöneticisi: Prof. Dr. Zafer Evis
Yardımcı Tez Yöneticisi: Prof. Dr. Hasan Göçmez
Aralık 2015, 103 sayfa
Bu çalışmada, biyomimetik metod kullanılarak Ti6Al4V plakaları yapısına stronsiyum
eklenmiş kalsiyum fosfat ile kaplanmıştır. Stronsiyum eklenmiş kalsiyum fosfat
kaplamaları oluşturmak için, normal 2×SBF hazırlanırken SrCl2 eklenerek stronsiyum
eklenmiş 2×SBF hazırlanmıştır. Substrat olarak kullanılan Ti6Al4V plakalarının
yüzeyleri ön işlem ile zımparalanmış ve oksitlenmiştir. Bu plakalar saf (Sr
eklenmemiş), 0.15mM, 1mM ve 5mM Sr eklenmiş 2×SBF içerisinde kaplanmıştır.
Kaplanmış plakaların yüzeyleri, kaplamanın 3’üncü gününden 18’inci gününe kadar
EDS, SEM, XRD, ICP-MS, FTIR ve Raman spektroskopisi ile incelenmiş ve analiz
edilmiştir. İnsan osteosarkoma hücreleri in vitro analizleri için kullanılmıştır.
Kaplamaların dayanıklılığını ölçmek için bir yaşlandırma prosedürü uygulanmıştır.
SEM sonuçları kaplamanın üçüncü gününde çoktan çekirdekleşmenin başladığını ve
kaplama süresinin artmasıyla çekirdek bölgelerinde çökelmenin arttığını göstermiştir.
5mM Sr eklenmiş 2×SBF’ye daldırılan örneklerin yüzey analizleri, 6. günde substrat
plakaları üzerinde dikkat çekici bir kaplamanın oluşmadığı göstermiş ve bu yüzden

viii
5mM Sr eklenmiş örneklerin kaplanması sonlandırılmıştır. EDS ve ICP-MS analizleri
1mM ve 0.15mM Sr eklenmiş örneklerde stronsiyumun, kalsiyum fosfat yapısına
başarılı bir şekilde girdiğini göstermiştir. Ayrıca, EDS analizleri tüm örnekler için
daldırma süresinin artması ile kaplamalardaki Ca/P oranının arttığını göstermiştir.
XRD, Raman ve FTIR analizleri daldırma süresinin artması ile kaplamaların kristal
yapısının arttığını ve hidroksiapatitin oluşmaya başladığını göstermiştir. Kristallik en
çok saf örneklerde görülmüş olup, 0.15mM Sr eklenmiş örneklerde 1mM Sr eklenmiş
örneklere göre daha fazla görülmüştür. İn vitro analizlerinde, yaşlandırılmış ve
yaşlandırılmamış örneklerde benzer SEM sonuçları görülmüştür. Hücre
proliferasyonu saf ve 0.15 mM Sr eklenmiş örneklerde 1mM Sr eklenmiş örneklere
göre biraz daha fazla görülmesine rağmen, tüm örnek tiplerinde görülmüştür. MTT
hücre canlılık testi saf, 0.15mM Sr eklenmiş ve 1mM Sr eklenmiş örneklerde benzer
hücre canlılığının olduğunu göstermiş ve bu örnekler için ciddi bir toksisite
bulunmamıştır.
Anahtar Kelimeler: Stronsiyum, SBF, Biyomimetik Kaplama, Hidroksiapatit,
Osteosarkoma

ix
To My Family,
Tülay, Ahmet, Zeynep and Münevver…

x
ACKNOWLEDGMENTS
Foremost I would like to express my deepest gratitude to my supervisor Prof. Dr. Zafer
Evis, who has endless positive energy, for his immense knowledge, valuable guidance
and encouragements throughout the research.
I would like to forward my appreciation to all my friends and colleagues who
contributed to my thesis with their continuous encouragement.
I would like to thank Dr. Bengi Yılmaz especially for her unforgettable and valuable
help in my studies.
I give my gratitude to my helpful friends, Emre Taş, Emir Sayar and Gevher Sayar.
I would also like to express my profound appreciation to my family, my mother (Tülay
Avcı), my father (Ahmet Avcı), my sister (Zeynep Dündar) and my grandmother
(Münevver Ekinci) for making me who I am now with their never-ending love,
continuous support and understanding throughout my life.
xi
TABLE OF CONTENTS
ABSTRACT ................................................................................................................ v
ÖZ .............................................................................................................................. vii
ACKNOWLEDGMENTS ......................................................................................... x
TABLE OF CONTENTS ......................................................................................... xi
LIST OF TABLES .................................................................................................. xiv
LIST OF FIGURES ................................................................................................ xvi
LIST OF ABBREVATIONS ................................................................................... xx
CHAPTERS
1 INTRODUCTION .............................................................................................. 1
1.1 Metal Based Biomaterials ............................................................................ 1
1.2 Bone Structure and Bone Repairing by Biomaterials ................................. 4
1.3 Bioceramics .................................................................................................. 6
1.4 Calcium Phosphates ..................................................................................... 8
1.5 Calcium Phosphates Coatings ................................................................... 12
1.6 Surface Modification of Metallic Implants .............................................. ..15
1.6.1 Machined Blasted Surface Modification ……………….…....16
1.6.2 Blasting and Etching (Physiochemical) Modifications………17
1.6.3 Electro – Polished (Oxidized) Modification ……….…….….17
1.6.4 Titanium Plasma Spray (TPS) Surface Modification …..……18
1.6.5 Sol-Gel Surface Modification ……………...………………..18
1.6.6 HA-Cap Coating Surface Modifications ……………...……..19
xii
1.7 Biomimetic Coating Method and Simulated Body Fluid ........................... 19
1.7.1 Development of Simulated Body Fluids ……………………..……...20
1.7.1.1 Conventional SBF by Kokubo et al. ………………...……….21
1.7.1.2 Corrected SBF by Kokubo et al. ……………………...……...21
1.7.1.3 SBF by Tas A. C. …………………………………...………..21
1.7.1.4 Revised SBF by Oyane et al. ……………………..………….22
1.7.1.5 Modified SBF by Oyane et al. ……………..…….….……….22
1.7.1.6 Ionized SBF by Oyane et al. …………………..…………….22
1.7.1.7 Newly improved SBF by Takadama et al. ………..…………23
1.7.1.8 SBF by Bigi et al. …………………………………………….23
1.7.1.9 Lac-SBF by Pasinli et al. …………………………………….23
1.7.2 Mechanisms and kinetics of ion release from substituted apatite
coatings ……………………………………………………………...26
1.8 Strontium and Its Importance for Bone Integration ................................... 28
1.9 Aim of the Study ........................................................................................ 31
2 MATERIALS AND METHODS ..................................................................... 33
2.1 Experimental Materials ............................................................................... 33
2.1.1 Equipments ....................................................................................... 33
2.1.1.1 Pretreatment Part ………………………………...…………..34
2.1.1.2 Simulated Body Fluid Part ……………………..……………34
2.1.2 Chemicals ......................................................................................... 34
2.1.2.1 Simulated Body Fluid Part …………………………………..34
2.1.2.2 Pretreatment Part ……………………..…………………...…35
2.2 Procedure of Experiment ............................................................................ 36
2.2.1 Sanding and Cleaning Treatment of Ti6Al4V Substrates ............... 37
2.2.2 Alkali (NaOH) and Heat Treatment ................................................ 37

xiii
2.2.3 Pure, 0.15mM, 1Mm and 5mM Sr Added 2.0 × SBF Preparation 38
2.2.4 Biomimetic CaP Coating in Pure and Sr Added 2.0 × SBF. ........... 41
2.2.5 Sterilization of Coated Implants ...................................................... 41
2.3 Surface Analysis with SEM ....................................................................... 42
2.4 Structure Analysis with Spectroscopy Methods ........................................ .42
2.5 Cell Culture Tests for in Vitro Analysis ……..……………..…………….43
2.5.1 SEM Analyzing for Osteosarcoma Seeded Coated Plates ............ 45
2.5.1.1 Aging of Coated Plates ……………………………………………46
2.5.2 MTT Cellular Toxicity Analysis . .................................................. 46
2.5.2.1 MTT Cytotoxicity Test for Strontium Solutions…...………...47
2.5.2.2 MTT Cytotoxicity Test for Coated Plates……………………49
3 RESULTS AND DISCUSSION ....................................................................... 51
3.1 SEM Results ............................................................................................... 54
3.2 EDS Results ............................................................................................... 60
3.3 ICP-MS Results .......................................................................................... 64
3.4 XRD Results ............................................................................................. 66
3.5 FTIR Results ............................................................................................ 72
3.6 Raman Spectroscopy Results ..................................................................... 76
3.7 Cell Culture Tests Results .......................................................................... 82
3.7.1 SEM Results for Cell Morphology ………………………..…….….82
3.7.2 MTT Cell Viability Test Results …………………………..……….86
3.7.2.1 Cell Viability Results of Strontium Solutions ……………….87
3.7.2.2 Cell Viability Results of Coating Plates …….……………….89
4 CONCLUSIONS ............................................................................................... 93
REFERENCES ................................................................................................. 95

xiv
LIST OF TABLES
TABLES
Table 1 : Implants division and type of metals used ................................................ 4
Table 2 : Schematic dimension information of structural hierarchy ......................... 6
Table 3 : Existing calcium orthophosphates and their major properties .................. 9
Table 4 : Various techniques to deposit bioresorbable coatings of calcium
orthophosphates on metal implants ........................................................................... 13
Table 5 : Some surface modification methods and basic classification of these
methods ...................................................................................................................... 16
Table 6 : Some different SBF solutions in literature and comparing blood plasma
ion concentration …………………………..……………………………..…………24
Table 7 : Materials which were used in SBF preparation part ................................35
Table 8 : Order, amounts, weighing containers, purities and formula weights of
reagents for preparing 1000 ml of normal SBF .......................................................... 39
Table 9 : Ionic concentration of blood plasma and Strontium added 2 x SBF ....... 40
Table 10: Sr-Growth solution concentrations in different concentrations …...........47
Table 11: Ca, P, Sr element weigh concentrations from ICP-MS analysis ………..64
Table 12: XRD peaks of the samples soaked in pure 2.0×SBF at 2θ degrees .........67
Table 13: XRD peaks of the samples soaked in 0.15mM Sr added 2.0×SBF at 2θ
degrees …...……………...……………………………………………..…...............69
Table 14: XRD peaks of the samples soaked in 1mM Sr added 2.0×SBF at 2θ
degrees ………………..………………………………..…………………………...70

xv
Table 15: FTIR peaks of the samples soaked in pure 2.0×SBF solution ……….....74
Table 16: FTIR peaks of the samples soaked in 0.15mM Sr added 2.0×SBF solution
……………………………………………………………………………...….….....75
Table 17: FTIR peaks of the samples soaked in 1mM Sr added 2.0×SBF solution
……………………………………………………………………………………….76
xvi
LIST OF FIGURES
FIGURES
Figure 1 : Illustration of structures corresponding to hierarchical levels of bone …5
Figure 2 : Solubility isotherms of CaP phases in the Ca(OH)2-H3PO4-H2O system
at 37ºC and 1 atm ………………………………………….......................................10
Figure 3 : Schematic illustration of the apatite formation on the surface of alkali-
heat treated Ti based alloy immersed in SBF ………………………………………27
Figure 4 : Flow chart of experimental procedure ………………………………...36
Figure 5 : Light microscope image of osteosarcoma cells in T-75 flask …………44
Figure 6 : Configuration of Sr solutions in 96 well-plate ………………………...48
Figure 7 : Configurations of sample plates in 6 well-plate for MTT assay ............49
Figure 8 : MTT assay configuration of sample plates in 96 well-plate .....…….…50
Figure 9 : An uncoated substrate plate. Only sanding treatment was applied …....52
Figure 10: Plates at 3rd day of immersion: (a) Coated plate in 5mM Sr added, (b)
Coated plate in 1mM Sr added, (c) Coated plates in 0.15mM Sr added, (d) Coated
plate in pure solution …..............................................................................................52
Figure 11: Plates at 6th day of immersion: (a) Coated plate in 5mM Sr added
solution, (b) Coated plate in 1mM Sr added solution, (c) Coated plate in 0.15mM Sr
added solution, (d) Coated plate in pure solution …………………………………..52
Figure 12: Plates coated in pure solution: (a) Plate at 9th day of immersion, (b) Plate
at 14th day of immersion; (c) Plate at 18th day of immersion .....................................53
Figure 13: Plates coated 0.15mM Sr added solution: (a) Plate at 9th day of
immersion, (b) Plate at 14th day of immersion; (c) Plate at 18th day of immersion…53
xvii
Figure 14: Plates coated 1mM Sr added solution: (a) Plate at 9th day of
immersion, (b) Plate at 14th day of immersion; (c) Plate at 18th day of immersion…54
Figure 15: SEM images of Ti6Al4V plate surfaces sanded and alkali-heat treated:
Magnification (a) 500x and (b) 100.000x ………......................................................54
Figure 16: SEM images of coatings: (a) pure, (b) 0.15 mM Sr added and (c) 1mM
Sr added coatings (50.000x) ………………………………………………………..55
Figure 17: SEM images of Ti6Al4V plates soaked in pure 2.0×SBF solution: (a)
For 3 days (5000x), (a) For 3 days and (b) For 6 days, (c) For 9 days, (d) For 14
days, (e) For 18 days (500x) ………………………………………………....…….56
Figure 18: SEM images of Ti6Al4V plates soaked in 0.15mM Sr added 2.0×SBF
solution: (a) For 3 days and (b) For 6 days, (c) For 9 days, (d) For 14 days, (e) For 18
days (500x) …………………………………………………………………….…....57
Figure 19: SEM images of Ti6Al4V plates soaked in 1mM Sr added 2.0×SBF
solution: (a) For 3 days and (b) For 6 days, (c) For 9 days, (d) For 14 days, (e) For 18
days (500x) ………………………………………………………………………….58
Figure 20: SEM images of Ti6Al4V plates soaked in 5mM Sr added 2.0×SBF
solution: (a) For 3 days and (b) For 6 days (500x) ………………………………....59
Figure 21: EDS results of Ti6Al4V plates soaked in pure 2.0×SBF solution: (a) For
3 days, (b) For 6 days, (c) For 9 days, (d) For 14 days, (e) For 18 days ………..…60
Figure 22: EDS results of Ti6Al4V plates soaked in 0.15mM 2.0×SBF: (a) For 3
days, (b) For 6 days, (c) For 9 days, (d) For 14 days, (e) For 18 days .....................61
Figure 23: EDS results of Ti6Al4V plates soaked in 1mM Sr added 2.0×SBF: (a)
For 3 days, (b) For 6 days, (c) For 9 days, (d) For 14 days. (e) For 18 days ……….62
Figure 24: EDS results of Ti6Al4V plates soaked in 5mM Sr added 2.0×SBF: (a)
For 3 days, (b) For 6 days …………………………………………………………..63
Figure 25: ICP-MS results of Ti6Al4V plates immersed in 0.15mM and 1mM Sr
added 2.0×SBF for 18 days: (a) Ca/Sr, (b) Ca/P, (c) (Sr+Ca)/P atomic ratios ..........65
xviii
Figure 26: XRD pattern of Ti6Al4V plates soaked in pure 2.0×SBF for 3, 6, 9, 14
and 18 days with standard HA pattern (from ICDD, card no:1-1008) ……………..66
Figure 27: XRD pattern of Ti6Al4V plates soaked in 0.15mM Sr added 2.0×SBF
for 3, 6, 9, 14 and 18 days with standard HA pattern (ICDD, card no:1-1008) ........68
Figure 28: XRD pattern of Ti6Al4V plates soaked in 1mM Sr added 2.0×SBF for 3,
6, 9, 14 and 18 days with standard HA pattern (ICDD, card no:1-1008) ………….69
Figure 29: XRD pattern of non-coated Ti6Al4V plates against to standard HA
pattern ………………..………………………………..…………………………....72
Figure 30: FTIR results of Ti6Al4V plates soaked in pure 2.0×SBF: (a) For 3 days,
(b) For 6 days, (c) For 9 days, (d) For 14 days and (e) For 18 days ……….............73
Figure 31: FTIR results of Ti6Al4V plates soaked in 0.15mM Sr added 2.0×SBF:
(a) For 3 days, (b) For 6 days, (c) For 9 days, (d) For 14 days and (e) For 18 days ..74
Figure 32: FTIR results of Ti6Al4V plates soaked in 1mM Sr added 2.0×SBF: (a)
For 3 days, (b) For 6 days, (c) For 9 days, (d) For 14 days and (e) For 18 days ......75
Figure 33: Raman spectroscopy results of Ti6Al4V sample plates soaked in pure
2.0×SBF (a) For 3 days and (b) For 6 days …...……………...................................77
Figure 34: Raman spectroscopy results of Ti6Al4V sample plates soaked in pure
2.0×SBF (a) For 9 days, (b) For 14 days and (c) For 18 days ……………………..78
Figure 35: Raman spectroscopy results of Ti6Al4V sample plates soaked in
0.15mM Sr added 2.0×SBF (a) For 3 days and (b) For 6 days ………………….….79
Figure 36: Raman spectroscopy results of Ti6Al4V sample plates soaked in
0.15mM Sr added 2.0×SBF (a) For 9 days, (b) For 14 days and (c) 18 days ……....79
Figure 37: Raman spectroscopy results of Ti6Al4V sample plates soaked in 1mM
Sr added 2.0×SBF (a) For 3 days and (b) For 6 days ……………………………...80
Figure 38: Raman spectroscopy results of Ti6Al4V sample plates soaked in 1mM Sr
added 2.0×SBF (a) For 9 days, (b) For 14 days and (c) 18 days …………………...81
xix
Figure 39: SEM images of osteosarcoma cells incubated for 7 days on: (a) Pure
sample for 9 days, (b) Pure sample for 18 days, (c) 0.15mM Sr added sample for
days, (d) 0.15mM Sr added sample for 18 days, (e) 1mM Sr added sample for 9 days
and (f) 1mM Sr added sample for 18 days (1000x) ………………………………..83
Figure 40: SEM images of aged: (a) Pure sample for 18 days (20x), (b) Pure sample
for 18 days (500x), (c) 0.15mM Sr added sample for 18 days (20x) and (d) 0.15mM
Sr added sample for 18 days (500x) ………………………………………………..84
Figure 41: SEM images of aged (a) 1mM Sr added sample for 18 days (20x) and (b)
1mM Sr added sample for 18 days (500x) …………………………………………85
Figure 42: SEM images of osteosarcoma cells on non-coated Ti6Al4V plate. (a)
500x and (b) 2000x magnification .............................................................................86
Figure 43: Percent viability of Saos-2 cells with respect to the Sr solution types
(concentrations) ……………………………………………………………………..88
Figure 44: Cellular viability of Saos-2 cells with respect to the coating types ……89
xx
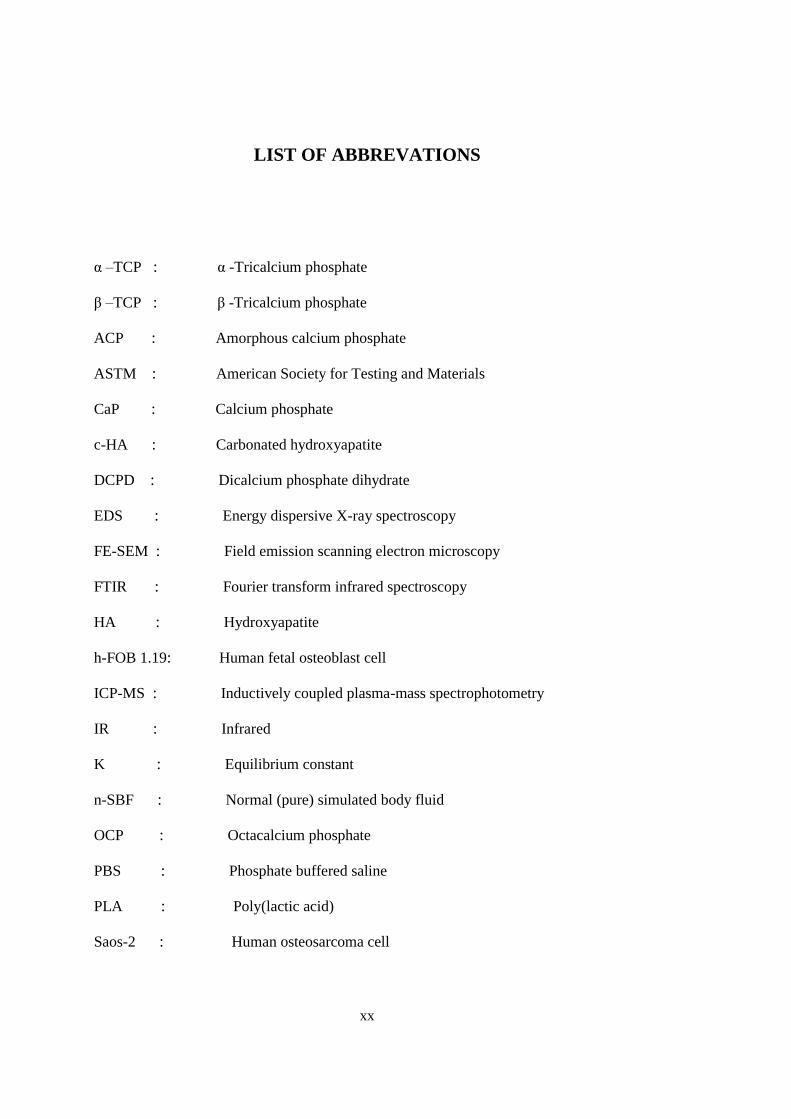
LIST OF ABBREVATIONS
α –TCP : α -Tricalcium phosphate
β –TCP : β -Tricalcium phosphate
ACP : Amorphous calcium phosphate
ASTM : American Society for Testing and Materials
CaP : Calcium phosphate
c-HA : Carbonated hydroxyapatite
DCPD : Dicalcium phosphate dihydrate
EDS : Energy dispersive X-ray spectroscopy
FE-SEM : Field emission scanning electron microscopy
FTIR : Fourier transform infrared spectroscopy
HA : Hydroxyapatite
h-FOB 1.19: Human fetal osteoblast cell
ICP-MS : Inductively coupled plasma-mass spectrophotometry
IR : Infrared
K : Equilibrium constant
n-SBF : Normal (pure) simulated body fluid
OCP : Octacalcium phosphate
PBS : Phosphate buffered saline
PLA : Poly(lactic acid)
Saos-2 : Human osteosarcoma cell

xxi
SBF : Simulated body fluid
SEM : Scanning electron microscopy
SiC : Silicon carbide
TEM : Transmission electron microscopy
TRIS : Tris(hydroxymethyl)aminomethane
XRD : X-ray diffraction


1
CHAPTER 1
INTRODUCTION
A wide range of materials is used in the construction of medical devices. These
materials are generally described as biomaterials. A biomaterial can be defined as any
material used to make devices to replace a part or a function of the body in a safe,
reliable, economic, and physiologically acceptable manner (Hench and Erthidge,
1982). One of the studies in biomaterial area is repairing bone and other hard tissue
defects which occur via natural processes such as aging or traumas. Metal based
implants are widely used for healing hard tissue defects.
1.1. Metal Based Biomaterials
The metallic biomaterials are roughly grouped into stainless steels: mainly SUS 316L
stainless steel, cobalt (Co)–chromium (Cr) alloys, titanium (Ti; pure titanium) and its
alloys; mainly pure titanium and Ti-6 weight percent aluminum (Al)-4 weight percent
vanadium (V), and precious alloys (gold (Au) based, silver (Ag) based or platinum (Pt)
based alloys) (Nakano T., 2010). Stainless steel is a one of the iron-based biomaterial
alloys. It contains over 12–13 wt% Cr and various elements and content of iron (Fe) is
2
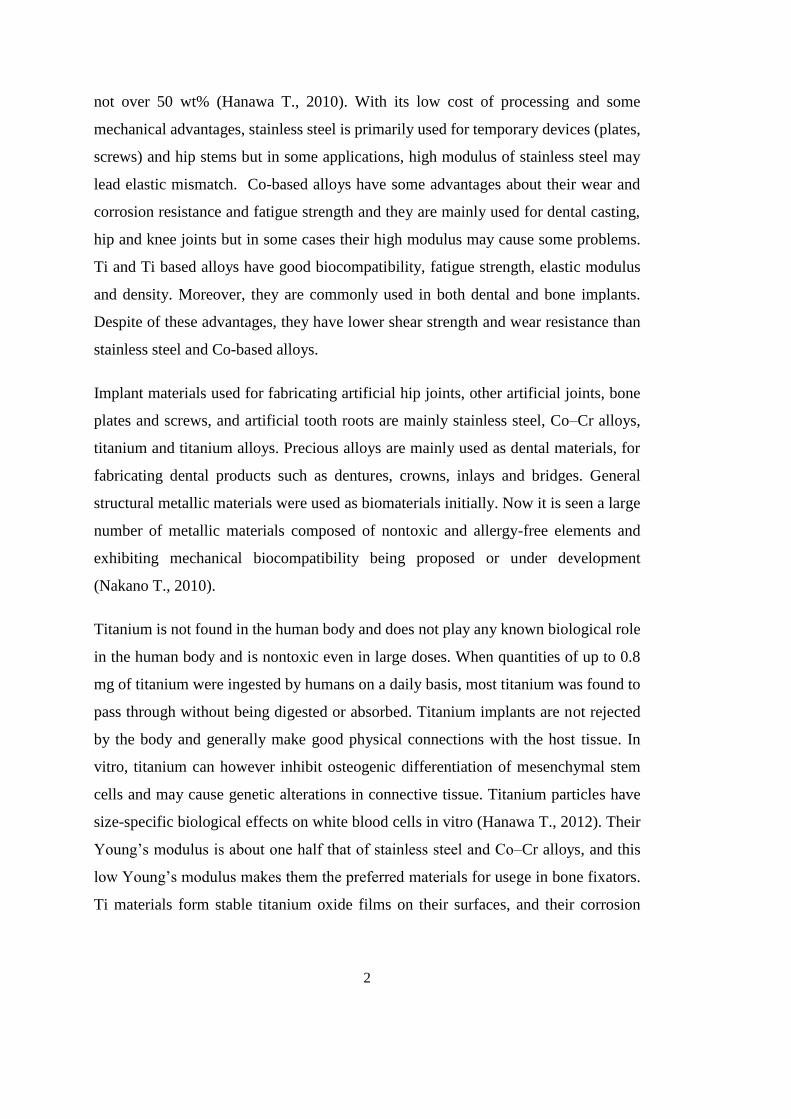
not over 50 wt% (Hanawa T., 2010). With its low cost of processing and some
mechanical advantages, stainless steel is primarily used for temporary devices (plates,
screws) and hip stems but in some applications, high modulus of stainless steel may
lead elastic mismatch. Co-based alloys have some advantages about their wear and
corrosion resistance and fatigue strength and they are mainly used for dental casting,
hip and knee joints but in some cases their high modulus may cause some problems.
Ti and Ti based alloys have good biocompatibility, fatigue strength, elastic modulus
and density. Moreover, they are commonly used in both dental and bone implants.
Despite of these advantages, they have lower shear strength and wear resistance than
stainless steel and Co-based alloys.
Implant materials used for fabricating artificial hip joints, other artificial joints, bone
plates and screws, and artificial tooth roots are mainly stainless steel, Co–Cr alloys,
titanium and titanium alloys. Precious alloys are mainly used as dental materials, for
fabricating dental products such as dentures, crowns, inlays and bridges. General
structural metallic materials were used as biomaterials initially. Now it is seen a large
number of metallic materials composed of nontoxic and allergy-free elements and
exhibiting mechanical biocompatibility being proposed or under development
(Nakano T., 2010).
Titanium is not found in the human body and does not play any known biological role
in the human body and is nontoxic even in large doses. When quantities of up to 0.8
mg of titanium were ingested by humans on a daily basis, most titanium was found to
pass through without being digested or absorbed. Titanium implants are not rejected
by the body and generally make good physical connections with the host tissue. In
vitro, titanium can however inhibit osteogenic differentiation of mesenchymal stem
cells and may cause genetic alterations in connective tissue. Titanium particles have
size-specific biological effects on white blood cells in vitro (Hanawa T., 2012). Their
Young’s modulus is about one half that of stainless steel and Co–Cr alloys, and this
low Young’s modulus makes them the preferred materials for usege in bone fixators.
Ti materials form stable titanium oxide films on their surfaces, and their corrosion
3
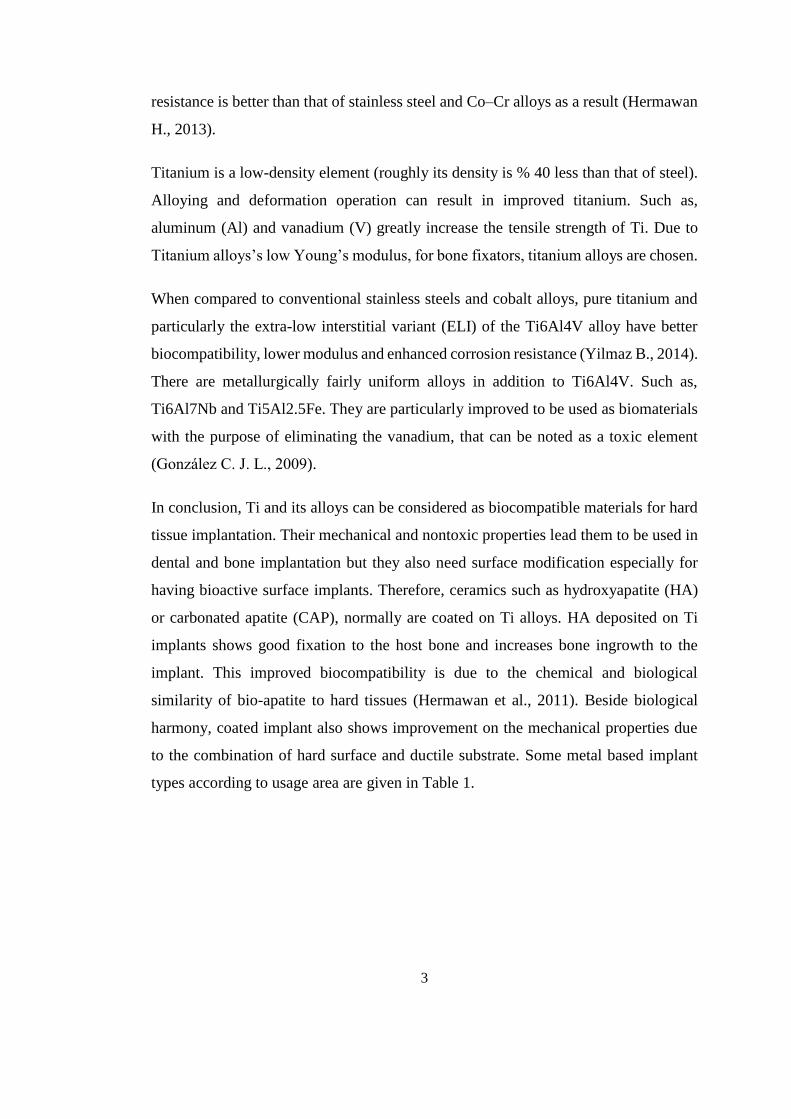
resistance is better than that of stainless steel and Co–Cr alloys as a result (Hermawan
H., 2013).
Titanium is a low-density element (roughly its density is % 40 less than that of steel).
Alloying and deformation operation can result in improved titanium. Such as,
aluminum (Al) and vanadium (V) greatly increase the tensile strength of Ti. Due to
Titanium alloys’s low Young’s modulus, for bone fixators, titanium alloys are chosen.
When compared to conventional stainless steels and cobalt alloys, pure titanium and
particularly the extra-low interstitial variant (ELI) of the Ti6Al4V alloy have better
biocompatibility, lower modulus and enhanced corrosion resistance (Yilmaz B., 2014).
There are metallurgically fairly uniform alloys in addition to Ti6Al4V. Such as,
Ti6Al7Nb and Ti5Al2.5Fe. They are particularly improved to be used as biomaterials
with the purpose of eliminating the vanadium, that can be noted as a toxic element
(González C. J. L., 2009).
In conclusion, Ti and its alloys can be considered as biocompatible materials for hard
tissue implantation. Their mechanical and nontoxic properties lead them to be used in
dental and bone implantation but they also need surface modification especially for
having bioactive surface implants. Therefore, ceramics such as hydroxyapatite (HA)
or carbonated apatite (CAP), normally are coated on Ti alloys. HA deposited on Ti
implants shows good fixation to the host bone and increases bone ingrowth to the
implant. This improved biocompatibility is due to the chemical and biological
similarity of bio-apatite to hard tissues (Hermawan et al., 2011). Beside biological
harmony, coated implant also shows improvement on the mechanical properties due
to the combination of hard surface and ductile substrate. Some metal based implant
types according to usage area are given in Table 1.
4
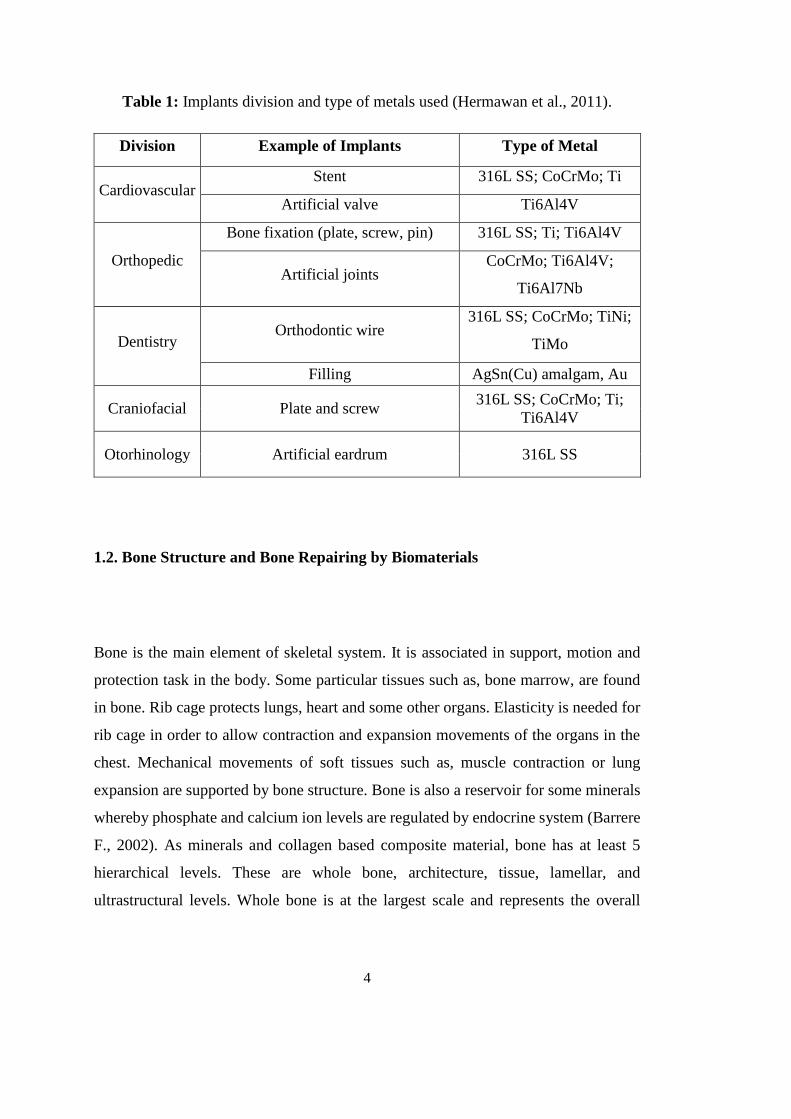
Table 1: Implants division and type of metals used (Hermawan et al., 2011).
Division Example of Implants Type of Metal
Cardiovascular Stent 316L SS; CoCrMo; Ti
Artificial valve Ti6Al4V
Orthopedic
Bone fixation (plate, screw, pin) 316L SS; Ti; Ti6Al4V
Artificial joints CoCrMo; Ti6Al4V;
Ti6Al7Nb
Dentistry Orthodontic wire
316L SS; CoCrMo; TiNi;
TiMo
Filling AgSn(Cu) amalgam, Au
Craniofacial Plate and screw 316L SS; CoCrMo; Ti;
Ti6Al4V
Otorhinology Artificial eardrum 316L SS
1.2. Bone Structure and Bone Repairing by Biomaterials
Bone is the main element of skeletal system. It is associated in support, motion and
protection task in the body. Some particular tissues such as, bone marrow, are found
in bone. Rib cage protects lungs, heart and some other organs. Elasticity is needed for
rib cage in order to allow contraction and expansion movements of the organs in the
chest. Mechanical movements of soft tissues such as, muscle contraction or lung
expansion are supported by bone structure. Bone is also a reservoir for some minerals
whereby phosphate and calcium ion levels are regulated by endocrine system (Barrere
F., 2002). As minerals and collagen based composite material, bone has at least 5
hierarchical levels. These are whole bone, architecture, tissue, lamellar, and
ultrastructural levels. Whole bone is at the largest scale and represents the overall

5
shape of bone. Its structure is composed of the architectural level, which contains the
microstructure that defines the spatial distribution. Below the architectural level is the
tissue level, which is inherent to the actual material properties of bone. The lamellar,
or cellular level is below the tissue level and is composed of sheets of collagen and
minerals deposited by osteoblasts. These hierarchical levels of femur structure can be
seen in Figure 1. Ultrastructural level is the smallest scaled level which combines
chemical and quantum interactions (Majeska R., 2001). These hierarchical levels are
categorized by structural differences in size magnitude which are shown in Table 2.
Figure 1: Illustration of structures corresponding to hierarchical levels of bone
(Liebschner and Wattergreen, 2001).
6
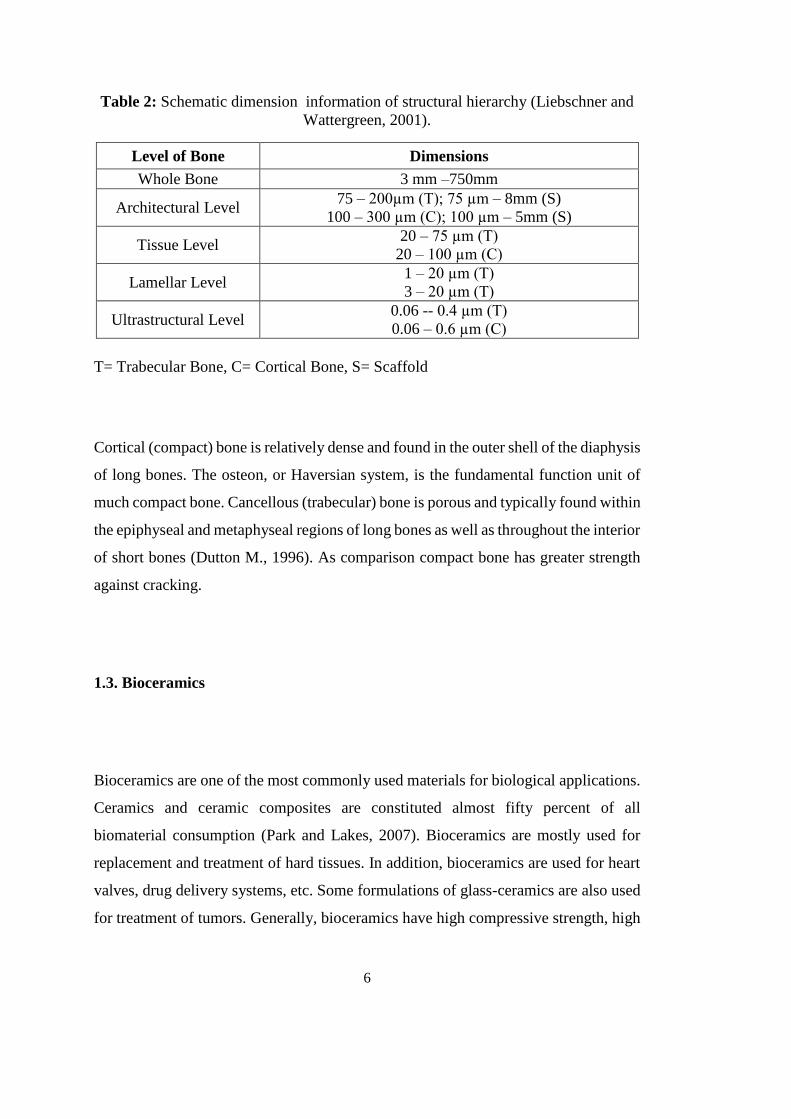
Table 2: Schematic dimension information of structural hierarchy (Liebschner and
Wattergreen, 2001).
Level of Bone Dimensions
Whole Bone 3 mm –750mm
Architectural Level 75 – 200µm (T); 75 µm – 8mm (S)
100 – 300 µm (C); 100 µm – 5mm (S)
Tissue Level 20 – 75 µm (T)
20 – 100 µm (C)
Lamellar Level 1 – 20 µm (T)
3 – 20 µm (T)
Ultrastructural Level 0.06 -- 0.4 µm (T)
0.06 – 0.6 µm (C)
T= Trabecular Bone, C= Cortical Bone, S= Scaffold
Cortical (compact) bone is relatively dense and found in the outer shell of the diaphysis
of long bones. The osteon, or Haversian system, is the fundamental function unit of
much compact bone. Cancellous (trabecular) bone is porous and typically found within
the epiphyseal and metaphyseal regions of long bones as well as throughout the interior
of short bones (Dutton M., 1996). As comparison compact bone has greater strength
against cracking.
1.3. Bioceramics
Bioceramics are one of the most commonly used materials for biological applications.
Ceramics and ceramic composites are constituted almost fifty percent of all
biomaterial consumption (Park and Lakes, 2007). Bioceramics are mostly used for
replacement and treatment of hard tissues. In addition, bioceramics are used for heart
valves, drug delivery systems, etc. Some formulations of glass-ceramics are also used
for treatment of tumors. Generally, bioceramics have high compressive strength, high

7
elastic modulus and high stiffness. They also have high density and aesthetic
appearance. Bioceramics can have structural functions as joint or tissue replacements,
can be used as coatings to improve the biocompatibility of metal implants, and can
function as resorbable lattices which provide temporary structures and a framework
that is dissolved, replaced as the body rebuilds tissue. In drug delivery system, the
development of granulate systems of calcium phosphate-based drugs with controlled
drug release can be examined (Hench L.L., 1993). Bioceramics can be classified as
almost bioinert, bioactive and resorbable, according to their reactivity inside the living
tissue (Vallet-Regi and Salinas, 2009). For load bearing implant applications, low
fracture toughness, elastic mismatch and density limitations are limitations of
bioceramics. To eliminate these problems some ceramic composite materials can be
used. For instance, polymer-HA composites can be used for improving mechanical
properties, controlled porosity and dynamic load transfer with biodegradable
polymers. Implantable bioceramics are mainly used for hard tissue support and
replacement. Desired properties of bioceramic implants are: non-toxic, non-
carcinogenic, non-allergic non-imflammatory, biocompatible and functional for its
lifetime in the host (Bronzino D.J., 2000). Bioinert ceramics maintain their physical
and mechanical properties while in the host (Bronzino D.J., 2000). They have high
corrosion resistance. Some bioinert ceramics are dense and porous aluminum oxides,
zirconia ceramics, and single phase calcium aluminates. Bioinert ceramics are
typically used as structural-support implants. Some of them are bone plates, bone
screws, and femoral heads (Bronzino D.J., 2000). Resorbable ceramics, as the name
implies, degrade upon implantation in the host. The resorbed material is replaced by
endogenous tissues. The rate of degradation varies from material to material. Almost
all bioresorbable ceramics except Biocoral and Plaster of Paris (calcium sulfate
dihydrate) are variations of calcium phosphate (CaP). As examples of resorbable
ceramics, CaP, coralline, Plaster of Paris, HA and tricalcium phosphate can be thought
(Bronzino D.J., 2000). Most of the ceramics are bioinert but in some applications,
bioactive or surface-reactive ceramics are needed. Surface reactive ceramics or
bioactive ceramics form strong bonds with adjacent tissue in implantation area.
8
Examples of these ceramics are dense nonporous glasses, bioglass, crevital, HA and
other CaP ceramics. Some examples of using areas of bioactive ceramics are
replacements of middle ear ossicles, bone plates and screws, excised tumor treatment,
reconstruction of dental defects and coating of metal prostheses (Bronzino D.J., 2000).
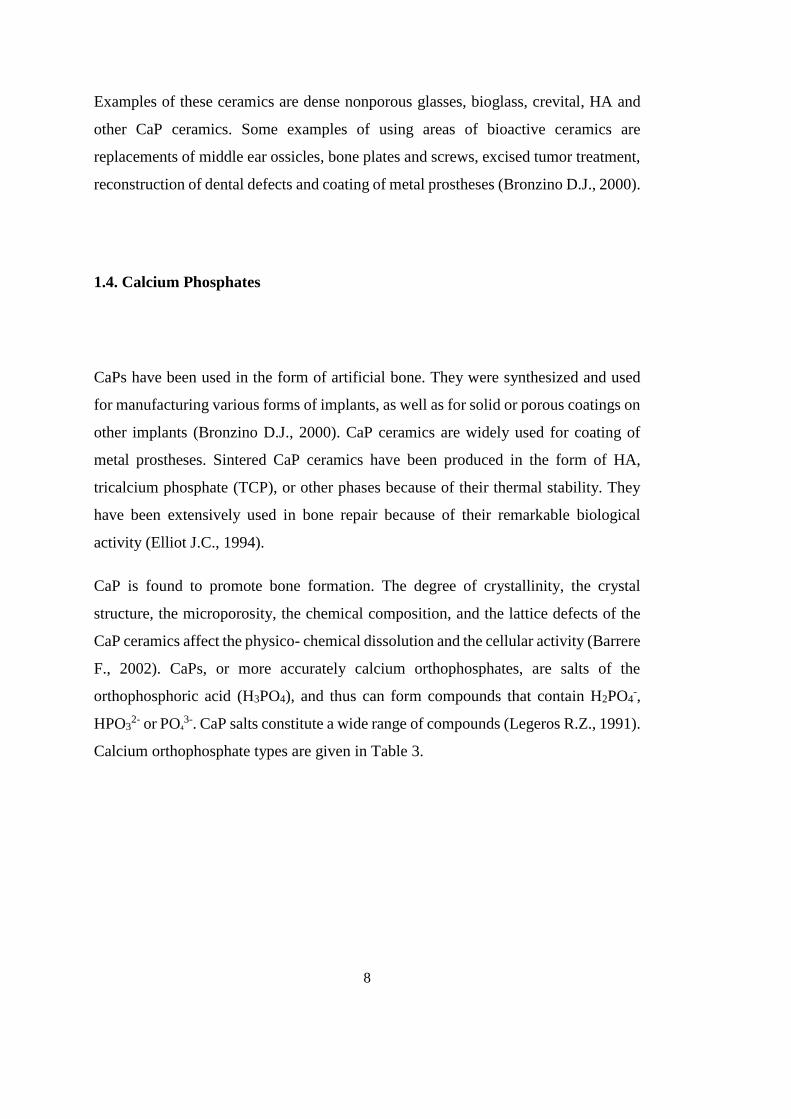
1.4. Calcium Phosphates
CaPs have been used in the form of artificial bone. They were synthesized and used
for manufacturing various forms of implants, as well as for solid or porous coatings on
other implants (Bronzino D.J., 2000). CaP ceramics are widely used for coating of
metal prostheses. Sintered CaP ceramics have been produced in the form of HA,
tricalcium phosphate (TCP), or other phases because of their thermal stability. They
have been extensively used in bone repair because of their remarkable biological
activity (Elliot J.C., 1994).
CaP is found to promote bone formation. The degree of crystallinity, the crystal
structure, the microporosity, the chemical composition, and the lattice defects of the
CaP ceramics affect the physico- chemical dissolution and the cellular activity (Barrere
F., 2002). CaPs, or more accurately calcium orthophosphates, are salts of the
orthophosphoric acid (H3PO4), and thus can form compounds that contain H2PO4-,
HPO32- or PO4
3-. CaP salts constitute a wide range of compounds (Legeros R.Z., 1991).
Calcium orthophosphate types are given in Table 3.
9
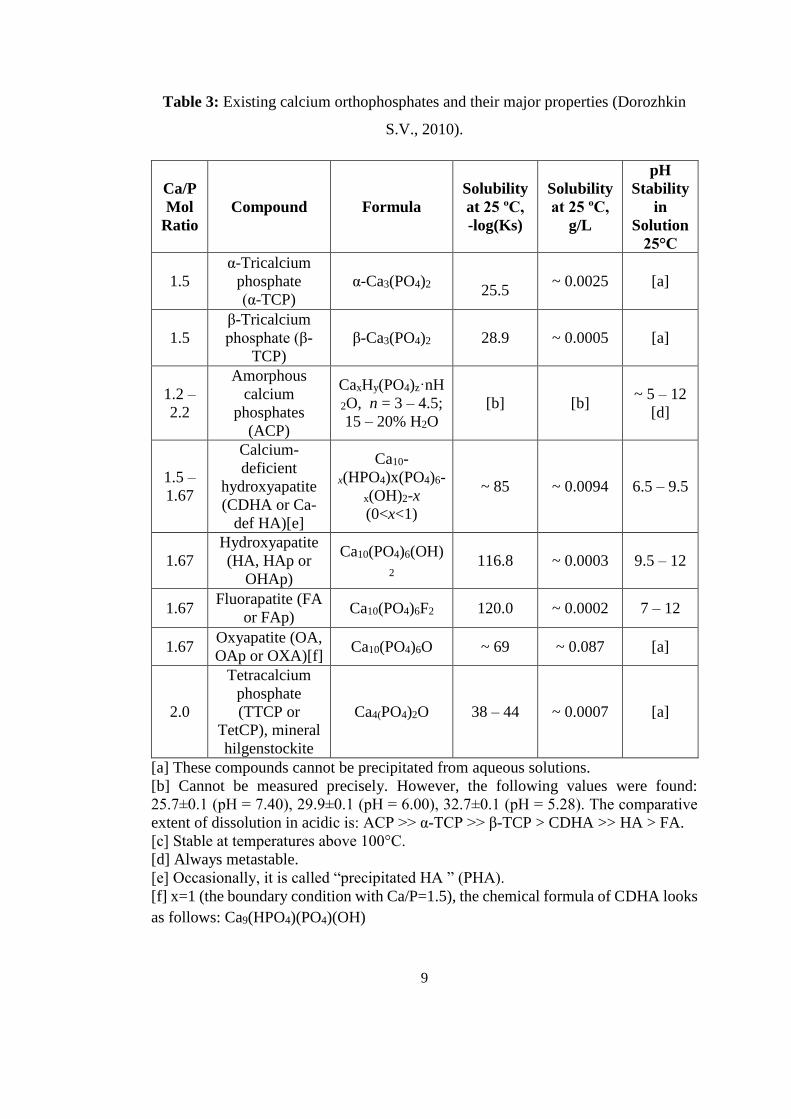
Table 3: Existing calcium orthophosphates and their major properties (Dorozhkin
S.V., 2010).
[a] These compounds cannot be precipitated from aqueous solutions.
[b] Cannot be measured precisely. However, the following values were found:
25.7±0.1 (pH = 7.40), 29.9±0.1 (pH = 6.00), 32.7±0.1 (pH = 5.28). The comparative
extent of dissolution in acidic is: ACP >> α-TCP >> β-TCP > CDHA >> HA > FA.
[c] Stable at temperatures above 100°C.
[d] Always metastable.
[e] Occasionally, it is called “precipitated HA ” (PHA).
[f] x=1 (the boundary condition with Ca/P=1.5), the chemical formula of CDHA looks
as follows: Ca9(HPO4)(PO4)(OH)
Ca/P
Mol
Ratio
Compound Formula
Solubility
at 25 ºC,
-log(Ks)
Solubility
at 25 ºC,
g/L
pH
Stability
in
Solution
25°C
1.5
α-Tricalcium
phosphate
(α-TCP)
α-Ca3(PO4)2
25.5 ~ 0.0025 [a]
1.5
β-Tricalcium
phosphate (β-
TCP)
β-Ca3(PO4)2 28.9 ~ 0.0005 [a]
1.2 –
2.2
Amorphous
calcium
phosphates
(ACP)
CaxHy(PO4)z·nH
2O, n = 3 – 4.5;
15 – 20% H2O
[b] [b] ~ 5 – 12
[d]
1.5 –
1.67
Calcium-
deficient
hydroxyapatite
(CDHA or Ca-
def HA)[e]
Ca10-
x(HPO4)x(PO4)6-
x(OH)2-x
(0<x<1)
~ 85 ~ 0.0094 6.5 – 9.5
1.67
Hydroxyapatite
(HA, HAp or
OHAp)
Ca10(PO4)6(OH)
2 116.8 ~ 0.0003 9.5 – 12
1.67 Fluorapatite (FA
or FAp) Ca10(PO4)6F2 120.0 ~ 0.0002 7 – 12
1.67 Oxyapatite (OA,
OAp or OXA)[f] Ca10(PO4)6O ~ 69 ~ 0.087 [a]
2.0
Tetracalcium
phosphate
(TTCP or
TetCP), mineral
hilgenstockite
Ca4(PO4)2O 38 – 44 ~ 0.0007 [a]
10
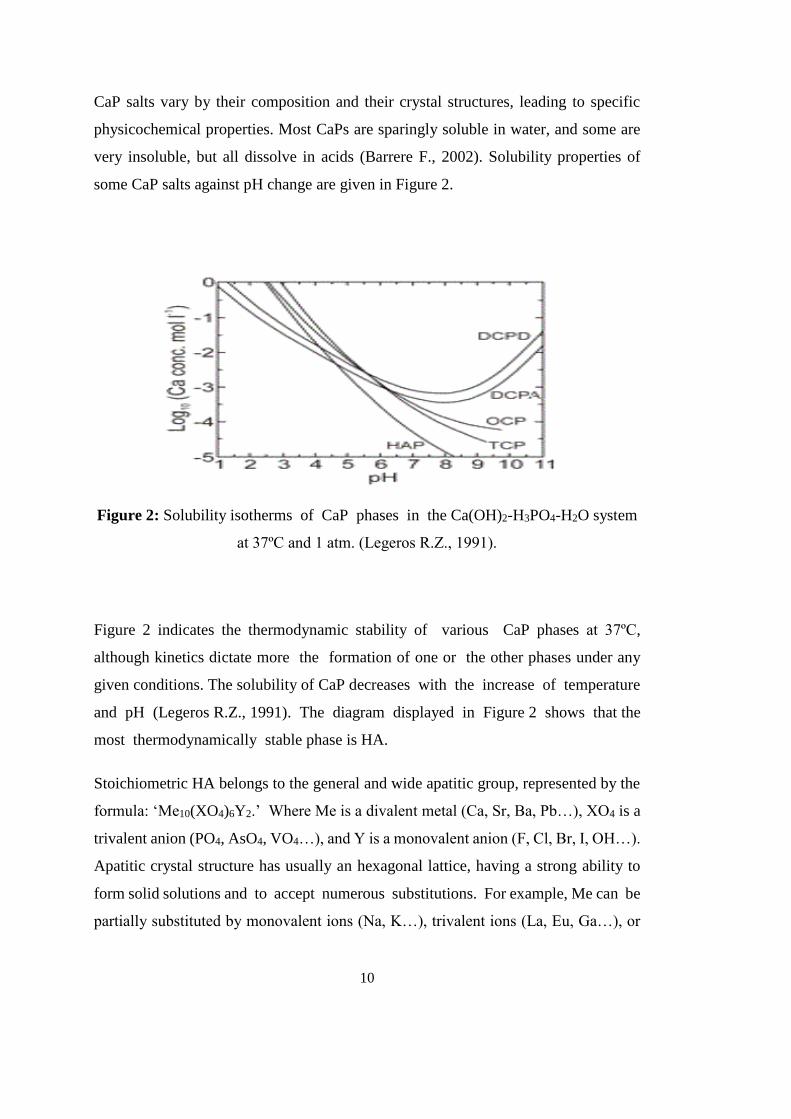
CaP salts vary by their composition and their crystal structures, leading to specific
physicochemical properties. Most CaPs are sparingly soluble in water, and some are
very insoluble, but all dissolve in acids (Barrere F., 2002). Solubility properties of
some CaP salts against pH change are given in Figure 2.
Figure 2: Solubility isotherms of CaP phases in the Ca(OH)2-H3PO4-H2O system
at 37ºC and 1 atm. (Legeros R.Z., 1991).
Figure 2 indicates the thermodynamic stability of various CaP phases at 37ºC,
although kinetics dictate more the formation of one or the other phases under any
given conditions. The solubility of CaP decreases with the increase of temperature
and pH (Legeros R.Z., 1991). The diagram displayed in Figure 2 shows that the
most thermodynamically stable phase is HA.
Stoichiometric HA belongs to the general and wide apatitic group, represented by the
formula: ‘Me10(XO4)6Y2.’ Where Me is a divalent metal (Ca, Sr, Ba, Pb…), XO4 is a
trivalent anion (PO4, AsO4, VO4…), and Y is a monovalent anion (F, Cl, Br, I, OH…).
Apatitic crystal structure has usually an hexagonal lattice, having a strong ability to
form solid solutions and to accept numerous substitutions. For example, Me can be
partially substituted by monovalent ions (Na, K…), trivalent ions (La, Eu, Ga…), or

11
by lacunae. Similarly, XO4 groups can be substituted by bivalent ions (CO3, SO4,
HPO4…), or tetravalent ions (SiO4). The second anionic site can be replaced by
divalent ions (CO3, O, O2, S…) or by lacunae. In the case of stoichiometric HA, the
substitution of XO4 by divalent ions such as HPO4 induces lacunas in the lattice,
decreasing the apatitic crystallinity. In this case, these apatites are called deficient
apatite. The carbonate (CO3) substitution can occur in two different sites, the
substitution of: 1) XO4 groups leading the so-called type B-carbonated apatite; 2)
Y2 groups leading to the so-called type A-carbonated apatite; 3) or both XO4 and Y2
sites so-called type AB-carbonated apatite. With regard to the stoichiometry, the
substitution by carbonates creates lacuna in the crystals and affects the lattice
parameters. Crystal size is decreased, and thereby the surface area is increased.
In addition, apatitic chemical bonds are weaker with carbonate groups, leading to
a higher dissolution than stoichiometric HA (Barrere F., 2002). Synthetic HA
(Ca10(PO4)6(OH)2) is the most widely studied CaP because it is a complete chemical
and crystalochemical analogue of bone mineral (Yilmaz B., 2014). Bone consists of
inorganic substances (69 wt%) whose main component is HA, organic substances (22
wt%) whose main component is collagen and water (9 wt%)(23). In compact bone,
HA mass percentage is up to % 70 and in enamel, the percentage of inorganic part
(fluorine containing HA) percentage is around % 97. Despite the similarity of HA and
bone inorganic structure, natural bone contains F–, Mg2+, CO32–, Cl–, Na+, K+, Fe2+,
Zn2+ and Sr2+ ions. These ions may have some positive effects on bone tissue. For
example, silver has antibiotic effects and strontium has positive effects on
osseointegration (Park et al., 2004, Renaudin et al., 2008, Yilmaz B., 2014).
Octacalcium phosphate (OCP, Ca8H2(PO4)6.5H2O) crystals are triclinic and they
consist of alterning “apatite layers” (arrangement of calcium and phosphate groups
similar to that of apatite) and “hydrated layers (Kokubo T., 2008). Two major distinct
phases of anhydrous tricalcium phosphate crystals exist: α -TCP and β -TCP. α -TCP
crystallizes in the monoclinic space group, and β -TCP crystallizes in the
rhombohedral space group. TCP is more soluble than HA, and it has been used as an
additional compound to HA in order to increase their solubility. Dicalcium phosphate
12
dehydrate crystals (DCPD, CaHPO4.2H2O) are monoclinic. There are four
formulas per unit cell with an asymmetric unit CaHPO4.2H2O. DCPD is one of
the most soluble of the CaP salts, and it is the most stable at pH=5.0. Amorphous
CaPs vary widely in composition because of the possible insertion of several
secondary ions. They are characterized by the broad X-ray diffraction bumps, and
by infrared monocomponent PO4 bands. The basic structure unit of amorphous CaP is
a cluster of ions comprising Ca9(PO4)6 packed with interfacial water to form bigger
entities (Barrere F., 2002). There are some applications using HA and some other CaP
in order to increase implant fixation and bone integration over implant materials
because of their bioactivity and high biocompatibility features. For example, in hip
arthroplasty, for the fixation of hip stems CaP coatings are used. For the fixation of
hip stems, there are basically two different techniques that can be utilized cemented
and cementless fixation. Cemented fixation is based upon the use of an acrylic cement
to fill the space between the prosthesis and the surrounding bone, resulting in
mechanical fixation of the prosthesis. On the other hand, cementless fixation is
based upon retention of the prosthesis itself, without an intermediate substance. In
cementless devices, a long lasting fixation has to be achieved by functional
integration of the prosthesis with the surrounding bone. The functional integration
depends on the physicochemical and biological performances of the implant.
1.5. Calcium Phosphate Coatings
Titanium and its alloys with CaP coating confer an effective osseointegration (Barrere
F., 2002). CaP surface coatings are applied to form mechanical, chemical and
biological conformable surfaced metallic orthopedic and dental implants. Some
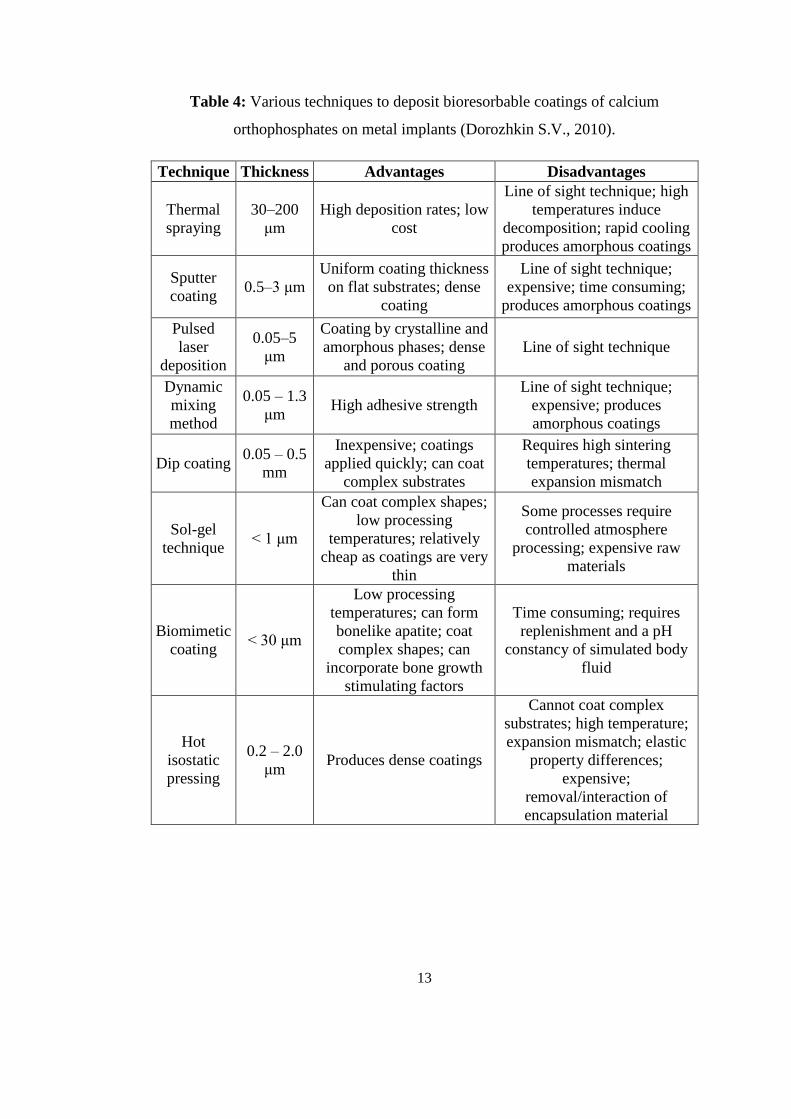
techniques which are used for CaP coatings on metal implants are given in Table 4.
13
Table 4: Various techniques to deposit bioresorbable coatings of calcium
orthophosphates on metal implants (Dorozhkin S.V., 2010).
Technique Thickness Advantages Disadvantages
Thermal
spraying
30–200
μm
High deposition rates; low
cost
Line of sight technique; high
temperatures induce
decomposition; rapid cooling
produces amorphous coatings
Sputter
coating 0.5–3 μm
Uniform coating thickness
on flat substrates; dense
coating
Line of sight technique;
expensive; time consuming;
produces amorphous coatings
Pulsed
laser
deposition
0.05–5
μm
Coating by crystalline and
amorphous phases; dense
and porous coating
Line of sight technique
Dynamic
mixing
method
0.05 – 1.3
μm High adhesive strength
Line of sight technique;
expensive; produces
amorphous coatings
Dip coating 0.05 – 0.5
mm
Inexpensive; coatings
applied quickly; can coat
complex substrates
Requires high sintering
temperatures; thermal
expansion mismatch
Sol-gel
technique < 1 μm
Can coat complex shapes;
low processing
temperatures; relatively
cheap as coatings are very
thin
Some processes require
controlled atmosphere
processing; expensive raw
materials
Biomimetic
coating < 30 μm
Low processing
temperatures; can form
bonelike apatite; coat
complex shapes; can
incorporate bone growth
stimulating factors
Time consuming; requires
replenishment and a pH
constancy of simulated body
fluid
Hot
isostatic
pressing
0.2 – 2.0
μm Produces dense coatings
Cannot coat complex
substrates; high temperature;
expansion mismatch; elastic
property differences;
expensive;
removal/interaction of
encapsulation material

14
Coatings should be attached to the surface of substrate material regardless of their
planned function. Mechanical stability of calcium orthophosphate coatings must be
high adequate to maintain their bioactivity for surgical implantation. Adhesion of the
calcium orthophosphate coatings to the metal based substrate material is commonly
determined by using adhesion tests. For example, ASTM C633 is very widely used
test for adhesion testing (Dorozhkin S.V., 2010). Furthermore, fatigue scratch and
pullout testing are among the most valuable techniques to provide additional
information on the mechanical behavior of calcium orthophosphate coatings. In the
case of porous implants, calcium orthophosphate coatings enhance bone ingrowth into
the pores (Evans F.G., 1976) The clinical results for calcium orthophosphate-coated
implants reveal that they have much longer lifetimes after implantation than uncoated
devices and they have been found to be particularly beneficial for younger patients.
Studies concluded that there was significantly less pin loosening in the HA-coated
groups (Dorozhkin S.V., 2010).
Among these techniques which are stated above, plasma spraying is widely used due
to its simplicity and economy. At the same time, it was observed that, plasma spraying
displayed variation in bond strength between the coatings and the metallic substrates,
changes in the phase composition and crystallinity of HA and alteration in the
characteristics of metallic substrates due to the elevated temperature of the process
resulted from non-uniformity in coating thickness and coating density. Also as another
problem, plasma spraying is not a very useful method for coating complex implant
surfaces because it is a line-of-sight process (Yilmaz B., 2014). Properties of calcium
orthophosphates as coating materials are influenced by some factors. Coating
crystallinity, porosity, thickness, purity and adhesion are some of these factors
(Dorozhkin S.V., 2010).
Biomimetic method is also one of the most useful methods for coating CaP by
mimicking body temperature and pH environment. However, this method is highly
time consuming (Yilmaz B., 2014). In later parts of this study more information is
given about biomimetic method and simulated body fluids.

15
1.6. Surface Modification of Metallic Implants
Metal implants are commonly used for hard tissue replacement or hard tissue fixation.
For successful hard tissue implantation, obtaining abundant mechanical, chemical and
biological properties especially osseointegration is crucial. Achievement of
osseointegration as well as related to the surgical method, is related to implant material
and design, mostly depend on surface properties. Many studies reveal the effects of
surface characteristics of implants on bony response.
Osseointegration refers to the direct structural and functional connection between
living bone and the surface of a load-bearing artificial implant. Osseointegration was
first defined as a direct contact between living bone and the surface of a load-carrying
implant at the histological level (Adell et al., 1981). A bioinert surface does not support
osseointegration process. On the other hand, a bioactive surface participates
osseintegration formation by reaction between surrounding bone tissue and chemically
modified implant surface. Osseointegration is related with osteoinduction,
osteogenesis and osteoconduction. Osteoconduction property for a surface defines the
ability to sitimulate bone growth by allowing bone apposition from existing bone.
Osteogenesis defines the bone tissue formation and osteoinduction means acceleration
in bone formation by some process. To encourage bone growth across its surface an
osteoconductive surface requires the presence of existing bone or differentiated
mesenchymal cells. Substances, such as CaP and HA coatings can be classified as
osseoconductive surfaces. Osteoinduction is the process of stimulating osteogenesis,
osteoinductive surfaces enhance bone regeneration and may even cause bone to grow
or extend into an area where it is not normally found. Examples of such surfaces are
those coated with collagen-chitosan polymers, which are often used for orthopedic
implant purposes (Parekh et al., 2012).
Researches show that, implant surfaces have a great role on the healing process of
bone. In comparison to physical-chemical methods, morphological methods have

16
greater effects on surface preparation. Increasing the free energy of the implant surface
is an example of physicochemical surface modification method. On the other hand,
the ultimate aim of the morphological methods is making the surface more rough. It
has been proven that rough surfaces affect healing process of bone positively. There
are some techniques for modification of metal implant surface and among them,
sandblasting/ acid-etching methods and HA coating techniques show better
osseointegration (Uzun and Keyf, 2007). Some of surface modification techniques for
metallic implant surfaces are shown in Table 5 below;
Table 5: Some surface modification methods and basic classification of these
methods (Parekh et al., 2012).
Ablative Procedures Additive Procedures
Grit blasting Plasma spraying
Acid etching Electrophoretic deposition
Anodizing Sputter deposition
Shot/laser peening Sol gel coating
Pulsed laser deposition
Biomimetic precipitation
1.6.1. Machined Blasted Surface Modification
Machined surface: In this method, the surface roughness is achieved with machine
applying. Alterations in the biomaterial surface morphology have been used to
influence the cell and tissue responses to the implants as mentioned before. Porous
coatings were originally developed with the consideration of the pore size (50-400μm
17
optimal) and the volume fraction porosity (35-40% optimal). In initial studies, screw
shaped implants were prepared with different surface topographies as machined and
blasted surfaces and the topography was measured by using a confocal laser scanning
profilometer, their surface roughness being characterized by using height and spatial
descriptive patterns (Garg et al., 2012).
1.6.2. Blasting and Etching (Physiochemical) Modifications
Sand and grit blasting are used to modify the implant surface by using titanium oxide
and alumina particles. 25μm particles of TiO2 are used to grit the blast. The large grit
sandblasting particles are corundum 0.25-0.5mm and the medium grit particles are
250-500μm in size. Acid etching can be done by using an HCl/H2SO4 mixture or by
pickling in 2% HF/10%HNO3. These processes leave pits and craters. In addition to
the surface roughness, sand blasting and acid etching can remove the surface
contaminants and increase the surface reactivity of the metal (Garg et al., 2012). With
acid-etching, 2-4 μm sized pits are obtained (Uzun and Keyf, 2007). The roughness of
implant surface is aimed to be same for all surface. Some further modifications are
applied for SLA (sandbalasted large grid acid-etched) implants such as hydrophilicity
treatments (i.e. SLActive Implants) (Lang et al., 2011).
1.6.3. Electro – Polished (Oxidized) Modification
Anodized surface implants are implants which are placed as anodes in galvanic cells,
with phosphoric acid as the electrolyte and current is passed through them, (Garg et
al., 2012) with this technique micro pits are formed on metallic substrates (Uzun and
Keyf, 2007).
18
1.6.4. Titanium Plasma Spray (TPS) Surface Modification
TPS has been used for improving osseointegration of titanium based implants since
1974. In this method, around 40 μm sized particles are heated and titanium substrate
surfaces are bombarded with them by the aid of high speed and temperature (Uzun and
Keyf, 2007). With this method, rough titanium or titanium alloy implant surface is
achieved. There are some different techniques for TiO2 grid-blasting over Ti based
surfaces.
1.6.5. Sol-Gel Surface Modification
The sol–gel process is a versatile synthesis method used to produce glasses and
ceramics at low temperatures. Sol–gel chemistry is based on the hydrolysis and
polycondensation of metal alkoxides (M(OR)n, where M = Si, Sn, Ti, Al, Mo, V, W,
Ce and so forth). The following sequence of reactivity is usually found: Si(OR)4<<
Sn(OR)4 = Ti(OR)4 <Zr(OR)4 = Ce(OR)4. As silicon alkoxides are not very reactive,
sol–gel process is slow and easy to control in order to produce a transparent gel (Caturo
et al., 2015). With using sol-gel, titanium based and some other biomaterials such as
stainless steel surfaces are modified to achieve better biocompatibility.
19
1.6.6. HA-CaP Coating Surface Modifications
HA and other CaP salts are bioactive ceramics. They are usually used in implants as
coating materials because of their positive effect on osseintegration. CaP salts increase
bone formation and improve implant fixation in the bone. HA is the most stabilized
form of CaP salts in the body, usually other CaP salts are degradable in the body. There
are lots of methods used for HA coatings. Some of the basic methods are; dip coating-
sintering, hot isostatic pressure, plasma spray, immersion coating, electrostatic spray
or biomimetic coating methods (Uzun and Keyf, 2007). The plasma spray HA method
process is a type of thermal spray technology that uses a device to melt and deposit a
coating material at a high velocity onto a substrate. The advantages of plasma spray
include simplicity, rapid deposition rate, low substrate temperature, low cost and
variable coating porosity, phase and structure. Electrophoretic deposition method is a
process in which colloidal particles, such as HA nanoprecipitates which are suspended
in a liquid medium migrate under the influence of an electric field and are deposited
onto a counter charged electrode. The coating is simply formed by pressure exerted by
the potential difference between the electrodes. The operational parameters of
electrophoretic deposition can be changed to alter HA surface coating morphology and
composition (Parekh et al., 2012). Despite high time consuming, biomimetic
deposition of CaP is also a useful surface modification method. This method is
explained in details in next part.
1.7. Biomimetic Coating Method and Simulated Body Fluid
Simulated body fluid (SBF) is a solution which was developed by Kokubo and his
colleagues in 1990 (Kokubo et al., 1990). This solution has similar ion concentration
20
with human extracellular fluids such as human blood plasma (Lee et al, 2006) and it is
kept under physiological temperature and mild conditions of PH. SBF simulates only
the inorganic part of blood plasma and does not contain proteins, glucose, vitamins,
hormones, etc. (Yilmaz B., 2014). SBFs are able to reproduce bone-like mineral in
vitro (Barrere F., 2002). Bone formation is a complex biological progress, and
precipitation of ions from solution to form apatite has many steps. With time, with the
adaptation of some of some methodologies, alternative SBFs were produced instead
of conventional one. SBFs can be considered as the key of biomimetic process. With
these solutions, mimicking bone mineralization opens large perspective for CaP
coatings (Barrere F., 2002). On the other hand, SBF solution only mimics inorganic
part of the extracellular fluid therefore, it can not be used to evaluate complete
bioactivity of a material (Tas A. C., 2014).
1.7.1. Development of Simulated Body Fluids
Kokubo et al. developed SBF as a mineralizing solution inspired from body fluids.
They first introduced SBF for evaluating surface chances of a bioactive glass ceramic
(Kokubo et al., 1990). Kokubo T. and Takadama H. pointed that the bone bonding
ability of a material can be evaluated by using SBF which have very similar ion
concentrations to those of human blood plasma by examining the apatite formation
ability (Kokubo and Takadama, 2006). As mentioned before, in time, several different
SBFs were introduced such as, corrected SBF by Kokubo et al., SBF by Bigi et al.,
revised SBF by Oyane et al., SBF by Tas A. C., etc. Kokubo’s original SBF is named
conventional SBF. Some corrections and developments in conventional SBF makes it
more useful. For instance SBF which was developed by Tas A. C. has more similar
ion concentrations to the human blood plasma then conventional SBF. In 2010, Pasinli
at al. showed a procedure for preparation of SBF solution free of non-metabolic
organics such as TRIS or HEPES in their research (Pasinli et al., 2010).

21
1.7.1.1. Conventional SBF by Kokubo et al.
This SBF is the original and first introduced SBF in 1991 by Kokubo et al.
1.7.1.2. Corrected SBF by Kokubo et al.
Original (conventional) SBF which was introduced by Kokubo et al. is lack of SO42-
ion. However human blood plasma contains 0.5 mM SO42-. In order to eliminate this
problem conventional SBF ion concentration was changed and new solution is called
corrected SBF. 0.5 mM SO42- ion was added and Cl – ion level is decreased a little.
Changing in Cl – ion level is very little and corrected SBF has still much higher Cl –
level. Corrected SBF was introduced by Kokubo et al. in 1991 (Kokubo and
Takadama, 2006).
1.7.1.3. SBF by Tas A. C.
A new SBF solution developed by Tas A. C. in 2000. In this SBF solution HCO3- level
is much higher then corrected SBF and equal to the human blood plasma. Cl – level is
much closer to the human blood then corrected or conventional SBF. In other words,
this SBF better mimics human blood then corrected SBF. TRIS buffer is used. (Tas
A.C., 2000).

22
1.7.1.4. Revised SBF by Oyane et al.
Corrected SBF developed by Kokubo et al. has higher Cl – level and much lower
HCO3- level then human blood. In 2003, Oyane et al. published a study in which they
tried to decrease Cl - and increase HCO3- levels of SBF. With this SBF, the levels of
human blood ion concentrations are achieved. However, in revised SBF, calcium
carbonate has a strong tendency to precipitate because of its supersaturation according
to both apatite and calcite (Kokubo and Takadama, 2006). Oyane used HEPES as
buffer instead of TRIS which is used as buffer in corrected SBF.
1.7.1.5. Modified SBF by Oyane et al.
In 2003 Oyane et al. also developed another SBF solution which is called modified
SBF. In this solution Cl – level is similar to the human blood plasma but HCO3- level
is lower. On the other hand both ion levels are closer to the human body fluid then
corrected SBF. Like revised SBF, HEPES is used as buffer (Oyane et al., 2003).
1.7.1.6. Ionized SBF by Oyane et al.
In 2003, Oyane et al. also developed this SBF solution. Like other Oyane et al.
prepared SBFs, HEPES is used as buffer. Ion concentrations in this solution are very
similar to blood plasma except Mg2+ and Ca2+ ion concentrations. Both ion levels are
lower than blood plasma or conventional SBF solution.

23
1.7.1.7. Newly improved SBF by Takadama et al.
In 2004 Takadama et al. developed a new SBF solution which is called newly
improved SBF. They decreased the Cl – ion level in corrected SBF to the human blood
plasma level but HCO3- level remained same as Kokubo’s corrected SBF (Kokubo and
Takadama, 2006). This SBF was compared to the corrected SBF in their stability and
the reproducibility of apatite formation on synthetic materials with using round robin
testing. As a result, no significant difference in stability and reproducibility between
these solutions was observed (Kokubo and Takadama, 2006). TRIS is used as buffer
for this solution.
1.7.1.8. SBF by Bigi et al.
In 2006, Bigi et al. developed a SBF solution. This solution was almost identical to the
SBF developed by Tas A. C. HEPES was used as buffer in this solution.
1.7.1.9. Lac-SBF by Pasinli et al.
In 2010, Pasinli et al. published a preparation procedure for SBF solution free of non-
metabolic buffers. HEPES and TRIS are not found in human metabolism therefore,
they are non-metabolic buffers. In their research, Pasinli et al, used lactic acid as buffer
instead of HEPES or TRIS in their research. Lac-SBF has perfect ion concentration
for mimicking the blood, similar to the r-SBF by Ovane at al (Pasinli et al., 2010).
24
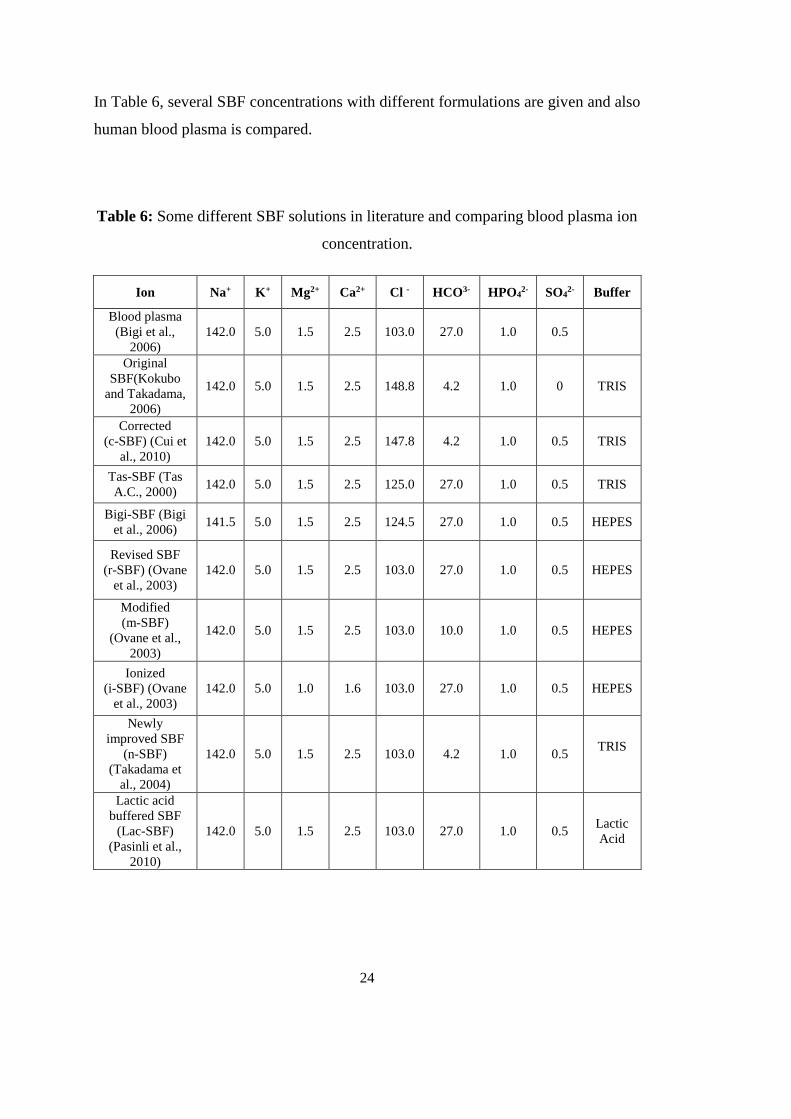
In Table 6, several SBF concentrations with different formulations are given and also
human blood plasma is compared.
Table 6: Some different SBF solutions in literature and comparing blood plasma ion
concentration.
Ion Na+ K+ Mg2+ Ca2+ Cl - HCO3- HPO42- SO4
2- Buffer
Blood plasma
(Bigi et al.,
2006)
142.0 5.0 1.5 2.5 103.0 27.0 1.0 0.5
Original
SBF(Kokubo
and Takadama,
2006)
142.0 5.0 1.5 2.5 148.8 4.2 1.0 0 TRIS
Corrected
(c-SBF) (Cui et
al., 2010)
142.0 5.0 1.5 2.5 147.8 4.2 1.0 0.5 TRIS
Tas-SBF (Tas
A.C., 2000) 142.0 5.0 1.5 2.5 125.0 27.0 1.0 0.5 TRIS
Bigi-SBF (Bigi
et al., 2006) 141.5 5.0 1.5 2.5 124.5 27.0 1.0 0.5 HEPES
Revised SBF
(r-SBF) (Ovane
et al., 2003)
142.0 5.0 1.5 2.5 103.0 27.0 1.0 0.5 HEPES
Modified
(m-SBF)
(Ovane et al.,
2003)
142.0 5.0 1.5 2.5 103.0 10.0 1.0 0.5 HEPES
Ionized
(i-SBF) (Ovane
et al., 2003)
142.0 5.0 1.0 1.6 103.0 27.0 1.0 0.5 HEPES
Newly
improved SBF
(n-SBF)
(Takadama et
al., 2004)
142.0 5.0 1.5 2.5 103.0 4.2 1.0 0.5 TRIS
Lactic acid
buffered SBF
(Lac-SBF)
(Pasinli et al.,
2010)
142.0 5.0 1.5 2.5 103.0 27.0 1.0 0.5 Lactic
Acid
25
Biomimetics is applying systems or methods which are exist in nature to design
artificial systems or methods (Yilmaz B., 2014). Biomimetics is very useful and
attractive area for hard tissue engineering. In this method, a SBF with ion
concentration similar to that of human blood plasma is used (Lee et al, 2006). The
advantages with this method compared to previously described methods include the
possibility to (Kokubo and Takadama, 2006):
1- To coat complex shaped materials.
2- To produce coatings with higher solubility then synthetic HA.
3- To obtain coatings that are more similar to bone mineral than is possible with
commercially available techniques today.
The main disadvantages are (Kokubo and Takadama, 2006):
1- Relatively slow deposition rate
2- The coatings can be porous and limited thickness which leads to have low
mechanical strength
For having positive biological effects, incorporation of ions have been marked. An
alternative way to develop the biological effect of HA is incorporation of ions that
have been proposed (Lindahl C., 2012). The inorganic phase of bone is a
multisubstituted and non-stoichiometric HA with traces of ions like Sr2+, Si4+, F- in the
lattice. For instance, Sr (strontium) has been proven to stimulate the bone formation
by increasing osteoblast and reducing osteoclast in vivo cultures.
The main focusing area of this study is based on potential positive effect of strontium
in bone formation and osseointegration of Sr doped implants. These ions not only have
effects on bone formation but have also been shown to alter the properties of HA
coatings. SBF mimics pH, inorganic composition and temperature of human blood
plasma.Biomimetic apatite coating process is mainly mimicking the bone
mineralization process by immersing implants in SBF (Zhao et al., 2011).

26
In this research Kokubo’s corrected SBF is used for biomimetic coating process.
Preperation of corrected SBF is given in details in next chapter. In this research,
Kokubo’s original SBF formulations are used to prepare pure 2×SBF, 1mM Sr added
2×SBF and 5mM Sr added 2×SBF solutions. It must be noted that, 2×SBF has 2 times
ion concentration to the normal SBF.
1.7.2. Mechanisms and kinetics of ion release from substituted apatite coatings
Ion release from HA and ion substituted HA (iHA) materials in SBFs in literature
(Lindahl C., 2012). The results have marked that ions like Sr2+ and Si4+ have positive
effect on bone formation. In addition these ions can alter some properties for instance
crystallinity and solubility of the HA. In the biological response, crystallinity and
dissolution of the HA can take a role (Lindahl C., 2012).
For covering with a passive thin titania (TiO2) layer, titanium and its alloys are usually
chemically durable (Yilmaz B., 2014). In alkali treatment TiO2 layer reacts with NaOH
solution and forms sodium titanate hydrogel layer. Kim et al. used alkali and heat
treatment to improve bioactivity of Ti and its alloys (Kim et al., 1996; Kokubo et al.,
2003). Apatite formation process on pretreated (alkali and heat treated) Ti alloy via
biomimetic method is shown in Figure 3.
27
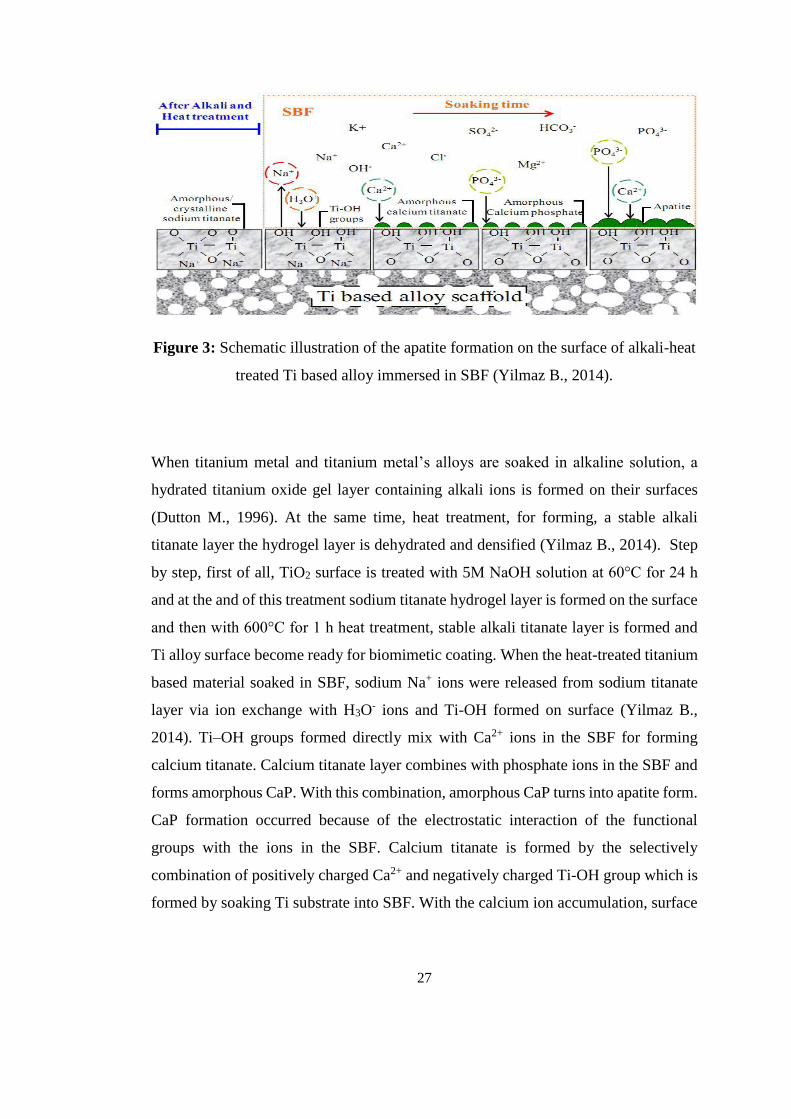
Figure 3: Schematic illustration of the apatite formation on the surface of alkali-heat
treated Ti based alloy immersed in SBF (Yilmaz B., 2014).
When titanium metal and titanium metal’s alloys are soaked in alkaline solution, a
hydrated titanium oxide gel layer containing alkali ions is formed on their surfaces
(Dutton M., 1996). At the same time, heat treatment, for forming, a stable alkali
titanate layer the hydrogel layer is dehydrated and densified (Yilmaz B., 2014). Step
by step, first of all, TiO2 surface is treated with 5M NaOH solution at 60°C for 24 h
and at the and of this treatment sodium titanate hydrogel layer is formed on the surface
and then with 600°C for 1 h heat treatment, stable alkali titanate layer is formed and
Ti alloy surface become ready for biomimetic coating. When the heat-treated titanium
based material soaked in SBF, sodium Na+ ions were released from sodium titanate
layer via ion exchange with H3O- ions and Ti-OH formed on surface (Yilmaz B.,
2014). Ti–OH groups formed directly mix with Ca2+ ions in the SBF for forming
calcium titanate. Calcium titanate layer combines with phosphate ions in the SBF and
forms amorphous CaP. With this combination, amorphous CaP turns into apatite form.
CaP formation occurred because of the electrostatic interaction of the functional
groups with the ions in the SBF. Calcium titanate is formed by the selectively
combination of positively charged Ca2+ and negatively charged Ti-OH group which is
formed by soaking Ti substrate into SBF. With the calcium ion accumulation, surface
28
gains gradually positive charge. Naturally, negatively charged phosphate ions combine
with positively charged surface and CaP formation occurs (Yilmaz B., 2014).
SBF is a supersaturated solution therefore, after formation of apatite nuclei, by
consuming P and Ca ions from SBF solution they grow spontaneously (Yilmaz B.,
2014). In this research, SBF solutions were refreshed in every 2 days because of the
keeping saturation difference between SBF solution and apatite layer. HA precipitation
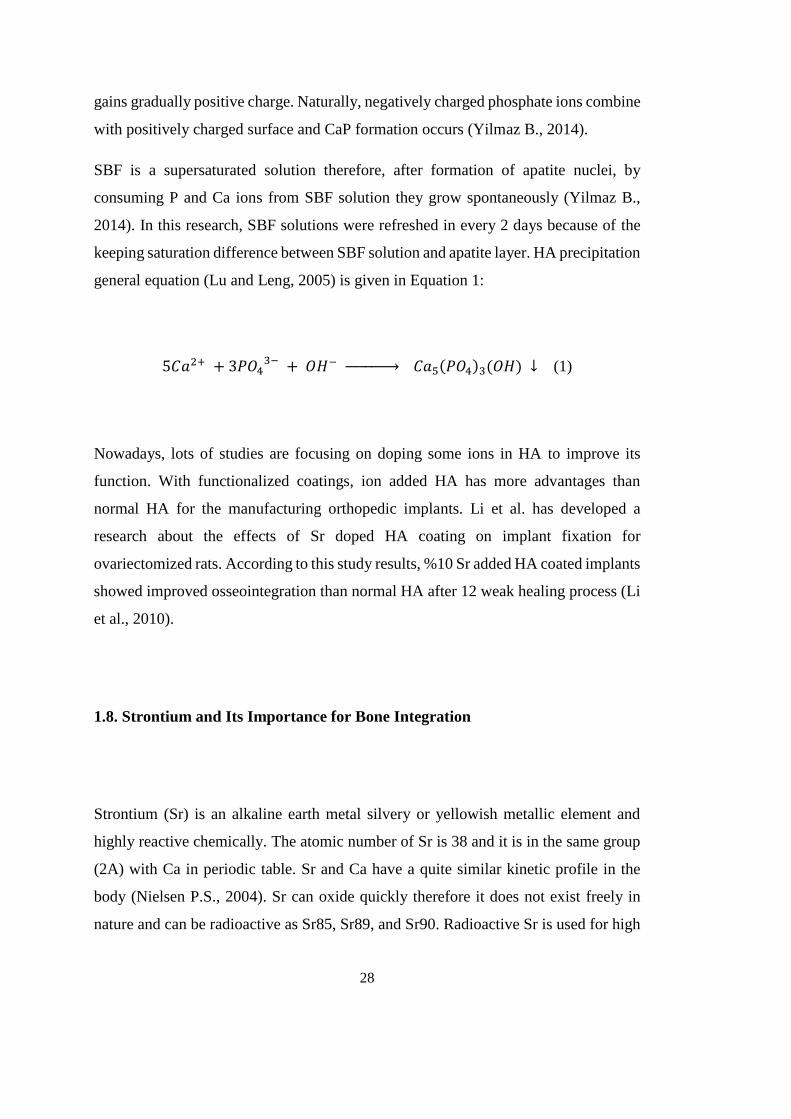
general equation (Lu and Leng, 2005) is given in Equation 1:
5𝐶𝑎2+ + 3𝑃𝑂43− + 𝑂𝐻−
→ 𝐶𝑎5(𝑃𝑂4)3(𝑂𝐻) ↓ (1)
Nowadays, lots of studies are focusing on doping some ions in HA to improve its
function. With functionalized coatings, ion added HA has more advantages than
normal HA for the manufacturing orthopedic implants. Li et al. has developed a
research about the effects of Sr doped HA coating on implant fixation for
ovariectomized rats. According to this study results, %10 Sr added HA coated implants
showed improved osseointegration than normal HA after 12 weak healing process (Li
et al., 2010).
1.8. Strontium and Its Importance for Bone Integration
Strontium (Sr) is an alkaline earth metal silvery or yellowish metallic element and
highly reactive chemically. The atomic number of Sr is 38 and it is in the same group
(2A) with Ca in periodic table. Sr and Ca have a quite similar kinetic profile in the
body (Nielsen P.S., 2004). Sr can oxide quickly therefore it does not exist freely in
nature and can be radioactive as Sr85, Sr89, and Sr90. Radioactive Sr is used for high

29
bone formation in vivo, studying kinetics of Sr, and treatment of the pain of bone
(Nielsen P.S., 2004). Sr is present in vegetables and cereals. The mineral compounds
of Sr such as celestite (SrSO4) and strontianite (SrCO3) are found in soil and drinking
water.
Different forms of Sr are used as medicine. The drug strontium ranelate, was used to
treat bone growth, increase bone density, and lessen vertebral, peripheral, and hip
fractures (Meunier et al, 2004; Reginster et al., 2005). Women receiving the drug
showed a 12.7% increase in bone density. Women receiving a placebo had a 1.6%
decrease. Half the increase in bone density (measured by X-ray densitometry) is
attributed to the higher atomic weight of Sr compared with Ca, whereas the other half
had a true increase in bone mass. Strontium ranelate is registered as a prescription drug
in Europe and many countries worldwide.
A radioactive form of Sr may kill some cancer cells. Radioactive Sr-89 is given as
intravenous injection for prostate cancer and advanced bone cancer. Strontium
chloride hexahydrate is added to toothpaste to reduce pain in sensitive teeth. Taking
strontium ranelate such as strontium chloride by mouth for treating osteoporosis, there
is not much scientific information about safety. Sr is also used for preventing tooth
decay because researchers have noticed fewer dental caries in some population groups
who drink public water that contains relatively high levels of Sr. The absorption
efficiency of Sr is age-dependent as in the case of Ca. Sr is mostly concentrated in the
bones of human body (99.1%) and mainly in newly formed bone (Boidin et al., 1996).
The blood is another important location for Sr in the body. The other important
evacuation route is by the kidneys, and a secondary evacuation route is by the
intestines (Leeuwankamp et al., 1990). The renal clearance of Sr is three times higher
than that of Ca (Nielsen P.S., 2004).
The effect of Sr was studied on rodents which have a high bone formation rate. The
results from studies bone formation and bone resorption performed in rodents must be
explained with great care and perhaps only be considered preliminary (Aerssens et al.,
1998).
30
The content of Sr in bone and teeth of dogs was increased to 9 mg/g bone, when 3000
mg/kg/day strontium malonate was given orally (Raffalt A.C., 2008). The Ca content
was constant despite Sr administration. Farlay et al. studied on monkeys and found the
average Sr/Ca ratio in bone can be as high as 1:10 after oral strontium ranelate
administration for 13 weeks. Farlay et al. also showed that strontium is quickly cleared
from the bone after treatment. As a result of this observations, Sr is applied locally and
not orally (Farlay et al., 2005). Therefore, the pharmacokinetic aspects of greatest
interest are the therapeutic range of Sr concentration in bone, deposition of Sr in the
body, and the elimination of Sr. Sr is known to modify the bone balance towards
osteosynthesis. The capacity of Sr added to CaP to modify the expression of genes and
proteins involved in extracellular matrix synthesis by primary bone cells were
investigated by Braux et al (Braux et al., 2011). They first determined the most
effective concentration of Sr using human primary bone cells. Sol-gel biphasic calcium
phosphate (BCP) powders were then synthesized to obtain release of the optimal
concentration of Sr.
Human osteoblast cells are analyzed by their bioactivity and osteoblasts obtained from
explant cultures were cultured in the presence of sol-gel BCP, Sr-substituted BCP (5%
Sr-substituted BCP, corresponding to a release of 5×10⁻⁵M [Sr2+] under the culture
conditions (BCP (5%)) and medium containing strontium chloride (SrCl2). Viability,
proliferation, cell morphology, protein production and protein activity were studied.
They showed that 5×10⁻⁵M SrCl2 and BCP (5%) increased the expression of type I
collagen and SERPINH1 mRNA and reduced the production of matrix
metalloproteinases (MMP-1 and MMP-2) without modifying the levels of the tissue
inhibitors of MMPs (TIMPs). As a result, they demonstrated that Sr has a positive
effect on bone formation. The Sr is detected incorporated into HA instead of Ca at
maximum Sr/Ca ratio of 1:10 (Dahl S.G., 2001).
In old bone, Sr is consolidate by ion exchange on the bone surface and during bone
formation by ion installing. This phenomena does not have harmful effect on bone
mineralization as long as Ca inception is appropriate (Farlay et al., 2005). The

31
hypomineralization caused by Sr in rats and also describe the level of bone formation
(Grynpas and Marie, 1990; Grynpas et al., 1996). They also studied bone formation of
rats feed a normal Ca-containing diet. Then the result was concluded that the bone
formation was grown by a relative low Sr dosage without causing hypomineralization.
Titanium implants have a moderately rough, sand-blasted and acid-etched (SBAE)
surface coating of the surface with bioactive components that support bone healing
appears a promising way of creating such a surface. Recently the focus of researches
in the field of implants is aimed at creating a bioactive surface that may assist patients
who cannot be treated with implants today. Several biochemical surface modifications
are shown promising results in supporting bone healing such as peptides, extracellular
matrix proteins, HA, CaP, and fluorine (Morra M., 2006; Petzold et al., 2012).
Several studies have shown the great effect of Sr on bone healing (Meunier et al, 2004;
Reginster et al., 2005) A recently published review article by Marie et al. summarized
how Sr affects bone resorption and bone formation by activating preosteoblast,
replication as well as osteoblast differentiation and survival (Marie et al., 2011). Frank,
2011 showed that the cathodic polarization could be used for coating implant surfaces
of grade IV titanium and titanium-zirconium alloy with a rough, hydrogen rich sand-
blasted and acid-etched surface with an immobilized surface layer of Sr. They
observed a possible useful implication of fluorine on the amount of Sr that can be
coated to a surface (Frank J. M., 2011).

32
1.9. Aim of the Study
Ti6Al4V (Grade 5) is a well-known biocompatible hard tissue implant material and
suitable substrate material for CaP coatings which is used for improving
osseointegration. Especially in last decade Sr is also a famous element for its positive
effects on bone bonding ability.
The objective of the present thesis was to develop a research about biomimetic
process for producing Sr doped CaP coatings on titanium alloy Ti6Al4V and to
investigate biological response towards these coatings. For this purpose, pre-treated Ti
alloy substrates were coated in Sr added 2 x SBF solutions, which contain different
molarities of Sr content and normal 2 x SBF solution. Different Sr concentration was
used in 2 x SBF solution in order to evaluate the effect of Sr concentration on structural
and biological properties of CaP coatings. As a result of this coating process, pure CaP
coated materials and strontium added CaP coated materials were expected to be
formed. Aim of this study is to evaluate these coated materials by their structural
properties with the aid of SEM, EDS, XRD, ICP-MS, FTIR and Raman Spectroscopy
and using bone cells to evaluate their biological response. This study aspire to reveal
the scientific difference between Sr added CaP coatings and pure CaP coatings by their
structure and cellular response.
33
CHAPTER 2
MATERIALS AND METHODS
As mentioned before the main issue of this thesis is for analyzing influence of Sr doped
CaP salts decomposition on Ti alloy implants in osseointegration. In this section the
experimental work and analyzing methods are explained in details.
2.1. Experimental Materials
Chemicals and equipments which are used for the experiments are given in details.
2.1.1. Equipments
Some ordinary equipments such as beakers, weighing bottles, etc. are not listed in here.

34
2.1.1.1. Pretreatment Part
SiC paper (400P, brand: Karbosan), horizontal wet sanding machine (brand: Metaserv
2000 Grinder), magnetic stirrer with probe (brand: Schott, made in Germany), furnace
(brand: Protherm furnaces, Alser Teknik) were used for pretreatment procedure.
2.1.1.2. Simulated Body Fluid Part
For preparing SBF solutions, autoclave machine (brand: ALP CL40M), water distiller
machine (brand: Elix 5UV Milipore), analytical balance (brand: Precisa xb 220a), pH
meter (brand: Thermo Onion 3 Star), water bath (brand: Nüve Bath NB 5), vacuum
drying oven (brand: Nüve) were used.
2.1.2. Chemicals
Ti-alloy (Grade 5) pieces used as substrate and they are cleaned with ethanol - water
solution and acetone. In alkali treatment NaOH – water solution is used. For making
SBF, a number of chemicals are used which are given below.
2.1.2.1. Simulated Body Fluid Part
In Table 7, SBF preparation chemicals are given with their brand names and catalog
numbers.
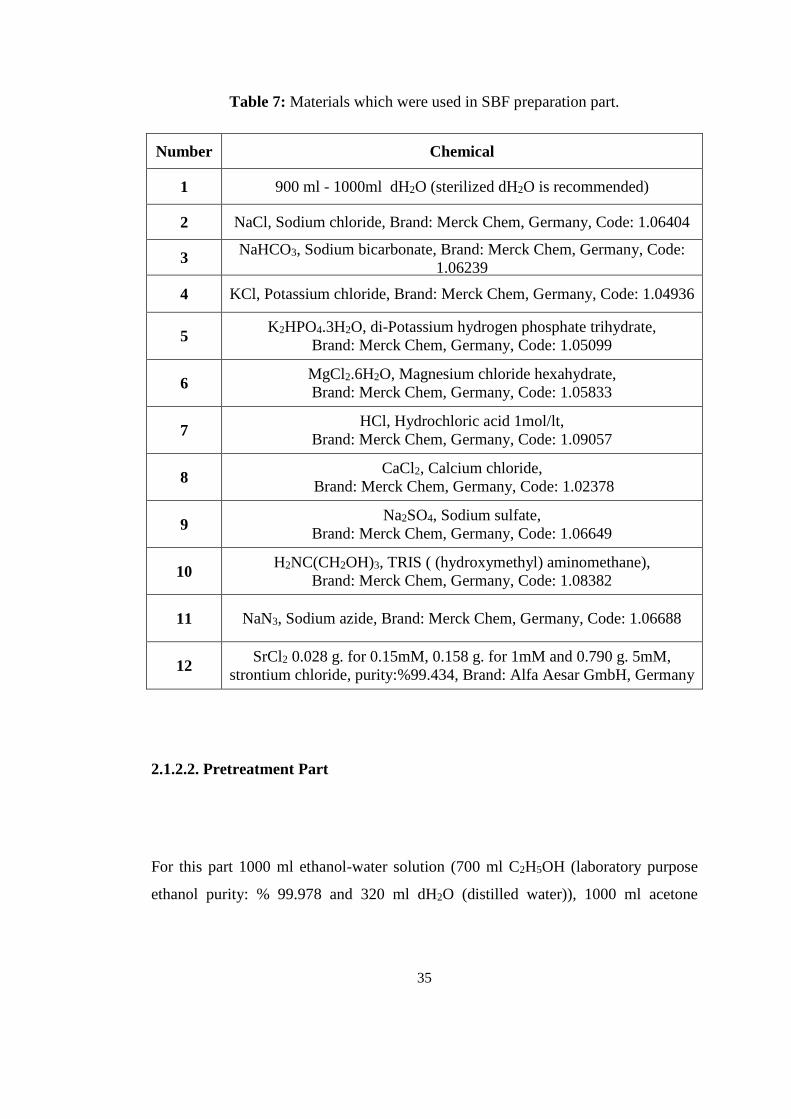
35
Table 7: Materials which were used in SBF preparation part.
Number Chemical
1 900 ml - 1000ml dH2O (sterilized dH2O is recommended)
2 NaCl, Sodium chloride, Brand: Merck Chem, Germany, Code: 1.06404
3 NaHCO3, Sodium bicarbonate, Brand: Merck Chem, Germany, Code:
1.06239
4 KCl, Potassium chloride, Brand: Merck Chem, Germany, Code: 1.04936
5 K2HPO4.3H2O, di-Potassium hydrogen phosphate trihydrate,
Brand: Merck Chem, Germany, Code: 1.05099
6 MgCl2.6H2O, Magnesium chloride hexahydrate,
Brand: Merck Chem, Germany, Code: 1.05833
7 HCl, Hydrochloric acid 1mol/lt,
Brand: Merck Chem, Germany, Code: 1.09057
8 CaCl2, Calcium chloride,
Brand: Merck Chem, Germany, Code: 1.02378
9 Na2SO4, Sodium sulfate,
Brand: Merck Chem, Germany, Code: 1.06649
10 H2NC(CH2OH)3, TRIS ( (hydroxymethyl) aminomethane),
Brand: Merck Chem, Germany, Code: 1.08382
11 NaN3, Sodium azide, Brand: Merck Chem, Germany, Code: 1.06688
12 SrCl2 0.028 g. for 0.15mM, 0.158 g. for 1mM and 0.790 g. 5mM,
strontium chloride, purity:%99.434, Brand: Alfa Aesar GmbH, Germany
2.1.2.2. Pretreatment Part
For this part 1000 ml ethanol-water solution (700 ml C2H5OH (laboratory purpose
ethanol purity: % 99.978 and 320 ml dH2O (distilled water)), 1000 ml acetone
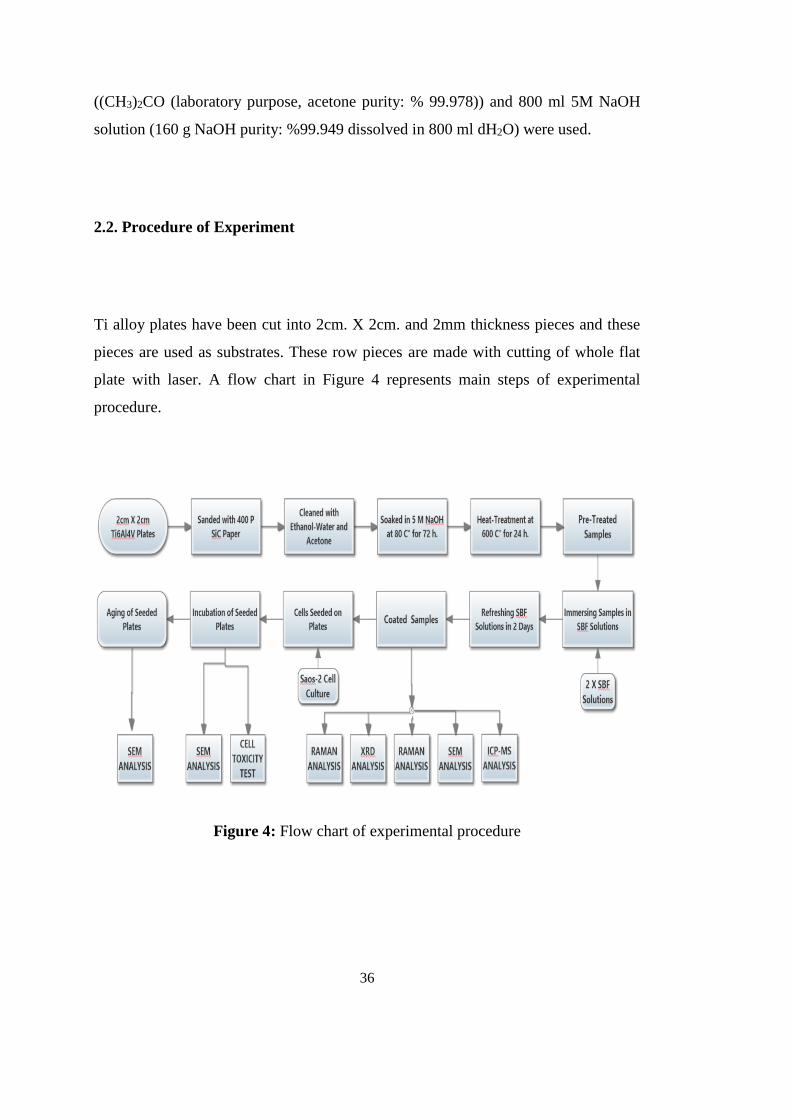
36
((CH3)2CO (laboratory purpose, acetone purity: % 99.978)) and 800 ml 5M NaOH
solution (160 g NaOH purity: %99.949 dissolved in 800 ml dH2O) were used.
2.2. Procedure of Experiment
Ti alloy plates have been cut into 2cm. X 2cm. and 2mm thickness pieces and these
pieces are used as substrates. These row pieces are made with cutting of whole flat
plate with laser. A flow chart in Figure 4 represents main steps of experimental
procedure.
Figure 4: Flow chart of experimental procedure
37
2.2.1. Sanding and Cleaning Treatment of Ti6Al4V Substrates
Usage of laser leads to formation of skid marks on titanium pieces. In order to remove
these skid marks and to have rough surface, sanding method is used. 400 P sanding
SiC paper is mainly used in order to avoid large pits and forming heterogeneous
surface in the matter of roughness. To illustrate, when sanding was made on substrate
surface with 1000 P sanding SiC paper, almost no effect was observed. Sanding
treatment is performed by horizontal wet sending machine under 360 RPM. After
sanding treatment, Ti substrate pieces were washed with distilled water until all
particles which are formed with sanding were removed. For achieving better purity,
“ultrasonic cleaning with ethanol-water mix (% 70 volume percent ethanol and % 30
volume percent water) in ultrasonic bath for 15 min and then acetone for 15 min were
applied. After cleaning with these solvents, pieces were dried with sterilized oven for
another 15 minutes.
2.2.2. Alkali (NaOH) and Heat Treatment
Alkali-heat treatment method for Ti and Ti-alloys to improve their surface bioactivity
was useful (Kim et al., 1996; Kokubo et al., 1996). In alkali-heat treatment TiO2
surface layer is partially dissolved by hydroxyl groups of 5M NaOH solution. Then,
titanium hydration occurs and on the surface layer negatively charged sodium titanate
hydrogel is formed. With heat treatment condensed, more stable layer is achieved
(Yilmaz B., 2014)
For this purpose, at 80 C° cleaned Grade 5 pieces are exposed to 5 M NAOH solution
for 24 hours. After 24 hours, specimens were cleaned with distilled water and then

38
dried with sterilized oven. After alkali treatment, samples were heat-treated at 600°C
for 1 h in a high temperature heater. It is said above and left to cool in the furnace
overnight. It was avoided to exceed 600°C for heat treatment, because temperatures
higher than 600°C may lead to decrease in Na+ ion release and decrease in TiOH
formation. After keeping alkali treated Ti6Al4V plates at 600°C for 1 hour, plates
were left to cool for overnight because rapid cooling may lead to form micro
cracks. After pre-treatments, Ti6AL4V pieces were sealed with paraffin film into
airtight containers to avoid from any kind of contamination.
2.2.3. Pure, 0.15mM, 1mM and 5mM Sr Added 2.0 × SBF Preparation
CaP precipitation can be formed by biomimetic technique. Precipitation formed in
biocompatible aqueous medium which is kept at the body temperature of 37° C and at
the pH of 7.4. In order to prepare SBF given by Kokubo et al. (Kokubo and Takadama,
2006) was followed, layout all SBF solution was preferred as the starting point of this
research and the method. Precipitation may occur because SBF is super saturated. For
this reason, the solution was color less and transparent at any time. There wasn’t any
precipitate at the bottom or side surfaces of the beakers used (Yilmaz B., 2014).
The reagents are dissolved in 700 ml of ion-exchanged distilled and sterilized water
for the preparation of 1000 ml of SBF solution. SBF was protected at 36.5±1.5°C, by
following the order from the adding first reagent constant stirring
Each bottle was washed with several drop ion-exchanged distilled water in the
solution. The amounts of the solution was completed to 1000 ml with ion-exchanged
distilled water at 36.5±1.5°C after the first eight chemicals were dissolved (Yilmaz B.,
2014). After adding 8th reagent, before adding TRIS (reagent 9th) pH of the solution
was checked. The pH of the solution must be between 2.0 - 1.0 before adding TRIS.

39
With temperature level between 35-38 °C (36.5±0.5°C is more preferred), TRIS was
dissolved slowly with great attention for pH change. On the other hand, some
precipitation may occur and transparency of solution may be lost. SBF solution must
be clear and colorless while preparing. When pH becomes 7.30±0.05, temperature
should be set at 36.5±0.5°C and dissolving TRIS must be gradual. TRIS was added
until pH was set to 7.45 and then, 1M HCl was added by drilling in order to lower pH
to 7.42±0.01. A great care must be given for the pH not to decrease below 7.40. When
pH was set to 7.42±0.01, remaining TRIS was dissolved again gradually until the pH
risen to 7.45±0.01. With keeping the pH in range of 7.42 - 7.45, TRIS and 1M HCl
were added alternately. Finally, pH was set to 7.40 at 36.5°C by adding 1M HCl by
dropping (Yilmaz B., 2014). The needed amounts of reagents for preparing 1 x SBF
(normal SBF) are given in Table 8.
Table 8: Order, amounts, weighing containers, purities and formula weights of
reagents for preparing 1000 ml of normal SBF (Yilmaz B., 2014).
Order Reagent Amount Purity (%)
1 NaCl 8.035 g 99.5
2 NaHCO3 0.355 g 99.5
3 KCl 0.225 g 99.5
4 K2HPO4.3H2O 0.231 g 99.0
5 MgCl2.6H2O 0.311 g 98.0
6 1M HCl 39 ml 98.0
7 CaCl2 0.292 g 95.0
8 Na2SO4 0.072 g 99.0
9 TRIS 6.118 g 99.0
10 1 M HCl 0–5 ml

40
Biomimetic coating method is very slow and after 3 weeks there were almost no
coating on samples. For this reason, in order to shorten coating time, 2 x SBF was used
in this study. 2 x SBF has 2 times ion concentration of normal SBF. In addition, in this
study, the effect of Sr doping in CaP structure for coating via biomimetic method was
investigated. Therefore, SrCl2 was added while 2 x SBF was preparing. In order to
observe the effect of difference in molar concentration, strontium ion was added in
three different molarity. 0.15mM, 1mM and 5mM strontium ions were added into the
solution. SrCl2 was added in the solution after adding 3rd reagent (KCl) and before
adding 4th reagent (K2HPO4.3H2O). In Table 9, ion concentration of 0.15mM, 1mM
and 5mM Sr added 2 x SBF and normal blood ion concentration are given.
Table 9: Ionic concentration of blood plasma and Strontium added 2 x SBF.
Ions
(mM) Na+ K+ Mg2+ Ca2+ Cl− HPO4
2− SO42− HCO3− Sr2+
5 mM
Sr -
2×SBF
283.0 9.9 3.0 5.0 249.0 2.0 1.0 54 5.0
1 mM
Sr -
2×SBF
283.0 9.9 3.0 5.0 249.0 2.0 1.0 54 1.0
0.15
mM
Sr -
2×SBF
283.0 9.9 3.0 5.0 249.0 2.0 1.0 54 0.15
Blood 142.0 5.0 1.5 2.5 103.0 1.0 0.5 27.0 -
41
2.2.4. Biomimetic CaP Coating in Pure and Sr added 2.0 × SBF
After preparing pure, 0.15mM, 1mM and 5mM Sr added 2.0×SBF solutions, alkali-
heat treated Ti6Al4V plates were placed in different bottles and these solutions poured
on the plates and kept in a shaking water bath (Nüve NB 5) at 37°C for apatite
deposition. 50 ml SBF solution was used for per 1 cm2 of plate. New solutions were
prepared and in every two days, solutions were refreshed. While changing solutions,
bottles were washed carefully to get rid of if any precipitation was formed. Plastic and
unscratched bottles were used for avoiding unwanted precipitation. The samples were
taken at 3rd, 6th, 9th, 14th and 20th days for analyzing. Taken samples were dried in a
vacuum drying oven (Nüve).
2.2.5. Sterilization of Coated Implants
Plates should be sterilized for better analyzing of cell culture tests. In order to inhibit
bacterial growth, 1.5 g/l sodium azide (NaN3) can be added into the SBF solutions
before immersing pre-treated Ti6Al4V plates (Pittrof et al., 2011). However, putting
NaN3 into SBF solutions, alters the ionic concentrations of solutions and it is hard to
maintain standard 2.0×SBF or Sr added 2.0×SBF ionic concentration. For this reason,
NaN3 was not used in this study. For inhibiting bacterial growth, autoclaved distilled
water was used for preparing SBF solutions. For achieving sterilization, coated
samples were placed in a furnace (Alser Teknik, Protherm) and kept at 200°C for 3
hours. Samples were left to cool tardily to avoid crack formation.
42
2.3. Surface Analysis with SEM
Morphology of the coated plate sample surfaces was observed with the aid of field
emission scanning electron microscope (FE-SEM, FEI Quanta 400F). For FE-SEM
analysis, a conductive surface layer is needed to prevent charging of a specimen with
an electron beam in conventional mode (high vacuum, high voltage). CaP coating layer
is not conductive and for that reason, Au/Pd sputter deposition on samples were
needed. 3nm thickness of Au/Pd coating was formed on both biomimetically coated
Ti6Al4V samples. Sputter deposition was not needed for uncoated Ti6Al4V control
group samples. Different magnifications such as 20X, 500X, 1000X, 2000X, 5000X,
100000X was used for observation.
2.4. Structure Analysis with Spectroscopy Methods
With the aid of same device which was used for FE-SEM analysis, the composition of
elements was analyzed by using energy dispersive X-ray spectroscopy (EDS). EDS
was used for determination CaP composition of coatings. FEI Quanta 400F, USA FE-
SEM device was used for SEM and EDS analyses.
Structural pattern of coatings was analyzed by XRD. An X-ray diffractometer (Rigaku
Ultima IV, Japan) was used for X-ray diffraction (XRD) analysis with Cu-Kα radiation
at 40 kV and 30mA. Coated Ti6Al4V samples were analyzed with thin film analyzing
protocol and 0.5 degrees of sweep angle used for grazing. As blank and control sample,
a pre-treated uncoated Ti6Al4V plate (only substrate) was introduced and its data
pattern was subtracted from coated sample XRD data. With using International Centre
for Diffraction Data (ICDD) pdf database, phases in coated sample data were analyzed.

43
System which is formed by a spectrometer and a microscope (Bruker IFS 66/S and
Hyperion 1000, Germany) was used for Fourier transform infrared spectroscopy
(FTIR) analysis. For FTIR analysis mid-infrared (MIR) range (3000-400cm-1) was
used. Baseline correction was applied for results.
The spectrometry device (Renishaw inVia, UK) was used for Raman spectroscopy
analyzing which is usually more sensitive then FTIR analysis. 532 nm set argon laser
was used and the range was selected between 3000 to 100 cm-1 for monitoring.
For further chemical analysis, inductively coupled plasma mass spectroscopy (ICP-
MS) method was also used for characterization. A mass spectroscopy device (Thermo
electron X7, Thermo Fisher Scientific, USA) was used for ICP-MS analysis. Sr, Ca
and P elements were investigated in mass spectroscopy. Because of pure samples were
not coated by Sr added solution, they were not analyzed. Only 18 day immersed
0.15mM Sr added and 18 day immersed 1mM Sr added samples were analyzed. Other
Sr added samples did not have enough amount of coating material on substrates for
ICP-MS analyzing. Coating materials were scraped on Ti alloy plates by a spatula and
powder formed coating material was dissolved in 0.1M HCl solution. SEM, EDS,
XRD, ICP-MS, FTIR and Raman Spectroscopy analyses were performed in Middle
East Technical University Central Laboratory.
2.5. Cell Culture Tests for in Vitro Analysis
Saos-2 (HTB-85, ATCC, USA), human bone cancerous cells were used for cell culture
analysis. Saos-2 (osteosarcoma) cells were collected from frozen cryovials. These cells
were stored in cryovials which were kept in liquid nitrogen.
The thawing procedure is very stressful to frozen cells. Adequate technique and rapidly
working establish that a high proportion of the cells survive the procedure. According

44
to the thawing protocol, frozen vials thawed by tenderly soaked in water bath at 37 °C
for one minute. After thawing, cells were diluted by 10 ml growth medium. To form
complete growth medium, pre-warmed DMEM (Dulbecco’s Modified Eagle Medium)
with stable glutamine, catalog no: FG0445 (Biochrom AG, Germany) was used with
10% FBS (Biochrom AG, Germany) and 0.5% penicillin solution (Biochrom AG,
Germany). The medium with cells transferred to a T-75 cell culture flask. T-75 flask
kept at 37 °C in a humidified incubator with 5% CO2. The growth medium was
changed 3 times in a week. Osteosarcoma cells at T-75 flask was observed under light
microscope to determine cell attachment and confluency. In Figure 5, one of observed
images of sarcoma cells which were seeded at T-75 flask under light microscope is
shown. When confluency reached 90%, cells were transferred from METU laboratory
(Ankara, Turkey) to Selcuk University Advanced Technologies laboratory (Konya,
Turkey) in order to subculture and seeding on plates for performing tests. For
transferring cell culture T-75 flask was filled with growth medium up to the brim of
flask. A great attention was given for preventing the wetting the lid of flask. The lid
was kept dry and flask kept away from vibration while transporting.
Figure 5: Light microscope image of osteosarcoma cells in T-75 flask.

45
For detaching of cells from T-75 flask 0.25% trypsin/EDTA (Biochrom AG, Germany)
solution was used. After detaching of cells growth medium was added and centrifuged
at 2000 rpm for 5 minutes. Cells were seeded to T-75 flasks with 1/3 subcultivation
ratio. Flasks were kept in humidified incubator at 37 °C with 5% CO2. The growth
medium was changed 3 times in a week. Cell confluency and attachment were
observed with light microscope. Osteosarcoma cells were thawed and seeded on T75
flask in Middle East Technical University Engineering Science Biomaterial
Laboratory then cells were transferred to the Selcuk University Advanced Technology
Research and Application Center Biotechnology Laboratory and all cell culture tests
were performed there.
2.5.1. SEM Analyzing for Osteosarcoma Seeded Coated Plates
In order to analyze bone cell response against coated Ti6Al4V plates, SEM studies and
MTT cell toxicity analysis were used. For examining the attachment and morphology
of seeded osteosarcoma cells on UV sterilized pure, 0.15mM Sr added and 1mM Sr
added CaP coatings SEM analyzing were performed. Both aged and non-aged coated
plates were examined with SEM imaging. At first, for this analysis Ti6Al4V plates
washed with 70% ethanol-30% water mix and then washed with sterilized PBS. After
washing, each side of plates sterilized with UV radiation for 15 minutes.When cell
confluency reached 90%, the osteosarcoma cells were detached with using 0.25%
trypsin/EDTA solution. Detached cells were seeded on each coated plate
equinumerously. About 100000 osteosarcoma cells were seeded for a plate. Sample
plates were placed in 6 well-plate and Growth medium includes DMEM FG 0445,
10% FBS and 0.5% penicillin was added on plates. These well-plate were placed in an
incubator for 7 days. At the end of the seventh day, the medium in the wells aspired
and plates were washed with sterilized PBS solution. After washing, 4%
paraformaldehyde solution was used for cell morphology preservation by fixation.
Then, plates were washed again with sterilized PBS solution. The plates were dried in

46
order to prepare for SEM analyzing. CaP is not a conducting material and for that
reason sputter coating was performed on sample plates with gold-platinum alloy prior
to SEM studies. For SEM imaging, operating acceleration voltage was 15kV.
Osteosarcoma cells seeded, aged and non-aged samples which were soaked in pure
2.0×SBF for 9 days, pure 2.0×SBF for 18 days, 0.15mM Sr added 2.0×SBF for 9 days,
0.15mM Sr added 2.0×SBF for 18 days, 1mM Sr added 2.0×SBF for 9 days, 1mM
2.0×SBF for 18 days and also as control non-coated samples were investigated by SEM
imaging.
2.5.1.1. Aging of Coated Plates
For investigating the durability of the coatings in the culture medium aging study was
performed. Samples which were coated in pure 2.0×SBF for 9 days, pure 2.0×SBF for
18 days, 0.15mM Sr added 2.0×SBF for 9 days, 0.15mM Sr added 2.0×SBF for 18
days, 1mM Sr added 2.0×SBF for 9 days, 1mM 2.0×SBF for 18 days placed in a 6
well-plate and culture growth medium was added. The 6 well-plate was sealed with
paraffin film and placed in a shaker with 100 rpm shaking for 5 days.Like non-aged
sample coatings, 100000 osteosarcoma cells were seeded on aged samples. Same cell
seeding procedure was executed in aged sample coatings. After seeding, plates were
incubated for 7 days. When incubation is completed, same practice for washing with
sterilized PBS, fixation with 4% paraformaldehyde solution and drying performed for
SEM imaging.
2.5.2. MTT Cellular Toxicity Analysis
In this study, effect of coatings on cell viability was measured with MTT cytotoxicity
assay test. On the other hand, MTT cytotoxicity test was also applied to evaluate cell
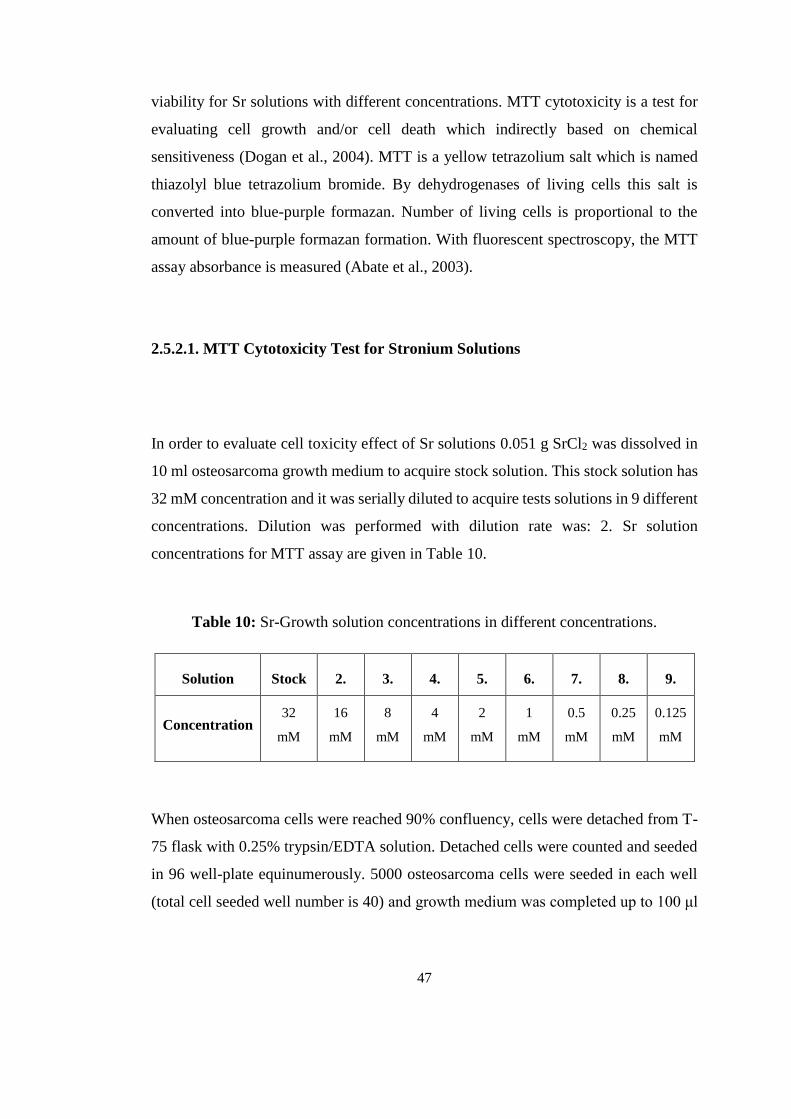
47
viability for Sr solutions with different concentrations. MTT cytotoxicity is a test for
evaluating cell growth and/or cell death which indirectly based on chemical
sensitiveness (Dogan et al., 2004). MTT is a yellow tetrazolium salt which is named
thiazolyl blue tetrazolium bromide. By dehydrogenases of living cells this salt is
converted into blue-purple formazan. Number of living cells is proportional to the
amount of blue-purple formazan formation. With fluorescent spectroscopy, the MTT
assay absorbance is measured (Abate et al., 2003).
2.5.2.1. MTT Cytotoxicity Test for Stronium Solutions
In order to evaluate cell toxicity effect of Sr solutions 0.051 g SrCl2 was dissolved in
10 ml osteosarcoma growth medium to acquire stock solution. This stock solution has
32 mM concentration and it was serially diluted to acquire tests solutions in 9 different
concentrations. Dilution was performed with dilution rate was: 2. Sr solution
concentrations for MTT assay are given in Table 10.
Table 10: Sr-Growth solution concentrations in different concentrations.
Solution Stock 2. 3. 4. 5. 6. 7. 8. 9.
Concentration 32
mM
16
mM
8
mM
4
mM
2
mM
1
mM
0.5
mM
0.25
mM
0.125
mM
When osteosarcoma cells were reached 90% confluency, cells were detached from T-
75 flask with 0.25% trypsin/EDTA solution. Detached cells were counted and seeded
in 96 well-plate equinumerously. 5000 osteosarcoma cells were seeded in each well
(total cell seeded well number is 40) and growth medium was completed up to 100 μl

48
solution. Osteosarcoma cells were allowed to attach to well surfaces for 24 hours in
humidified incubator at 37 °C with 5% CO2. After this time period, medium was
removed and 100 μl of Sr solution was added in each well. In 96 well-plate 9 different
concentrated Sr solutions added with the repeating time 6. Figure 6 represents the
configuration of Sr solutions in 96 well-plate for cell cytotoxicity test. As it can be
seen in Figure 6, 1st row was filled only sterilized and deionized water for vaporization
balance, from 2nd to the 5th row (2nd and 5th included) cells were seeded in wells except
surrounding wells (they were only used for vaporization balance). 6th and 7th row were
filled with only medium and Sr solutions, cell were not seeded in these wells. 8th row
was also used for vaporization balance. After adding Sr solutions the 96 well-plate was
placed once more in humidified incubator at 37 °C with 5% CO2 for 48 hours. MTT
stock solution was made by dissolution of 5mg MTT salt (AppliChem, Germany) in
1ml DMEM medium. Working concentration of MTT solution was 10 times diluted
than stock solution. MTT solution in working concentration was prepared by dilution
of stock solution with DMEM medium. After incubation, 10 μl MTT solution in
working concentration was added in each well. When MTT adding step was
completed, incubation was applied for 4 hours at 37 °C with 5% CO2. Finally, after
incubation MTT solution was removed and 100 μl of DMSO was added to each well
and shaken for 20 min at 50 rpm. Absorbance were read at 570 nm with fluorescent
spectroscopy.
Figure 6: Configuration of Sr solutions in 96 well-plate.

49
2.5.2.2. MTT Cytotoxicity Test for Coated Plates
The main purpose of using MTT tests was to evaluate cell viability on coated Ti6Al4V
plates. In order to accomplish this goal, at first, sample plates were cleaned with 70%
ethanol- 30% water mix and sterilized PBS. After cleaning, UV sterilization was
performed on each side of plates for 15 min. When sterilization was completed, plates
were placed in 6 well-plate. Samples which were coated in pure 2.0×SBF for 9 days,
pure 2.0×SBF for 18 days, 0.15mM Sr added 2.0×SBF for 9 days, 0.15mM Sr added
2.0×SBF for 18 days, 1mM Sr added 2.0×SBF for 9 days, 1mM 2.0×SBF for 18 days
and non-coated samples were analyzed with this test. Test configurations of 6 well-
plate is shown in Figure 7.
Figure 7: Configurations of sample plates in 6 well-plate for MTT assay.
Trypsinized cells were seeded on sample Ti6Al4V plates which were placed in 6 well-
plate with a ratio of 100000 cells/plate and growth medium was completed up to 4ml
for each well. Then, well plates were placed in humidified incubator at 37°C with 5%
CO2 for 7 days. MTT stock solution and by dilution of stock solution with DMEM

50
medium MTT working solution were prepared. As stated before, MTT stock solution
has 5mg/ml concentration and MTT working solution has 0.5 mg/ml concentration.
When incubation was completed, medium was removed from wells. Sample plates
were placed on a new 6 well-plate in order to eliminate cells which attached to the
well-plate surface not coating surface. Then, 4ml of MTT working solution was added
in each well and placed in a humidified incubator at 37 °C with 5% CO2 for 4 hours.
After incubation MTT solution was removed. Then, 1 ml of DMSO was added in each
well and shaken for 20 min at 50 rpm. When shaking step completed, DMSO solution
was taken from each well of 6 well-plate and placed in 5 wells in 96 well-plate. In
other words, 1ml DMSO from each well of 6-well plates taken and placed in 5 different
wells (200 μl DMSO in each well) in a 96 well-plate. MTT assay configuration of
samples before absorbance reading in a 96 well-plate is shown in Figure 8.
Absorbances were read at 570 nm with fluorescent spectroscopy.
Figure 8: MTT assay configuration of sample plates in 96 well-plate.
51
CHAPTER 3
RESULTS AND DISCUSSION
To observe the effects of Sr concentration beside pure 2.0×SBF, 0.15mM Sr added
2.0×SBF, 1mM Sr added 2.0×SBF and 5mM Sr added 2.0×SBF were used as coating
solutions. At 3rd day of immersion, after taking samples, difference in the amount of
coatings between pure and 5mM Sr added solutions could be easily seen. In Figure 9,
an uncoated sample, in Figure 10, samples at 3rd day of immersion and in Figure 11,
samples at 6th day of immersion are shown. Difference in CaP coating amount can be
observed by looking. It was seen that, samples in pure solution had the highest amount
of coating and samples in 5mM solution had the lowest amount of coating at both 3rd
and 6th days of immersion. Coating thickness of sample plates was evaluated by a
magnetic induction coating thickness test device (Würth 071553781, Germany). For
pure samples, coating thickness measured as 190 μm - 160μm at 18th day of immersion.
For 0.15mM and 1mM Sr added samples, thickness of coating layers was measured as
170 μm - 150μm and 160 μm - 150μm respectively at 18th day of immersion.
According to the results, no significant thickness coating difference observed at 18th
day of soaking. This might be resulted from the formation of almost complete coating
on sample plates at 18th day.

52
Figure 9: An uncoated substrate plate. Only sanding treatment was applied.
Figure 10: Plates at 3rd day of immersion: (a) Coated plate in 5mM Sr added, (b)
Coated plate in 1mM Sr added, (c) Coated plates in 0.15mM Sr added, (d) Coated
plate in pure solution.
Figure 11: Plates at 6th day of immersion: (a) Coated plate in 5mM Sr added
solution, (b) Coated plate in 1mM Sr added solution, (c) Coated plate in 0.15mM Sr
added solution, (d) Coated plate in pure solution.
C
oa
te
d
pl
at
e
in
5
m
M
Sr
ad
de
d
so
lut
io
n
C
oa
te
d
pl
at
e
in
5
m
M
Sr
ad
de
d
so
lut
io
n
C
oa
te
d
pl
at
e
in
5
m
M
Sr
ad
de
d
so
lut
io
n
C
oa
te
d
pl
at
e
in
5
m
M
Sr
ad
de
d
so
lut
io
n

53
As immersion time increased, coating amount also increased. Samples which were
coated in pure solution, samples coated in 0.15mM Sr added solution and samples
coated in 1mM Sr added solution for 9, 14 and 18 days are seen in Figure 12, 13 and
14 respectively. It was seen that, samples at 18th day of immersion has the highest
amount of coating. Significant coating was not observed on Ti6Al4V samples in 5mM
Sr added solution at 6th day and soaking was terminated after 6 days of immersing. No
further analyses were performed with samples coated in 5mM Sr added solution.
Figure 12: Plates coated in pure solution: (a) Plate at 9th day of immersion, (b) Plate
at 14th day of immersion; (c) Plate at 18th day of immersion.
Figure 13: Plates coated 0.15mM Sr added solution: (a) Plate at 9th day of
immersion, (b) Plate at 14th day of immersion; (c) Plate at 18th day of immersion.

54
Figure 14: Plates coated 1mM Sr added solution: (a) Plate at 9rth day of immersion,
(b) Plate at 14th day of immersion; (c) Plate at 18th day of immersion.
3.1. SEM Results
Multidirectional scratches are seen in Figure 15 (a) and after alkali treatment with 5M
NaOH solution for 72 hours at 80ºC and heat treatment 1 hour at 600ºC formed micro-
porous structure can be seen in Figure 15 (b). With increasing immersing time, CaP
coating amount on Ti6Al4V plates also increases.
Figure 15: SEM images of Ti6Al4V plate surfaces sanded and alkali-heat treated:
Magnification (a) 500x and (b) 100.000x.
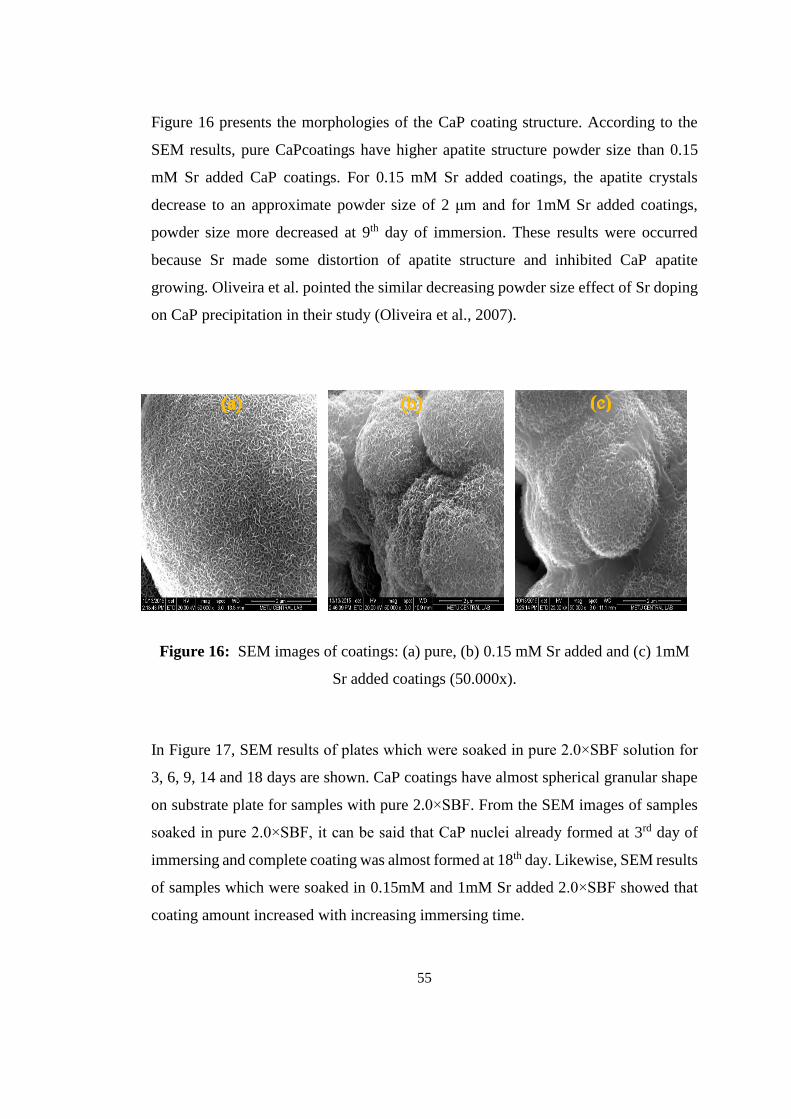
55
Figure 16 presents the morphologies of the CaP coating structure. According to the
SEM results, pure CaPcoatings have higher apatite structure powder size than 0.15
mM Sr added CaP coatings. For 0.15 mM Sr added coatings, the apatite crystals
decrease to an approximate powder size of 2 μm and for 1mM Sr added coatings,
powder size more decreased at 9th day of immersion. These results were occurred
because Sr made some distortion of apatite structure and inhibited CaP apatite
growing. Oliveira et al. pointed the similar decreasing powder size effect of Sr doping
on CaP precipitation in their study (Oliveira et al., 2007).
Figure 16: SEM images of coatings: (a) pure, (b) 0.15 mM Sr added and (c) 1mM
Sr added coatings (50.000x).
In Figure 17, SEM results of plates which were soaked in pure 2.0×SBF solution for
3, 6, 9, 14 and 18 days are shown. CaP coatings have almost spherical granular shape
on substrate plate for samples with pure 2.0×SBF. From the SEM images of samples
soaked in pure 2.0×SBF, it can be said that CaP nuclei already formed at 3rd day of
immersing and complete coating was almost formed at 18th day. Likewise, SEM results
of samples which were soaked in 0.15mM and 1mM Sr added 2.0×SBF showed that
coating amount increased with increasing immersing time.
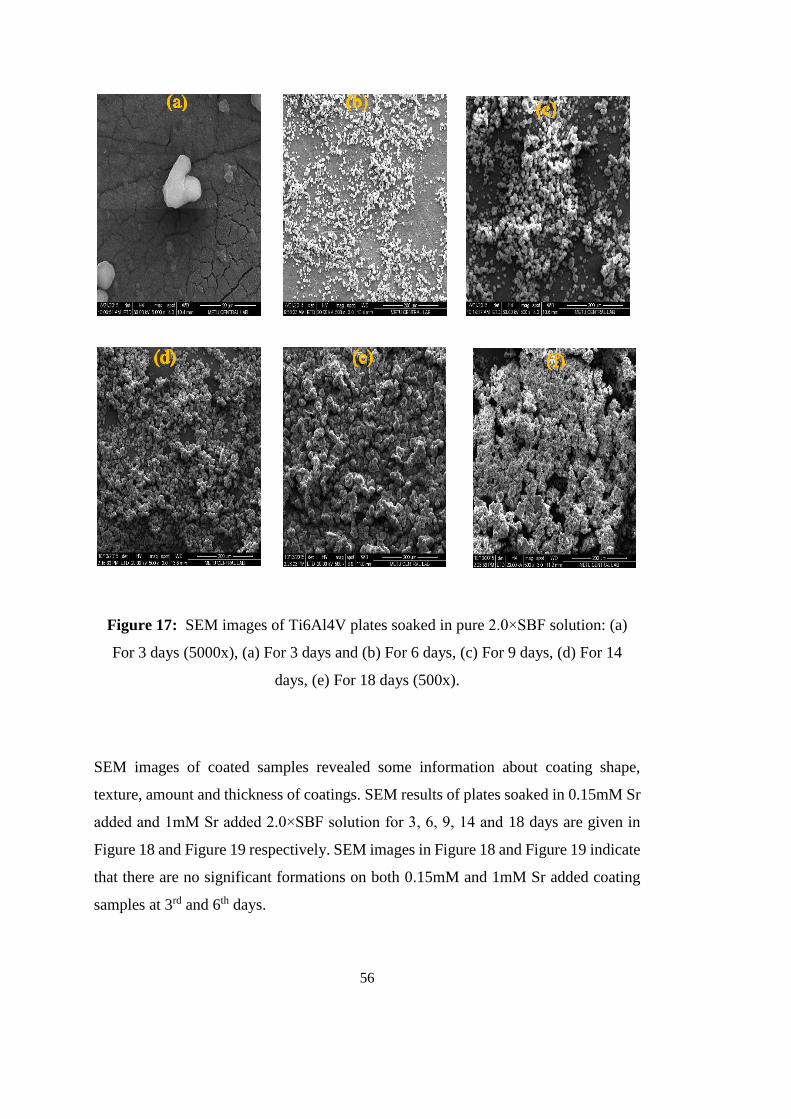
56
Figure 17: SEM images of Ti6Al4V plates soaked in pure 2.0×SBF solution: (a)
For 3 days (5000x), (a) For 3 days and (b) For 6 days, (c) For 9 days, (d) For 14
days, (e) For 18 days (500x).
SEM images of coated samples revealed some information about coating shape,
texture, amount and thickness of coatings. SEM results of plates soaked in 0.15mM Sr
added and 1mM Sr added 2.0×SBF solution for 3, 6, 9, 14 and 18 days are given in
Figure 18 and Figure 19 respectively. SEM images in Figure 18 and Figure 19 indicate
that there are no significant formations on both 0.15mM and 1mM Sr added coating
samples at 3rd and 6th days.
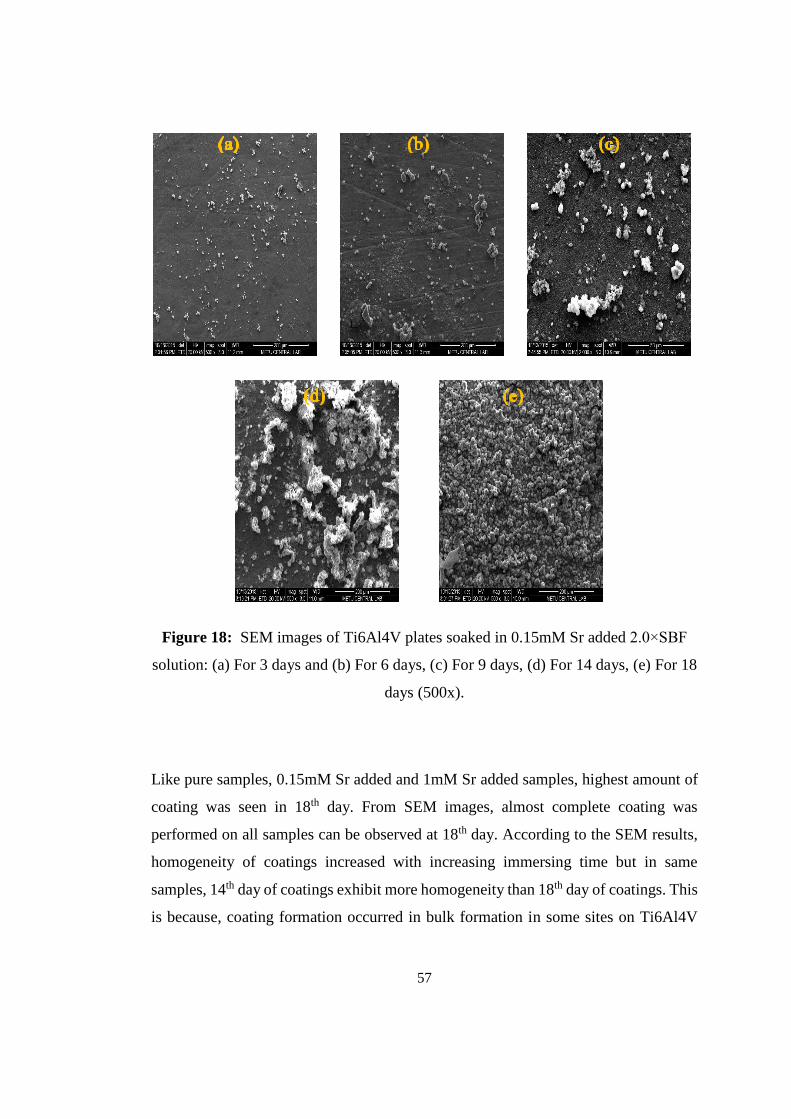
57
Figure 18: SEM images of Ti6Al4V plates soaked in 0.15mM Sr added 2.0×SBF
solution: (a) For 3 days and (b) For 6 days, (c) For 9 days, (d) For 14 days, (e) For 18
days (500x).
Like pure samples, 0.15mM Sr added and 1mM Sr added samples, highest amount of
coating was seen in 18th day. From SEM images, almost complete coating was
performed on all samples can be observed at 18th day. According to the SEM results,
homogeneity of coatings increased with increasing immersing time but in same
samples, 14th day of coatings exhibit more homogeneity than 18th day of coatings. This
is because, coating formation occurred in bulk formation in some sites on Ti6Al4V

58
plates. As stated before, no significant coating was observed on 5mM Sr added
samples at 3rd and 6th days and SEM images in Figure 20 confirm this.
Figure 19: SEM images of Ti6Al4V plates soaked in 1mM Sr added 2.0×SBF
solution: (a) For 3 days and (b) For 6 days, (c) For 9 days, (d) For 14 days, (e) For 18
days (500x).
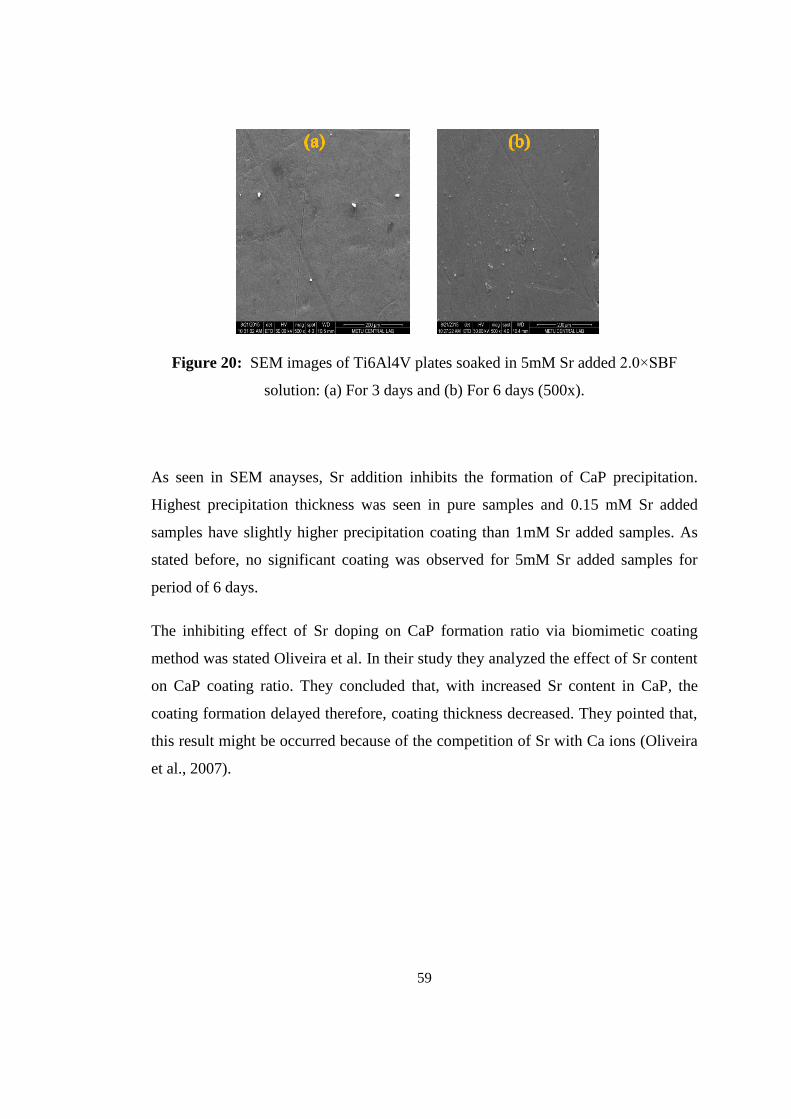
59
Figure 20: SEM images of Ti6Al4V plates soaked in 5mM Sr added 2.0×SBF
solution: (a) For 3 days and (b) For 6 days (500x).
As seen in SEM anayses, Sr addition inhibits the formation of CaP precipitation.
Highest precipitation thickness was seen in pure samples and 0.15 mM Sr added
samples have slightly higher precipitation coating than 1mM Sr added samples. As
stated before, no significant coating was observed for 5mM Sr added samples for
period of 6 days.
The inhibiting effect of Sr doping on CaP formation ratio via biomimetic coating
method was stated Oliveira et al. In their study they analyzed the effect of Sr content
on CaP coating ratio. They concluded that, with increased Sr content in CaP, the
coating formation delayed therefore, coating thickness decreased. They pointed that,
this result might be occurred because of the competition of Sr with Ca ions (Oliveira
et al., 2007).

60
3.2. EDS Results
With EDS analysis from SEM images, composition of elements in the coatings can be
investigated. In Figure 21, EDS results of samples which were soaked in pure 2.0×SBF
for 3, 6, 9, 14 and 18 days are shown. It can be seen that Ca and P element compositions
were increased with increasing immersion time. This result related with coating
amount which increased with time. Sodium element was observed on coating surface.
As a result of alkali treatment, sodium titanate formed and it may be the reason of the
sodium peak in EDS analysis. Also, undissolved sodium chloride may form the sodium
peak. Likewise, undissolved sodium chloride may form the chlorine peak (Yilmaz B.,
2014). EDS results of samples coated in 0.15mM Sr added 2.0×SBF for 3, 6, 9, 14
and 18 days are given in Figure 22.
Figure 21: EDS results of Ti6Al4V plates soaked in pure 2.0×SBF solution: (a) For
3 days, (b) For 6 days, (c) For 9 days, (d) For 14 days, (e) For 18 days.

61
Figure 22: EDS results of Ti6Al4V plates soaked in 0.15mM 2.0×SBF: (a) For 3
days, (b) For 6 days, (c) For 9 days, (d) For 14 days, (e) For 18 days.
With time, Na+ ions are released from sodium titanate layer and H3O+ ions are replaced
with sodium ions. As a result of this replacement, Ti-OH groups are formed and apatite
precipitation is formed (Wei et al., 2002). Also, Ti, V and Al element peaks which
represent substrate plate were decreased with increasing immersing time and this result
indicates the increasing coating thickness on substrate plate. In Figure 23, EDS results
of samples immersed in 1mM Sr added 2.0×SBF for 3, 6, 9, 14 and 18 days are shown.
Similar to the pure 2.0×SBF ones, samples which were immersed in 0.15mM and 1mM
Sr added 2.0×SBF have increasing coating amount with increasing immersing time. In
both cases, Ca and P ion concentration increased in time. Also, substrate element (Ti,
V, Al) peaks were decreased with increasing coating amount on substrate surface.
Similar to the SEM results, the high intensities of EDS peaks which represents

62
substrate material of 5mM Sr added samples indicate that, samples soaked in pure and
0.15mM Sr added 2.0×SBF have greater coating amount then samples immersed in
5mM Sr added 2.0×SBF. It was also concluded that, immersing time has great effect
on apatite deposition on substrate surface for all types of coatings.
Figure 23: EDS results of Ti6Al4V plates soaked in 1mM Sr added 2.0×SBF: (a) For
3 days, (b) For 6 days, (c) For 9 days, (d) For 14 days. (e) For 18 days.

63
Figure 24: EDS results of Ti6Al4V plates soaked in 5mM Sr added 2.0×SBF: (a)
For 3 days, (b) For 6 days.
From EDS analysis, Ca/P composition of coatings can be evaluated. Ca/P molar ratios
for samples soaked in pure 2.0×SBF are: 1.18 on 3rd day and 1.23 on 6th day, 1.22 on
9th day, 1.37 on 14th day, 1.63 on 18th day. Ca/P molar ratios for samples soaked in
0.15mM Sr added 2.0×SBF are: 1.2 on 3rd day and 1.22 on 6th day, 1.34 on 9th day,
1.50 on 14th day, 1.58 on 18th day. Ca/P molar ratios for samples soaked in 1mM Sr
added 2.0×SBF are: 1.30 on 9th day, 1.35 on 14th day, 1.58 on 18th day. For 1mM Sr
added samples, Ca/P ratio at 3rd and 6th days was not stated here because, Ca and P
elements was detected in very low values in EDS analysis for these days.
In all three cases, with increasing immersing time Ca/P ratio also increased. For pure
samples, Ca/P ratio is greater than 1mM Sr added and 0.15mM Sr added samples at
18th day of immersing. This may resulted from having Sr ion in Ca/P structure because,
if Ca ions were replaced with Sr ions, Ca/P ratio was decreased. Ca/P ratios of 0.15mM
and 1mM samples at18th day of immersing were evaluated more tenderly by ICP-MS
analysis. Samples soaked in 5mM Sr added 2.0×SBF solution do not have significant
coating and for this reason, Ca/P molar ratio was not evaluated. Theoretically it is
expected that with increasing immersing time, Ca/P molar ratio will increase up to
around 1.80 and stay constant at this value. Ca/P molar ratio of healthy human bone is
1.71 (Zhang and Cresswell, 2015) and 1.75 – 1.80 Ca/P molar ratio can be considered
as satisfactory (Yilmaz B., 2014).

64
3.3. ICP-MS Results
As stated before, ICP-MS study was performed for Sr containing coated samples.
However, for both 0.15mM Sr added and 1mM Sr added samples, only samples at 18th
day had enough amount of coating for ICP-MS analysis. For these samples,
approximately 5 mg coating material was obtained by scraping off with a spatula. For
other samples lesser amounts of coating material were obtained and these amounts
were not enough for ICP-MS analysis. ICP-MS results are given in Table 11. The
Ca/Sr, Ca/P and (Sr+Ca)/P atomic ratios were obtained with this analysis and these
results are given for 0.15mM Sr added and 1mM Sr added samples at 18th day of
immersing in Figure 25.
Table 11: Ca, P, Sr element weigh concentrations from ICP-MS analysis.
Element 0.15mM Sr Added
Sample 1mM Sr Added Sample
Ca (%) 24.5±0.3 27.2±0.2
P (%) 13.7±0.8 16.8±0.4
Sr (%) 2.32±0.01 4.96±0.06

65
Figure 25: ICP-MS results of Ti6Al4V plates immersed in 0.15mM and 1mM Sr
added 2.0×SBF for 18 days: (a) Ca/Sr, (b) Ca/P, (c) (Sr+Ca)/P atomic ratios.
According to the ICP-MS results, Sr successfully incorporated into CaP structure.
Ca/Sr ratio is higher for 0.15mM Sr added sample than 1mM Sr added sample. It
means, Sr content in CaP is higher for 1mM Sr added sample than 0.15mM Sr added
sample as expected. From results, it can be said that, higher Sr concentration while
preparing 2.0×SBF increases Sr doping in CaP coating. At least, this statement is valid
for the 2.0×SBF which contains up to 1mM Sr.
2.0×SBF solution contains around 5.7mM Ca ion and according to the ICP-MS results,
for 0.15mM Sr ion added solution Ca/Sr ratio is 23.5 and for 1mM Sr ion added
solution Ca/Sr 11.91. This results reveal that, Ca replacing by Sr ions was higher for
0.15mM Sr added solution with respect to the Sr and Ca ionic ratio in 2.0×SBF solution
than 1mM Sr added solution. Also, according to the ICP-MS results, both Ca/P and
(Sr+Ca)/P ratios for 0.15mM and 1mM Sr added samples were lower than theoretical
saturation ratio (around 1.80).

66
3.4. XRD Results
XRD analysis was used for crystallinity characterization of coating surfaces. With this
analysis crystal structures of samples were analyzed. A sample, uncoated Ti6Al4V
plate (only substrate) was introduced and its pattern was used as a reference data. This
data was subtracted from XRD data of coated samples. The XRD patterns of surfaces
of samples soaked in pure 2.0×SBF for 3, 6, 9, 14 and 18 days and standard HA
spectrum pattern from ICDD (card no: 1-1008) is represented in Figure 26. The 2θ
degrees pertaining to the XRD peaks of samples are shown in Table 12. From Figure
26 it can be said that coatings have standard HA peak pattern.
Figure 26: XRD pattern of Ti6Al4V plates soaked in pure 2.0×SBF for 3, 6, 9, 14
and 18 days with standard HA pattern (from ICDD, card no:1-1008).

67
For pure samples, as the immersing time increased, XRD peaks were strengthened due
to the increase in the thickness and crystallinity of the coating. Strongest peaks are
obtained from the coating which is immersed into the solution for a period on 9th and
18th days. XRD peak intensities on 14th day was less than that of the coatings on 9th
day. This was thought to be due to the disintegration of the thick coating on the surface.
From 9th day, standard HA peaks started to be observed. For samples immersed in pure
2.0×SBF, there are intensity difference between XRD results of samples and standard
XRD pattern.
The XRD patterns of surfaces of samples soaked in 0.15mM Sr added 2.0×SBF for 3,
6, 9, 14 and 18 days and standard HA spectrum pattern from ICDD (card no: 1-1008)
are represented in Figure 27.
Table 12: XRD peaks of the samples soaked in pure 2.0×SBF at 2θ degrees.
Coating Time: 3 Days 6 Days 9 Days 14 Days 18 Days
XRD
Peaks
2θ
Degrees
25.85 25.95 26 26.05 25.99
28.44
(Weak)
28.82
(Weak)
28.9
(weak)
28.9
(weak)
28.6
(weak)
31.67 31.93 32.03 31.96 32.02
- - 39.6
(weak) 39.92 39.61
- 46.4 46.92 46.4
(weak)
46.6
(weak)
48.62
(weak) - 49.92
49.47
(weak) 49.54
- - 53.32 53.31
(weak) 53.37

68
According to the XRD results of 0.15mM Sr added samples, no significant difference
was observed in XRD peaks for 9th, 14th and 18th day samples. On the other hand, 6th
day sample has a little weaker peaks from them. After 6 days, obtained XRD peaks for
0.15mM Sr added samples were similar to the standard HA peaks. Peaks shown in
Table 12 demonstrate that, 3rd day coating have completely different peaks then others
and also it has weaker peaks. This situation may conclude that amorphous structure is
dominant for 3rd day sample. Peak at around (2θ) 22 degrees, was not related to the
CaP or substrate material. Like pure samples, 0.15mM Sr added samples have weaker
HA peaks for higher than (2θ) 40 degrees. The XRD peaks of samples soaked in
0.15mM Sr added 2.0×SBF are given in Table 13. Also, XRD patterns of surfaces of
samples soaked in 1mM Sr added 2.0×SBF for 3, 6, 9, 14 and 18 days with standard
HA spectrum pattern from ICDD (card no: 1-1008) is represented in Figure 28.
Figure 27: XRD pattern of Ti6Al4V plates soaked in 0.15mM Sr added 2.0×SBF for
3, 6, 9, 14 and 18 days with standard HA pattern (ICDD, card no:1-1008).

69
Figure 28: XRD pattern of Ti6Al4V plates soaked in 1mM Sr added 2.0×SBF for 3,
6, 9, 14 and 18 days with standard HA pattern
(ICDD, card no:1-1008).
Table 13: XRD peaks of the samples soaked in 0.15mM Sr added 2.0×SBF at 2θ
degrees.
Coating Time: 3 Days 6 Days 9 Days 14 Days 18 Days
XRD
Peaks
2θ
Degrees
21.76 - - - -
- 25.96 26.01 26.07 25.96
- - 28.64
(weak)
28.95
(weak)
28.4
(weak)
31.68
(weak) 31.86 31.90 31.85 31.81
- 38.98
(weak) 38.28
39.56
(weak)
39.58
(weak)
45.49
(weak) -
46.62
(weak) -
46.57
(weak)
- 49.36 49.43
(weak)
49.60
(weak)
49.31
(weak)
- 53.29 53.31
(weak)
53.38
(weak)
53.31
(weak)
56.47
(weak) - - - -

70
For samples coated in 1mM Sr added solution, strongest peaks are obtained from the
coating which was immersed into the solution for a period on 9 days. For 9th day
sample, formed peaks like to be similar to the HA pattern. In addition, for 3rd and 6th
day coatings, weak and not HA like patterned peaks were observed. Weak peaks may
be resulted from thin coating material and low crystallinity (mostly amorphous) at
these immersing periods. For 14th and 18th day coatings, also weak peaks were
observed and this may be resulted from disintegration of the thick coating on the
surface. Also, the most intense peaks of standard HA pattern were observed in14th and
18th day XRD patterns but some peaks of standard HA pattern were not shown. In
addition, no additional peak was observed for 14th and 18th day coatings. As a
conclusion, according to the XRD results 1mM Sr added sample peaks a bit similar
HA pattern but weaker peaks. For 3rd day sample an extra peak at (2θ) 48 degrees
shown and which was related to the substrate plate.
Table 14: XRD peaks of the samples soaked in 1mM Sr added 2.0×SBF at 2θ degrees.
Coating Time: 3 Days 6 Days 9 Days 14 Days 18 Days
XRD
Peaks
2θ
Degrees
24.83
(weak)
26.04
(weak)
26.01
(weak)
25.98
(weak)
25.96
(weak)
- - 28.64
(weak) - -
- 31.85
(weak)
31.9
(weak) 31.82 31.85
- - 39.51 - -
48.43 - - - -
- - 53.09
(weak) - -
For Sr doped HA, chemical formula is:
𝐶𝑎10−𝑥𝑆𝑟𝑥(𝑃𝑂4)6(𝑂𝐻)2 (2)
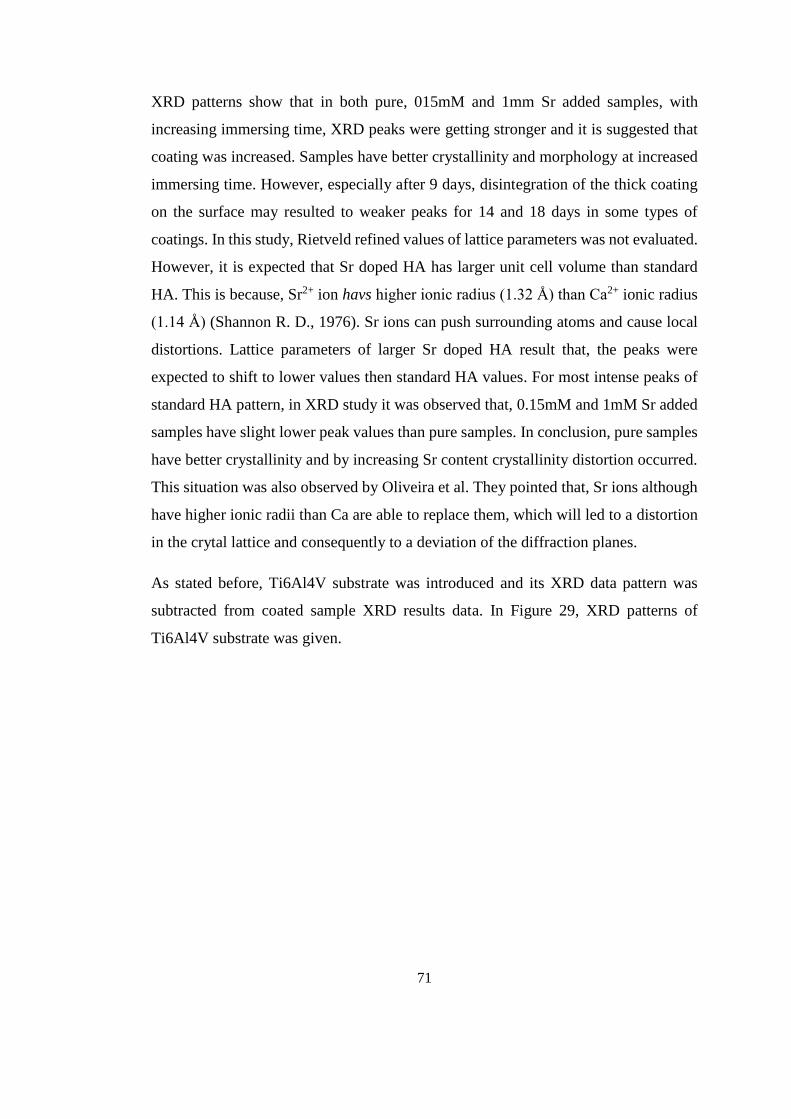
71
XRD patterns show that in both pure, 015mM and 1mm Sr added samples, with
increasing immersing time, XRD peaks were getting stronger and it is suggested that
coating was increased. Samples have better crystallinity and morphology at increased
immersing time. However, especially after 9 days, disintegration of the thick coating
on the surface may resulted to weaker peaks for 14 and 18 days in some types of
coatings. In this study, Rietveld refined values of lattice parameters was not evaluated.
However, it is expected that Sr doped HA has larger unit cell volume than standard
HA. This is because, Sr2+ ion havs higher ionic radius (1.32 Å) than Ca2+ ionic radius
(1.14 Å) (Shannon R. D., 1976). Sr ions can push surrounding atoms and cause local
distortions. Lattice parameters of larger Sr doped HA result that, the peaks were
expected to shift to lower values then standard HA values. For most intense peaks of
standard HA pattern, in XRD study it was observed that, 0.15mM and 1mM Sr added
samples have slight lower peak values than pure samples. In conclusion, pure samples
have better crystallinity and by increasing Sr content crystallinity distortion occurred.
This situation was also observed by Oliveira et al. They pointed that, Sr ions although
have higher ionic radii than Ca are able to replace them, which will led to a distortion
in the crytal lattice and consequently to a deviation of the diffraction planes.
As stated before, Ti6Al4V substrate was introduced and its XRD data pattern was
subtracted from coated sample XRD results data. In Figure 29, XRD patterns of
Ti6Al4V substrate was given.

72
Figure 29: XRD pattern of non-coated Ti6Al4V plates against to standard HA pattern.
3.5. FTIR Results
FTIR spectroscopy provides information regarding to molecular vibrations.
Absorptions in infrared spectrum of the electromagnetic spectrum due to stretching
and bending of covalent bonds are used in FTIR spectroscopy (Schrader B., 1995).
FTIR analyses can show lots of information about a molecule, however, it is not
enough to unknown compound for sure. It is important to keep in mind that, for getting
too many details out of the ‘fingerprint area’ can be misleading. For this reason, to
identify the molecule other analyzing techniques such as, mass spectroscopy, NMR
can be used.
Non-symmetrical stretching vibration of a molecule produce net charge of dipol
moment and produce a peak in IR spectrum. Similarly, bending vibration of a molecule
also produces net charge of dipol moment and a peak shown in IR spectrum. In HA
FTIR spectra v3 peaks represents the stretching vibration mode of the molecule and v4

73
peaks represents the bending vibration mode of the molecule. The peak intensity
represents the transmittance of the beam. Transmittance is calculated by the original
irradiance of the beam divided by irradiance after the beam passes through the sample
molecule (Schrader B., 1995).
For surface characterization of coatings, FTIR spectroscopy was also used. By
obtaining an infrared spectrum of absorption, emission and photoconductivity of a
solid, liquid or gas FTIR spectroscopy is used for analyzing chemical composition of
the material. Results of FTIR analysis of surface of Ti6AL4V plates which were
immersed in pure 2.0×SBF, 0.15mM Sr added 2.0×SBF and 1mM Sr added 2.0×SBF
solution for 3, 6, 9, 14 and 18 days are shown in Figure 30, Figure 31 and Figure 32
respectively. Also, FTIR peaks for samples immersed in pure, 0.15mM and 1mM Sr
added 2.0×SBF are given in Table 15, 16, 17 respectively.
Figure 30: FTIR results of Ti6Al4V plates soaked in pure 2.0×SBF: (a) For 3 days,
(b) For 6 days, (c) For 9 days, (d) For 14 days and (e) For 18 days.
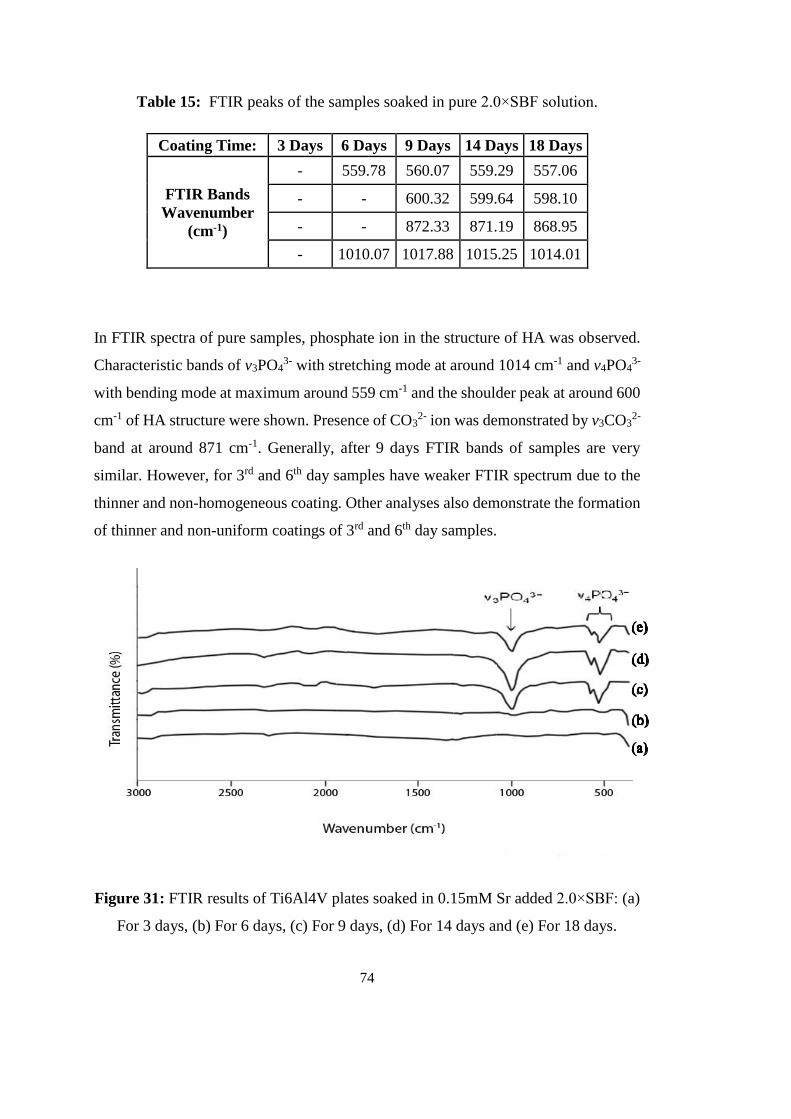
74
Table 15: FTIR peaks of the samples soaked in pure 2.0×SBF solution.
Coating Time: 3 Days 6 Days 9 Days 14 Days 18 Days
FTIR Bands
Wavenumber
(cm-1)
- 559.78 560.07 559.29 557.06
- - 600.32 599.64 598.10
- - 872.33 871.19 868.95
- 1010.07 1017.88 1015.25 1014.01
In FTIR spectra of pure samples, phosphate ion in the structure of HA was observed.
Characteristic bands of v3PO43- with stretching mode at around 1014 cm-1 and v4PO4
3-
with bending mode at maximum around 559 cm-1 and the shoulder peak at around 600
cm-1 of HA structure were shown. Presence of CO32- ion was demonstrated by v3CO3
2-
band at around 871 cm-1. Generally, after 9 days FTIR bands of samples are very
similar. However, for 3rd and 6th day samples have weaker FTIR spectrum due to the
thinner and non-homogeneous coating. Other analyses also demonstrate the formation
of thinner and non-uniform coatings of 3rd and 6th day samples.
Figure 31: FTIR results of Ti6Al4V plates soaked in 0.15mM Sr added 2.0×SBF: (a)
For 3 days, (b) For 6 days, (c) For 9 days, (d) For 14 days and (e) For 18 days.
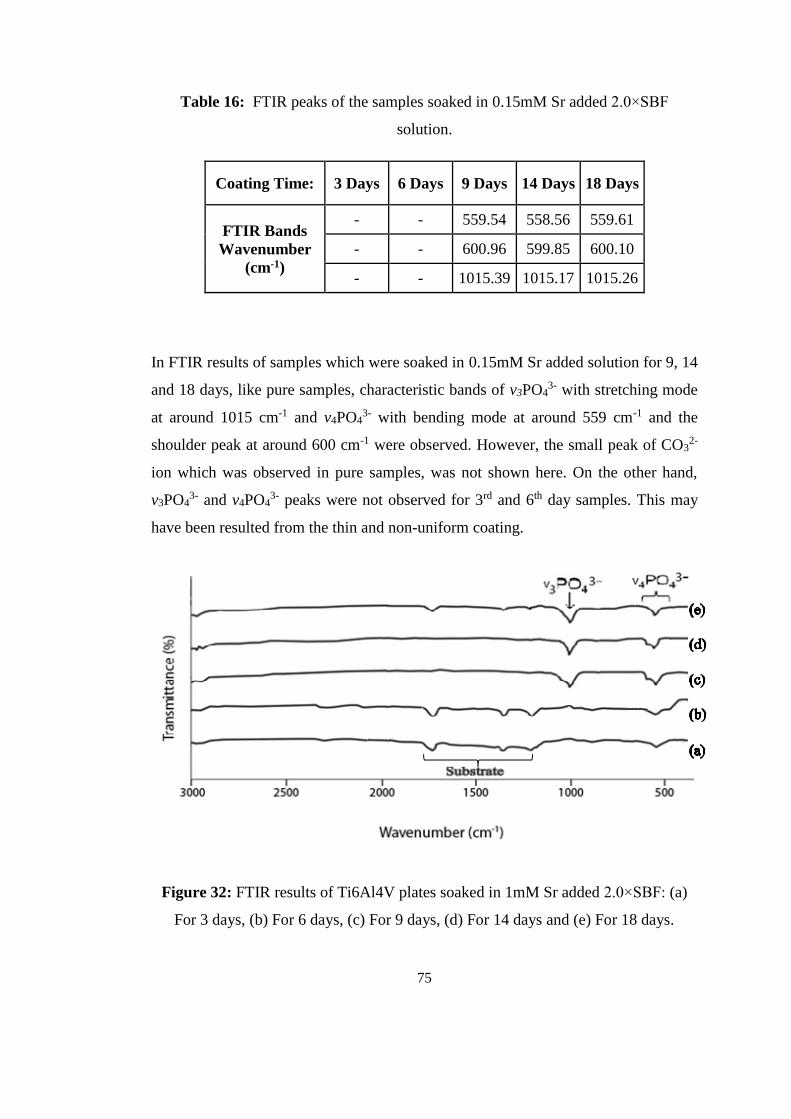
75
Table 16: FTIR peaks of the samples soaked in 0.15mM Sr added 2.0×SBF
solution.
Coating Time: 3 Days 6 Days 9 Days 14 Days 18 Days
FTIR Bands
Wavenumber
(cm-1)
- - 559.54 558.56 559.61
- - 600.96 599.85 600.10
- - 1015.39 1015.17 1015.26
In FTIR results of samples which were soaked in 0.15mM Sr added solution for 9, 14
and 18 days, like pure samples, characteristic bands of v3PO43- with stretching mode
at around 1015 cm-1 and v4PO43- with bending mode at around 559 cm-1 and the
shoulder peak at around 600 cm-1 were observed. However, the small peak of CO32-
ion which was observed in pure samples, was not shown here. On the other hand,
v3PO43- and v4PO4
3- peaks were not observed for 3rd and 6th day samples. This may
have been resulted from the thin and non-uniform coating.
Figure 32: FTIR results of Ti6Al4V plates soaked in 1mM Sr added 2.0×SBF: (a)
For 3 days, (b) For 6 days, (c) For 9 days, (d) For 14 days and (e) For 18 days.

76
Table 17: FTIR peaks of the samples soaked in 1mM Sr added 2.0×SBF solution.
Coating
Time: 3 Days 6 Days 9 Days
14
Days
18
Days
FTIR Bands
Wavenumber
(cm-1)
547.89 551.12 552.37 557.90 555.11
- - 602.99 598.15 599.78
- - 1011.89 1011.69 1012.51
1220.88 1219.01 - - -
1401.20 1400.09 - - -
1739.15 1738.04 - - 1738.87
FTIR results of samples immersed in 1mM Sr added 2.0×SBF demonstrate that, like
0.15mM Sr added samples, 1mM Sr added samples at 9th, 14th and 18th day have
characteristic bands of v3PO43- with stretching mode at around 1012 cm-1 and v4PO4
3-
with bending mode at around 555 cm-1 with the shoulder peak at 600 cm-1. However,
these peaks are weaker than pure and 0.15mM Sr added sample peaks. Similar to the
pure and 0.15mM Sr added samples, coatings at 3rd and 6th day in 1mM Sr added
2.0×SBF solution have no significant PO43- ion peaks due to the thin coating. Coatings
at 3rd and 6th day showed small peaks at around 1738 cm-1, at around 1400 cm-1 and at
around 1220 cm-1 are assigned with substrate plate
3.6. Raman Spectroscopy Results
Raman spectroscopy is a commonly used method to identify a molecule with respect
to its molecular vibration. Like FTIR spectroscopy, stretching and bending vibrations
such as rocking or scissor vibration of the molecule produces peaks in Raman
spectrum. In HA Raman spectra, v1 peaks represent symmetric stretch, v2 peaks
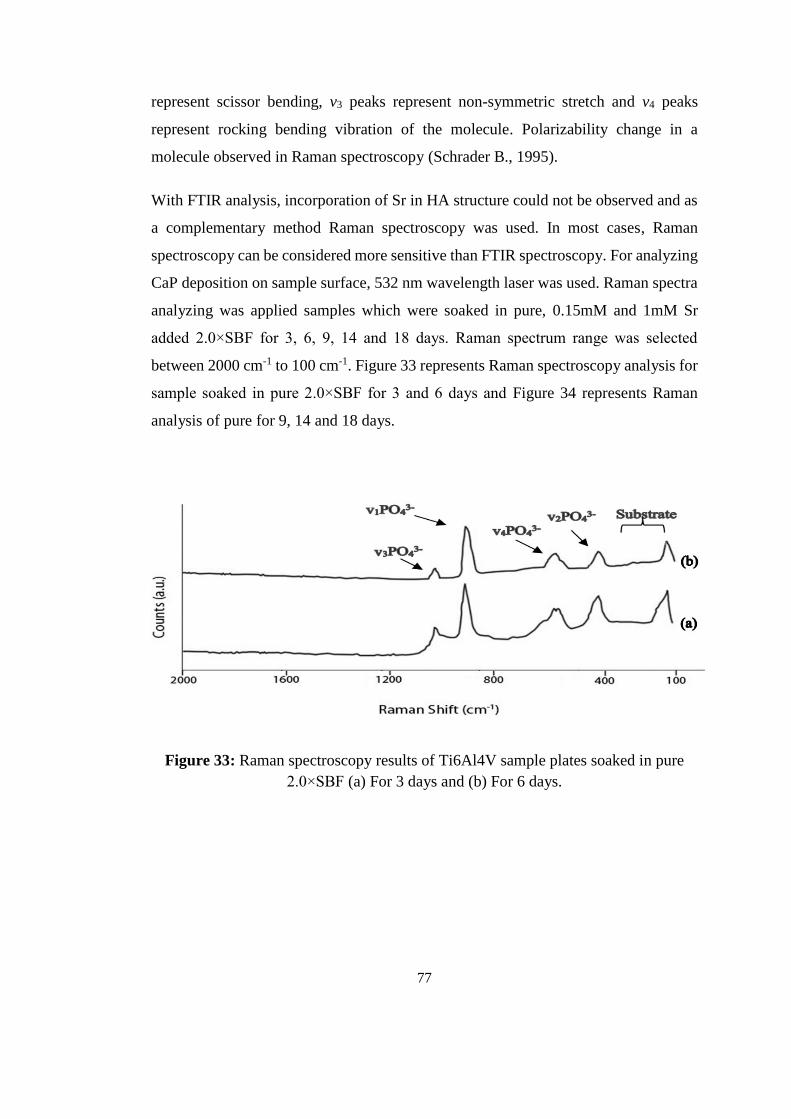
77
represent scissor bending, v3 peaks represent non-symmetric stretch and v4 peaks
represent rocking bending vibration of the molecule. Polarizability change in a
molecule observed in Raman spectroscopy (Schrader B., 1995).
With FTIR analysis, incorporation of Sr in HA structure could not be observed and as
a complementary method Raman spectroscopy was used. In most cases, Raman
spectroscopy can be considered more sensitive than FTIR spectroscopy. For analyzing
CaP deposition on sample surface, 532 nm wavelength laser was used. Raman spectra
analyzing was applied samples which were soaked in pure, 0.15mM and 1mM Sr
added 2.0×SBF for 3, 6, 9, 14 and 18 days. Raman spectrum range was selected
between 2000 cm-1 to 100 cm-1. Figure 33 represents Raman spectroscopy analysis for
sample soaked in pure 2.0×SBF for 3 and 6 days and Figure 34 represents Raman
analysis of pure for 9, 14 and 18 days.
Figure 33: Raman spectroscopy results of Ti6Al4V sample plates soaked in pure
2.0×SBF (a) For 3 days and (b) For 6 days.

78
Figure 34: Raman spectroscopy results of Ti6Al4V sample plates soaked in pure
2.0×SBF (a) For 9 days, (b) For 14 days and (c) For 18 days.
As seen in Figure 33 and 34, the four characteristic peaks of HA were shown, at 961
cm-1 which represents to the stretching mode (v1) of the PO43-, at around 429 cm-1 (v2)
stretching mode of the PO43-, at around 1073 cm-1 (v3) stretching mode of the PO4
3- on
spectrum band and at around 593 cm-1 (v4) bending mode of the PO43- (Jiangling L.,
2009). The peak at around 146 cm-1 is assigned to the substrate plate (Yilmaz B., 2014).
In addition, in Figure 33, peaks at 209 cm-1 and 277 cm-1 for pure 3 days sample also
represented Ti6Al4V substrate plate. The v1PO43- peak at 961 cm-1 is the most intense
peak for all pure samples.
Penel et al. stated that, peak around 1070 cm-1 in Raman spectrum may not be solely
assigned to PO43- (v3). A type CO3
2- and B type CO32- can be represented in Raman
spectrum at 1107cm-1 and 1070 cm-1 respectively (Penel et al., 1998). With this
information, it is possible the presence of B-type CO32- in the coating for all pure
samples. As a conclusion, from pure sample Raman spectroscopy results of PO43-, it
can be said that, HA structure was formed for samples which were soaked in pure
2.0×SBF. In Figure 35, Raman spectroscopy results of samples immersed in 0.15mM
Sr added 2.0×SBF for 3 and 6 days and in Figure 36, for 9, 14 and 18 days are given.
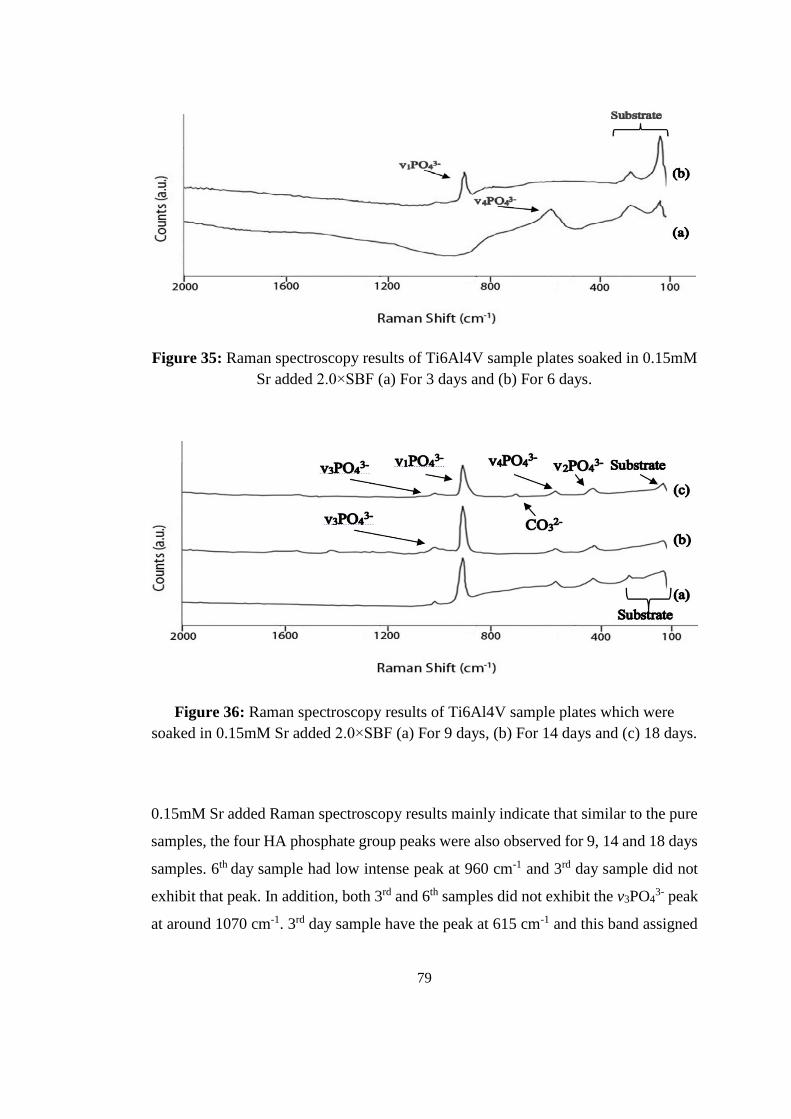
79
Figure 35: Raman spectroscopy results of Ti6Al4V sample plates soaked in 0.15mM
Sr added 2.0×SBF (a) For 3 days and (b) For 6 days.
Figure 36: Raman spectroscopy results of Ti6Al4V sample plates which were
soaked in 0.15mM Sr added 2.0×SBF (a) For 9 days, (b) For 14 days and (c) 18 days.
0.15mM Sr added Raman spectroscopy results mainly indicate that similar to the pure
samples, the four HA phosphate group peaks were also observed for 9, 14 and 18 days
samples. 6th day sample had low intense peak at 960 cm-1 and 3rd day sample did not
exhibit that peak. In addition, both 3rd and 6th samples did not exhibit the v3PO43- peak
at around 1070 cm-1. 3rd day sample have the peak at 615 cm-1 and this band assigned

80
to bending mode of phosphate group. Considering this peak with other results, it was
observed that this peak assigned phosphate group which was not in HA structure. It
can be concluded that, 3rd day sample did not have significant HA deposition on its
surface. Previous analysis methods also validate this result.
The main characterization peak of phosphate group in HA structure at around 960
cm-1 was increased with immersing time. That can be resulted from increasing apatite
formation with increasing time. Like samples soaked in pure solution, 0.15mM Sr
added samples for 9, 14 and 18 days have similar peak at 1070 cm-1 which may
represent both PO43- or B-type CO3
2-. For 3rd day sample, peaks at 144 cm-1 and 278
cm-1, for 6th and 9th day samples, peaks at 276 cm-1 are assigned also to the substrate
plate. For 18th day sample, peak at 752 cm-1 may represent CO32-. From results, it can
be said that, similar to the pure samples, HA started to formation on substrate surface.
Also, it can be concluded that, formation of HA amount increased with immersing
time for 0.15mM Sr added samples. In Figure 37, Raman spectroscopy results of
samples immersed in 1mM Sr added 2.0×SBF for 3 and 6 days and in Figure 38, for
9, 14 and 18 days are given.
Figure 37: Raman spectroscopy results of Ti6Al4V sample plates soaked in 1mM Sr
added 2.0×SBF (a) For 3 days and (b) For 6 days.
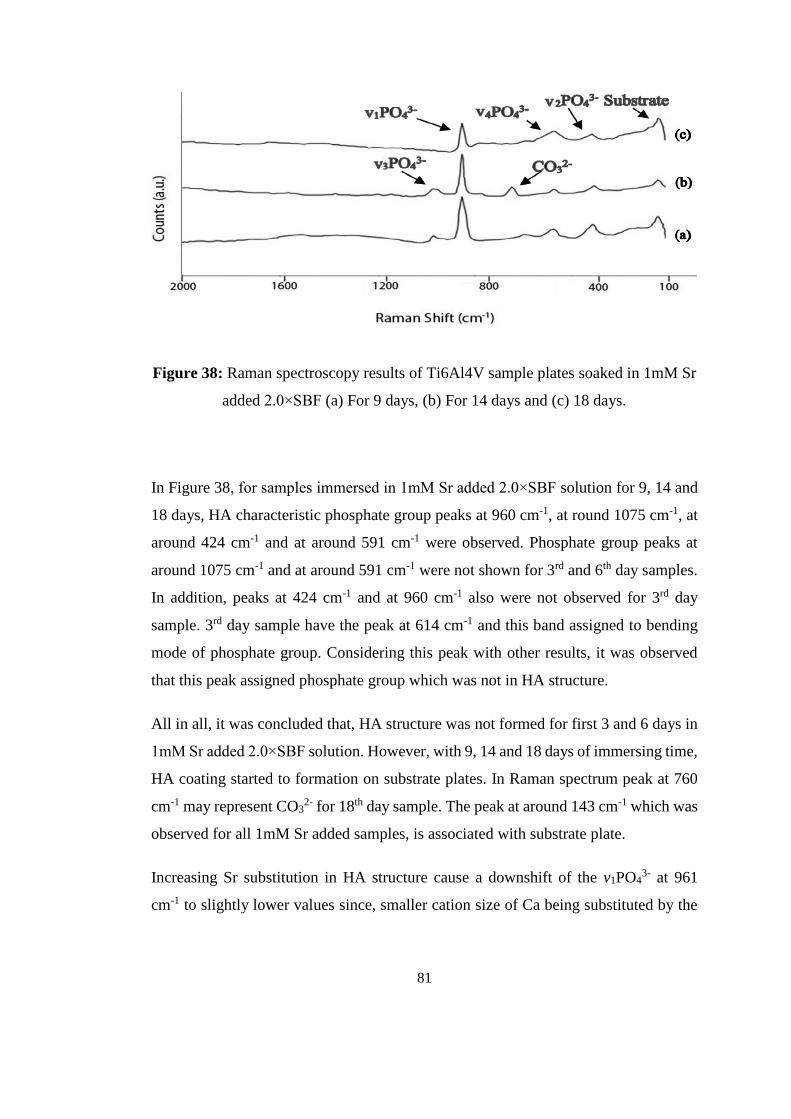
81
Figure 38: Raman spectroscopy results of Ti6Al4V sample plates soaked in 1mM Sr
added 2.0×SBF (a) For 9 days, (b) For 14 days and (c) 18 days.
In Figure 38, for samples immersed in 1mM Sr added 2.0×SBF solution for 9, 14 and
18 days, HA characteristic phosphate group peaks at 960 cm-1, at round 1075 cm-1, at
around 424 cm-1 and at around 591 cm-1 were observed. Phosphate group peaks at
around 1075 cm-1 and at around 591 cm-1 were not shown for 3rd and 6th day samples.
In addition, peaks at 424 cm-1 and at 960 cm-1 also were not observed for 3rd day
sample. 3rd day sample have the peak at 614 cm-1 and this band assigned to bending
mode of phosphate group. Considering this peak with other results, it was observed
that this peak assigned phosphate group which was not in HA structure.
All in all, it was concluded that, HA structure was not formed for first 3 and 6 days in
1mM Sr added 2.0×SBF solution. However, with 9, 14 and 18 days of immersing time,
HA coating started to formation on substrate plates. In Raman spectrum peak at 760
cm-1 may represent CO32- for 18th day sample. The peak at around 143 cm-1 which was
observed for all 1mM Sr added samples, is associated with substrate plate.
Increasing Sr substitution in HA structure cause a downshift of the v1PO43- at 961
cm-1 to slightly lower values since, smaller cation size of Ca being substituted by the
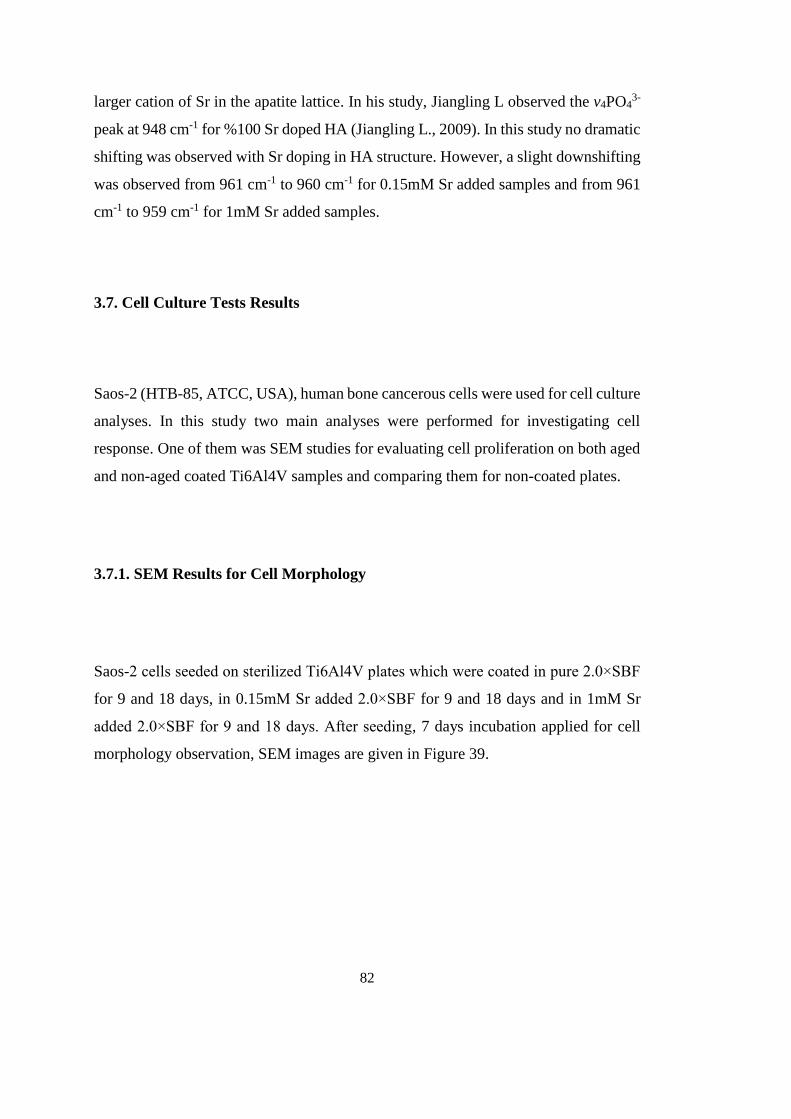
82
larger cation of Sr in the apatite lattice. In his study, Jiangling L observed the v4PO43-
peak at 948 cm-1 for %100 Sr doped HA (Jiangling L., 2009). In this study no dramatic
shifting was observed with Sr doping in HA structure. However, a slight downshifting
was observed from 961 cm-1 to 960 cm-1 for 0.15mM Sr added samples and from 961
cm-1 to 959 cm-1 for 1mM Sr added samples.
3.7. Cell Culture Tests Results
Saos-2 (HTB-85, ATCC, USA), human bone cancerous cells were used for cell culture
analyses. In this study two main analyses were performed for investigating cell
response. One of them was SEM studies for evaluating cell proliferation on both aged
and non-aged coated Ti6Al4V samples and comparing them for non-coated plates.
3.7.1. SEM Results for Cell Morphology
Saos-2 cells seeded on sterilized Ti6Al4V plates which were coated in pure 2.0×SBF
for 9 and 18 days, in 0.15mM Sr added 2.0×SBF for 9 and 18 days and in 1mM Sr
added 2.0×SBF for 9 and 18 days. After seeding, 7 days incubation applied for cell
morphology observation, SEM images are given in Figure 39.

83
Figure 39: SEM images of osteosarcoma cells incubated for 7 days on: (a) Pure
sample for 9 days, (b) Pure sample for 18 days, (c) 0.15mM Sr added sample for 9
days, (d) 0.15mM Sr added sample for 18 days, (e) 1mM Sr added sample for 9 days
and (f) 1mM Sr added sample for 18 days (1000x).

84
As seen in Figure 39, presence of proliferation of osteosarcoma cells on every type of
studied material demonstrated that cells attached and spread on coatings. Arrows were
placed on SEM images to make easy to see both lamellipodia and filopodia but in most
of images arrows were not needed. Although the largest proliferation was observed in
0.15mM Sr added sample (18 day), comparing samples by difference in proliferation
was not easy with using SEM images. Cell proliferation was observed higher for pure
and 0.15mM Sr added samples than 1mM Sr added samples however, it can be said
that, on all coated samples cell attachment and proliferation were observed. For
investigating the durability of the coatings in the culture medium, aging study was
performed on coatings and SEM images of aged samples are seen in Figure 40 and 41.
Figure 40: SEM images of aged: (a) Pure sample for 18 days (20x), (b) Pure sample
for 18 days (500x), (c) 0.15mM Sr added sample for 18 days (20x) and (d) 0.15mM
Sr added sample for 18 days (500x).
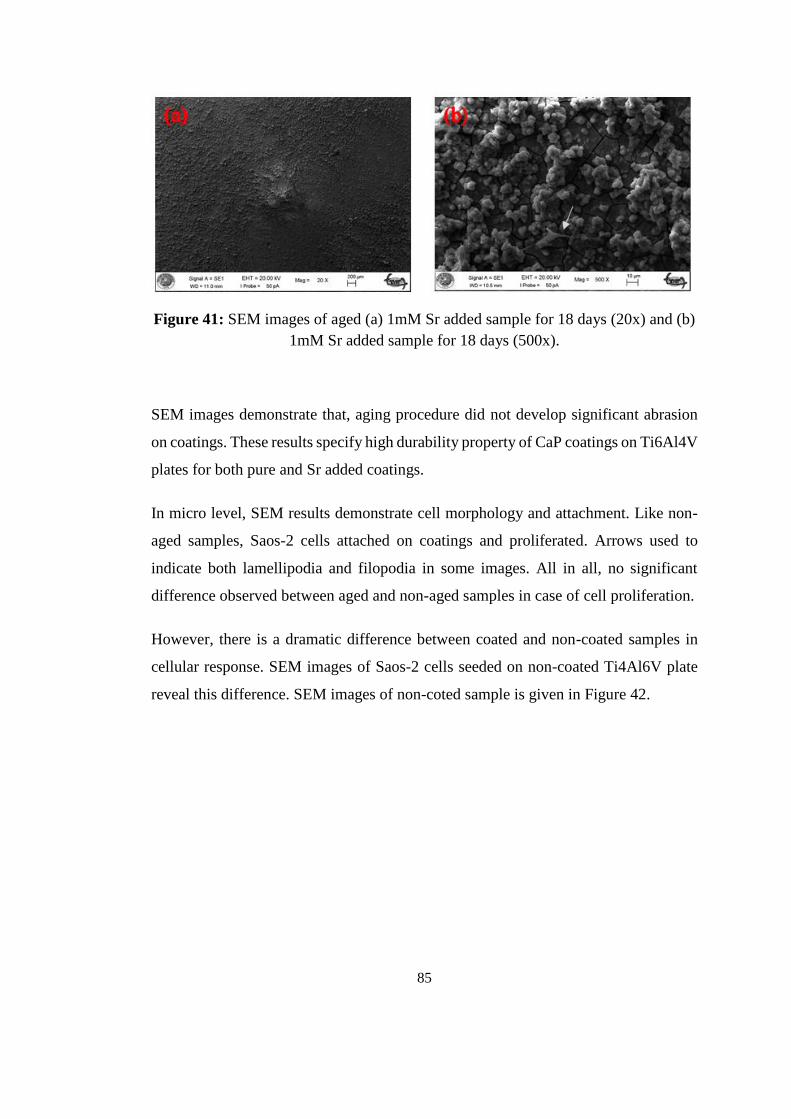
85
Figure 41: SEM images of aged (a) 1mM Sr added sample for 18 days (20x) and (b)
1mM Sr added sample for 18 days (500x).
SEM images demonstrate that, aging procedure did not develop significant abrasion
on coatings. These results specify high durability property of CaP coatings on Ti6Al4V
plates for both pure and Sr added coatings.
In micro level, SEM results demonstrate cell morphology and attachment. Like non-
aged samples, Saos-2 cells attached on coatings and proliferated. Arrows used to
indicate both lamellipodia and filopodia in some images. All in all, no significant
difference observed between aged and non-aged samples in case of cell proliferation.
However, there is a dramatic difference between coated and non-coated samples in
cellular response. SEM images of Saos-2 cells seeded on non-coated Ti4Al6V plate
reveal this difference. SEM images of non-coted sample is given in Figure 42.
86
Figure 42: SEM images of osteosarcoma cells on non-coated Ti6Al4V plate. (a)
500x and (b) 2000x magnification.
With evaluating SEM images in Figure 42, it was seen that no significant cellular
attachment was formed against Ti6Al4V surface. On contrary of coated plates, cell
morphologies of Saos-2 cells indicate no significant proliferation was occurred on non-
coated samples.
3.7.2. MTT Cell Viability Test Results
In order to evaluate cell viability on coated Ti6Al4V plates, MTT cell viability test
was performed. For this purpose, both coated samples and Sr solutions was subjected
to MTT cytotoxicity test. MTT is a colorimetric assay for evaluating cellular metabolic
activity. With the presence of living cells, MTT salt turns into formazan which has a
purplish-bluish color. Colorimetric assay of the purplish-bluish material directly
related to the amount of living cells in the medium.

87
3.7.2.1. Cell Viability Results of Strontium Solutions
In order to determine the dose dependent cytotoxicity of Sr element, SrCl2 salt was
dissolved in growth medium in different concentrations. The tested Sr solution
concentrations are 32mM (as stock solution), 16mM, 8mM, 4mM, 2mM, 1mM,
0.5mM, 0.25mM and 0.125mM. Viabilities of Saos-2 (osteosarcoma) cells which were
treated with Sr solutions were evaluated as percentage with respect to the Sr non-added
growth medium.
The percentage viabilities of cells were evaluated for each well with respect to mean
absorbance of the control wells and averaged. Percentage viability of each well was
calculated by dividing absorbance of test wells to arithmetic mean of absorbance of
control wells and result multiplied by 100. The average percent viabilities of Saos-2
cells which were treated with Sr solutions for 48 hours was given in Figure 43.
In MTT study, in order to increase the accuracy of test, absorbance of Sr solutions
without cells were subtracted from absorbance of Sr solutions with cells. Similarly, for
control cells, absorbance of growth medium without cells were subtracted from
absorbance of growth medium with cells. By this method, interference for absorbance
was prevented.

88
Figure 43: Percent viability of Saos-2 cells with respect to the Sr solution types
(concentrations).
According to MTT results, from stock solution which has 32mM Sr concentration to
minimum concentrated solution which has 0.125mM Sr concentration, no significant
toxicity for Saos-2 cells was detected. However, percentage viability results
demonstrate that, in higher Sr concentrations cell viability is lower than in lower Sr
concentrations. According to the MTT assay stock solution has the lowest Saos-2
viability and solution 9 (which has the lowest Sr concentration) has the highest
viability. It can be said that, in this study, 2.0×SBF was prepared with 0.15mM and
1mM Sr content. These molarities was in range of MTT tested solutions molarities.
These results were also meaningful for the basis study in this research. With these
result, we can consider that, 0.15mM Sr added and 1mM Sr added 2.0×SBF solutions
are not toxic for osteosarcoma cells.

89
3.7.2.2. Cell Viability Results of Coating Plates
The main purpose of using MTT cytotoxicity test is to determine cell viability of
osteosarcoma cells seeded on Ti6Al4V coatings. In MTT test, absorbance is a measure
for the viability of cells. In this test, MTT assay results for different sample types are
compared. Cellular viabilities of different types of coated plates are given in
Figure 44.
Figure 44: Cellular viability of Saos-2 cells with respect to the coating types.
Results, indicate that for pure and 1mM samples, coatings at 18th day have more
cellular viability than coatings at 9th day and for 0.15mM samples, coatings at 9th day
have more cellular viability than 18th day. However, from previous analyses it was
inarguably observed that, amount of coating was increased with immersing time for

90
all pure, 0.15mM and 1mM samples and with this knowledge it was hard to construe
a meaning for the cellular viability changing difference with immersing time according
to the type of samples. For this reason, change in cellular viability results with respect
to the immersing time may be disregarded. On the other hand, MTT results indicate
that, cellular viability is high for both non-coated and coated samples. In addition, no
significant cellular viability difference was observed between pure, 0.15mM and 1mM
Sr added samples. By only using MTT results, it was hard to determine which type of
coated plates was better for Saos-2 cells. Cellular viability was resulted for the highest
in 1mM Sr added samples and resulted lowest in 0.15mM Sr added samples but,
cellular viability differences in results between pure, 0.15mM and 1mM samples are
slight and may not be significant. They might be formed as experimental error
therefore, the difference may be negligible.
Both of SEM and MTT analyses were performed 7 days after seeding Saos-2 cells on
plates. In SEM analyzing no significant cell attachment and cell proliferation were
observed for non-coated samples but on the contrary, MTT results showed high
cellular viability for non-coated samples.
Theoretically, it might be expected that, cellular viability of coated plates was higher
than non-coated plates. However, pre-treatment of Ti6Al4V plates, their surface
become more rough and oxidized. This might be the reason why MTT cellular viability
test resulted similarly for coated and non-coated samples. In their study, Li et al.
pointed that, they obtained the similar results for comparing biomimetic coated
Ti6Al4V and porous Ti6Al4V implants. In their research, similar MTT cellular
viability results were shown for porous Ti6Al4V and biomimetic coated Ti6Al4V
implants (Li et al., 2012).
Sr has the ability of replacing Ca in CaP structure and in this study ICP-MS results
indicate that, Sr has successfully incorporated into CaP structure for both 0.15mM and
1mM Sr added samples. 2.0×SBF solution contains 5mM Ca ions and Ca/Sr amount
of coatings on Ti6Al4V plates soaked in 0.15mM Sr added 2.0×SBF was evaluated
23.5. In 0.15mM Sr added 2.0×SBF solution, Ca has 33.3 times higher ion

91
concentration than Sr. Ca/Sr ratio of coatings and Ca/Sr ionic ratio of 0.15mM Sr
added 2.0×SBF solution are close each other. On the other hand. ICP-MS results
showed that, for coatings on Ti6Al4V plates soaked in 1mM Sr added 2.0×SBF
solution, Ca/Sr ratio was 11.9. Ca/Sr ratio of 1mM Sr added 2.0×SBF solution is 5 and
this value is much smaller than Ca/Sr ratio of coatings. According to the results, it can
be concluded that, there is a limitation for Sr ions to incorporate CaP structure via
biomimetic method.
SEM, EDS, XRD, FTIR and Raman surface analyses demonstrate that, Sr doping
2.0×SBF solution has inhibiting effect on precipitation amount and crystallinity. 5mM
Sr added 2.0×SBF has similar ionic concentrations of Ca and Sr and no significant
coating was observed at first 6 days of immersion. This observation indicates that,
increasing Sr content in SBF solution has inhibiting effect on precipitation. In their
study, Oliveira et al. also concluded that, with increased Sr content, coating formation
delayed and thickness decreases (Oliveira et al., 2007).

92

93
CHAPTER 4
CONCLUSIONS
The main purpose of this study is to form Sr doped CaP coatings on commonly used
implant material; Ti6Al4V (Grade 5) by biomimetic method and analyzing of
properties of these coatings. For accelerating CaP deposition 2.0×SBF was used
instead of normal 1.0×SBF. Pure 2.0×SBF was used to form pure CaP deposition on
Ti alloy substrate plate. These coatings were used as control group and employed for
comparing with Sr doped CaP coatings. In order to investigate effects of concentration
of Sr for the biomimetic coating, SBF was prepared with different Sr concentration.
For this purpose, 0.15mM, 1mM and 5mM Sr added 2.0×SBF were prepared and
similar to the pure 2.0×SBF, Ti6AL4V plates were immersed in these solutions. For
biomimetic coating, plates were kept at physiological pH and temperature.SEM
studies revealed that nucleation of CaP was already started at 3rd day for samples in
pure, 0.15mM and 1mM Sr added solutions. With increasing immersing time, coating
amounts were also increased and surface of coatings become more uniform. By SEM
analyses it was observed that, CaP coatings formed in half spherical shape. Samples
in 5mM Sr added solution exhibit no significant CaP coating on their surface for first
6 days of immersion. EDS analysis showed similar results for 5mM Sr added samples.
From EDS analysis, it was observed that Ca/P molar ratio of both pure and Sr doped
coatings increased with increasing of immersion time. It was observed that with
increasing immersion time, XRD peaks were getting strengthened and crystallinity

94
was improved. According to the XRD results, Crystallinity and HA formation were
highest for pure samples and higher for 0.15mM Sr added samples than 1mM Sr added
samples. Substrates which were soaked in pure solution showed the typical FTIR
spectrum of c-HA regardless of immersion time. Moreover, samples soaked in
0.15mM and 1mM Sr added solution have also c-HA FTIR spectrum but it was not
observed until 9th day of immersion. Similar, to the FTIR analyses, Raman
spectroscopy analyses showed four characteristic HA pattern for pure, 0.15mM and
1mM Sr added samples for 9, 14 and 18 days of immersing. With immersing time
increased, both 0.15mM and 1mM Sr added samples showed typical HA pattern in
Raman spectroscopy therefore, it can be concluded that, by time immersing time
increased amorphous structure of CaP turned into apatite form. ICP-MS results showed
that Sr has perfectly incorporated into CaP structre. Ca/Sr ratios were found around
23.5 and 11.9 for samples soaked in 0.15mM and 1mM Sr added solution for 18 days
respectively, and both ratios are significantly high.For in vitro analyses, osteosarcoma
cells were seeded and incubated for 7 days. After incubation, cell attachment and
proliferation were observed with SEM. According to the SEM results, cell
proliferation and attachment were observed for all samples immersed in pure, 0.15mM
and 1mM Sr added 2.0×SBF for 9 and 18 days. On contrary, no significant cell
attachment and proliferation were seen for non-coated samples. However, MTT
cellular toxicity analyses demonstrated that, no significant cellular viability difference
between non-coated and coated samples. According to the in vitro analyses, both pure
and Sr added samples have no cellular toxicity. MTT analyses for Sr solutions
demonstrated that, solutions which have 8mM and lower concentration have no
significant toxicity.
In this study, it was proven to form Sr doped CaP coatings on Ti6Al4V via biomimetic
solution method and these coatings have good cellular response with osteosarcoma
cells. However, it was also seen that, CaP coating on Ti6Al4V implant material via
biomimetic method rather slow and takes too much time for complete coating. In
further study, for better understanding of osseointegration effect of Sr doped CaP
coatings in vivo tests can be perform.

95
REFERENCES
Abate G., Aseffa A., Selassie A., Goshu S., Fekade B., Woldemeskal D., Miorner H.
(2003). "Direct colorimetric assay for rapid detection of rifampin-resistant
mycobacterium tuberculosis", Journal of Clinical Microbiology, Vol: 42(2), 871-873
Adell R., Lekholm U., Rockler B., Branemark P. I. (1981). "A 15-year study of
osseointegrated implants in the treatment of the edentulous jaw", International Journal
of Oral and Maxillofacial Surgery, Vol: 10(6), 387-416
Aerssens J, Boonen S, Lowet G, Dequeker J. (1998). "Interspecies differences in bone
composition, density, and quality: Potential implications for in vivo bone research",
Endocrinology, Vol: 139(2), 663-670
Dogan A., Dogan L. A., Canpinar H., Demirpence E. (2004). "Hidroksiürenin
lökositlerinin mikrobisid fonksiyonlarına etkileri", Turkish Journal of Biochemistry,
Vol: 29(3), 232-236
Barrere F. (2002). "Biomimetic calcium phosphate coatıngs: Physicochemistry and
biological activity", PhD Thesis, University of Twente, Enschede, Netherlands
Bigi A., Boanini E., Bracci B., Facchini A., Panzavolta S., Segatti F., Sturba L. (2006).
"Nanocrystalline hydroxyapatite coatings on titanium: A new fast biomimetic
method", Biomaterials, Vol: 26(19), 4085-4089
Boidin G., Deloffre P., Perrat B., Panczer G., Boudeulle M., Mauras Y., Allain P.,
Tsouderos Y., Meunier P. J. (1996). "Strontium distribution and interactions with bone
mineral in monkey iliac bone after strontium salt (S 12911) administration", Journal
of Bone and Mineral Research, Vol: 11(9), 1302-1311

96
Braux, Velard F., Guillaume C., Bouthors S., Jallot E., Nedelec J. M., Laurent M. D,
Laquerrière P. (2011). "A new insight into the dissociating effect of strontium on bone
resorption and formation", Acta Biomaterialia, Vol: 7(6), 2593-2603
Bronzino D. J. (2000). "The Biomedical Engineering Handbook, Second Edition",
CRC Press, FL, Vol: 1, Chapter: 38
Catauro M., Bollino F., Papale F. (2015). "Surface modifications of titanium implants
by coating with bioactive and biocompatible poly (e-caprolactone)/SiO2 hybrids
synthesized via sol–gel", Arabian Journal of Chemistry, doi:
10.1016/i.arabjc.2015.02.010
Cui X., Kim H. M., Kawashita M., Wang L., Xiong T., Kokubo T., Nakamura T.
(2010). "Apatite formation on anodized Ti6Al4V alloy in simulated body fluid",
Metals and Materials International, Vol: 21(14), 1429-1438
Dahl S. G., Allain P., Marie P. J., Mauras Y., Boivin G., Ammann P, Tsouderos Y.,
Delmas P. D., Christiansen C. (2001). "Incorporation and distribution of strontium in
bone", Bone, Vol: 28(4), 446-453
Dorozhkin S. V. (2010). "Bioceramics of calcium orthophosphates", Biomaterials,
Vol: 31(7), 1465-1485
Dutton M. (1996). "Orthopaedics for The Physical Therapist Assistant", Jones and
Bartlett Learning, LLC, Carlstadt, NJ, pp: 43-55, 132-145
Elliot J. C. (1994). "Structure and Chemistry of The Apatites and Other Calcium
Orthophosphates.", Elsevier, Amsterdam, Netherlands, Vol: 18, pp: 240-256
Evans F. G. (1976). "Mechanical properties and histology of cortical bone from
younger and older men", The Anatomical Record Journal, Vol: 185(1), 1-11
97
Farlay D., Boivin G., Panczer G., Lalande A., Meunier P. J. (2005). "Longterm
strontium ranelate administration in monkeys preserves characteristics of bone mineral
crystals and degree of mineralization of bone", Journal of Bone and Mineral Research,
Vol: 20, 1569-1578
Frank J. M. (2011). "Bioactive coating for titanium based bone anchored implants",
PhD thesis, University of Oslo, Norway
Garg H., Bedi G., Garg A. (2012). "Implant surface modifications: A review", Journal
of Clinical and Diagnostic Research, Vol: 6(2), 319-324
González C. J. L. (2009). "Metals as bone repair materials" In Bone Repair
Biomaterials, Edited by Planell J. A. et al., Elsevier, pp: 154-193
Grynpas M. D., Hamilton E., Cheung R., Tsouderos Y., Deloffre P., Hott M., Marie P.
J. (1996). "Strontium increases vertebral bone volume in rats at a low dose that does
not induce detectable mineralization defect", Bone, Vol: 18(3), 253-259
Grynpas M. D., Marie P. J. (1990). "Effects of low doses of strontium on bone quality
and quantity in rats", Bone, Vol: 11, 313-319
Habibovic P., Barrere F., Blitterwijk C. A., Groot K., Layrolle P. (2002). "Biomimetic
hydroxyapatite coating on metal implants", Journal of the American Ceramic Society,
Vol: 85(3), 517-522
Hanawa T. (2010). "Overview of metals and applications" In Metals for Biomedical
Devices, Edited by Niinomi M., Elsevier, pp: 3-23
Hanawa T. (2012). "Research and development of metals for medical devices based
on clinical needs", Science and Technology of Advanced Materials, Vol: 13(6),
064102
Hench L. L., Erthridge E. C. (1982). "Biomaterials an Interfacial Approach",
Academic Press, NY, Vol: 4, pp: 21-27

98
Hench L. L., Wilson J. (1993). "An Introduction to Bioceramics", World Scientific
Publishing, Singapore, Vol: 1, Chapter 16
Hermawan H. (2013). "Introduction to metals for medical devices", Scientific Article
3, Materials Mind Magazine, Institute of Materials, Malaysia.
Hermawan H., Ramdan D., Djuansjah J. R. P. (2011). "Metals for biomedical
applications", Intech Open Access Publisher, Malaysia.
Jiangling L. (2009). "Structural characterization of apatite-like materials", PhD thesis,
University of Birmingham, UK
Joice T., Erico R. D., Jean-Guillaume E., Donald E. E., Gabriela G., Alexandre M. R.
(2008). "The structure of strontium-doped hydroxyapatite: an experimental and
theoretical study", Physical Chemistry Chemical Physics, Vol: 11(3), 568-577
Kim H. M., Miyaji F., Kokubo T., Nakamura T. (1996). "Preperation of bioactive Ti
and its alloys via simple chemical surface treatment", Journal of Biomedical Materials
Research, Vol: 32(3), 409-417
Kokubo T., Kushitani H., Sakka S., Kitsugi T., Yamamuro T. (1990). "Solutions able
to reproduce in vivo surface-structure changes in bioactive glass-ceramic A-W",
Journal of Biomedical Materials Research, Vol: 24, 721-734
Kokubo T. (2008). "Bioceramics and Their Clinical Applications, First Edition",
Woodhead Publishing, Abington, Cambridge, UK, pp: 114-121
Kokubo T., Kim H. M., Kawashita M. (2003). "Ceramics for biomedical applications"
In Handbook of Advanced Ceramics Volume II: Processing and Their Applications,
Edited by Somiya S. et al., Academic Press, pp: 385-416
Kokubo T., Takadama H. (2006). "How useful is SBF in predicting in vivo bone
bioactivity?", Biomaterials, Vol: 27(15), 2907-2915

99
Lang N. P., Salvi G. E., Huynh-Ba G., Ivanovski S., Donos N., Bosshardt D. D. (2011).
"Early osseointegration to hydrophilic and hydrophobic implant surfaces in humans",
Clinical Oral Implants Research, Vol: 22(4), 349-356
Lee K., Park M., Kim H. M., Lim Y. J., Chun H. J., Kim H. (2006). "Ceramic
bioactivity: Progresses, challenges and perspectives", Biomedical Materials, Vol: 1,
r31-r37
Leeuwenkamp O. R., van der Vijgh W. J., Husken B. C., Lips P., Netelenbos J. C.
(1990). "Human pharmacokinetics of orally administered strontium", Calcified Tissue
International, Vol: 47, 136-141
Legeros R. Z. (1991). "Calcium Phosphates in Oral Biology and Medicine", Karger
Publishing, Vol: 15, pp:140-161
Li X., Feng Y., Wang C., Li G., Lei W., Zhang Z., Wang L. (2012). "Evaluation of
biological properties of electron beam melted Ti6Al4V implant with biomimetic
coating in vitro and in vivo", PLoS ONE, Vol: 7(12), e:52049
Li Y., Li Q., Zhu S., Luo E., Li J., Feng G., Liao Y., Hu J. (2010). "The effect of
strontium-substituted hydroxyapatite coating on implant fixation in ovariectomized
rats", Biomaterials, Vol: 31(34), 9006-9014
Liebschner M. A. K., Wettergreen M. A. (2003). "Optimization of bone scaffold
engineering for load bearing applications" In Topics in Tissue Engineering, Edited by
Ashammakhi N., Ferreti P., Chapter 6, pp: 4-8
Lindahl C. (2012). "Biomimetic deposition of hydroxyapatite on titanium implant
materials", PhD thesis, Uppsala University, Sweden
Lu X., Leng Y. (2004). "Theoretical analysis of calcium phosphate precipitation in
simulated body fluid", Biomaterials, Vol: 26(2005), 1097-1108

100
Majeska R. J. (2001). "Cell biology of bone" In Bone Mechanics Handbook, Edited
by Stephen C. C., CRC Press, Chapter 2, pp: 2-14
Marie P. J., Felsenberg D., Brandi M. L. (2011). "How strontium ranelate, via opposite
effects on bone resorption and formation, prevents osteoporosis", Osteoporosis
International, Vol: 22, 1659-1667
Meunier P. J., Roux C., Seeman E., Ortolani S, Badurski J. E., Spector T. D., Cannata
J., Balogh A, Lemmel E. M., Pors N. S., Rizzoli R., Genant H. K., Reginster J. Y.
(2004). "The effects of strontium ranelate on the risk of vertebral fracture in women
with postmenopausal osteoporosis", New England Journal of Medicine, Vol: 350(5),
459–468
Morra M. (2006). "Biochemical modification of titanium surfaces: Peptides and ECM
proteins", European Cells and Materials, Vol: 12, 1-15
Nakano T. (2010). "Mechanical properties of metallic biomaterials" In Metals for
Biomedical Devices, Edited by Niinomi M., Elsevier, pp: 71-98
Oliveira A. L., Reis R. L., Li P. (2007). "Strontium – substituted apatite coating grown
on Ti6Al4V substrate through biomimetic synthesis", Journal of Biomedical Materials
Research Part B, Vol: 83, 258-265
Oyane A., Onuma K., Ito A., Kim H. M., Kokubo T., Nakamura T. (2003). "Formation
and growh of cluters in conventional and new kinds of simulated body fluids", Journal
of Biomedical Materials Research Part A, Vol: 64(2), 339-348
Parekh R. B., Shetty O., Tabassum R. (2012). "Surface modifications for endosseous
dental implants", International Journal of Oral Implantology and Clinical Research,
Vol: 3(3), 116-121
Park J., Lakes R. S. (2007). "Biomaterials: An Introduction", Springer, Chapter 1, pp:
1-5

101
Park S. S., Lee H. J., Oh I. H., Lee B. T. (2004). "Effects of Ag-doping on
microstructure and mechanical properties of hydroxyapatite films", Key Engineering
Materials, Vol: 277, 113-118
Pasinli A., Yuksel M., Celik E., Sener S., Tas A. C. (2010). "A new approach in
biomimetic synthesis of calcium phosphate coatings using lactic acid-Na lactate
buffered body fluid solution", Acta Biomaterialia, Vol: 6, 2282-2288
Penel G., Leroy G., Rey C., Bres E. (1998). "MicroRaman spectral study of the PO4
and CO3 vibrational modes in synthetic and biological apatites", Calcified Tissue
International, Vol: 37, 475-481
Petzold C, Gomez F. M., Lyngstadaas S. P., Monjo M. (2012). "EPA covalently bound
to smooth titanium surfaces decreases viability and biofilm formation of
staphylococcus epidermidis in vitro", Journal of Orthopaedic Research, Vol: 30, 1384-
1390
Pors N. S. (2004). "The biological role of strontium in bone", Bone, Vol: 35, 583-588
Raffalt A. C., Andersen J. E., Christgau S. (2008). "Application of inductively coupled
plasma-mass spectrometry (ICP-MS) and quality assurance to study the incorporation
of strontium into bone, bone marrow, and teeth of dogs after one month of treatment
with strontium malonate", Analytical and Bioanalytical Chemistry, Vol: 391, 2199-
2207
Reginster J. Y., Seeman E., De Vernejoul M. C., Adami S., Compston J., Phenekos C.,
Devogelaer J. P., Diaz C. M., Sawicki A., Goemaere S., Sorensen O. H., Felsenberg
D. Meunier P. J. (2005). "Strontium ranelate reduces the risk of nonvertebral fractures
in postmenopausal women with osteoporosis: Treatment of peripheral osteoporosis
(TROPOS) study", Journal of Clinical Endocrinology and Metabolism, Vol: 90(5),
2816-2822
102
Renaudin G., Laquerriere P., Filinchuk Y., Jallot E., Nedelec J. M. (2008). "Structural
characterization of sol-gel derived Sr-substituted calcium phosphates with anti-
osteoporotic and inflammatory properties", Journal of Materials Chemistry, Vol:
18(30), 3593-3600
Schrader B. (1995). "Infrared and Raman Spectroscopy: Methods and Applications",
VCH, Chapter 2, pp: 1-22
Shannon R. D. (1976). "Revised effective ionic radii and systematic studies of
interatomic distances in halides and chalcogenides", Acta Crystallographica Section
A, Vol: 32, 751-767
Takadama H., Hashimoto M. Mizuno M., Kokubo T. (2004). "Round-robin test of SBF
for in vitro measurement of apatite-forming ability of synthetic mateials", Phosphorus
Research Bulletin, Vol: 17(0), 119-125
Tas A. C. (2000). "Synthesis of biomimetic Ca-hydroxyapatite powders at 37° C in
synthetic body fluids", Biomaterials, Vol: 21(14), 1429-1438
Tas A. C. (2014). "Arogonite coating solutions (ACS) based on artificial seawater",
Applied Surface Science, Vol: 330, 262-269
Uzun G., Keyf F. (2007). "Surface characteristics of the implant systems and
osseointegration", Journal of Dental Faculty of Atatürk University, Suppl.:2, 43-50
Vallet-Regi M., Salinas A. J. (2009). "Ceramics as bone repair materials" In Bone
Repair Biomaterials, Edited by Planell J. A., Elsevier, pp: 194-230
Wei M., Uchida M., Kim H. M., Kokubo T., Nakamura T. (2002). "Apatite forming
ability of CaO-containing titania", Biomaterials, Vol: 23(1), 167-172
Yilmaz B. (2014). "Selenium doped calcium phosphate biomimetic coating on
Ti6Al4V orthopedic implant material for anti-cancer and anti-bacterial purposes", PhD
thesis, Middle East Technical University, Ankara, Turkey

103
Zhang X., Cresswell M. (2015). "Inorganic Controlled Release Technology: Materials
and Concepts for Advanced Drug Formulation", Elsevier, Chapter 6, pp: 163
Zhao C. Y., Fan H. S., Zhang X. D. (2011). "Advances in biomimetic apatite coating
on metal implants" In Advances in Biomimetics, Edited by George A., pp: 397-428