Strong influence of the littoral zone on sedimentary lipid ... · Strong influence of the littoral...
13
Strong influence of the littoral zone on sedimentary lipid biomarkers in a meromictic lake R. J. BOVEE AND A. PEARSON Department of Earth and Planetary Sciences, Harvard University, Cambridge, MA, USA ABSTRACT Planktonic sulfur bacteria growing in zones of photic zone euxinia (PZE) are important primary producers in stratified, sulfur-rich environments. The potential for export and burial of microbial biomass from anoxic photic zones remains relatively understudied, despite being of fundamental importance to interpreting the geologic record of bulk total organic carbon (TOC) and individual lipid biomarkers. Here we report the rela- tive concentrations and carbon isotope ratios of lipid biomarkers from the water column and sediments of meromictic Mahoney Lake. The data show that organic matter in the central basin sediments is indistin- guishable from material at the lake shoreline in both its lipid and carbon isotopic compositions. However, this material is not consistent with either the lipid profile or carbon isotope composition of biomass obtained directly from the region of PZE. Due to the strong density stratification and the intensive carbon and sulfur recycling pathways in the water column, there appears to be minimal direct export of the sulfur- oxidizing planktonic community to depth. The results instead suggest that basinal sediments are sourced via the littoral environment, a system that integrates an indigenous shoreline microbial community, the degraded remains of laterally rafted biomass from the PZE community, and detrital remains of terrigenous higher plants. Material from the lake margins appears to travel downslope, traverse the strong density gra- dient, and become deposited in the deep basin; its final composition may be largely heterotrophic in origin. This suggests an important role for clastic and/or authigenic minerals in aiding the burial of terrigenous and mat-derived organic matter in euxinic systems. Downslope or mineral-aided transport of anoxygenic, pho- toautotrophic microbial mats may have been a significant sedimentation process in early Earth history. Received 11 February 2014; accepted 29 July 2014 Corresponding author: A. Pearson. Tel.: +1 617 384 8392; fax: +1 617 495 8839; e-mail: pearson@eps. harvard.edu INTRODUCTION To understand the evolution of Earth’s redox cycles, it is critical to understand the mechanisms that establish, main- tain, and record the geologic history of marine euxinia— including its temporal and spatial scales (Meyer & Kump, 2008; Ozaki & Tajika, 2013), as well as its biomarker record to sediments (Grice et al., 2005; Brocks & Schaef- fer, 2008; Meyer et al., 2011; French et al., 2014). The carotenoid okenone and its degradation product, okenane, are biomarkers for euxinic conditions due to their taxo- nomically specific source from sulfide-oxidizing, photo- trophic bacteria [purple sulfur bacteria (PSB)]. This compound is found definitively only in planktonic species of PSB (Brocks & Schaeffer, 2008), although there also is debate about possible microbial mat sources (e.g., Meyer et al., 2011). To examine processes controlling the delivery of organic matter to sediments in euxinic systems—includ- ing okenone and other lipids—we extracted and analyzed biomarkers from stratified Mahoney Lake, British Columbia, Canada. Modern analogues such as meromictic lakes are useful for their compact redox gradients and dense chemocline microbial communities, offering end- member scenarios for the processes operating in sulfidic systems. Mahoney Lake is a small lake (surface area, 11.5 ha; maximum depth, 14.5 m; Overmann, 1997) with an oligo- trophic mixolimnion overlying a permanently stratified monimolimnion that contains extremely high concentra- tions of sulfate and sulfide (Northcote & Hall, 1983). The chemocline is maintained near 7 m depth throughout the year, where it supports the densest population of PSB (Chromatiaceae) ever measured (bacteriochlorophyll a > 20 mg l 1 ; Overmann et al., 1991). The dominant © 2014 John Wiley & Sons Ltd 1 Geobiology (2014) DOI: 10.1111/gbi.12099
Transcript of Strong influence of the littoral zone on sedimentary lipid ... · Strong influence of the littoral...
Strong influence of the littoral zone on sedimentary lipidbiomarkers in a meromictic lakeR. J . BOVEE AND A. PEARSON
Department of Earth and Planetary Sciences, Harvard University, Cambridge, MA, USA
ABSTRACT
Planktonic sulfur bacteria growing in zones of photic zone euxinia (PZE) are important primary producers in
stratified, sulfur-rich environments. The potential for export and burial of microbial biomass from anoxic
photic zones remains relatively understudied, despite being of fundamental importance to interpreting the
geologic record of bulk total organic carbon (TOC) and individual lipid biomarkers. Here we report the rela-
tive concentrations and carbon isotope ratios of lipid biomarkers from the water column and sediments of
meromictic Mahoney Lake. The data show that organic matter in the central basin sediments is indistin-
guishable from material at the lake shoreline in both its lipid and carbon isotopic compositions. However,
this material is not consistent with either the lipid profile or carbon isotope composition of biomass
obtained directly from the region of PZE. Due to the strong density stratification and the intensive carbon
and sulfur recycling pathways in the water column, there appears to be minimal direct export of the sulfur-
oxidizing planktonic community to depth. The results instead suggest that basinal sediments are sourced
via the littoral environment, a system that integrates an indigenous shoreline microbial community, the
degraded remains of laterally rafted biomass from the PZE community, and detrital remains of terrigenous
higher plants. Material from the lake margins appears to travel downslope, traverse the strong density gra-
dient, and become deposited in the deep basin; its final composition may be largely heterotrophic in origin.
This suggests an important role for clastic and/or authigenic minerals in aiding the burial of terrigenous and
mat-derived organic matter in euxinic systems. Downslope or mineral-aided transport of anoxygenic, pho-
toautotrophic microbial mats may have been a significant sedimentation process in early Earth history.
Received 11 February 2014; accepted 29 July 2014
Corresponding author: A. Pearson. Tel.: +1 617 384 8392; fax: +1 617 495 8839; e-mail: pearson@eps.
harvard.edu
INTRODUCTION
To understand the evolution of Earth’s redox cycles, it is
critical to understand the mechanisms that establish, main-
tain, and record the geologic history of marine euxinia—
including its temporal and spatial scales (Meyer & Kump,
2008; Ozaki & Tajika, 2013), as well as its biomarker
record to sediments (Grice et al., 2005; Brocks & Schaef-
fer, 2008; Meyer et al., 2011; French et al., 2014). The
carotenoid okenone and its degradation product, okenane,
are biomarkers for euxinic conditions due to their taxo-
nomically specific source from sulfide-oxidizing, photo-
trophic bacteria [purple sulfur bacteria (PSB)]. This
compound is found definitively only in planktonic species
of PSB (Brocks & Schaeffer, 2008), although there also is
debate about possible microbial mat sources (e.g., Meyer
et al., 2011). To examine processes controlling the delivery
of organic matter to sediments in euxinic systems—includ-
ing okenone and other lipids—we extracted and analyzed
biomarkers from stratified Mahoney Lake, British
Columbia, Canada. Modern analogues such as meromictic
lakes are useful for their compact redox gradients and
dense chemocline microbial communities, offering end-
member scenarios for the processes operating in sulfidic
systems.
Mahoney Lake is a small lake (surface area, 11.5 ha;
maximum depth, 14.5 m; Overmann, 1997) with an oligo-
trophic mixolimnion overlying a permanently stratified
monimolimnion that contains extremely high concentra-
tions of sulfate and sulfide (Northcote & Hall, 1983). The
chemocline is maintained near 7 m depth throughout the
year, where it supports the densest population of PSB
(Chromatiaceae) ever measured (bacteriochlorophyll
a > 20 mg l�1; Overmann et al., 1991). The dominant
© 2014 John Wiley & Sons Ltd 1
Geobiology (2014) DOI: 10.1111/gbi.12099
species in this layer had been believed to be the photoauto-
troph Lamprocystis purpurea (formerly Amoebobacter
purpureus; Overmann et al., 1991), but companion
analyses to this work now show that the major organism is
closely related to Thiohalocapsa spp., rather than to the
genera Lamprocystis or Amoebobacter (Klepac-Ceraj et al.,
2012; Hamilton et al., 2014).
In addition to photoautotrophy, autotrophic sulfide and
sulfur oxidation and extensive sulfate reduction complete
the sulfur and carbon cycles in the chemocline (Overmann,
1997; Hamilton et al., 2014). Measurements of exported
sulfur—which accumulates intracellularly in Chromatiaceae
—show that <0.2% of the upwelling flux of sulfur (as H2S
and SO2�4 ) sinks from the chemocline as S0 (Overmann
et al., 1996a). Instead, it has been proposed that this sys-
tem loses its organic matter through a combination of in
situ respiration, plus upwards-vertical and lateral rafting of
organic debris (Overmann et al., 1994, 1996b). Lateral
rafting brings planktonic material to the shoreline, where it
is deposited among a well-developed microbial mat com-
munity. The littoral sediments are a mixture of this
degraded material, plus organic matter and weathering
products from the surrounding landscape, including clastic
mineral debris as well as authigenic mineral formations
(visible salt crusts; the major lake ions are Mg2+, Ca2+,
Na+, SO2�4 , and CO2�
3 ; Northcote & Hall, 1983). The
shoreline mats also host their own population of PSB,
including (but possibly not limited to) the cultured species
Thiorhodovibrio winogradskyi, which has higher oxygen,
salinity, and phototolerance than typical planktonic Chro-
matiaceae spp. (Overmann et al., 1992).
Sedimentary evidence shows that euxinia has predomi-
nated in Mahoney Lake for at least 9 Kyr (Lowe et al.,
1997; Coolen & Overmann, 1998). Although direct
export of the PSB community to sediments is very low, it
is commonly believed that much of the organic matter
buried in the deep lake sediments ultimately does originate
from the biomass-rich chemocline. Evidence includes the
presence in sediments of the carotenoid biomarker, oke-
none (Coolen & Overmann, 1998). However, it remains
unclear how (or if) the planktonic PSB layer of Mahoney
Lake physically reaches the lake-bottom sediments to be
preserved. PSB primary production generally does not
enter macrobiotic ecosystems (Fry, 1986); in addition,
Mahoney Lake is eukaryote-poor, including being free of
fish (Northcote & Halsey, 1969).
Because of these many unusual characteristics, Mahoney
Lake has been proposed as a modern analogue for Earth
systems that may have been sulfidic into the shallow photic
zone (Canfield & Teske, 1996; Brocks et al., 2005; Meyer
& Kump, 2008; Lyons & Reinhard, 2009), including
environments in which sulfidic photic zones intercept shal-
low, sulfide-oxidizing mats (Meyer et al., 2011; Voorhies
et al., 2012). Here we use lipid distributions and
compound-specific d13C analyses to resolve the sources
and processes governing organic matter burial in Mahoney
Lake.
METHODS
Samples, lipid extraction
Water samples from 7 m and 8 m depth in Mahoney Lake
(49°170N, 119°350W), a grab core of the underlying lake
sediment (15 m depth), and a sample of shoreline micro-
bial mat were collected in July 2008 and stored on dry ice
(�70 °C) as reported previously (Klepac-Ceraj et al.,
2012; Hamilton et al., 2014). Upon return to laboratory,
water samples were centrifuged in 50-ml Falcon tubes to
pellet biomass; all samples subsequently were stored at
�80 °C until use. Glassware was combusted (450 °C,6 h), and all Teflon caps, stopcocks, and syringes were
rinsed with methanol (MeOH), dichloromethane (DCM),
and hexane. Water was Nanopure� grade, and solvents
were Burdick & Jackson GC2 or equivalent.
Total lipid extracts (TLEs) of each sample were obtained
using a modified Bligh and Dyer extraction (Bligh & Dyer,
1959; Nishihara & Koga, 1987). Five grams of shoreline
and lake-bottom sediment or 0.24 g of 7 m and 8 m bio-
mass were extracted in 1:2:0.8 chloroform:MeOH:H2O,
where the H2O contained 0.5% trichloroacetic acid. Each
sample was sonicated and vortexed (3 9 5 min) with
5 min on ice (0 °C) between each round. Phase separation
was achieved by changing the solvent ratio to 1:1:0.8. The
organic layer was removed, and the aqueous layer was
extracted again with chloroform. The combined extracts
were washed against 1 M NaCl and H2O, and the resulting
TLEs were dried under N2(g) with Na2SO4 added to
remove residual water. TLEs (in DCM) were desulfurized
in columns containing 2 g Na2SO4 plus 10 g HCl-
activated copper pellets. Each TLE was dried just to com-
pleteness and weighed.
Total lipid extracts were separated into polarity fractions
on columns containing 15 ml of silica gel (70–230 mesh).
Fractions were eluted with two column volumes of the fol-
lowing (modified from Pearson et al., 2001): hexane (A),
5% ethyl acetate (EtOAc) in hexane (B), 15% EtOAc in hex-
ane (C), 20% EtOAc in hexane (D), 25% EtOAc in hexane
(E), 75% EtOAc and 25% MeOH (F), and MeOH (G).
Fractions were stored at �20 °C until they were analyzed.
Additional aliquots of 7 m PSB biomass, lake-bottom
sediment, and shoreline material were extracted by sonica-
tion sequentially with DCM and acetone in the dark to
yield lipid extracts suitable for pigment analysis. The sam-
ples were acidified by the dropwise addition of 12 N HCl
to remove carbonate and quantitatively convert porphyrins
to pheophytins to simplify analysis. Water was removed by
Na2SO4, and the pigment extracts were redissolved in
© 2014 John Wiley & Sons Ltd
2 R. J. BOVEE AND A. PEARSON
acetone and filtered through 0.45-lm PTFE syringe filters
before analysis. Extracts were stored at 4 °C and analyzed
within 1 week of extraction.
Gas chromatography–mass spectrometry
For analysis of sterols and n-alcohols, trimethylsilyl (TMS)
derivatives were prepared from fractions C, D, and E using
equal parts pyridine and bis(trimethylsilyl)trifluoroaceta-
mide (BSTFA) containing 1% trimethylchlorosilane. These
derivatives were analyzed relative to injections of a quanti-
tative external standard (stigmasterol) on an Agilent (Santa
Clara, CA, USA) 6890N gas chromatograph with a
30 m 9 0.25 mm 9 0.25 lm Agilent DB-5MS column
coupled to an Agilent 5973 mass spectrometer (GC-MS).
The programmable temperature vaporization (PTV) inlet
of the instrument was maintained at 112 °C for 0.85 min,
then ramped to 320 °C (720 °C min�1), held for
2.35 min, and ramped to 450 °C (720 °C min�1; hold
5 min). Simultaneously, the oven was maintained at
112 °C for 2 min, ramped to 130 °C (20 °C min�1), then
to 280 °C (6 °C min�1), then 320 °C (3 °C min�1; hold
25 min). Helium carrier gas flow rate was 1.2 ml min�1,
the MS transfer line was held at 300 °C, and the mass
spectrometer scanned m/z 50–750 at 70 eV.
For analysis of fatty acids derived from intact polar lipids
(IPLs), 50% of fractions F and G were transesterified with
known d13C MeOH containing 5% HCl (4 h, 70 °C).Fatty acid methyl esters (FAMEs) were extracted using 9:1
hexane: DCM and analyzed by GC-MS. The GC-MS pro-
gramme was identical to the TMS-derivative programme,
but with starting temperatures of 65 °C and a carrier gas
flow rate of 1.4 ml min�1. External standards of nonadeca-
noic acid FAME (C19:0-FAME) were used to prepare
calibration curves for quantitation; the response factor was
linear over the range of reported sample peaks.
All compounds were identified, integrated, and quanti-
fied using AMDIS (Stein, 1999). Detection limits
(3 9 signal/noise) for FAMEs and sterols were 0.36 ng
and 2.16 ng, respectively, as calculated from external stan-
dards; n-alcohols were assumed to have the same response
as sterols. This translates into FAME detection limits of ca.
0.1 ng mg�1 TLE for the sediment and 7 m samples,
0.5 ng mg�1 TLE for the 8 m sample, and 24 pg mg�1
TLE for the shoreline sample.
Compound-specific carbon isotope analysis
For analysis of d13C values, FAMEs were run on a Thermo
Trace Ultra GC (60 m 9 0.32 mm 9 0.25 lm Agilent
DB5-MS column) with a GC Isolink combustion interface
coupled to a Thermo Delta V isotope ratio mass spectrom-
eter (GC-C-IRMS). The injector was operated in splitless
mode at 220 °C. The oven programme was 60 °C, then
10 °C min�1 to 145 °C, 2.7 °C min�1 to 230 °C,5 °C min�1 to 275 °C, and 7 °C min�1 to 310 °C (5-min
hold). Helium carrier gas flow rate was 1.2 ml min�1, and
compounds were combusted at 980 °C to CO2. An alkane
(n-C32) of known d13C value (http://geology.indiana.
edu/schimmelmann/) was co-injected as an internal stan-
dard, and each chromatogram was bracketed by CO2 refer-
ence gas pulses. Isotope chromatograms were integrated in
Isodat 3.0 using default settings. Values of d13C from
the CO2 reference gas were used to correct all compound-
specific d13C values for instrumental drift, assuming a
linear trend with time. Peaks with amplitudes <0.5 V or
>10 V (m/z 44) were eliminated due to nonlinear m/z 44
responses. Remaining minor, but statistically significant,
size-dependent biasing effects on d13C values were
removed using a linear model in which dilution-series data
from external FAME standards of C16:0, C19:0, and C24:0
run on the same day were fitted using least-squares
approaches (calculated using the lm and predict functions
in the R statistical package). Finally, isotope mass balance
was used to correct for the derivative methyl carbon.
Bulk values of d13C were obtained on acidified (10%
HCl, 4 h, 60 °C) aliquots of biomass or sediment prepared
in tin capsules (Costech 5 9 9 mm). Measurements were
made at the MBL Stable Isotope Lab (http://dryas.mbl.
edu/silab/) and reported relative to the VPDB standard.
Pigment analysis
Pigment extracts were analyzed on an Agilent model 1290
ultra-high-pressure liquid chromatography with model
6410 triple quadrupole mass spectrometer (UHPLC-
QQQ) following the ‘A’ method of Airs et al. (2001) and
using 0.5 M ammonium acetate as the ion-pairing reagent
A. Solvents B, C, and D were methanol, acetonitrile, and
ethyl acetate, respectively, and the gradient proceeded from
5/80/15/0% to 0/20/15/65% A/B/C/D over 95 min
with an initial isocratic hold of 5 min. The flow rate was
0.5 ml min�1, and three Kinetex C18 phase
(150 9 4.6 mm, 2.6-lm particles) columns were used in
series. Runs were monitored by ultraviolet-visible diode
array detector (DAD) and by mass spectrometry with
atmospheric pressure chemical ionization (APCI) in posi-
tive ion mode. Ionization parameters were chosen to
reduce in-source fragmentation of okenone: vaporizer tem-
perature 300 °C, drying gas flow 4 l min�1 at 300 °C,nebulizer pressure 40 psi, fragmentation 135 V, and colli-
sion chamber 20 V. Compounds were identified by relative
retention times, by their UV-visible spectra, and by their
mass spectral fragmentation patterns, including MS2 transi-
tions and molecular ion masses, M+ (Airs et al., 2001;
Romero-Viana et al., 2009). All peak areas were deter-
mined by integration of the molecular ion trace in Agilent
Masshunter. As we did not have authentic pheophytin or
© 2014 John Wiley & Sons Ltd
Sedimentary lipid biomarkers in a meromictic lake 3
carotenoid standards, the reported abundances are semi-
quantitative.
RESULTS
Fatty acids
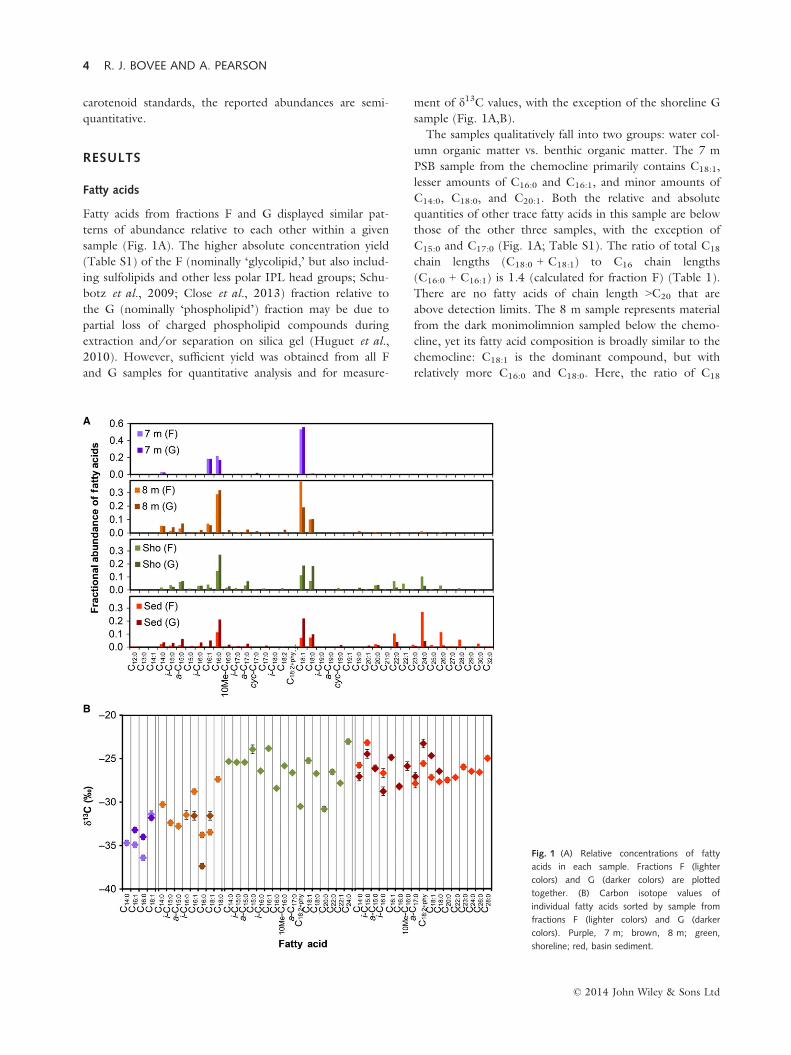
Fatty acids from fractions F and G displayed similar pat-
terns of abundance relative to each other within a given
sample (Fig. 1A). The higher absolute concentration yield
(Table S1) of the F (nominally ‘glycolipid,’ but also includ-
ing sulfolipids and other less polar IPL head groups; Schu-
botz et al., 2009; Close et al., 2013) fraction relative to
the G (nominally ‘phospholipid’) fraction may be due to
partial loss of charged phospholipid compounds during
extraction and/or separation on silica gel (Huguet et al.,
2010). However, sufficient yield was obtained from all F
and G samples for quantitative analysis and for measure-
ment of d13C values, with the exception of the shoreline G
sample (Fig. 1A,B).
The samples qualitatively fall into two groups: water col-
umn organic matter vs. benthic organic matter. The 7 m
PSB sample from the chemocline primarily contains C18:1,
lesser amounts of C16:0 and C16:1, and minor amounts of
C14:0, C18:0, and C20:1. Both the relative and absolute
quantities of other trace fatty acids in this sample are below
those of the other three samples, with the exception of
C15:0 and C17:0 (Fig. 1A; Table S1). The ratio of total C18
chain lengths (C18:0 + C18:1) to C16 chain lengths
(C16:0 + C16:1) is 1.4 (calculated for fraction F) (Table 1).
There are no fatty acids of chain length >C20 that are
above detection limits. The 8 m sample represents material
from the dark monimolimnion sampled below the chemo-
cline, yet its fatty acid composition is broadly similar to the
chemocline: C18:1 is the dominant compound, but with
relatively more C16:0 and C18:0. Here, the ratio of C18
A
B
Fig. 1 (A) Relative concentrations of fatty
acids in each sample. Fractions F (lighter
colors) and G (darker colors) are plotted
together. (B) Carbon isotope values of
individual fatty acids sorted by sample from
fractions F (lighter colors) and G (darker
colors). Purple, 7 m; brown, 8 m; green,
shoreline; red, basin sediment.
© 2014 John Wiley & Sons Ltd
4 R. J. BOVEE AND A. PEARSON
chain lengths (C18:0 + C18:1 + C18:2) to C16 chain lengths
(C16:0 + C16:1 + iso-C16:0) is 1.3. At 8 m, there also are
detectable fatty acids of chain length >C20, including
minor amounts of C20:0. C22:0, C24:0, and C26:0 (maximum
at C24:0). The ratio of C24:0 to the sum of all C16 chain
lengths, however, is only 0.015, indicating that both the
7 m and 8 m samples primarily consist of C16 and C18
fatty acids.
The shoreline and sediment samples quantitatively and
qualitatively have a greater diversity of fatty acids (Fig. 1A;
Fig. S1; Table S1), with both having almost twice as many
detectable components as the 7 m and 8 m samples. The
sediment sample contains a regular series of longer chain
fatty acids with a strong even-over-odd predominance
(≥C20 evens:odds = 13; Table 1) and a maximum at C24:0.
In the sediment, C18:1, C18:0, and C16:0 fatty acids are
approximately equally abundant, and the ratio of total C18
chain lengths to C16 chain lengths is 1.2 (Table 1). The
longer chain components dominate this sample, and the
ratio of C24:0 to the sum of all C16 chain lengths is 1.0.
The shoreline sample qualitatively resembles the basinal
sediment. It contains the regular series of longer chain
fatty acids, also with a maximum at C24:0. C16:0 is the
dominant shorter chain compound, although C18:1 and
C18:0 are also major components. The ratio of total C18
chain lengths to C16 chain lengths is 0.82, and the ratio of
C24:0 to the sum of C16 chain lengths is 0.24.
Specific bacterial fatty acids are widespread in all samples.
The lipid 10-methyl-C16:0 is characteristic of anoxic sulfur
cycling, being a common component of sulfate reducers
such as Desulfobacter spp. (Taylor & Parkes, 1983). It was
detectable in all samples except the 7 m sample, and its rel-
ative abundance was highest in the shoreline (Fig. 1A;
Table S1). All samples also contained detectable quantities
of the bacterial lipids iso- and anteiso-C15:0, and most con-
tained iso- and anteiso-C17:0 as well. These lipids tend to
be common in heterotrophic, gram-positive bacteria such
as Firmicutes (Kaneda, 1991) and are thought in some
cases to be synthesized de novo in anoxic systems (Li et al.,
2009). These components were fractionally most abundant
in the shoreline sample (ratio of branched C15 compounds
to C16:0 of 0.67; Table 1) with lesser amounts in the 8 m
and sediment samples (branched C15 to C16:0 ratios of
0.18 and 0.22, respectively). Polyunsaturated fatty acids
were not detected in any sample.
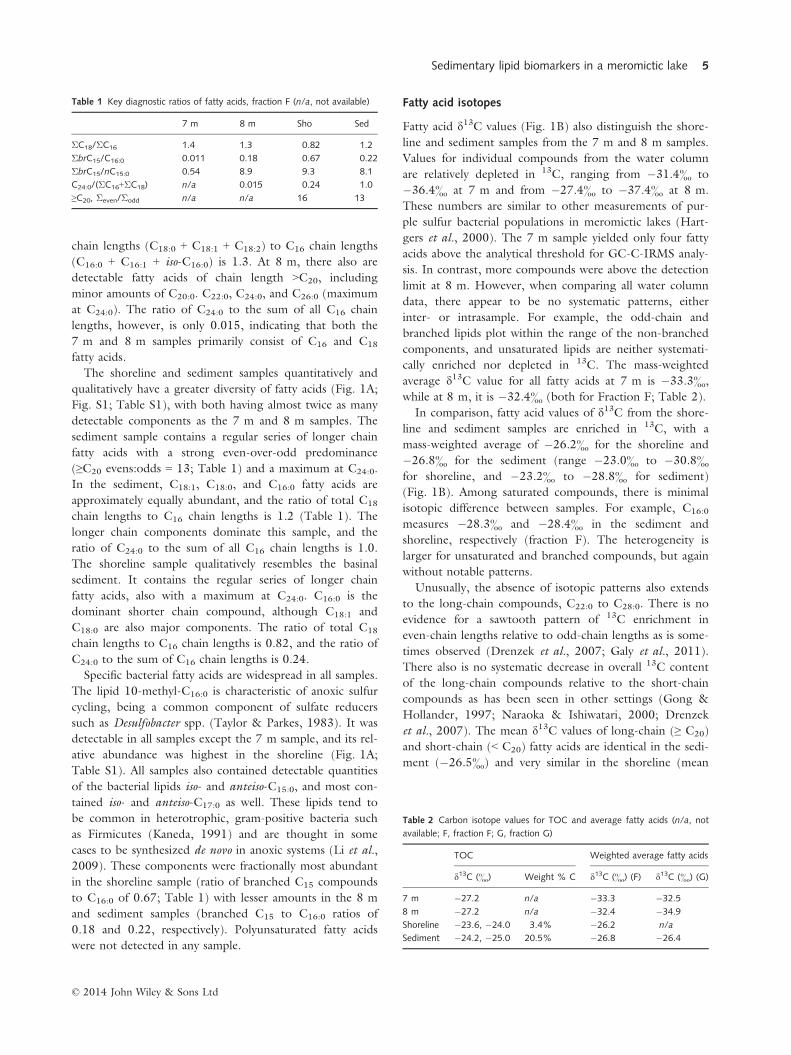
Fatty acid isotopes
Fatty acid d13C values (Fig. 1B) also distinguish the shore-
line and sediment samples from the 7 m and 8 m samples.
Values for individual compounds from the water column
are relatively depleted in 13C, ranging from �31.4& to
�36.4& at 7 m and from �27.4& to �37.4& at 8 m.
These numbers are similar to other measurements of pur-
ple sulfur bacterial populations in meromictic lakes (Hart-
gers et al., 2000). The 7 m sample yielded only four fatty
acids above the analytical threshold for GC-C-IRMS analy-
sis. In contrast, more compounds were above the detection
limit at 8 m. However, when comparing all water column
data, there appear to be no systematic patterns, either
inter- or intrasample. For example, the odd-chain and
branched lipids plot within the range of the non-branched
components, and unsaturated lipids are neither systemati-
cally enriched nor depleted in 13C. The mass-weighted
average d13C value for all fatty acids at 7 m is �33.3&,
while at 8 m, it is �32.4& (both for Fraction F; Table 2).
In comparison, fatty acid values of d13C from the shore-
line and sediment samples are enriched in 13C, with a
mass-weighted average of �26.2& for the shoreline and
�26.8& for the sediment (range �23.0& to �30.8&for shoreline, and �23.2& to �28.8& for sediment)
(Fig. 1B). Among saturated compounds, there is minimal
isotopic difference between samples. For example, C16:0
measures �28.3& and �28.4& in the sediment and
shoreline, respectively (fraction F). The heterogeneity is
larger for unsaturated and branched compounds, but again
without notable patterns.
Unusually, the absence of isotopic patterns also extends
to the long-chain compounds, C22:0 to C28:0. There is no
evidence for a sawtooth pattern of 13C enrichment in
even-chain lengths relative to odd-chain lengths as is some-
times observed (Drenzek et al., 2007; Galy et al., 2011).
There also is no systematic decrease in overall 13C content
of the long-chain compounds relative to the short-chain
compounds as has been seen in other settings (Gong &
Hollander, 1997; Naraoka & Ishiwatari, 2000; Drenzek
et al., 2007). The mean d13C values of long-chain (≥ C20)
and short-chain (< C20) fatty acids are identical in the sedi-
ment (�26.5&) and very similar in the shoreline (mean
Table 1 Key diagnostic ratios of fatty acids, fraction F (n/a, not available)
7 m 8 m Sho Sed
ΣC18/ΣC16 1.4 1.3 0.82 1.2
ΣbrC15/C16:0 0.011 0.18 0.67 0.22
ΣbrC15/nC15:0 0.54 8.9 9.3 8.1
C24:0/(ΣC16+ΣC18) n/a 0.015 0.24 1.0
≥C20, Σeven/Σodd n/a n/a 16 13
Table 2 Carbon isotope values for TOC and average fatty acids (n/a, not
available; F, fraction F; G, fraction G)
TOC Weighted average fatty acids
d13C (&) Weight % C d13C (&) (F) d13C (&) (G)
7 m �27.2 n/a �33.3 �32.5
8 m �27.2 n/a �32.4 �34.9
Shoreline �23.6, �24.0 3.4% �26.2 n/a
Sediment �24.2, �25.0 20.5% �26.8 �26.4
© 2014 John Wiley & Sons Ltd
Sedimentary lipid biomarkers in a meromictic lake 5
long-chain d13C value: �27.0&; mean short-chain d13Cvalue: �26.1&).
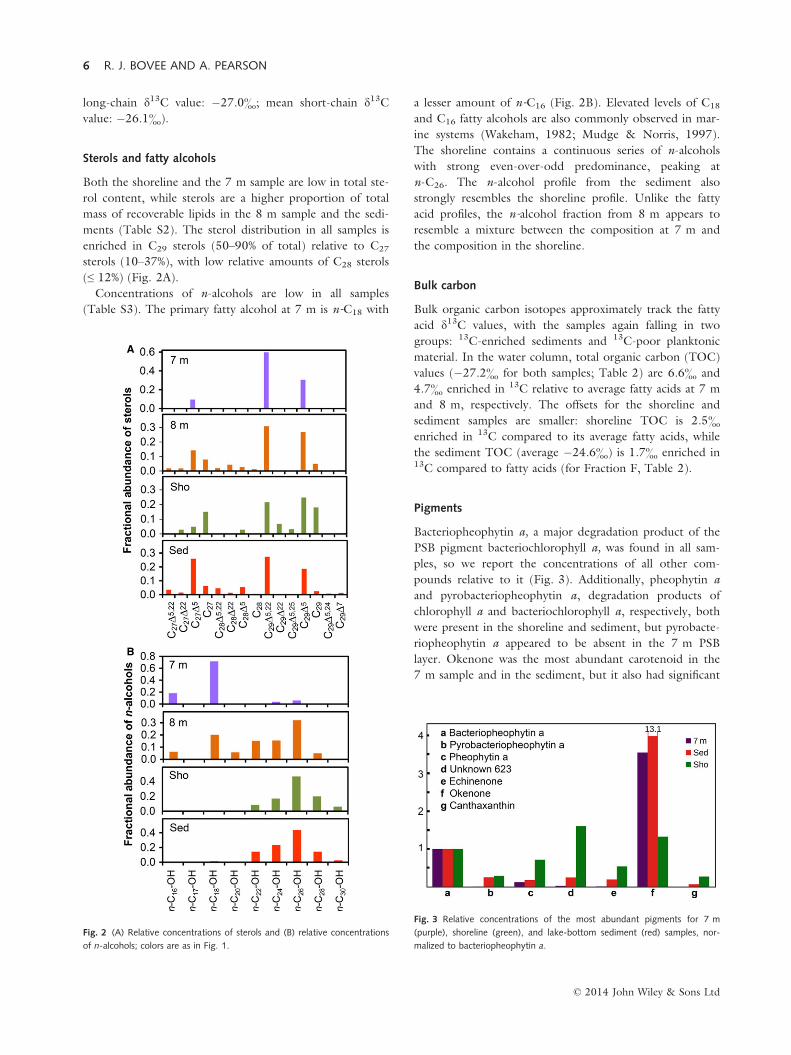
Sterols and fatty alcohols
Both the shoreline and the 7 m sample are low in total ste-
rol content, while sterols are a higher proportion of total
mass of recoverable lipids in the 8 m sample and the sedi-
ments (Table S2). The sterol distribution in all samples is
enriched in C29 sterols (50–90% of total) relative to C27
sterols (10–37%), with low relative amounts of C28 sterols
(≤ 12%) (Fig. 2A).
Concentrations of n-alcohols are low in all samples
(Table S3). The primary fatty alcohol at 7 m is n-C18 with
a lesser amount of n-C16 (Fig. 2B). Elevated levels of C18
and C16 fatty alcohols are also commonly observed in mar-
ine systems (Wakeham, 1982; Mudge & Norris, 1997).
The shoreline contains a continuous series of n-alcohols
with strong even-over-odd predominance, peaking at
n-C26. The n-alcohol profile from the sediment also
strongly resembles the shoreline profile. Unlike the fatty
acid profiles, the n-alcohol fraction from 8 m appears to
resemble a mixture between the composition at 7 m and
the composition in the shoreline.
Bulk carbon
Bulk organic carbon isotopes approximately track the fatty
acid d13C values, with the samples again falling in two
groups: 13C-enriched sediments and 13C-poor planktonic
material. In the water column, total organic carbon (TOC)
values (�27.2& for both samples; Table 2) are 6.6& and
4.7& enriched in 13C relative to average fatty acids at 7 m
and 8 m, respectively. The offsets for the shoreline and
sediment samples are smaller: shoreline TOC is 2.5&enriched in 13C compared to its average fatty acids, while
the sediment TOC (average �24.6&) is 1.7& enriched in13C compared to fatty acids (for Fraction F, Table 2).
Pigments
Bacteriopheophytin a, a major degradation product of the
PSB pigment bacteriochlorophyll a, was found in all sam-
ples, so we report the concentrations of all other com-
pounds relative to it (Fig. 3). Additionally, pheophytin a
and pyrobacteriopheophytin a, degradation products of
chlorophyll a and bacteriochlorophyll a, respectively, both
were present in the shoreline and sediment, but pyrobacte-
riopheophytin a appeared to be absent in the 7 m PSB
layer. Okenone was the most abundant carotenoid in the
7 m sample and in the sediment, but it also had significant
A
B
Fig. 2 (A) Relative concentrations of sterols and (B) relative concentrations
of n-alcohols; colors are as in Fig. 1.
Fig. 3 Relative concentrations of the most abundant pigments for 7 m
(purple), shoreline (green), and lake-bottom sediment (red) samples, nor-
malized to bacteriopheophytin a.
© 2014 John Wiley & Sons Ltd
6 R. J. BOVEE AND A. PEARSON
abundance in the shoreline. The most abundant carotenoid
in the shoreline is an unknown with an [M+H]+ ion of
623.3, a fragment at 591.2, and UV-visible maxima of 490
and 518 nm. Echinenone and canthaxanthin also were
detected in the shoreline and sediment, but not in signifi-
cant amounts at 7 m.
DISCUSSION
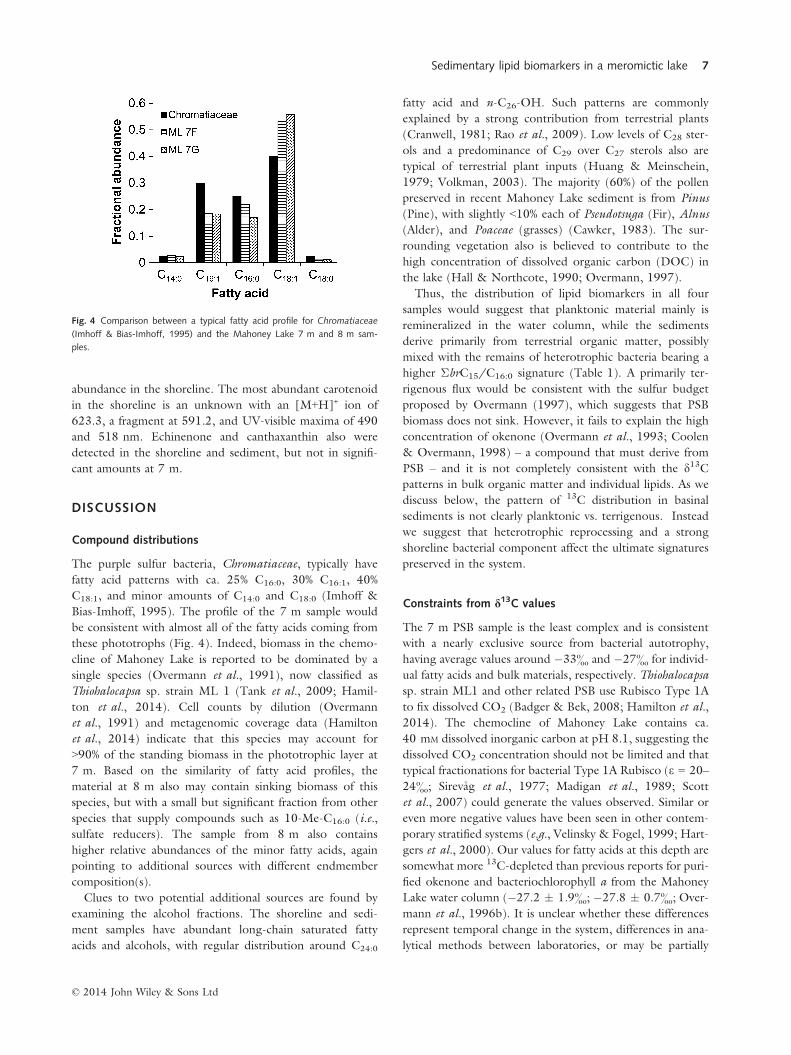
Compound distributions
The purple sulfur bacteria, Chromatiaceae, typically have
fatty acid patterns with ca. 25% C16:0, 30% C16:1, 40%
C18:1, and minor amounts of C14:0 and C18:0 (Imhoff &
Bias-Imhoff, 1995). The profile of the 7 m sample would
be consistent with almost all of the fatty acids coming from
these phototrophs (Fig. 4). Indeed, biomass in the chemo-
cline of Mahoney Lake is reported to be dominated by a
single species (Overmann et al., 1991), now classified as
Thiohalocapsa sp. strain ML 1 (Tank et al., 2009; Hamil-
ton et al., 2014). Cell counts by dilution (Overmann
et al., 1991) and metagenomic coverage data (Hamilton
et al., 2014) indicate that this species may account for
>90% of the standing biomass in the phototrophic layer at
7 m. Based on the similarity of fatty acid profiles, the
material at 8 m also may contain sinking biomass of this
species, but with a small but significant fraction from other
species that supply compounds such as 10-Me-C16:0 (i.e.,
sulfate reducers). The sample from 8 m also contains
higher relative abundances of the minor fatty acids, again
pointing to additional sources with different endmember
composition(s).
Clues to two potential additional sources are found by
examining the alcohol fractions. The shoreline and sedi-
ment samples have abundant long-chain saturated fatty
acids and alcohols, with regular distribution around C24:0
fatty acid and n-C26-OH. Such patterns are commonly
explained by a strong contribution from terrestrial plants
(Cranwell, 1981; Rao et al., 2009). Low levels of C28 ster-
ols and a predominance of C29 over C27 sterols also are
typical of terrestrial plant inputs (Huang & Meinschein,
1979; Volkman, 2003). The majority (60%) of the pollen
preserved in recent Mahoney Lake sediment is from Pinus
(Pine), with slightly <10% each of Pseudotsuga (Fir), Alnus
(Alder), and Poaceae (grasses) (Cawker, 1983). The sur-
rounding vegetation also is believed to contribute to the
high concentration of dissolved organic carbon (DOC) in
the lake (Hall & Northcote, 1990; Overmann, 1997).
Thus, the distribution of lipid biomarkers in all four
samples would suggest that planktonic material mainly is
remineralized in the water column, while the sediments
derive primarily from terrestrial organic matter, possibly
mixed with the remains of heterotrophic bacteria bearing a
higher ΣbrC15/C16:0 signature (Table 1). A primarily ter-
rigenous flux would be consistent with the sulfur budget
proposed by Overmann (1997), which suggests that PSB
biomass does not sink. However, it fails to explain the high
concentration of okenone (Overmann et al., 1993; Coolen
& Overmann, 1998) – a compound that must derive from
PSB – and it is not completely consistent with the d13Cpatterns in bulk organic matter and individual lipids. As we
discuss below, the pattern of 13C distribution in basinal
sediments is not clearly planktonic vs. terrigenous. Instead
we suggest that heterotrophic reprocessing and a strong
shoreline bacterial component affect the ultimate signatures
preserved in the system.
Constraints from d13C values
The 7 m PSB sample is the least complex and is consistent
with a nearly exclusive source from bacterial autotrophy,
having average values around �33& and �27& for individ-
ual fatty acids and bulk materials, respectively. Thiohalocapsa
sp. strain ML1 and other related PSB use Rubisco Type 1A
to fix dissolved CO2 (Badger & Bek, 2008; Hamilton et al.,
2014). The chemocline of Mahoney Lake contains ca.
40 mM dissolved inorganic carbon at pH 8.1, suggesting the
dissolved CO2 concentration should not be limited and that
typical fractionations for bacterial Type 1A Rubisco (e = 20–
24&; Sirev�ag et al., 1977; Madigan et al., 1989; Scott
et al., 2007) could generate the values observed. Similar or
even more negative values have been seen in other contem-
porary stratified systems (e.g., Velinsky & Fogel, 1999; Hart-
gers et al., 2000). Our values for fatty acids at this depth are
somewhat more 13C-depleted than previous reports for puri-
fied okenone and bacteriochlorophyll a from the Mahoney
Lake water column (�27.2 � 1.9&; �27.8 � 0.7&; Over-
mann et al., 1996b). It is unclear whether these differences
represent temporal change in the system, differences in ana-
lytical methods between laboratories, or may be partially
Fig. 4 Comparison between a typical fatty acid profile for Chromatiaceae
(Imhoff & Bias-Imhoff, 1995) and the Mahoney Lake 7 m and 8 m sam-
ples.
© 2014 John Wiley & Sons Ltd
Sedimentary lipid biomarkers in a meromictic lake 7
explained by the natural 13C enrichment of ca. 0–3&(Schouten et al., 1998; Hayes, 2001) in isoprenoid lipids
over acetogenic lipids (Schouten et al., 1998). Regardless,
autotrophy appears to dominate the lipids from the water
column, but this signature is not carried to the sediments.
Long-chain fatty acids in the sediments would most
commonly be assigned a higher plant origin. Here, their
d13C values (ca. �26&) argue against any direct or first-
order connection to the 7 m PSB biomass, for example via
early-stage heterotrophy by the few known bacteria that
produce long-chain lipids. In agreement with this argu-
ment, there is only a slight enrichment of 13C observed in
the 8 m fatty acids relative to the 7 m fatty acids (average
value ca. �32& rather than �33&). This is consistent
with minimal heterotrophic reworking of the material
descending from 7 m (DeNiro & Epstein, 1978; Hayes,
1993) and is evidence that the sediment fatty acid concen-
tration pattern and d13C values are not the result of alter-
ation of 7 m and 8 m material within the water column.
The intrasample pattern of compound-specific d13C val-
ues for the sediment also is not fully consistent with over-
printing by a dominant, allochthonous C3 plant
contribution. Although the n-alcohol and sterol abundance
profiles from the sediments are typical of higher plants, we
unfortunately could not measure values of d13C for these
two compound classes, precluding definitive knowledge of
the isotopic composition of the terrigenous endmember.
Values of d13C for Pinus should represent the majority of
this endmember, however, and pine needles and needle lit-
ter in the area have values of �27.2& and 24.5&, respec-
tively (Overmann et al., 1996b). The latter value is a
possible explanation for the 13C-enriched bulk values
observed in shoreline and sediment samples. The total sys-
tem may be fed by detrital plant matter having a 13C-
enriched endmember value typical for moderately arid but
still C3-dominated environments (Brooks et al., 1998; Die-
fendorf et al., 2010). However, fatty acids would be
derived from the primary pine biomass and should retain
the biosynthetic signature, that is, d13C values ca. 3–5&lower than the non-degraded needles (Hayes, 1993). This
would predict terrigenous fatty acid values ca. �31&,
which is inconsistent with the values measured for long-
chain fatty acids in the shoreline and basinal sediment sam-
ples.
Instead, there is no statistical difference between the
observed d13C values for long-chain and shorter chain fatty
acids in the shoreline or sediment samples (< C20 chain
lengths vs. ≥ C20 chain lengths; two-tailed t-test). By con-
trast, in sediments of the Mackenzie Shelf, values of d13Cfor fatty acids show a stepwise decrease from ca. �26&(chain lengths < C20) to ca. �31& (chain lengths ≥C20)
(Drenzek et al., 2007). A similar pattern also is observed
for fatty acids of the nearby Washington Margin (Feng
et al., 2013). Such a bimodal distribution, with 13C-
depleted values for long-chain compounds, is interpreted
to reflect the influence of C3-dominated plant detritus only
at longer-chain lengths. This pattern also would be
expected for Mahoney Lake sediments if the fatty acids
reflected mixed sources. Alternatively, if the lake sediments
contained solely terrigenous lipids, then all compounds
might be expected to have values ca. �31&, not near
�26&. The homogeneous values we observe near �26&argue that all of the fatty acids have the same source –
either from a single type of organism, or from a mixture of
species that are all dependent on the same food source –
but that this material is not directly from C3 plants.
As an alternative, bacteria occasionally have been pro-
posed as a source of long-chain fatty acids (Volkman et al.,
1988; Gong & Hollander, 1997). The most striking exam-
ple, both for its similarity to the profiles observed here, as
well as for its definitive microbial origin, is the profile of
fatty acids extracted from modern ooids (Summons et al.,
2013). Like our samples, the ooids have long-chain fatty
acids with maxima at C24:0, similar proportions of C14-C18
fatty acids, and abundant branched-chain and 10-Me-C16:0
structures. Some bacteria produce long-chain lipids in
other contexts (e.g., heterocyst glycolipids of Cyanobacte-
ria; Gambacorta et al., 1998), but only recently has it been
suggested that long-chain polyketide synthesis pathways
may be widespread among environmental bacteria (Shulse
& Allen, 2011). Direct synthesis by species endogenous to
microbial mat and/or littoral bacterial communities poten-
tially could explain both the Mahoney Lake and the ooid
observations.
The abundant short-chain fatty acids in the shoreline,
especially those that are methylated or have cyclopropyl
moieties, also indicate a significant de novo bacterial contri-
bution to this environment and are a fingerprint for its
contribution to sediments (Perry et al., 1979). Specifically,
the abundance of bacterial i-C15:0 and a-C15:0 (Kaneda,
1991) relative to n-C15:0 fatty acids (ratios of 9.3 and 8.1
in the shoreline and basinal sediment samples, respectively;
Table 1) is even higher than typically reported for bacteri-
ally dominated sediments (4–4.5; Parkes & Taylor, 1983).
This suggests that despite its proximity to surrounding
vegetation, the lipid material in the Mahoney Lake shore-
line is dominated by products of the microbial mat com-
munity (Overmann et al., 1992). This community may be
sustained primarily by rafting PSB biomass, with a second-
ary contribution from degraded plant biomass. This mix-
ture is then recycled and resynthesized by a complex
heterotrophic and autotrophic microbial mat community,
yielding de novo fatty acids (including long-chain acids)
enriched in 13C. Such an argument is consistent with
the ooid hypothesis recently offered by Summons et al.
(2013) and points to a broad importance for bacteria in
reprocessing sedimentary organic matter. Similarly, a shore-
line-basinal link also is consistent with the detection of
© 2014 John Wiley & Sons Ltd
8 R. J. BOVEE AND A. PEARSON
pyrobacteriopheophytin a, echinenone, canthaxanthin, and
the carotenoid Unknown-623 dominantly or exclusively in
these two environments, but not in the 7 m sample. Pyro-
bacteriopheophytin a is a degradation product of bacterio-
chlorophyll a, while Unknown-623 is suspected to be a
degradation product of okenone.
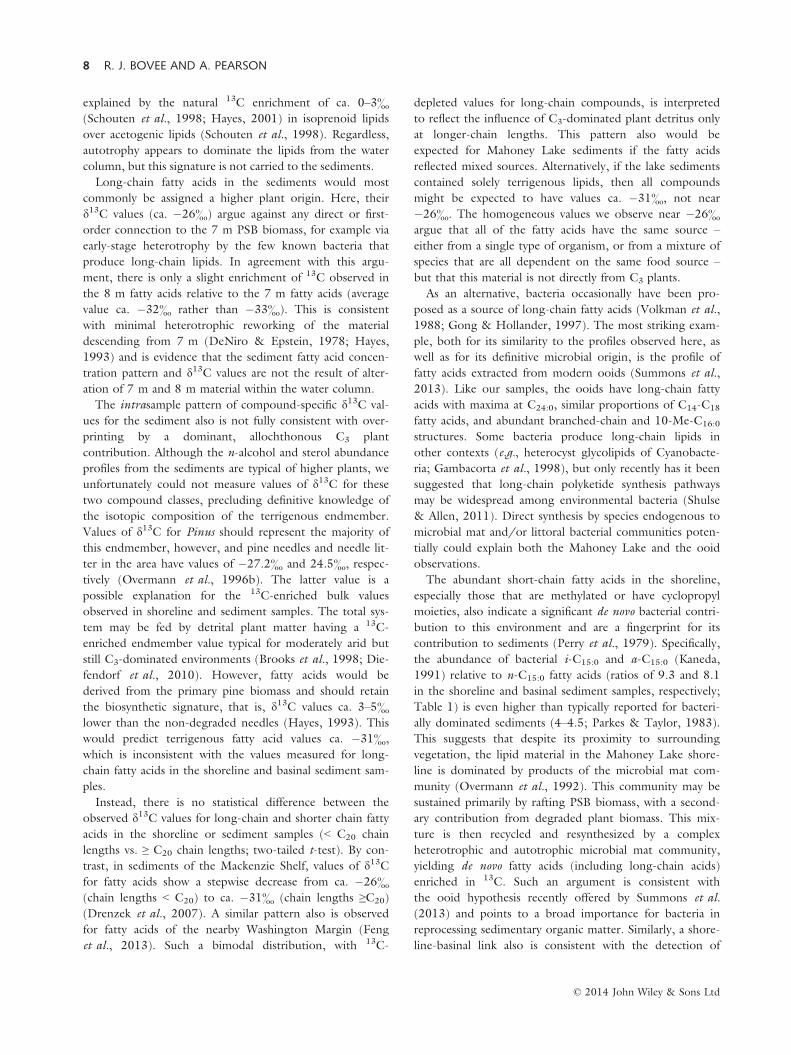
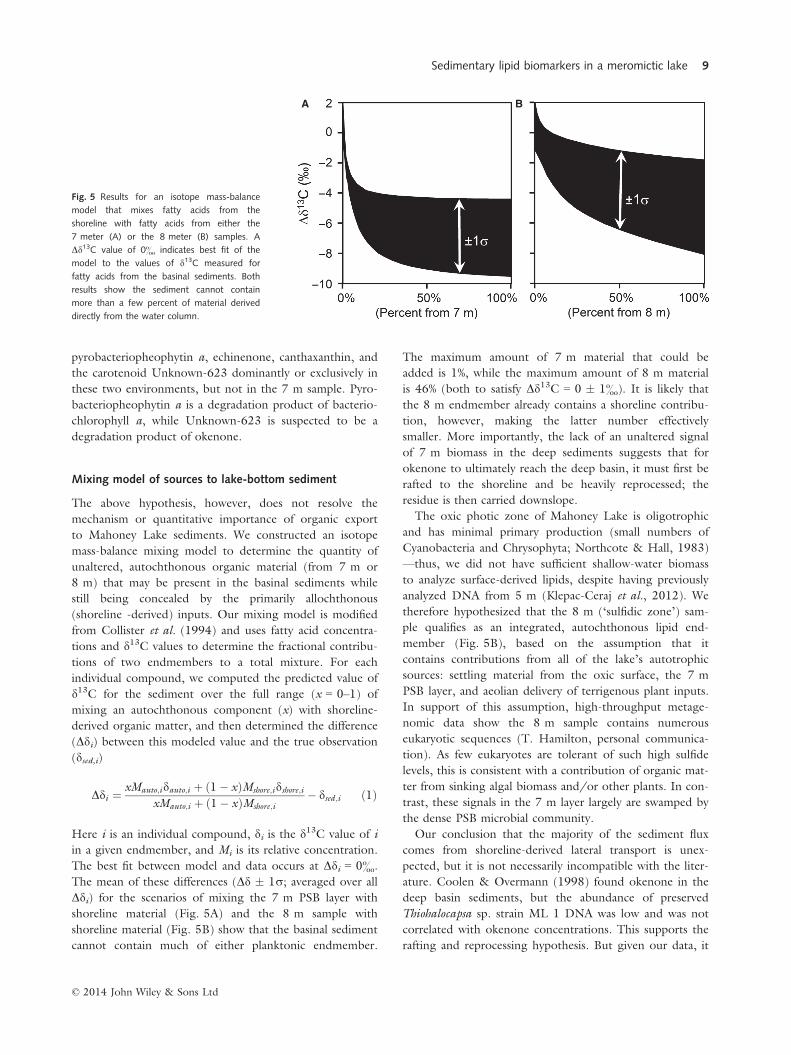
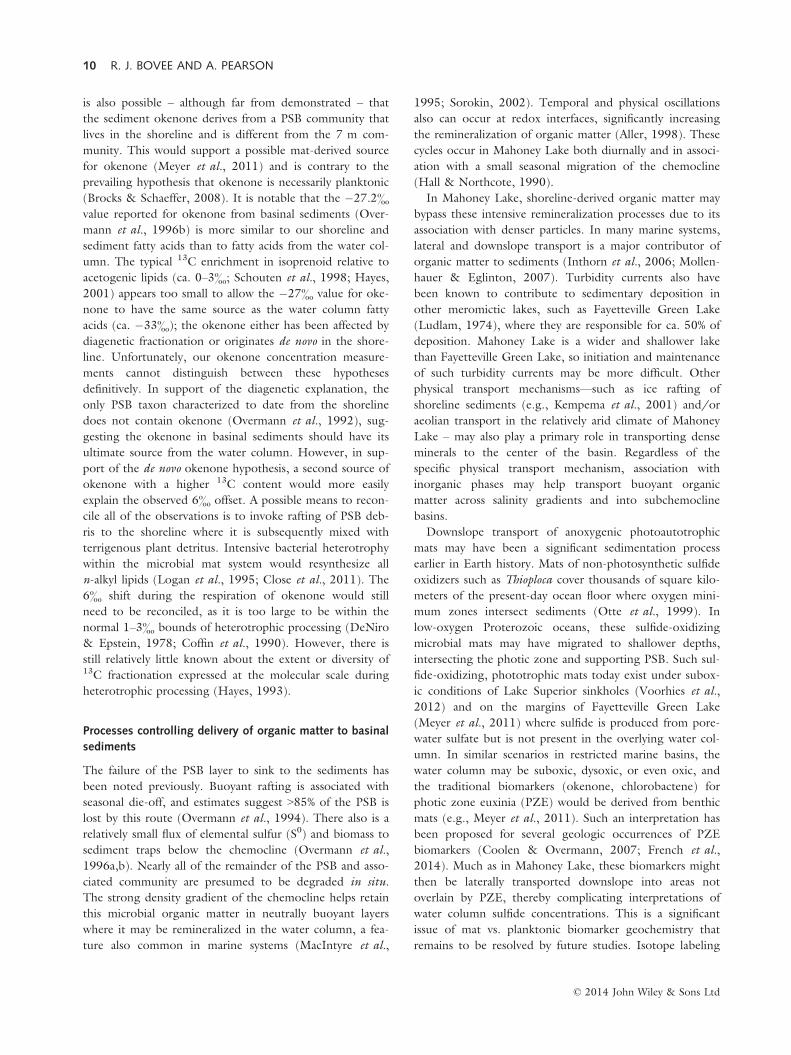
Mixing model of sources to lake-bottom sediment
The above hypothesis, however, does not resolve the
mechanism or quantitative importance of organic export
to Mahoney Lake sediments. We constructed an isotope
mass-balance mixing model to determine the quantity of
unaltered, autochthonous organic material (from 7 m or
8 m) that may be present in the basinal sediments while
still being concealed by the primarily allochthonous
(shoreline -derived) inputs. Our mixing model is modified
from Collister et al. (1994) and uses fatty acid concentra-
tions and d13C values to determine the fractional contribu-
tions of two endmembers to a total mixture. For each
individual compound, we computed the predicted value of
d13C for the sediment over the full range (x = 0–1) of
mixing an autochthonous component (x) with shoreline-
derived organic matter, and then determined the difference
(Ddi) between this modeled value and the true observation
(dsed,i)
Ddi ¼ xMauto;idauto;i þ ð1� xÞMshore;idshore;ixMauto;i þ ð1� xÞMshore;i
� dsed;i ð1Þ
Here i is an individual compound, di is the d13C value of i
in a given endmember, and Mi is its relative concentration.
The best fit between model and data occurs at Ddi = 0&.
The mean of these differences (Dd � 1r; averaged over all
Ddi) for the scenarios of mixing the 7 m PSB layer with
shoreline material (Fig. 5A) and the 8 m sample with
shoreline material (Fig. 5B) show that the basinal sediment
cannot contain much of either planktonic endmember.
The maximum amount of 7 m material that could be
added is 1%, while the maximum amount of 8 m material
is 46% (both to satisfy Dd13C = 0 � 1&). It is likely that
the 8 m endmember already contains a shoreline contribu-
tion, however, making the latter number effectively
smaller. More importantly, the lack of an unaltered signal
of 7 m biomass in the deep sediments suggests that for
okenone to ultimately reach the deep basin, it must first be
rafted to the shoreline and be heavily reprocessed; the
residue is then carried downslope.
The oxic photic zone of Mahoney Lake is oligotrophic
and has minimal primary production (small numbers of
Cyanobacteria and Chrysophyta; Northcote & Hall, 1983)
—thus, we did not have sufficient shallow-water biomass
to analyze surface-derived lipids, despite having previously
analyzed DNA from 5 m (Klepac-Ceraj et al., 2012). We
therefore hypothesized that the 8 m (‘sulfidic zone’) sam-
ple qualifies as an integrated, autochthonous lipid end-
member (Fig. 5B), based on the assumption that it
contains contributions from all of the lake’s autotrophic
sources: settling material from the oxic surface, the 7 m
PSB layer, and aeolian delivery of terrigenous plant inputs.
In support of this assumption, high-throughput metage-
nomic data show the 8 m sample contains numerous
eukaryotic sequences (T. Hamilton, personal communica-
tion). As few eukaryotes are tolerant of such high sulfide
levels, this is consistent with a contribution of organic mat-
ter from sinking algal biomass and/or other plants. In con-
trast, these signals in the 7 m layer largely are swamped by
the dense PSB microbial community.
Our conclusion that the majority of the sediment flux
comes from shoreline-derived lateral transport is unex-
pected, but it is not necessarily incompatible with the liter-
ature. Coolen & Overmann (1998) found okenone in the
deep basin sediments, but the abundance of preserved
Thiohalocapsa sp. strain ML 1 DNA was low and was not
correlated with okenone concentrations. This supports the
rafting and reprocessing hypothesis. But given our data, it
A B
Fig. 5 Results for an isotope mass-balance
model that mixes fatty acids from the
shoreline with fatty acids from either the
7 meter (A) or the 8 meter (B) samples. A
Dd13C value of 0& indicates best fit of the
model to the values of d13C measured for
fatty acids from the basinal sediments. Both
results show the sediment cannot contain
more than a few percent of material derived
directly from the water column.
© 2014 John Wiley & Sons Ltd
Sedimentary lipid biomarkers in a meromictic lake 9
is also possible – although far from demonstrated – that
the sediment okenone derives from a PSB community that
lives in the shoreline and is different from the 7 m com-
munity. This would support a possible mat-derived source
for okenone (Meyer et al., 2011) and is contrary to the
prevailing hypothesis that okenone is necessarily planktonic
(Brocks & Schaeffer, 2008). It is notable that the �27.2&value reported for okenone from basinal sediments (Over-
mann et al., 1996b) is more similar to our shoreline and
sediment fatty acids than to fatty acids from the water col-
umn. The typical 13C enrichment in isoprenoid relative to
acetogenic lipids (ca. 0–3&; Schouten et al., 1998; Hayes,
2001) appears too small to allow the �27& value for oke-
none to have the same source as the water column fatty
acids (ca. �33&); the okenone either has been affected by
diagenetic fractionation or originates de novo in the shore-
line. Unfortunately, our okenone concentration measure-
ments cannot distinguish between these hypotheses
definitively. In support of the diagenetic explanation, the
only PSB taxon characterized to date from the shoreline
does not contain okenone (Overmann et al., 1992), sug-
gesting the okenone in basinal sediments should have its
ultimate source from the water column. However, in sup-
port of the de novo okenone hypothesis, a second source of
okenone with a higher 13C content would more easily
explain the observed 6& offset. A possible means to recon-
cile all of the observations is to invoke rafting of PSB deb-
ris to the shoreline where it is subsequently mixed with
terrigenous plant detritus. Intensive bacterial heterotrophy
within the microbial mat system would resynthesize all
n-alkyl lipids (Logan et al., 1995; Close et al., 2011). The
6& shift during the respiration of okenone would still
need to be reconciled, as it is too large to be within the
normal 1–3& bounds of heterotrophic processing (DeNiro
& Epstein, 1978; Coffin et al., 1990). However, there is
still relatively little known about the extent or diversity of13C fractionation expressed at the molecular scale during
heterotrophic processing (Hayes, 1993).
Processes controlling delivery of organic matter to basinal
sediments
The failure of the PSB layer to sink to the sediments has
been noted previously. Buoyant rafting is associated with
seasonal die-off, and estimates suggest >85% of the PSB is
lost by this route (Overmann et al., 1994). There also is a
relatively small flux of elemental sulfur (S0) and biomass to
sediment traps below the chemocline (Overmann et al.,
1996a,b). Nearly all of the remainder of the PSB and asso-
ciated community are presumed to be degraded in situ.
The strong density gradient of the chemocline helps retain
this microbial organic matter in neutrally buoyant layers
where it may be remineralized in the water column, a fea-
ture also common in marine systems (MacIntyre et al.,
1995; Sorokin, 2002). Temporal and physical oscillations
also can occur at redox interfaces, significantly increasing
the remineralization of organic matter (Aller, 1998). These
cycles occur in Mahoney Lake both diurnally and in associ-
ation with a small seasonal migration of the chemocline
(Hall & Northcote, 1990).
In Mahoney Lake, shoreline-derived organic matter may
bypass these intensive remineralization processes due to its
association with denser particles. In many marine systems,
lateral and downslope transport is a major contributor of
organic matter to sediments (Inthorn et al., 2006; Mollen-
hauer & Eglinton, 2007). Turbidity currents also have
been known to contribute to sedimentary deposition in
other meromictic lakes, such as Fayetteville Green Lake
(Ludlam, 1974), where they are responsible for ca. 50% of
deposition. Mahoney Lake is a wider and shallower lake
than Fayetteville Green Lake, so initiation and maintenance
of such turbidity currents may be more difficult. Other
physical transport mechanisms—such as ice rafting of
shoreline sediments (e.g., Kempema et al., 2001) and/or
aeolian transport in the relatively arid climate of Mahoney
Lake – may also play a primary role in transporting dense
minerals to the center of the basin. Regardless of the
specific physical transport mechanism, association with
inorganic phases may help transport buoyant organic
matter across salinity gradients and into subchemocline
basins.
Downslope transport of anoxygenic photoautotrophic
mats may have been a significant sedimentation process
earlier in Earth history. Mats of non-photosynthetic sulfide
oxidizers such as Thioploca cover thousands of square kilo-
meters of the present-day ocean floor where oxygen mini-
mum zones intersect sediments (Otte et al., 1999). In
low-oxygen Proterozoic oceans, these sulfide-oxidizing
microbial mats may have migrated to shallower depths,
intersecting the photic zone and supporting PSB. Such sul-
fide-oxidizing, phototrophic mats today exist under subox-
ic conditions of Lake Superior sinkholes (Voorhies et al.,
2012) and on the margins of Fayetteville Green Lake
(Meyer et al., 2011) where sulfide is produced from pore-
water sulfate but is not present in the overlying water col-
umn. In similar scenarios in restricted marine basins, the
water column may be suboxic, dysoxic, or even oxic, and
the traditional biomarkers (okenone, chlorobactene) for
photic zone euxinia (PZE) would be derived from benthic
mats (e.g., Meyer et al., 2011). Such an interpretation has
been proposed for several geologic occurrences of PZE
biomarkers (Coolen & Overmann, 2007; French et al.,
2014). Much as in Mahoney Lake, these biomarkers might
then be laterally transported downslope into areas not
overlain by PZE, thereby complicating interpretations of
water column sulfide concentrations. This is a significant
issue of mat vs. planktonic biomarker geochemistry that
remains to be resolved by future studies. Isotope labeling
© 2014 John Wiley & Sons Ltd
10 R. J. BOVEE AND A. PEARSON
experiments or metatranscriptomic analysis of carotenoid
synthesis genes in PSB mats may provide an answer.
Several episodes of Earth history may have such conflict-
ing records that could be explained by the dominant
source of PZE biomarkers being shallow anoxygenic mats
overlain by non-euxinic water columns. Rock records of
the Permo–Triassic boundary contain isorenieratene and
aryl isoprenoids (Grice et al., 2005; Hays et al., 2007), but
atmospheric oxygen levels may not have been notably
lower than today (Knoll et al., 2007). Similarly, Neoprote-
rozoic marine rocks contain okenane, chlorobactene, and
other diagenetic products of anoxygenic photoautotrophs
(Brocks et al., 2005), but iron speciation data suggest the
ocean as a whole may not have been strongly euxinic
(Johnston et al., 2010; Planavsky et al., 2011), pointing
toward the importance of local processes. Our results sug-
gest that biomarker interpretations of photic zone euxinia
in Earth history should be evaluated in the context of local
stratigraphy, lateral transport processes, and the potential
for PZE to intersect with mat-bearing sediments.
ACKNOWLEDGMENTS
The authors would like to thank S.J. Carter, E. Wilkes,
and S. Hurley for laboratory assistance and J. Macalady, T.
Hamilton, K. French, H. Close, and L. Hays for insightful
discussions. We thank W. Gilhooly and T. Lyons for the
Mahoney Lake field program, and T. Bosak and two anon-
ymous reviewers for their helpful comments. This work
was supported by NSF-DEB-1136484, by the Gordon and
Betty Moore Foundation, Grant #3131, and by the NASA
Astrobiology Institute (CAN-6).
REFERENCES
Airs RL, Atkinson JE, Keely BJ (2001) Development and
application of a high resolution liquid chromatographic method
for the analysis of complex pigment distributions. Journal ofChromatography A 917, 167–177.
Aller RC (1998) Mobile deltaic and continental shelf muds as
suboxic, fluidized bed reactors. Marine Chemistry 61,143–155.
Badger MR, Bek EJ (2008) Multiple Rubisco forms in
proteobacteria: their functional significance in relation to CO2
acquisition by the CBB cycle. Journal of Experimental Botany59, 1525.
Bligh EG, Dyer WJ (1959) A rapid method of total lipid
extraction and purification. Canadian Journal of Biochemistryand Physiology 37, 911–917.
Brocks JJ, Schaeffer P (2008) Okenane, a biomarker for purple
sulfur bacteria (Chromatiaceae), and other new carotenoid
derivatives from the 1640 Ma Barney Creek Formation.
Geochimica et Cosmochimica Acta 72, 1396–1414.Brocks JJ, Love GD, Summons RE, Knoll AH, Logan GA,
Bowden SA (2005) Biomarker evidence for green and purple
sulphur bacteria in a stratified Palaeoproterozoic sea. Nature437, 866–870.
Brooks JR, Flanagan LB, Ehleringer JR (1998) Responses of
boreal conifers to climate fluctuations: indications from tree-ring
widths and carbon isotope analyses. Canadian Journal of ForestResearch 28, 524–533.
Canfield DE, Teske A (1996) Late Proterozoic rise in atmospheric
oxygen concentration inferred from phylogenetic and sulphur-
isotope studies. Nature 382, 127–132.Cawker KB (1983) Fire history and grassland vegetation change:three pollen diagrams from southern British Columbia.
Canadian Journal of Botany 61, 1126–1139.Close HG, Bovee R, Pearson A (2011) Inverse carbon isotopepatterns of lipids and kerogen record heterogeneous primary
biomass. Geobiology 9, 250–265.Close HG, Shah SR, Ingalls AE, Diefendorf AF, Brodie EL,
Hansman RL, Freeman KH, Aluwihare LI, Pearson A (2013)Export of submicron particulate organic matter to
mesopelagic depth in an oligotrophic gyre. Proceedings of theNational Academy of Sciences of the USA 110, 12565–12570.
Coffin RB, Velinsky DJ, Devereux R, Price WA, Cifuentes LA
(1990) Stable carbon isotope analysis of nucleic acids to trace
sources of dissolved substrated used by estuarine bacteria.
Applied and Environmental Microbiology 56, 2012–2020.Collister JW, Lichtfouse E, Hieshima G, Hayes JM (1994) Partial
resolution of sources of n-alkanes in the saline portion of the
Parachute Creek Member, Green River Formation (PiceanceCreek Basin, Colorado). Organic Geochemistry 21, 645–659.
Coolen MJL, Overmann J (1998) Analysis of subfossil molecular
remains of purple sulfur bacteria in a lake sediment. Applied andEnvironmental Microbiology 64, 4513–4521.
Coolen MJL, Overmann J (2007) 217 000-year-old DNA
sequences of green sulfur bacteria in Mediterranean sapropels
and their implications for the reconstruction of the
paleoenvironment. Environmental Microbiology 9, 238–249.Cranwell PA (1981) Diagenesis of free and bound lipids in
terrestrial detritus deposited in a lacustrine sediment. OrganicGeochemistry 3, 79–89.
DeNiro MJ, Epstein S (1978) Influence of diet on the distribution
of carbon isotopes in animals. Geochimica et Cosmochimica Acta42, 495–506.
Diefendorf AF, Mueller KE, Wing SL, Koch PL, Freeman KH(2010) Global patterns in leaf 13C discrimination and
implications for studies of past and future climate. Proceedings ofthe National Academy of Sciences of the USA 107, 5738–5743.
Drenzek NJ, Montluc�on DB, Yunker MB, Macdonald RW,Eglinton TI (2007) Constraints on the origin of sedimentary
organic carbon in the Beaufort Sea from coupled molecular 13C
and 14C measurements. Marine Chemistry 103, 146–162.Feng X, Benitez-Nelson BC, Montluc�on DB, Prahl FG, McNichol
AP, Xu L, Repeta DJ, Eglinton TI (2013) 14C and 13C
characteristics of higher plant biomarkers in Washington margin
surface sediments. Geochimica et Cosmochimica Acta 105,14–30.
French KL, Sep�ulveda J, Trabucho-Alexandre J, Gr€ocke DR,
Summons RE (2014) Organic geochemistry of the early
Toarcian oceanic anoxic event in Hawsker Bottoms, Yorkshire,England. Earth and Planetary Science Letters 390, 116–127.
Fry B (1986) Sources of carbon and sulfur nutrition for
consumers in three meromictic lakes of New York State.
Limnology and Oceanography 31, 79–88.Galy V, Eglinton T, France-Lanord C, Sylva S (2011) The
provenance of vegetation and environmental signatures encoded
in vascular plant biomarkers carried by the Ganges-Brahmaputrarivers. Earth and Planetary Science Letters 304, 1–12.
© 2014 John Wiley & Sons Ltd
Sedimentary lipid biomarkers in a meromictic lake 11
Gambacorta A, Pagnotta E, Romano I, Sodano G, Trincone A
(1998) Heterocyst glycolipids from nitrogen-fixing
cyanobacteria other than nostocaceae. Phytochemistry 48,801–805.
Gong C, Hollander DJ (1997) Differential contribution of
bacteria to sedimentary organic matter in oxic and anoxic
environments, Santa Monica Basin, California. OrganicGeochemistry 26, 545–563.
Grice K, Cao C, Love GD, Twitchett RJ, Bottcher M, Grosjean E,
Summons RE, Turgeon SC, Dunning W, Jin Y (2005) Photic
zone euxinia during the Permian-Triassic superanoxic event.Science 307, 706–709.
Hall KJ, Northcote TG (1990) Production and decomposition
processes in a saline meromictic lake. Hydrobiologia 197,115–128.
Hamilton TL, Bovee RJ, Sattin SR, Mohr W, Schaperdoth I,
Gilhooly WP, Lyons TW, Pearson A, Macalady JL (2014)
Coupled reductive and oxidative sulfur cycling in the
phototrophic plate of a meromictic lake. Geobiology 12, 451–468.Hartgers WA, Schouten S, Lopez JF, Sinninghe Damst�e JS,
Grimalt JO (2000) 13C-contents of sedimentary bacterial lipids
in a shallow sulfidic monomictic lake (Lake Cis�o, Spain).
Organic Geochemistry 31, 777–786.Hayes JM (1993) Factors controlling 13C contents of sedimentary
organic compounds: principles and evidence. Marine Geology113, 111–125.
Hayes JM (2001) Fractionation of carbon and hydrogen isotopes
in biosynthetic processes. Reviews in Mineralogy andGeochemistry 43, 225–277.
Hays LE, Beatty T, Henderson CM, Love GD, Summons RE(2007) Evidence for photic zone euxinia through the end-
Permian mass extinction in the Panthalassic Ocean (Peace River
Basin, Western Canada). Palaeoworld 16, 39–50.Huang W-Y, Meinschein WG (1979) Sterols as ecologicalindicators. Geochimica et Cosmochimica Acta 43, 739–745.
Huguet C, Urakawa H, Martens-Habbena W, Truxal L, Stahl DA,
Ingalls AE (2010) Changes in intact membrane lipid content ofarchaeal cells as an indication of metabolic status. OrganicGeochemistry 41, 930–934.
Imhoff J, Bias-Imhoff U (1995) Lipids, quinones and fatty acids
of anoxygenic phototrophic bacteria. In AnoxygenicPhotosynthetic Bacteria. (eds Blankenship R, Madigan M, Bauer
C). Springer, Dordrecht, pp. 179–205.Inthorn M, Wagner T, Scheeder G, Zabel M (2006) Lateral
transport controls distribution, quality, and burial of organicmatter along continental slopes in high-productivity areas.
Geology 34, 205–208.Johnston DT, Poulton SW, Dehler C, Porter S, Husson J,Canfield DE, Knoll AH (2010) An emerging picture of
Neoproterozoic ocean chemistry: Insights from the Chuar
Group, Grand Canyon, USA. Earth and Planetary ScienceLetters 290, 64–73.
Kaneda T (1991) Iso- and anteiso-fatty acids in bacteria:
biosynthesis, function, and taxonomic significance.
Microbiological Reviews 55, 288–302.Kempema EW, Reimnitz E, Barnes PW (2001) Anchor-iceformation and ice rafting in Southwestern Lake Michigan,
U.S.A. Journal of Sedimentary Research 71, 346–354.Klepac-Ceraj V, Hayes CA, Gilhooly WP, Lyons TW, Kolter R,
Pearson A (2012) Microbial diversity under extreme euxinia:Mahoney Lake, Canada. Geobiology 10, 223–235.
Knoll AH, Bambach RK, Payne JL, Pruss S, Fischer WW (2007)
Paleophysiology and end-Permian mass extinction. Earth andPlanetary Science Letters 256, 295–313.
Li C, Sessions AL, Kinnaman FS, Valentine DL (2009)
Hydrogen-isotopic variability in lipids from Santa Barbara Basin
sediments. Geochimica et Cosmochimica Acta 73, 4803–4823.Logan GA, Hayes JM, Hieshima GB, Summons RE (1995)Terminal Proterozoic reorganization of biogeochemical cycles.
Nature 376, 53–56.Lowe DJ, Green JD, Northcote TG, Hall KJ (1997) Holocene
fluctuations of a meromictic lake in southern British Columbia.Quaternary Research 48, 100–113.
Ludlam SD (1974) Fayetteville Green Lake, New York. 6. The
role of turbidity currents in lake sedimentation. Limnology andOceanography 19, 656–664.
Lyons TW, Reinhard CT (2009) An early productive ocean unfit
for aerobics. Proceedings of the National Academy of Sciences ofthe USA 106, 18045–18046.
MacIntyre S, Alldredge AL, Gottschalk CC (1995) Accumulation
of marine snow at density discontinuities in the water column.
Limnology and Oceanography 40, 449–468.Madigan MT, Takigiku R, Lee RG, Gest H, Hayes JM (1989)Carbon isotope fractionation by thermophilic phototrophic sulfur
bacteria: evidence for autotrophic growth in natural populations.
Applied and Environmental Microbiology 55, 639–644.Meyer KM, Kump LR (2008) Oceanic euxinia in Earth history:causes and consequences. Annual Review of Earth andPlanetary Sciences 36, 251–288.
Meyer KM, Macalady JL, Fulton JM, Kump LR, Schaperdoth I,Freeman KH (2011) Carotenoid biomarkers as an imperfect
reflection of the anoxygenic phototrophic community in
meromictic Fayetteville Green Lake. Geobiology 9, 321–329.Mollenhauer G, Eglinton TI (2007) Diagenetic andsedimentological controls on the composition of organic matter
preserved in California Borderland Basin sediments. Limnologyand Oceanography 52, 558–576.
Mudge SM, Norris CE (1997) Lipid biomarkers in the ConwyEstuary (North Wales, U.K.): a comparison between fatty
alcohols and sterols. Marine Chemistry 57, 61–84.Naraoka H, Ishiwatari R (2000) Molecular and isotopicabundances of long-chain n-fatty acids in open marine
sediments of the western North Pacific. Chemical Geology 165,23–36.
Nishihara M, Koga Y (1987) Extraction and composition of polarlipids from the Archaebacterium, Methanobacteriumthermoautotrophicum: effective extraction of tetraether lipids by
an acidified solvent. Journal of Biochemistry 101, 997–1005.Northcote TG, Hall KJ (1983) Limnological contrasts andanomalies in two adjacent saline lakes. Hydrobiologia 105,179–194.
Northcote TG, Halsey TG (1969) Seasonal changes in thelimnology of some meromictic lakes in southern British
Columbia. Journal of the Fisheries Research Board of Canada 26,1763–1787.
Otte S, Kuenen JG, Nielsen LP, Paerl HW, Zopfi J, Schulz HN,Teske A, Strotmann B, Gallardo VA, Jørgensen BB (1999)
Nitrogen, carbon, and sulfur metabolism in natural Thioploca
samples. Applied and Environmental Microbiology 65,3148–3157.
Overmann J (1997) Mahoney Lake: a case study of the ecological
significance of phototrophic sulfur bacteria. In Advances inmicrobial ecology 15. (ed Jones JG). Springer Science, New York,
pp. 251–284.Overmann J, Beatty JT, Hall KJ, Pfennig N, Northcote TG
(1991) Characterization of a dense, purple sulfur bacterial layer
in a meromictic salt lake. Limnology and Oceanography 36,846–859.
© 2014 John Wiley & Sons Ltd
12 R. J. BOVEE AND A. PEARSON
Overmann J, Fischer U, Pfennig N (1992) A new purple sulfur
bacterium from saline littoral sediments, Thiorhodovibriowinogradskyi gen. nov. and sp. nov. Archives of Microbiology157, 329–335.
Overmann Sandmann G, Hall KJ, Northcote TG (1993) Fossil
carotenoids and paleolimnology of meromictic Mahoney Lake,
British Columbia, Canada. Aquatic Sciences 55, 31–39.Overmann J, Thomas Beatty J, Hall KJ (1994) Photosyntheticactivity and population dynamics of Amoebobacter purpureus in
a meromictic saline lake. FEMS Microbiology Ecology 15,309–319.
Overmann J, Beatty JT, Krouse HR, Hall KJ (1996a) The sulfur
cycle in the chemocline of a meromictic salt lake. Limnology andoceanography 41, 147–156.
Overmann J, Beatty JT, Hall KJ (1996b) Purple sulfur bacteriacontrol the growth of aerobic heterotrophic bacterioplankton in
a meromictic salt lake. Applied and Environmental Microbiology62, 3251–3258.
Ozaki K, Tajika E (2013) Biogeochemical effects of atmosphericoxygen concentration, phosphorous weathering, and sea-level
stand on oceanic redox chemistry: implications for greenhouse
climates. Earth and Planetary Science Letters 373, 129–139.Parkes RJ, Taylor J (1983) The relationship between fatty aciddistributions and bacterial respiratory types in contemporary
marine sediments. Estuarine, Coastal and Shelf Science 16,173–174.
Pearson A, McNichol AP, Benitez-Nelson BC, Hayes JM,
Eglinton TI (2001) Origins of lipid biomarkers in Santa Monica
Basin surface sediment: a case study using compound-specific
D14C analysis. Geochimica et Cosmochimica Acta 65,3123–3137.
Perry GJ, Volkman JK, Johns RB, Bavor HJ Jr (1979) Fatty acids
of bacterial origin in contemporary marine sediments.
Geochimica et Cosmochimica Acta 43, 1715–1725.Planavsky NJ, McGoldrick P, Scott CT, Li C, Reinhard CT, Kelly
AE, Chu X, Bekker A, Love GD, Lyons TW (2011) Widespread
iron-rich conditions in the mid-Proterozoic ocean. Nature 477,448–451.
Rao Z, Zhu Z, Jia G, Henderson ACG, Xue Q, Wang S (2009)
Compound specific dD values of long chain n-alkanes derived
from terrestrial higher plants are indicative of the dD ofmeteoric waters: evidence from surface soils in eastern China.
Organic Geochemistry 40, 922–930.Romero-Viana L, Keely BJ, Camacho A, Vicente E, Rosa Miracle
M (2009) Photoautotrophic community changes in Lagunillodel Tejo (Spain) in response to lake level fluctuation: two
centuries of sedimentary pigment records. Organic Geochemistry40, 376–386.
Schouten S, Klein Breteler WCM, Blokker P, Schogt N, Rijpstra
WIC, Grice K, Baas M, Damst�e JSS (1998) Biosynthetic effects
on the stable carbon isotopic compositions of algal lipids:
Implications for deciphering the carbon isotopic biomarkerrecord. Geochimica et Cosmochimica Acta 62, 1397–1406.
Schubotz F, Wakeham SG, Lipp JS, Fredricks HF, Hinrichs K-U
(2009) Detection of microbial biomass by intact polar
membrane lipid analysis in the water column and surfacesediments of the Black Sea. Environmental Microbiology 11,2720–2734.
Scott KM, Henn-Sax M, Harmer TL, Longo DL, Frame CH,
Cavanaugh CM (2007) Kinetic isotope effect and bio-chemicalcharacterization of form IA RubisCO from the marine
cyanobacterium Prochlorococcus marinus MIT9313. Limnologyand Oceanography 52, 2199.
Shulse CN, Allen EE (2011) Diversity and distribution of
microbial long-chain fatty acid biosynthetic genes in the
marine environment. Environmental Microbiology 13,684–695.
Sirev�ag R, Buchanan BB, Berry JA, Troughton JH (1977)
Mechanisms of CO2 fixation in bacterial photosynthesis studied
by the carbon isotope fractionation technique. Archives ofMicrobiology 112, 35–38.
Sorokin II (2002) The Black Sea: Ecology and Oceanography.Backhuys Publishers, Leiden.
Stein SE (1999) An integrated method for spectrum extractionand compound identification from gas chromatography/mass
spectrometry data. Journal of the American Society for MassSpectrometry 10, 770–781.
Summons RE, Bird LR, Gillespie AL, Pruss SB, Roberts M,Sessions AL (2013) Lipid biomarkers in ooids from different
locations and ages: evidence for a common bacterial flora.
Geobiology 11, 420–436.Tank M, Thiel V, Imhoff JF (2009) Phylogenetic relationship ofphototrophic purple sulfur bacteria according to pufL and pufM
genes. International Microbiology 12, 175–185.Taylor J, Parkes RJ (1983) The cellular fatty acids of the sulphate-
reducing bacteria, Desulfobacter sp., Desulfobulbus sp. andDesulfovibrio desulfuricans. Journal of General Microbiology 129,3303–3309.
Velinsky DJ, Fogel ML (1999) Cycling of dissolved andparticulate nitrogen and carbon in the Framvaren Fjord,
Norway: stable isotopic variations. Marine Chemistry 67,161–180.
Volkman J (2003) Sterols in microorganisms. Applied Microbiologyand Biotechnology 60, 495–506.
Volkman JK, Burton HR, Everitt DA, Allen DI (1988) Pigment
and lipid compositions of algal and bacterial communities in
Ace Lake, Vestfold Hills, Antarctica. Hydrobiologia 165,41–57.
Voorhies AA, Biddanda BA, Kendall ST, Jain S, Marcus DN, Nold
SC, Sheldon ND, Dick GJ (2012) Cyanobacterial life at low O2:community genomics and function reveal metabolic versatility
and extremely low diversity in a Great Lakes sinkhole mat.
Geobiology 10, 250–267.Wakeham SG (1982) Organic matter from a sediment trapexperiment in the equatorial north Atlantic: wax esters, steryl
esters, triacylglycerols and alkyldiacylglycerols. Geochimica etCosmochimica Acta 46, 2239–2257.
SUPPORTING INFORMATION
Additional Supporting Information may be found in the
online version of this article:
Fig. S1 The m/z 74 ion chromatograms of GC-MS runs of fractions F from
each sample.
Table S1 Concentrations and carbon isotope values of all measured FAMEs
presented in Fig. 1A,B respectively.
Table S2 Concentrations of sterols presented in Fig. 2A.
Table S3 Concentrations of fatty alcohols presented in Fig. 2B.
© 2014 John Wiley & Sons Ltd
Sedimentary lipid biomarkers in a meromictic lake 13