
STRESS ANALYSIS OF SUBSEA WELLHEAD HOUSING by...
49
STRESS ANALYSIS OF SUBSEA WELLHEAD HOUSING by Muhammad Faris Bin Mohd Pakri (10823) A Project Dissertation submitted in partial fulfilment of the requirements for the Bachelor of Engineering (Hons) (Mechanical Engineering) SEPTEMBER 2011 Universiti Teknologi PETRONAS Bandar Seri Iskandar 31750 Tronoh
Transcript of STRESS ANALYSIS OF SUBSEA WELLHEAD HOUSING by...

STRESS ANALYSIS OF SUBSEA WELLHEAD HOUSING
by
Muhammad Faris Bin Mohd Pakri (10823)
A Project Dissertation submitted in partial fulfilment of
the requirements for the
Bachelor of Engineering (Hons)
(Mechanical Engineering)
SEPTEMBER 2011
Universiti Teknologi PETRONAS
Bandar Seri Iskandar
31750 Tronoh

i
CERTIFICATION OF APPROVAL
STRESS ANALYSIS OF SUBSEA WELLHEAD HOUSING
by
Muhammad Faris Bin Mohd Pakri (10823)
A Project Dissertation submitted in partial fulfilment of
the requirements for the
Bachelor of Engineering (Hons)
(Mechanical Engineering)
SEPTEMBER 2011
Approved by,
_____________________
(AP. Dr. Othman bin Mamat)
UNIVERSITI TEKNOLOGI PETRONAS
TRONOH, PERAK
September 2011

ii
CERTIFICATION OF ORIGINALITY
This is to certify that I am responsible for the work submitted in this project, that the
original work is my own except as specified in the references and
acknowledgements, and that the original work contained herein have not been
undertaken or done by unspecified sources or persons.
______________________
MUHAMMAD FARIS BIN MOHD PAKRI

iii
ABSTRACT
Wellhead system is one of the main systems in a subsea production. As the subsea
industry has been growing at an impressive rate. The growth of the industry has
been driven by the price of oil, which has allowed companies to invest in developing
reserves in increasingly difficult-to-access areas. It the wellhead fails, there is little
hope of keeping the flow of toxic crude oil from potentially annihilating an entire
ecosystem. The affects of such a catastrophe would be felt throughout the entire
globe, not just on the environment, but on people as well. Economically,
environmentally and psychologically, the damage from this oil spill will be
incalculable in more ways than we can imagine right now. Therefore, it is necessary
for us to ensure that the wellhead components are good enough to use for a certain
working condition. This project consists of the stress analysis of one of the
components in the wellhead system. The analysis of the wellhead component is
done by using computer-based simulation software, which is SolidWorks Premium.
The result from the analysis reveals that the current component and design is suitable
for its specific working condition.

iv
ACKNOWLEDGEMENT
In the name of Allah, The Most Gracious, The Most Merciful. Praise to Allah
S.W.T by whose grace and sanction I manage to complete Final Year Project within
time.
First and foremost, I would like to extend my sincere gratitude to my
supervisor AP. Dr. Othman bin Mamat for being a wonderful mentor in guiding,
supporting and assisting me, also for his knowledge shared with me through the year,
which are simply precious.
Not forgetting to other lecturers of UTP especially from the Mechanical
Engineering department, thanks for useful thoughts and assistance that help me a lot
in completing this project.
Last but not least, to my parents and colleagues, thanks for always stand in
my back and keep supporting me until I manage to complete this project.

v
TABLE OF CONTENT
CERTIFICATION OF APPROVAL. . . . i
CERTIFICATION OF ORIGINALITY. . . . ii
ABSTRACT . . . . . . . iii
ACKNOWLEDGEMENT . . . . . iv
CHAPTER 1: PROJECT BACKGROUND . 1
1.1. Background of Study . . . 1
1.2. Problem Statements . . . 3
1.3. Objective . . 3
1.4 Scope of Study . . 4
1.5 The relevancy of Project . . 4
1.6 Feasibility Study . . 4
CHAPTER 2: LITERATURE REVIEW
AND THEORY . . 5
2.1 Introduction . . . 5
2.2 Working Pressure and Load. . . 6
2.3 Design . . . 7
2.4 Material Selection . . . 12
2.5 Theory . . . 13
2.5.1 Nodal and Element Stress . 13
2.5.2 Hoop or Circumferential Stress 14
2.5.3 Von Mises and Tresca . . 16

vi
CHAPTER 3: METHODOLOGY . . . 17
3.1 Research Methodology and Activities. 17
3.2 Gantt Chart and Milestone . . 19
3.3 Tools . . . . . 22
CHAPTER 4: RESULT AND DISCUSSIONS . 23
4.1 Data Gathering and Analysis. . . 23
4.2 Experimentation/Modeling. . . 26
4.2.1 Stress Analysis of Wellhead Housing
with Test Pressure of 15,000 psi 26
4.2.1.1 Nodal Stress and Element Stress 27
4.2.1.2 Hoop and Radial Stress 30
4.2.1.3 Von Mises and Tresca 33
4.2.1.4 Overall / Compilation 36
CHAPTER 5: CONCLUSION AND
RECOMMENDATION. . . 37
REFERENCES . . . . . 39

vii
LIST OF FIGURES
Figure 2.1 Typical Wellhead System 5
Figure 2.2 Wellhead Housing 8
Figure 2.3 Wellhead Stackup 11
Figure 2.4 Nodal Values 13
Figure 2.5 Nodal Average Stress 14
Figure 2.6 Element Average Stress 14
Figure 2.7 Half of thin cylinder showing Hoop Stress 15
Figure 3.1 Flow Chart of Methodology 18
Figure 4.1 Dimensions of Wellhead Housing 24
Figure 4.2 Test Pressure 26
Figure 4.3 Meshing 26
Figure 4.4 Elements sizes reduces 27
Figure 4.5 Graph of Stress versus Element Size 28
Figure 4.6 Load Pressure 29
Figure 4.7 Stress Distribution 29
Figure 4.8 Hoop Stress at 15,000 psi of Internal Pressure 30
Figure 4.9 Hoop Stress at 10,000 psi of Internal Pressure 30
Figure 4.10 Graph of Internal Pressure versus Hoop Stress 31
Figure 4.11 Graph of Internal Pressure versus Max Von Mises Stress 34
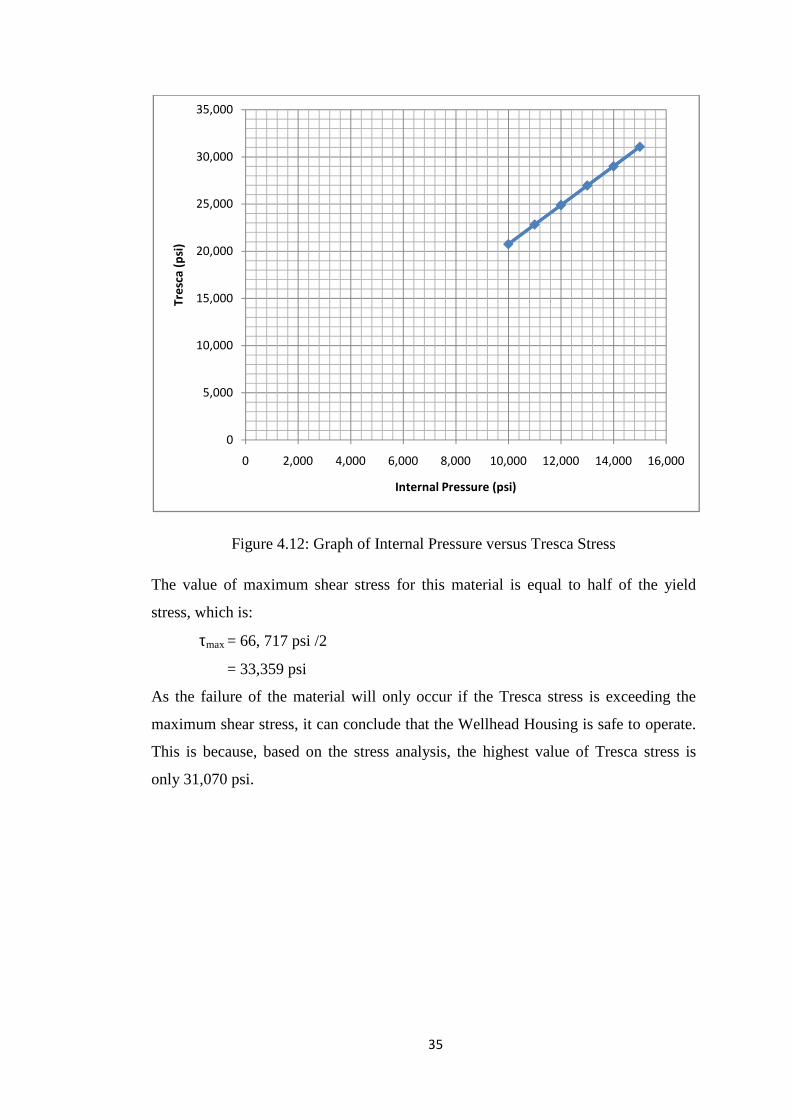
Figure 4.12 Graph of Internal Pressure versus Tresca Stress 35
Figure 4.13 Graph of various types of stress versus internal pressure 36
LIST OF TABLES
Table 1.1 Subsea Production System 2
Table 2.1 Codes for Subsea Wellhead 6
Table 2.2 Working and Test Pressure 7
Table 2.3 Wellhead Systems Standard Sizes and Types 8
Table 2.4 Thickness to Radius Ratios for Various
API Pressure Ratings 10

viii
Table 2.5 General Metallic Materials Recommendation
– Subsea Equipment 12
Table 3.1 Gantt chart and Key Milestones FYP I 20
Table 3.2 Gantt chart and Key Milestones FYP II 21
Table 4.1 Physical Characteristics of Wellhead Housing 23
Table 4.2 Physical Property for AISI 4130 Steel 23
Table 4.3 Mechanical Property for AISI 4130 Steel 23
Table 4.4 Percentage Difference between Maximum Stress for Node Values and Element Values 28
Table 4.5 Hoop Stress for Different Internal Pressure 31
Table 4.6 Theoretical value of Hoop Stress for different Internal Pressure 32
Table 4.7 Maximum Von Mises Stress at Different Internal Pressure 33
Table 4.8 Maximum Stress Intensity and Tresca at Different Pressure 34

1
CHAPTER 1
PROJECT BACKGROUND
1.1 Background of Study
The subsea industry has been growing at an impressive rate. The growth of the
industry has been driven by the price of oil, which has allowed companies to invest
in developing reserves in increasingly difficult-to-access areas. At the same time the
industry has matured to the point where subsea technology is no longer a specialist
area. It has become a routine choice, and often the only choice, for many long-
distance or deepwater developments.
In order to distinguish between the different facilities and approaches which are
needed, the subsea oil field developments are usually split into:
i) Shallow water: Continental shelf, or the area at the edges of a continent from the
shoreline to a depth of 600 feet [200 m], where the continental slope begins.
ii) Deepwater: Exploration activity located in offshore areas where water depths
exceed approximately 600 feet [200 m], the approximate water depth at the edge
of the continental shelf.
First application of subsea technology in Malaysia is for shallow operation in 1999
(F23SW Shell operated Gas fields). With the increase of deepwater activities in
Malaysia in recent years, subsea technology application has become more prominent [1]. Table 1.1 below shows all systems that involve in subsea production system [2]:

2
Table 1.1: Subsea Production System
System Description
Template and Manifold Systems
Systems that provide an interface
between the production flowlines
and/or the wells. This system also
act to distribute injected chemicals
and control fluid, and to distribute the
electrical and hydraulic systems.
Tie-in Systems Provide connection between Xmas
Tree/Manifold with the jumper/spool
Workover Systems
This system will is to ensure the
workover can be done when there is a
need to replace one or more non-
retrievable completion string
components
Subsea Production Control System
Control the wells by opening and
closing the valves installed on the
Xmas tree and other subsea
equipments. The hydraulic pressure
generated at either the platform or the
onshore terminal is sent through
umbilical hoses to activate submarine
valves.
Wellhead and Xmas Tree Systems
In this system, the Xmas tree
provides a pressure containing
method to safely cap
the well via its interface with the
subsea wellhead
In this paper, the focus is on the Wellhead and Xmas Tree System but will only
cover the wellhead component instead of both of the Wellhead and Xmas Tree.
3
1.2 Problem Statement
The oil and gas industry is headed toward design of high pressure, high temperature
(HPHT) wells with increasing service pressures and temperatures in H2S
environments. As the well conditions become more challenging, it becomes
necessary to better understand the limits of reliable material performance, so that
casing materials can be utilized to their full potential without crossing over to levels
of unwanted or excess risk. [3]
It the wellhead fails, there is little hope of keeping the flow of toxic crude oil from
potentially annihilating an entire ecosystem. The affects of such a catastrophe would
be felt throughout the entire globe, not just on the environment, but on people as
well. Economically, environmentally and psychologically, the damage from this oil
spill will be incalculable in more ways than we can imagine right now. The future is
indeed something to both dread and fear, for millions of inhabitants on this planet.
As the effect of the fail wellhead will produce worse situation, not only for the
company itself, but also for the environment, it is necessary for us to ensure that the
wellhead components are good enough to use for a certain working condition.
1.3 Objective
Knowing that one of the ways to ensure the wellhead can sustain its working
condition is by doing analysis using software, this project is all about the stress
analysis of the wellhead. Besides, doing analysis is the cheapest way, safe and need
not much of time to accomplish it.
The objective of this project is:
1) To perform stress analysis of one of wellhead component which is Wellhead
Housing.
2) To interpret the result and decide whether the Wellhead Housing is safe to
operate or not, based on its design specification and material, AISI 4130.
4
1.4 Scope of Study
The scope of study revolves around:
1) One of the wellhead components which is Wellhead Housing.
2) Focus on only 10M-Wellhead Housing, which is the working pressure of the
wellhead housing will only strict on 10,000 Psi
3) Apply only one type of common material for the Wellhead Housing which is
AISI 4130
1.5 The Relevancy of the Project
The analysis of the wellhead system is the common method for engineer to ensure
that the components are in a good condition before it use in the real system. This
project will simulate the stress analysis of the wellhead housing that made by
common material. This is an approach to understand and prove that the material that
has been use to make the component definitely can sustain its working condition.
1.6 Feasibility Study
All final year students need to complete their Final Year Project (FYP) within 2
semesters. As this project will only focus on one of the Wellhead components, it has
a potential to be done within the timeframe. The objective can be achieved if the
procedures are closely followed and succeed.

5
CHAPTER 2
LITERATURE REVIEW AND THEORY
2.1 Introduction
Wellheads can involve dry or subsea completion. Dry completion means that the
well is onshore or on the topside structure on an offshore installation. Subsea
wellhead is located under water on a special sea bed template. The wellhead has
equipment mounted at the opening of the well to regulate and monitor the extraction
of hydrocarbons from the underground formation. This also prevents oil or natural
gas leaking out of the well, and prevents blow-outs of the well due to high pressure
formations. Formations that are under high typically require wellheads that can
withstand a great deal of upward pressure from the escaping gases and liquids [8].
Typical wellhead system can be seen in Figure 2.1 [11].
Figure 2.1: Typical Wellhead System

6
Subsea wellheads and Christmas Trees are one of the most vital pieces of equipment
in a subsea production system. The subsea wellhead system performs the same
general functions as a conventional surface wellhead. It supports and seals casing
strings and also supports the Blow Out Preventer (BOP) stack during drilling and the
subsea tree after completion. The subsea wellhead system mainly consists of
wellhead housing, conductor housing, casing hangers, annulus seals and guide base
(Temporary Guide Base and Permanent Guide Base). The high-pressure wellhead
housing is the primary pressure-containing body for a subsea well, which supports
and seals the casing hangers, and also transfers external loads to the conductor
housing and pipe, which are eventually transferred to the ground [6]. Main codes for
wellhead are shown in Table 2.1 [7]:
Table 2.1: Codes for Subsea Wellhead
American Petroleum Institute (API) International Organization for Standardization (ISO)
API 6A Specification for Wellhead and Christmas Tree Equipment
ISO 10423 Wellhead and Christmas Tree Equipment
API 17D Specification for Subsea Wellhead and Christmas Tree Equipment
ISO 13628-4 Subsea Wellhead and Tree Equipment
2.2 Working Pressure and Load
The wellhead system suspends the casing and serves as a barrier for well fluids
against the environment. The standard maximum rated working pressure for subsea
wellheads shall be 2,000, 5,000, 10,000, or 15,000 (13.8; 34.5; 69.0; and 103.5
MPa). Tools and internal components such as casing hangers may have other
pressure ratings depending on size [4]. The main component of the system which is
Wellhead Housing also has its own rated working pressure according to the API
17D. The maximum rated working pressure for the wellhead housing pressure
boundary shall be 2,000, 5,000, 10,000 or 15,000 psi (13.8; 34.5; 69.0 or 103.5
MPa). Selection of the rated working pressure should consider the maximum
7
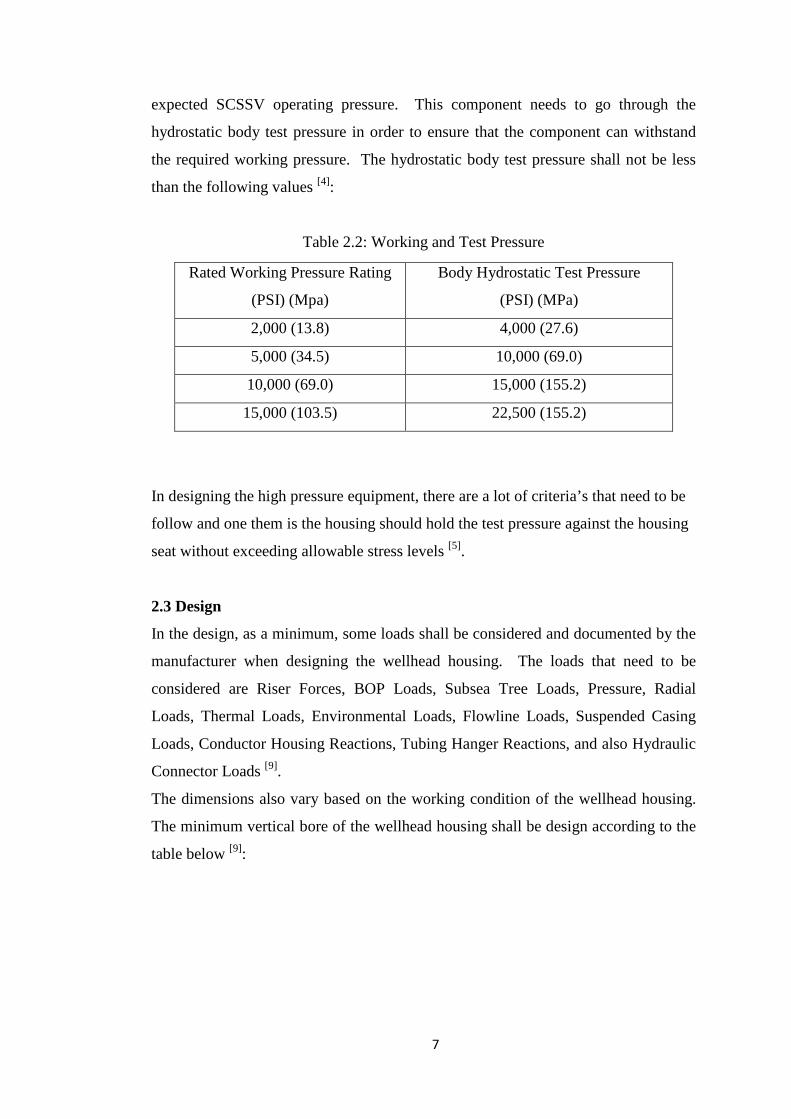
expected SCSSV operating pressure. This component needs to go through the
hydrostatic body test pressure in order to ensure that the component can withstand
the required working pressure. The hydrostatic body test pressure shall not be less
than the following values [4]:
Table 2.2: Working and Test Pressure
In designing the high pressure equipment, there are a lot of criteria’s that need to be
follow and one them is the housing should hold the test pressure against the housing
seat without exceeding allowable stress levels [5].
2.3 Design
In the design, as a minimum, some loads shall be considered and documented by the
manufacturer when designing the wellhead housing. The loads that need to be
considered are Riser Forces, BOP Loads, Subsea Tree Loads, Pressure, Radial
Loads, Thermal Loads, Environmental Loads, Flowline Loads, Suspended Casing
Loads, Conductor Housing Reactions, Tubing Hanger Reactions, and also Hydraulic
Connector Loads [9].
The dimensions also vary based on the working condition of the wellhead housing.
The minimum vertical bore of the wellhead housing shall be design according to the
table below [9]:
Rated Working Pressure Rating
(PSI) (Mpa)
Body Hydrostatic Test Pressure
(PSI) (MPa)
2,000 (13.8) 4,000 (27.6)
5,000 (34.5) 10,000 (69.0)
10,000 (69.0) 15,000 (155.2)
15,000 (103.5) 22,500 (155.2)

8
Table 2.3: Wellhead Systems Standard Sizes and Types
Standard wellhead housing based on the API 17D is shown in Figure 2.2[9].
Figure 2.2: Wellhead Housing

9
The wall thickness criteria for Wellhead Housing also need to follow the industrial
standard. The sizing of the basic wall thickness of a Wellhead Housing is based on
the standardization in API 6A. For a cylindrical pressure vessel at a point remote
from the ends, the membrane hoop stress is [13]:
Sh = p.R / t (Equation 1)
where: p = the internal pressure
R = the inside radius
t = the wall thickness
The longitudinal stress is approximately half that value assuming the vessel has
capped ends. The radial stress is compressive at the inner surface and has a value of
–p. At the outer surface, the radial stress is zero. Therefore the membrane, or
average, radial stress is approximately:
Sp = -p / 2 (Equation 2)
These are principal stresses. Therefore, the stress intensity is the algebraic
difference between the membrane hoop stress and the membrane radial stress.
Pm = p.R / t + p / 2 (Equation 3)
Therefore, solving for t, where S is the allowable stress intensity,
t = pR / ( S – 0.5 p ) (Equation 4)
For API 6A, the general primary membrane stress intensity at test pressure is limited
to 0.83 Sy, and at working pressure, 2/3 of Sy. Therefore for this situation, test
pressure is the controlling case [13].
10
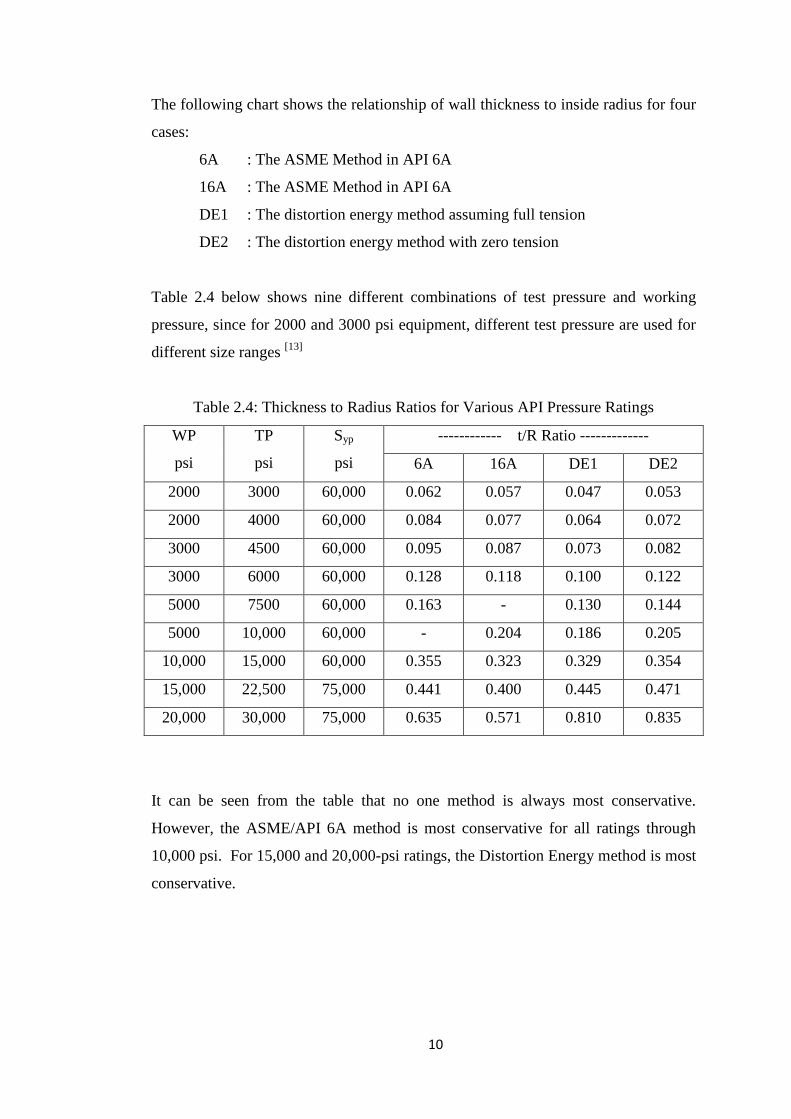
The following chart shows the relationship of wall thickness to inside radius for four
cases:
6A : The ASME Method in API 6A
16A : The ASME Method in API 6A
DE1 : The distortion energy method assuming full tension
DE2 : The distortion energy method with zero tension
Table 2.4 below shows nine different combinations of test pressure and working
pressure, since for 2000 and 3000 psi equipment, different test pressure are used for
different size ranges [13]
Table 2.4: Thickness to Radius Ratios for Various API Pressure Ratings
WP
psi
TP
psi
Syp
psi
------------ t/R Ratio -------------
6A 16A DE1 DE2
2000 3000 60,000 0.062 0.057 0.047 0.053
2000 4000 60,000 0.084 0.077 0.064 0.072
3000 4500 60,000 0.095 0.087 0.073 0.082
3000 6000 60,000 0.128 0.118 0.100 0.122
5000 7500 60,000 0.163 - 0.130 0.144
5000 10,000 60,000 - 0.204 0.186 0.205
10,000 15,000 60,000 0.355 0.323 0.329 0.354
15,000 22,500 75,000 0.441 0.400 0.445 0.471
20,000 30,000 75,000 0.635 0.571 0.810 0.835
It can be seen from the table that no one method is always most conservative.
However, the ASME/API 6A method is most conservative for all ratings through
10,000 psi. For 15,000 and 20,000-psi ratings, the Distortion Energy method is most
conservative.

11
Figure 2.3 below shows Wellhead stackup during 13-inches hole drilling [20]. At this
moment, the end part of the Wellhead Housing will be covered by cement, which is
used to ensure the Wellhead is stable enough during the installation.
Figure 2.3: Wellhead Stackup

12
2.4 Material Selection
The materials that are documented will combine corrosion resistance with strength,
toughness and weld-ability. In addition, machine-ability, availability, and cost will
also feature highly during the final material selection suitability review [10]. The lists
of materials recommendation for subsea equipment are shown in Table 2.5 [12]:
Table 2.5: General Metallic Materials Recommendation – Subsea Equipment
Component Large Steel Forgings
(Wellheads, Tubing Spools, Master Valve
Blocks)
Recommend Base Case Material
Materials Class “EE”: Low alloy steel with
Alloy 625 trim.
Class “FF”: ASTM A182 F6NM with Alloy
625 trim.
Class “HH”: Low alloy steel, all surfaces
exposed to produced fluids clad with
Alloy 625.
Alternative Material “FF”: AISI 410, in special cases CA6NM.
“HH”: Full body CRA in accordance with ISO
15156/MR0175.
Remarks “Trim” applies to pressure controlling parts
(seal faces), stems and mandrel hangers.
Low alloy steels: AISI 4130 or AISI 8630 low
alloy steel, or ASTM A182 F22 (2-1/4Cr 1Mo)
low alloy steel.
CA6NM is used for very large valve bodies that
cannot be forged. Qualification procedures shall
be agreed by the Principal.

13
2.5 Theory
2.5.1 Nodal and Element Stresses
When running a COSMOS analysis, the solver internally evaluates the stresses for
each element in the model at specific locations inside the element (also called as
Gaussian or Quadrature points). These points form the basis of numerical integration
schemes used in Finite Element codes. The number of points selected is determined
by the type and quality of the element. The subsequent stresses obtained at the
Gaussian points inside each element are extrapolated to the nodes of the element.
Nodal Values are the averaged values of stresses at each node. The value shown at
the node is the average of the stresses from the Gaussian points of each element that
it belongs to. In the adjoining Figure 2.4, the central node would carry a stress that is
an average of the 6 stresses coming from the 6 elements that it belongs to. [14]
Figure 2.4: Nodal Values
The alternative method of displaying stresses is called Elemental Values. In this
method, each element individually looks at the stresses at its nodes from the
Gaussian points. The stress at the element is the average of the stresses seen at its
corresponding nodes. Figure 2.5 and Figure 2.6 show the difference of approach to
average stresses between the nodal and element stress [14].

14
Figure 2.5: Nodal Average Stress
Figure 2.6: Element Average Stress
The degree of difference in the values is a reflection of the coarseness of the mesh,
and hence the convergence of stress results. If the values are very different, it is a
reflection of the mesh being too coarse at the high stress location. Hence, the mesh
needs to be refined at those locations using Local Mesh Control [14].
2.5.2 Hoop or Circumferential Stress
A hoop stress which, in a pipe or pressure vessel would tend to make the pipe
diameter or circumference increase. As fluid which has filled the pipe is pressurized
the hoop stress causes the diameter or circumference to increase.
This is the stress which is set up in resisting the bursting effect of the applied
pressure and can be most conveniently treated by considering the equilibrium of half
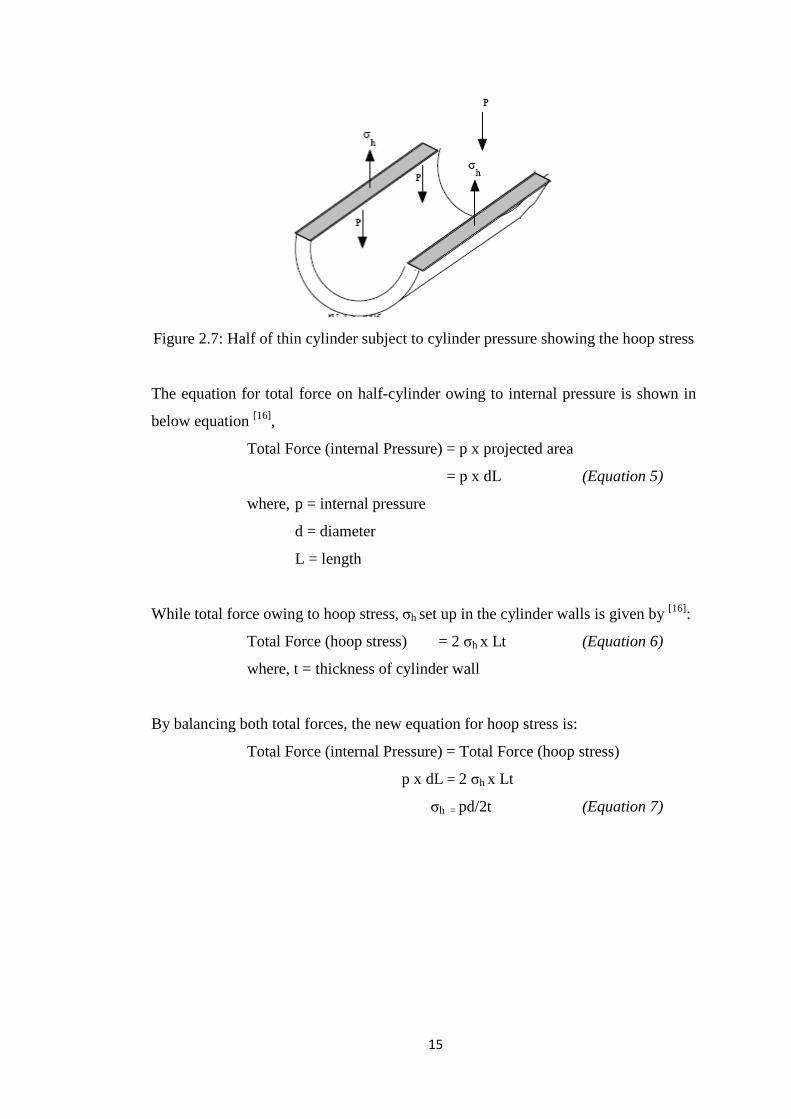
of the cylinder as shown in Figure 2.7 [15].
15
Figure 2.7: Half of thin cylinder subject to cylinder pressure showing the hoop stress
The equation for total force on half-cylinder owing to internal pressure is shown in
below equation [16],
Total Force (internal Pressure) = p x projected area
= p x dL (Equation 5)
where, p = internal pressure
d = diameter
L = length
While total force owing to hoop stress, σh set up in the cylinder walls is given by [16]:
Total Force (hoop stress) = 2 σh x Lt (Equation 6)
where, t = thickness of cylinder wall
By balancing both total forces, the new equation for hoop stress is:
Total Force (internal Pressure) = Total Force (hoop stress)
p x dL = 2 σh x Lt
σh = pd/2t (Equation 7)
16
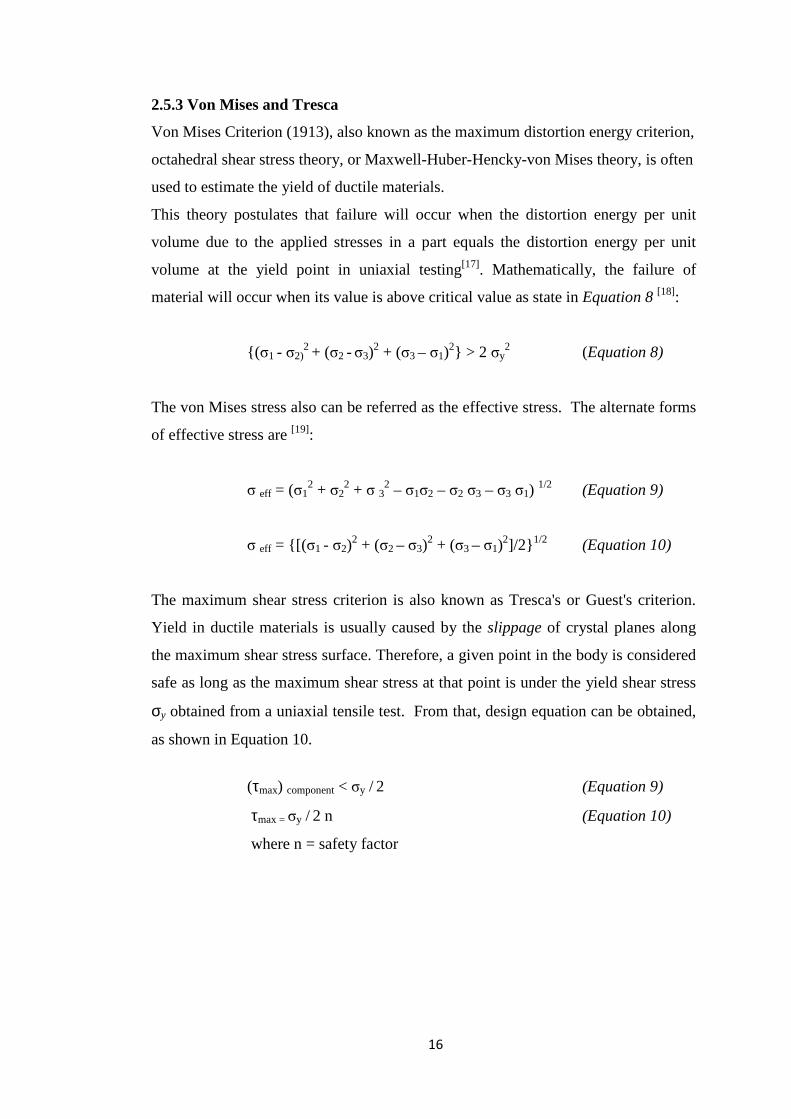
2.5.3 Von Mises and Tresca
Von Mises Criterion (1913), also known as the maximum distortion energy criterion,
octahedral shear stress theory, or Maxwell-Huber-Hencky-von Mises theory, is often
used to estimate the yield of ductile materials.
This theory postulates that failure will occur when the distortion energy per unit
volume due to the applied stresses in a part equals the distortion energy per unit
volume at the yield point in uniaxial testing[17]. Mathematically, the failure of
material will occur when its value is above critical value as state in Equation 8 [18]:
{(σ1 - σ2)2 + (σ2 - σ3)
2 + (σ3 – σ1)2} > 2 σy
2 (Equation 8)
The von Mises stress also can be referred as the effective stress. The alternate forms
of effective stress are [19]:
σ eff = (σ12 + σ2
2 + σ 32 – σ1σ2 – σ2 σ3 – σ3 σ1)
1/2 (Equation 9)
σ eff = {[(σ1 - σ2)2 + (σ2 – σ3)
2 + (σ3 – σ1)2]/2} 1/2 (Equation 10)
The maximum shear stress criterion is also known as Tresca's or Guest's criterion.
Yield in ductile materials is usually caused by the slippage of crystal planes along
the maximum shear stress surface. Therefore, a given point in the body is considered
safe as long as the maximum shear stress at that point is under the yield shear stress
σy obtained from a uniaxial tensile test. From that, design equation can be obtained,
as shown in Equation 10.
(τmax) component < σy / 2 (Equation 9)
τmax = σy / 2 n (Equation 10)
where n = safety factor

17
CHAPTER 3
METHODOLOGY
3.1 Research Methodology and Project Activities
The research methodology and project activities to accomplish the analysis are
shown in Figure 3.1 below:
START
LITERATURE REVIEW
PROJECT ACTIVITIES TO ACCOMPLISH EACH PROCESS IN
THE FLOW
• Preview / Analyze problem
• Analyze requirement for Wellhead
Housing according to standardize code
(API)
• Fundamental studies from references and
journals
CREATE 3D MODEL USING SOLIDWORK
RUN SIMULATION USING SOLIDWORK
• Interpret the design specification of the
wellhead housing into the model
• Identify the requirement to make a model
that will allow analysis to be done on the
model
• Ensure the parameters of the model is
based on the requirement
• Interpret the material of the wellhead
housing based on the fundamental studies
that has been done, into the Solidwork
• Define the working pressure and load
based on the specification, into the
Solidwork
• Define the constraint of the model based
on the subsea wellhead system

18
Figure 3.1: Flow Chart of Methodology
RESULT VALIDATION
• Interpret the result and identify whether
the result is acceptable or not.
• If not valid, the flow need to go through
the previous stage until obtain the valid
result, based on industrial specification
STOP
FINAL REPORT
• Report on the result of the stress analysis
of the Wellhead Housing
• Recommendation to improve analysis

19
3.2 Gantt Chart and Key Milestones
All activities that involves in the flow to accomplish the analysis have been put in an
appropriate schedule or Gantt chart. This is very important in order to make sure
that not any single activities will be delayed as it will cause this analysis cannot be
done within the time frame. Gantt chart for FYP I is shown in Table 3.1 while
Gantt chart for FYP II is shown in Table 3.2

20
Table 3.1: Gantt chart and Key Milestone FYP I
No Tasks Week 1 2 3 4 5 6 7
Mid
-Sem
este
r B
reak
8 9 10 11 12 13 14
1
Selection of Project topic: FEA of Subsea Wellhead - Knowing what kind of analysis involve in
FEA - Knowing roughly about Wellhead
2
Research on literatures related to the topic - Background of the project - Knowing the significance of this project in
life and industry - Decide the objectives of project
3 Submission of Extended Proposal
4 Proposal Defence
- Make a presentation to defend this project as an FYP
5 Further study on the specification, constraint and working load of Wellhead Housing
6 Prepare model for simulation software
- Creating Wellhead Housing model using computer-based 3D modeling software
7
Study on simulations by computer-based simulation software
- The Wellhead Housing model will be use to run simulation
8 Submission of Interim Draft Report
9 Submission of Interim Report

21
Table 3.2: Gantt chart and Key Milestone FYP II
No Tasks Week 1 2 3 4 5 6 7
Mid
-Sem
este
r B
reak
8 9 10 11 12 13 14
1 Further research on Wellhead Housing - Working condition and load - Calculation involve to verify the design
2 Study on simulation by computer-based software - Getting deep understanding about the
software in order to gain better result - Run simulation by using the latest
information from latest research
3 Evaluate the analysis result from Solidwork - Analyze the critical stress of the Wellhead
Housing based on the load and pressure - Evaluate the deformation of the model
whether acceptable or not
4 Submission of Progress Report - Done the research and simulation. The result
has been compile to be submit as Progress Report
5 Pre-EDX - An evaluation to compete in EDX
6 Submission of Draft Report
7 Submission of Technical Paper
8 Submission of Technical Paper
9 Oral presentation

22
3.3 Tool
The main equipment that will be used for this project is computer-based simulation
software, Solidwork Premium. This software is chose instead of other simulation
software due to this software has been used by the author during internship starting
from 7th June 2010 until 14th January 2011 at Aker Solutions Malaysia Sdn. Bhd.
This software can be used to create 3D model of the component, Wellhead Housing.
Besides, after creating the 3D model, this software has ability to perform stress
analysis, which is the main objective for this Final Year Project.
23
CHAPTER 4
RESULT AND DISCUSSIONS
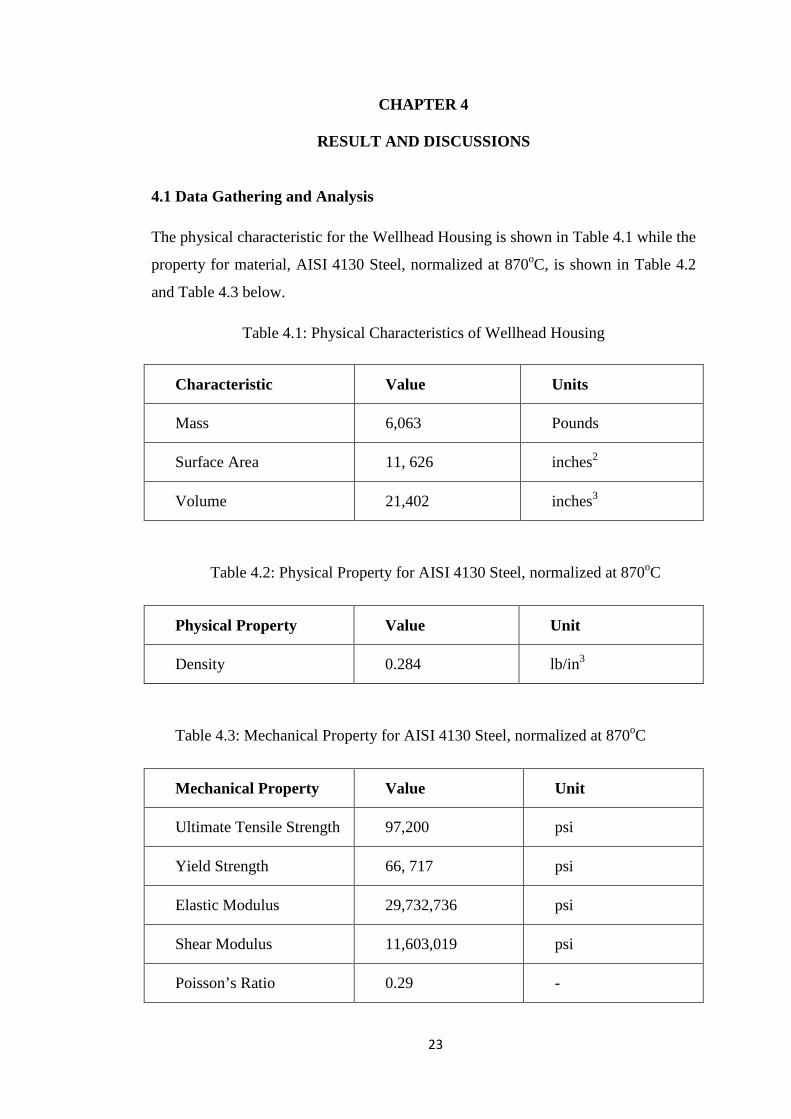
4.1 Data Gathering and Analysis
The physical characteristic for the Wellhead Housing is shown in Table 4.1 while the
property for material, AISI 4130 Steel, normalized at 870oC, is shown in Table 4.2
and Table 4.3 below.
Table 4.1: Physical Characteristics of Wellhead Housing
Characteristic Value Units
Mass 6,063 Pounds
Surface Area 11, 626 inches2
Volume 21,402 inches3
Table 4.2: Physical Property for AISI 4130 Steel, normalized at 870oC
Physical Property Value Unit
Density 0.284 lb/in3
Table 4.3: Mechanical Property for AISI 4130 Steel, normalized at 870oC
Mechanical Property Value Unit
Ultimate Tensile Strength 97,200 psi
Yield Strength 66, 717 psi
Elastic Modulus 29,732,736 psi
Shear Modulus 11,603,019 psi
Poisson’s Ratio 0.29 -

24
According to “Wellhead Systems Standard Sizes and Types” from API 17D (refer to
Table 4), the minimum vertical bore for Wellhead Housing should be 17.56 inches.
In order to ensure that the design is follow the standards or not, the dimensions for
the Wellhead Housing has been done and has been shown in Figure 4.1. The unit of
the dimensions is in inch.
Figure 4.1: Dimensions of Wellhead Housing
Based on Figure 4.1, it shows that the minimum vertical bore of the design is 17.700
inches, which is exceeding the value for standard minimum vertical bore. Therefore
the design is acceptable.

25
The thickness of the Wellhead Housing also need to follow the standards that has
been put in API 6A (refer to Equation 4).
t = pR / ( S – 0.5 p ) (Equation 4)
According to the design, one part of the thickest wall has a radius of 8.85 inch and its
thickness is 5.275 inch. The calculation below shows that the value of thickness that
needed for a given radius when working and test pressure applied is less than
thickness that has been state in the design. Therefore, the thickness is acceptable.
At working pressure, P = 10,000 psi
` Thickness, t = 10,000 (8.85) / (0.83*66,717 – 0.5*10,000)
= 1.757 inch < 5.275 inch
At test pressure, P = 15,000 psi
Thickness, t = 15,000 (8.85) / (0.83*66,717 – 0.5*15,000)
= 2.773 inch < 5.275 inch

26
4.2 Experimentation/Modeling
For this analysis, the working conditions will consists of stress analysis of Wellhead
Housing with its test pressure, 15000 psi.
4.2.1 Stress Analysis of Wellhead Housing with test pressure of 15,000 psi
The test pressure is applied at the whole contact point in the Wellhead Housing as
shown in Figure 4.2. In order to run the simulation and enable stress distribution
being seen, the model needs to be meshing first. Figure 4.3 is shown the model after
meshing.
Figure 4.2: Test Pressure Figure 4.3: Meshing
Test Pressure: 15,000 psi

27
4.2.1.1 Nodal Stress and Element Stress
Since the approach to average stresses is different for the nodal and element stress,
the maximum stresses in the stress plot will be different. The degree of difference in
the values is a reflection of the coarseness of the mesh, and hence the convergence of
stress results. If the values are very different, it is a reflection of the mesh being too
coarse at the high stress location.
Therefore, comparing nodal stresses and elemental stresses is a way of
understanding if the mesh is fine enough, and if the results have converged at the
highest stress location in the geometry. The stresses should approach one another as
the element size gets smaller. The elements sizes are reduce at the area that has
higher stress which is at the end of the Wellhead Housing, as shown in Figure 4.4.
While Table 4.4 and Figure 4.5 shown the outcome as the element size reduced.
Figure 4.4: Elements sizes reduced

28
Table 4.4: Percentage Difference between Maximum Stress for Node Values and
Element Values
No. Element
Size (inch)
Total Nodes
Total Elements
Max. Stress Node Values (psi)
Max. Stress Element Values (psi)
% Difference
1 1.75 36,663 22,605 164,890 159,474 3.28 2 1.663 36,461 22,467 168,251 163,003 3.12 3 1.575 36,655 22,607 165,076 159,414 3.43 4 1.488 36,525 22,511 166,200 159,402 4.09 5 1.400 36,610 22,574 165,264 159,434 3.53 6 1.313 36,698 22,586 165,111 159,424 3.44 7 1.225 36,730 22,597 165,017 159,404 3.40 8 1.134 36,708 22,600 165,162 159,612 3.36 9 1.050 36,941 22,747 166,032 161,956 2.45 10 0.963 37,053 22,790 164,690 160,432 2.59 11 0.875 37,019 22,761 164,326 159,781 2.77 12 0.788 37,169 22,808 164,451 159,909 2.76 13 0.700 37,873 23,250 164,370 160,323 2.46 14 0.613 38,249 23,409 164,876 160,481 2.67 15 0.525 39,259 23,929 164,622 160,817 2.31 16 0.438 40,822 24,759 165,283 161,994 1.99 17 0.350 43,241 26,040 164,858 161,723 1.90
Figure 4.5: Graph of Stress versus Element Size
158,000
160,000
162,000
164,000
166,000
168,000
170,000
0 0.5 1 1.5 2
Str
ess
(p
si)
Element Size (inch)
Node Values
Element Values
Linear (Node Values)
Linear (Element Values)

29
The element size has been reduced by 5 until 80 percent from the starting or initial
element size, 1.75 inches in an increment of 5 percent. The percentage difference
has been reduced from 3.28 percent to 1.90 percent. This shows that the meshing
has become finer and produced more accurate result. But, as can be seen in the
maximum stress column for both node values and element values, the values are
higher than yield strength and the tensile strength of the material, AISI 4130. This is
because, the Wellhead Housing should be attached to Pup Joint and that area will be
covered by cement, which will assist it to withstand the internal pressure. As this
report is only consist and focus on Wellhead Housing without any equipment
attached to it, the pressure load will not be applied at the region. Besides, the
meshing will also focus on the region other than the previous region which is at the
end of the Wellhead Housing. Figure 4.6 show that the area of the Wellhead
Housing that has been applied the load pressure while Figure 4.7 show the stress
distribution at the area by applying meshing with the finest element size which is
0.350 inches.
Figure 4.6: Load Pressure Figure 4.7: Stress Distribution

30
Element size of 0.350 inch is used due to it given very small difference in value
between nodal stress and element stress. From Figure 4.7, it can be seen that the
maximum stress due to the load pressure is 56,511.6 psi. The value is less than the
yield strength of AISI 4130 which is 66,717 psi. Therefore, it can be concluded that
this if AISI 4130 is used as the material for Wellhead Housing, this component will
not deform or yield which means it is safe to operate.
4.2.1.2 Hoop Stress
Hoop Stress is the circumferential loading of a cylindrical mechanical body and must
be kept well below the yield strength of the material. The hoop stress in the
Wellhead Housing would tend to make the pipe diameter or circumference increase.
Figure 4.8 and Figure 4.9 below represent the value of hoop stress at node 115922.
That node is one of nodes that situated in the region of the Wellhead Housing that
has internal diameter of 17.7 inches and thickness of 5.275 inches.
Figure 4.8: Hoop stress at 15,000 psi
of internal pressure
Figure 4.9: Hoop stress at 10,000
psi of internal pressure
31
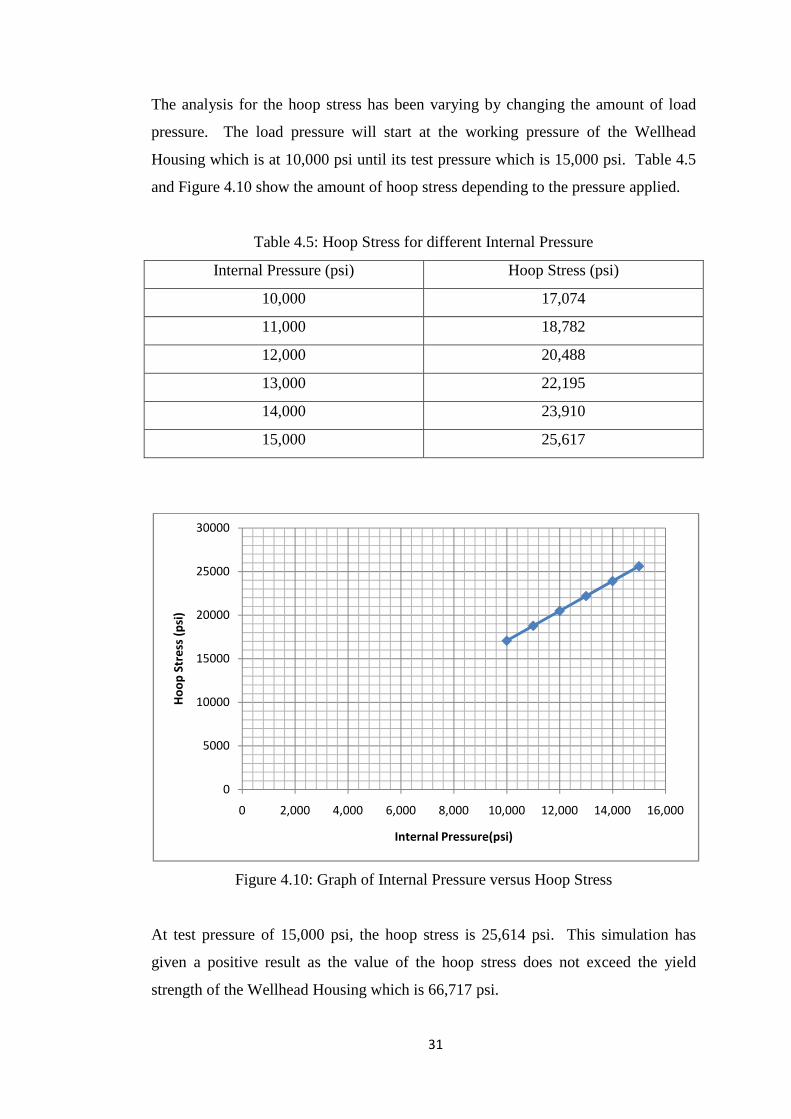
The analysis for the hoop stress has been varying by changing the amount of load
pressure. The load pressure will start at the working pressure of the Wellhead
Housing which is at 10,000 psi until its test pressure which is 15,000 psi. Table 4.5
and Figure 4.10 show the amount of hoop stress depending to the pressure applied.
Table 4.5: Hoop Stress for different Internal Pressure
Internal Pressure (psi) Hoop Stress (psi)
10,000 17,074
11,000 18,782
12,000 20,488
13,000 22,195
14,000 23,910
15,000 25,617
Figure 4.10: Graph of Internal Pressure versus Hoop Stress
At test pressure of 15,000 psi, the hoop stress is 25,614 psi. This simulation has
given a positive result as the value of the hoop stress does not exceed the yield
strength of the Wellhead Housing which is 66,717 psi.
0
5000
10000
15000
20000
25000
30000
0 2,000 4,000 6,000 8,000 10,000 12,000 14,000 16,000
Ho
op
Str
ess
(p
si)
Internal Pressure(psi)

32
The theoretical value of hoop stress of the Wellhead Housing can be calculate using
the equation that has been put in API 6A (refer to Equation 1).
Sh = p.R / t (Equation 1)
At internal pressure, p = 10,000 psi
Sh = 10,000 (8.85) / (5.275)
= 16,777 psi
Table 4.6 below show the theoretical values of hoop stress starting from internal
pressure, p of 10,000 psi until 15,000 psi.
Table 4.6: Theoretical value of Hoop Stress for different Internal Pressure
Internal Pressure (psi) Hoop Stress (psi)
10,000 16,777
11,000 18,455
12,000 20,133
13,000 21,810
14,000 23,488
15,000 25,166
Based on the theoretical values, the hoop stress for each internal pressure does not
exceed the yield strength of the material which is 66,717 psi. Therefore, as both
theoretical and simulation values give positive result, it can be conclude that the
material and design specification of the Wellhead Housing can withstand the hoop
stress on it.

33
4.2.1.3 Von Mises and Tresca
Von Mises and Tresca are often used to predict the yielding of ductile materials.
The Von Mises criterion states that failure occurs when the energy of distortion
reaches the same energy for yield/failure in uniaxial tension. While Tresca criterion
states that at any given point in the body, it is considered safe as long as the
maximum shear stress at that point is under the yield shear stress. Therefore, in
order to ensure that the Wellhead Housing is safe to operate, both Von Mises and
Tresca values should be under yield strength of the material. Table 4.7 and Figure
4.11 show the value of Von Mises by varying the internal pressure starting from its
working pressure, 10,000 psi, until its test pressure, 15,000 psi.
Table 4.7: Maximum Von Mises Stress at different Internal Pressure
Internal Pressure (psi) Maximum Von Mises Stress (psi)
10,000 37,742
11,000 41,516
12,000 45,286
13,000 49,060
14,000 52,744
15,000 56,512

34
Figure 4.11: Graph of Internal Pressure versus Maximum Von Mises Stress
The value of Tresca cannot be known directly from the simulation using the
SolidWorks. It can be found by manipulate the value of stress intensity as stress
intensity is twice the value of Tresca stress. Table 4.8 and Figure 4.12 show the
value of Tresca stress for different internal pressure.
Table 4.8: Maximum Stress Intensity and Tresca at Different Internal Pressure
Internal Pressure (psi) Maximum Stress
Intensity (psi) Tresca (psi)
10,000 41,513 20,757
11,000 45,664 22,832
12,000 49,786 24,893
13,000 53,935 26,968
14,000 57,997 28,999
15,000 62,140 31,070
0
10,000
20,000
30,000
40,000
50,000
60,000
0 2,000 4,000 6,000 8,000 10,000 12,000 14,000 16,000
Ma
xim
um
Vo
n M
ise
s S
tre
ss (
psi
)
Internal Pressure(psi)
35
Figure 4.12: Graph of Internal Pressure versus Tresca Stress
The value of maximum shear stress for this material is equal to half of the yield
stress, which is:
τmax = 66, 717 psi /2
= 33,359 psi
As the failure of the material will only occur if the Tresca stress is exceeding the
maximum shear stress, it can conclude that the Wellhead Housing is safe to operate.
This is because, based on the stress analysis, the highest value of Tresca stress is
only 31,070 psi.
0
5,000
10,000
15,000
20,000
25,000
30,000
35,000
0 2,000 4,000 6,000 8,000 10,000 12,000 14,000 16,000
Tre
sca
(p
si)
Internal Pressure (psi)

4.2.1.4 Overall / Compilation
Figure 4.13 show the hoop, maximum von mises, and tresca stress for the Wellhead
Housing working internal pressure until its test internal pressure.
Figure 4.13: Graph
The limitation lines are the indications for the analysis to decide whether the internal
pressure will give deformation to the Wellhead Housing or not.
0
10,000
20,000
30,000
40,000
50,000
60,000
70,000
80,000
0
Str
ess
(p
si)
36
4.2.1.4 Overall / Compilation
Figure 4.13 show the hoop, maximum von mises, and tresca stress for the Wellhead
Housing working internal pressure until its test internal pressure.
Figure 4.13: Graph of various types of stress versus internal pressure
The limitation lines are the indications for the analysis to decide whether the internal
pressure will give deformation to the Wellhead Housing or not.
5,000 10,000 15,000 20,000
Internal Pressure (psi)
Hoop Stress
Max. Von Mises
Stress
Tresca
Hoop and Von Mises
Limitation
Tresca Limitation
Figure 4.13 show the hoop, maximum von mises, and tresca stress for the Wellhead
Housing working internal pressure until its test internal pressure.
of various types of stress versus internal pressure
The limitation lines are the indications for the analysis to decide whether the internal
Hoop Stress
Max. Von Mises
Stress
Tresca
Hoop and Von Mises
Limitation
Tresca Limitation

37
CHAPTER 5
CONCLUSION AND RECOMMNEDATION
5.1 CONCLUSION
A three-dimensional FEA which is a Stress Analysis of Subsea Wellhead Housing
was carried out using SolidWorks Premium software. The material model used for
the simulation was AISI 4130. The process simulation has been done by applying an
internal pressure to the internal area of Wellhead Housing. The internal pressure
was varied from its working pressure, 10 000 psi until its test pressure 15 000 psi.
The results from the simulation consist of Nodal Stress, Elemental Stress, Von Mises
Stress, Tresca Stress and also Hoop Stress. Those kinds of stresses are important in
order to achieve the objective, which is to know whether the Wellhead Housing is
safe to operate at its working pressure or not.
Yield stress of the material is used as the base point to analyze whether the model
can withstand the internal pressure or not. From the result, it can be conclude that
Wellhead Housing is safe to operate at its working pressure if AISI 4130 is used as
its material and the design is following its standard requirement.

38
5.2 RECOMMNEDATION
Meshing is one of the factors that will affect the result of the stress analysis.
Generally, by increasing the resolution of the mesh, the accuracy of the stress
analysis can be improved. In this project, the meshing resolution was limited by
computer’s processor. Therefore, better computer’s processor is needed for better
resolution. Then, it will lead to better result for this project.
Another way to improve the result of this project is, instead of using only single
component from the Wellhead System, the analysis should involve all components
which have relationship with the Wellhead Housing. This is because, as Wellhead
Housing will be installed together with other components during the installation, it
will definitely given different result for the stress analysis if the analysis is not
consider other components. In future work, much time should be given for this
project as will not able to be accomplished in a short time range.
39
REFERENCES
1. Abu Fitri Bin Abd Jalil (Senior General Manager, Petroleum Operations Managerment PMU PETRONAS), Malaysia: Driving Towards the Regions Subsea and Deepwater Industry Hub, Slide Presentation on 2nd Asian Asian Subsea Conference and Exhibition KLCC Malaysia, 9-11 June 2010
2. Seppopa, Erlend H, Subsea System Equipment Handbook Gimboa, Aker Kvaerner
3. E. Paul Cernocky, Unconventional Applications Of Nace Method-A Tests To Investigate And Characterize Fundamental Aspects Of Low Alloy Steel In H2s Environment, Paper No. 06129
4. API Spec 17D: Subsea Wellhead and Christmas Tree Equipment, Section 302.1d Subsea Wellhead Equipment
5. API Spec 17D: Subsea Wellhead and Christmas Tree Equipment, Section 302.4 External Hydrostatic Pressure
6. Yong Bai and Qiang Bai, Subsea Engineering Handbook, 2010 Elsevier Inc.
7. A. Kumaaran, Design Engineer, Product Knowledge Transfer Session, Slide Presentation Aker Solution June 2010
8. Havard Devod, Oil and gas production handbook, An introduction to oil and gas production, Edition 2.0 Oslo, May 2009
9. API Spec 17D: Subsea Wellhead and Christmas Tree Equipment, Section 1001.5b Design
10. Howden, Malcolm, Technical Overview Rapid Tree Shallow Water, Technical Write Up 2009
11. Sonavane, Devraj Machindranath, Morvin Wellhead Analysis StatoilHydro SPS,
Company Document Number C105-AK-U-CA-0026 12. Maarten Simon Thomas, Manual: Selection, Fabrication And Inspection of
Materials For Subsea Applications, Design And Engineering Practice April 2006
13. John H. Fowler, P.E., Design Handbook for API 6A/16A/17D Equipment, Mechanical Engineering Consulting Services and Software, 2004
40
14. Vikram Vedantham, CAE Technical Specialist, Nodal Versus Elemental Stress,
April 2008, http://www.3dvision.com/wordpress.
15. Dr. Clemens Kaminski, Stress Analysis and Pressure Vessel, University of Cambridge, pp 1-2, Lent Term 2005.
16. E.J. Hearn, Mechanics of Materials 1, An Introduction to the Mechanics of Elatic and Plastic Deformation of Solids and Structural Materials, University of Warwick United Kingdom, pp 199-203, Third Edition 1997.
17. Prof. Sengupta,Theories of Failure, Chapter 2: Working Stress and Failure Theories A Simplified Approach, http://web.njit.edu/~sengupta/met%20301/theory%20of%20failure.pdf
18. Dr. Clemens Kaminski, Stress Analysis and Pressure Vessel, University of Cambridge, pp 6-7, Lent Term 2005.
19. Martin, Steady Load Failure Theory (Distortion Energy Theory), Lecture 6, Engineering 473 Machine Design, The University of Tennessee.
20. Kumaaran Arjuman, 36’ Wellhead Stackup Showing Cuba, PCSB, Engineering Drawing Document No. 10000904493, Aker Solutions Malaysia.