Majid Mohamad: Strengthening Takaful Industry Inner Capabilities - The GTG way

1
ORGANISATION FOR ECONOMIC CO-OPERATION AND DEVELOPMENT
I N F O R M A T I O N N O T E
Strengthening Tax Audit Capabilities: Innovative Approaches to Improve the Efficiency
and Effectiveness of Indirect Income Measurement Methods
Prepared by Forum on Tax Administration’s Compliance Sub-group 16 October 2006
CENTRE FOR TAX POLICY AND ADMINISTRATION

2
TABLE OF CONTENTS
ABOUT THIS DOCUMENT ....................................................................................... 3
Purpose ............................................................................................................................................................................ 3 Background ..................................................................................................................................................................... 3 Caveat .............................................................................................................................................................................. 3 Inquiries and further information ................................................................................................................................. 3
SUMMARY........................................................................................................................................................ 4
BACKGROUND............................................................................................................................................... 5
INTRODUCTION TO INDIRECT INCOME MEASUREMENT METHODS .......................7
SURVEY INFORMATION, FINDINGS & OBSERVATIONS............................................10
Key findings................................................................................................................................................................... 10 Conclusions....................................................................................................................................................................20
ANNEX 1 – INCOME TAX: USE OF INDIRECT INCOME MEASUREMENT METHODS – DESCRIPTION OF AVAILABLE METHODS AND ISSUES ASSOCIATED WITH THEIR USE ............................................................................................22
ANNEX 2 – SELECTED CASE STUDY EXAMPLES .............................................................27
ANNEX 3 – NATIONAL STANDARDS FOR ALLOWABLE LIVING EXPENSES ....................................................................................................................................47

3
ABOUT THIS DOCUMENT
Purpose
The purpose of this note is to share information concerning the strategies employed by a number of selected revenue bodies to improve the efficiency and effectiveness of indirect measurement methods used to validate and to establish taxpayers’ tax liabilities in the course of tax audit activities.
Background
Since its establishment in July 2002, the Forum on Tax Administration (FTA), a subsidiary body of the OECD’s Committee on Fiscal Affairs (CFA), has operated with the broadly stated mandate … to develop effective responses to current administrative issues in a collaborative way, and engage in exploratory dialogue on the strategic issues that may emerge in the medium to long term. To carry out this mandate, the Forum’s work is directly supported by two specialist Sub-groups: Compliance and Taxpayer Services (previously e-services)—that each carry out a program of work agreed by member countries.
The Compliance Sub-group exists to provide a forum for members to share experiences and knowledge of compliance approaches in OECD member countries to progress good practice in compliance activities and administration, both domestically and internationally. Specifically, the Sub-group is expected to: 1) periodically monitor and report on trends in compliance approaches, strategies and activities; 2) consider and compare member compliance objectives, the strategies to achieve those objectives and the underlying behavioural compliance models and assumptions being used; 3) consider and compare member compliance structures, systems and management and staff skills and training; and 4) create and maintain best practice papers and discussion papers on emerging trends and innovative approaches. This document is a by-product of the Sub-group’s work.
Caveat
National revenue bodies face a varied environment within which administers their taxation system. Jurisdictions differ in respect of their policy and legislative environment and their administrative practices and culture. As such, a standard approach to tax administration may be neither practical nor desirable in a particular instance. The documents forming the OECD tax guidance series need to be interpreted with this in mind. Care should always be taken when considering a country’s practices to fully appreciate the complex factors that have shaped a particular approach.
Inquiries and further information
Inquiries concerning any matters raised in this note should be directed to Richard Highfield (Head, CTPA Tax Administration and Consumption Taxes Division), phone +33 (0)1 4524 9463 or e-mail ([email protected]).

4
1. SUMMARY
1. Audits are a critical and significant component of the compliance activities of revenue bodies in all OECD countries. Faced with limited resources and relatively large numbers of taxpayers to administer (especially in the SME sector), revenue bodies require a systematic risk-based approach for identifying which taxpayers to audit and effective examination techniques to ensure that each audit arrives at a reasonably accurate assessment of each taxpayer’s correct tax liability.
2. For many taxpayers, particularly those in the SME sector, there is a considerable risk that some income will not be reported by them in their tax returns to reduce their tax liability. This is particularly true for those taxpayers where it is easy to conceal income, as the income is not subject to any systematic third party reporting to the revenue body and/or it is difficult for auditors to otherwise directly verify such income with third party sources. There is also the risk that expenses against business income may be overstated by taxpayers to reduce their tax liability. A further complication may arise when conducting an audit as a result of a taxpayer’s poor quality, or non-existent, books and records. For all of these reasons, auditors need a set of tools to indirectly measure taxpayers’ taxable income.
3. This information note summarizes the results of a short survey conducted in selected countries on their use of indirect income measurement methods, with particular emphasis on steps that have been taken to improve their efficiency and effectiveness. These include the development of industry benchmarks and business specific guidance that complement use of the methods, and the identification of sources of information (e.g. lifestyle expenditure as evidenced by credit card account data).
4. To provide context, the note also provides brief descriptive material on each of the formal income measurement methods used in practice, guidance on when such methods should be used, and the legislative support for use of these methods. Finally, to demonstrate the use of these methods, a number of case studies drawn from selected countries are also provided.

5
II. BACKGROUND
5. Potential areas of work for the Compliance Sub-group in 2005-06 were discussed at the May 2004 meeting in Zurich and subsequently agreed to in principle by the Forum on Tax Administration’s Bureau and the CFA. The OECD Secretariat wrote to a number of member countries in September 2004 to gather ideas on how and when the agreed work topics would be progressed. As a result of this, it was decided that ‘Strengthening Tax Audit Capabilities’ would be one of the initial areas of work taken up by the Sub-group in 2005, and that it would cover a range of matters, including:
• Auditor training/development strategies;
• Specialised audit techniques (including use of indirect income measurement methods, tools used to verify taxpayers’ VAT liabilities and computer audit techniques);
• Use of technology to assist in the conduct of audits.
6. An exploratory survey was undertaken in early 2005 and the preliminary findings discussed by the Sub-group when it met in Budapest in April 2005. Concerning the topic of indirect income measurement methods, the key findings are set out below:
• All countries expressed interest in obtaining additional information regarding indirect income measurement tools. Furthermore, this subject was considered equal highest priority with recruiting, developing and retaining audit staff.
• All respondents provided relatively detailed descriptions of their indirect income measurement methods. The methodologies were broadly based on three principles: 1) a comparison of the actual lifestyle and expenses of a taxpayer with his/her declared income; 2) a comparison of the declared income and expenses of a taxpayer with corresponding information for other taxpayers in similar circumstances (e.g. same industry/ occupation type and similar turnover range); and 3) the reconstruction of a taxpayer’s accounts, using details such as bank records and taxpayer’s cash transactions.
• The high level of interest in finding out more about these tools appears to have resulted from three considerations: 1) the ability to indirectly measure income is a core component of a revenue body’s tax audit capability; 2) indirect income measurement tools are often time-consuming to apply in practice; and 3) based on preliminary survey results, not all methods were being used in some countries as part of the normal audit activities.
• This appears to be an area where the respondents were seeking information of any innovative approaches in the use of these methods.
7. After discussion on this topic in Budapest delegates agreed that it would be a useful next step to explore with selected revenue bodies how these tools are applied in order to identify successful approaches for making their use more efficient and effective.
Survey of member countries
8. In line with a decision made in Budapest, the Secretariat in cooperation with officials from the Netherlands and Sweden, wrote to Sub-group member countries in July 2005 seeking specific examples/case studies that reflect some degree of innovation and which are being successfully applied in practice. Specifically, the following information was sought:

6
• A case study of no more than 2-3 pages, describing the main principles of each method being used.
• A practical example showing how the method is being used.
• Information indicating how widely the method is used.
• Where relevant, an indication if specific legislation has been enacted to authorise use of the method being described.
9. Responses (to varying degrees of detail) were received from 11 countries: Australia, Austria, Denmark, Finland, Greece, Japan, New Zealand, Netherlands, Sweden, United Kingdom and the United States. In addition, relevant information has also been obtained from German tax authorities.
10. This report summarizes the key findings and observations arising from the survey of selected countries. To give the topic some context and assist those countries where these methods are not used widely, some brief descriptive material relating to the use of indirect income measurement methods has also been provided. This material has been sourced primarily from the published audit examination guidelines of the US Internal Revenue Service (IRS), and is referenced accordingly within the text. Officials and others wishing to find out more detailed information on this topic are encouraged to access the IRS’s published audit examination guidelines.
7
II. INTRODUCTION TO INDIRECT INCOME MEASUREMENT METHODS
11. Before elaborating on the information provided by members, it is thought useful to provide some background comments on the rationale for the development of indirect income measurement methods and to provide some descriptive information on the formal methods that are used in practice and the particular circumstances in which each of the methods may be appropriate for use by audit staff.
Overview
12. Tax audits play a critical role in the administration of tax laws through their detection of non-compliance and by serving as a deterrent to the wider population of taxpayers who might otherwise engage in noncompliant behaviour. Central to the effectiveness of the overall audit program is that each audit arrives at a reasonably accurate assessment of each taxpayer’s correct tax liability.
13. For many taxpayers, particularly those in the SME sector, there is a considerable risk that some income will not be reported by them in their returns in order to minimise their taxable income. This is especially true for those taxpayers where it is easy to conceal income, as the income is not subject to any systematic third party reporting to the revenue body and/or it is difficult for auditors to otherwise directly verify such income with third party sources. There is also the risk that expenses against business income may be overstated by taxpayers to reduce their reported taxable income. A further complication may arise when conducting an audit as a result of a taxpayer’s poor quality, or non-existent, books and records. For these reasons, auditors need a set of tools to indirectly measure taxpayers’ taxable income.
14. The formal indirect methods that have evolved over many years and which are used by revenue bodies to varying degrees are set out hereunder1:
• Source and Application of Funds Method: This method entails an analysis of a taxpayer’s cash flows and comparison of all known expenditures with all known receipts for the period. Net increases and decreases in assets and liabilities are taken into account along with nondeductible expenditures and nontaxable receipts. The excess of expenditures over the sum of reported and nontaxable income is unreported taxable income.
• Bank deposits and cash expenditure methods: This method computes
income by showing what happened to a taxpayer’s funds. It is based on the theory that if a taxpayer receives money, only two things can happen: it can either be deposited or it can be spent.
• Mark-up method: This method produces a reconstruction of income based on
the use of percentages or ratios considered typical for the business under examination in order to make the actual determination of tax liability. It consists of an analysis of sales and/or cost of sales and the application of an appropriate percentage of markup to arrive at a taxpayer’s gross receipts.
1 Source: Internal Revenue Manual—Examination of Income (Chapter 4.10.4.2.9)

8
• Unit and volume method: In many instances gross receipts may be determined or verified by applying the sales price to the volume of business done by the taxpayer. The number of units or volume of business done by the taxpayer might be determined from the taxpayer’s books as the records under examination may be adequate as to cost of goods sold or expenses.
• Net worth method: This method is based upon the theory that increases in a
taxpayer’s net worth during a taxable year, adjusted for nondeductible expenditures and nontaxable income, must result from taxable income. This method requires a complete reconstruction of the taxpayer’s financial history, since the Government must account for all assets, liabilities, nondeductible expenditures, and nontaxable sources of funds during the relevant period.
(NB: These methods may be known by different names across individual countries.)
15. For ease of consistency and comprehensiveness, a standardised description of these methods and when their use is most appropriate was obtained from the official audit documentation of the US Internal Revenue Service. An extract of this information is provided at Annex 1.
When to use a formal indirect method2
16. The use of a formal indirect method to make the actual determination of tax liability should be considered when the factual development of a case leads the auditor to the conclusion that a taxpayer's tax return and supporting books and records do not accurately reflect the total taxable income received or the auditor has established a reasonable likelihood of unreported income. The following list, which is not intended to be all inclusive, identifies circumstances that would support the use of a formal indirect method:
A. A Financial Status Analysis that cannot be balanced; i.e., a taxpayer's known business and personal expenses exceed the reported income per the return and non-taxable sources of funds have not been identified to explain the difference;
B. Irregularities in a taxpayer's books and weak internal controls;
C. Gross profit percentages change significantly from one year to another, or are unusually high or low for that market segment or industry;
D. A taxpayer's bank accounts have unexplained items of deposit;
E. A taxpayer does not make regular deposits of income, but uses cash instead;
F. A review of a taxpayer's prior and subsequent year returns show a significant increase in net worth not supported by reported income;
G. There are no books and records. Auditors should determine whether books and/or records ever existed, and whether books and records exist for the prior or subsequent years. If books and records have been destroyed, determine who destroyed them, why, and when.
H. No method of accounting has been regularly used by the taxpayer or the method used does not clearly reflect income.
2 Source: Internal Revenue Manual—Examination of Income (Chapter 4.10.4.6.2.1)

9
Selecting a formal indirect method3
17. The selection of a formal indirect method is critical to effectively and efficiently determining the tax liability. For example, although the Bank Deposits and Cash Expenditures Method and the Source and Application of Funds Method are frequently used, they are not the most effective methods if cash is not deposited and/or the cash outlays cannot be determined unless voluntarily disclosed by a taxpayer. Realistically, it may be difficult to identify significant personal acquisitions or expenditure that a taxpayer has deliberately camouflaged. These weaknesses can be overcome by using a formal indirect method based on a taxpayer's business activities to make the actual determination of tax liability; i.e., the Markup Method or Unit and Volume Method. The following factors should be considered when selecting a formal indirect method:
A. The industry or market segment in which a taxpayer operates;
B. Inventories are a principle income-producing activity;
C. Suppliers can be identified and/or merchandise is purchased from a limited number of suppliers,
D. Merchandise and/or service pricing is reasonably consistent,
E. The volume of production and variety of products,
F. Availability and completeness of a taxpayer's books and records,
G. A taxpayer's banking practices,
H. A taxpayer's use of cash to pay expenses,
I. Expenditures exceed income,
J. Stability of assets and liabilities, and
K. Stability of net worth over multiple years under audit.
18. As noted in the introductory comments, this report focuses on innovative steps that have been taken to support and/or make the use of these tools more effective and efficient to apply in practice.
3 Source: Internal Revenue Manual—Examination of Income (Chapter 4.10.4.6.2.2)

10
IV. SURVEY INFORMATION, FINDINGS & OBSERVATIONS
19. Given the extent and nature of survey responses received, the information in this report cannot be regarded as an exhaustive study of the topic. Nevertheless, a sufficient range of information has been provided by selected countries pointing to the use of indirect methods and providing examples of innovation that may be of interest to member countries. This information is set out in five categories:
1. General information on the use indirect income measurement methods.
2. The development and use of industry benchmarks and other business specific guidance
3. Obtaining information to be used for applying the methods (i.e., new sources, methods of accessing those sources).
4. The use of cash flow estimations together with a letter strategy to encourage future compliance.
5. The application of technology to facilitate the use of indirect measurement methods.
Key findings
1) General information on the use of indirect income measurement methods
20. In their survey responses, countries reported on the indirect measurement methods used to validate taxpayers’ reported incomes and/or to make such estimates in the absence of adequate books and records. This information is summarised in Table 1. No country provided any data on the extent of use of these methods.
TABLE 1 - INDIRECT INCOME MEASUREMENT METHODS USED IN PRACTICE
Indirect income measurement methods used in practice (yes/no) Country
Source & application of
funds (T account)
Bank deposits & cash
expenditure
Markup Unit & volume
Net worth /asset
betterment/ capital
statements Australia Yes Yes Yes Austria Yes Yes Denmark Yes Yes Finland Yes Yes Japan Yes Yes Yes Yes Netherlands Yes Yes New Zealand Yes Yes Yes Yes Yes Sweden Yes Yes Yes UK Yes Yes Yes USA Yes Yes Yes Yes Yes
21. A brief description of the legislative provisions to that support the use of these methods in surveyed countries is set out in Table 2. Many of the surveyed countries also provided specific case study examples to demonstrate how particular methods are applied in practice. A selection of these case studies is provided at Annex 2.

11
TABLE 2 - LEGISLATION TO SUPPORT THE USE OF INDIRECT INCOME MEASUREMENT METHODS
Country Methods Comments
Australia
Variety of methods The revenue body is permitted by legislation to make an assessment or amend a previously made assessment in certain circumstances (i.e. where a taxpayer has failed to file a return, where the revenue body is dissatisfied with the return filed, or has reason to believe that a person who has not filed has derived taxable income (ITAA 36 sec 167).
Austria Estimation based on property growth & life expenses
The revenue body is permitted by legislation to estimate profit and taxable income where a determination of profit does not exist or the books and records are wrong (Section 184, Fiscal Procedures Act).
Denmark Variety of methods These methods can be used where financial records have been proven incorrect or are shown to be lacking.
Finland Assessment through estimation and increases in net wealth
Specific legislation enables use of measurement methods based on 1) estimates derived from a comparison with taxpayers in similar businesses under comparable conditions where there is suspicion of hidden income; and 2) unexplained increases in net wealth (sections 27 and 30, Tax Assessment Procedure Act).
Japan
Variety of methods Specific legislation enables the revenue body to determine tax liabilities by estimating taxable income using reasonable calculations after carefully checking the facts (Article 156, Income Tax Law & Article 131, and Corporation Tax Law).
New Zealand
Variety of methods Legislation permits the revenue body to make an assessment at any time where the taxpayer has not filed a return, or has filed a return which is fraudulent, wilfully misleading or omits income from a particular source. Use of methods is authorized by sections 89, 107, and 108 of the Tax Administration Act 1994 and has been confirmed by the courts.
Direct taxes: various measurement methods
Covered by general powers of investigation as provided for in Taxes Management Act 1970. Precedents in case law have impacted on the impact of investigations, principally by confirming that income estimation methods can be used to arrive at a tax liability where business records have been discredited.
United Kingdom
Indirect taxes: various measurement methods
The VAT Act 1994 provides specific authority enabling the use of “best of their judgment” for estimating VAT liabilities where a taxpayer fails to file a return or keep relevant documents. The term “best of their judgment” has been defined in the High Court as follows:
“What the words ‘best of their judgement’ envisage in my view is that the Commissioners will fairly consider all material placed before them, and on the material, come to a decision that is reasonable and not arbitrary as to the amount of tax due. As long as there is some material on which the Commissioners can reasonably act, then they are not required to carry out investigations which may or may not result in further material being placed before them.”
United States
Variety of methods Neither the Code or the regulations define or specifically authorize the use of the formal indirect methods. IRC section 446(b), however, provides that if no method of accounting has been regularly used by the taxpayer, or if the method used does not clearly reflect income, the computation of taxable income shall be made under such method as, in the opinion of the Secretary, does clearly reflect income. If the examiner has a reasonable indication that unreported income exists, the IRS has been granted the authority, through the development of case law, to use a formal indirect method of reconstructing income to determine whether or not the taxpayer has accurately reported total taxable income received. The [formal] indirect method need not be exact, but must be reasonable in light of the surrounding facts and circumstances. Holland v. United States, 348 U.S. 121, 134 (1954).

12
2) Development and use of industry benchmarks and other business-specific guidance
Industry benchmarks
22. Survey responses from four countries indicated that the use of industry benchmarks plays a significant role in assisting audit officials identify potential evasion cases and in applying the various measurement techniques to detect unreported income. Notably, the survey revealed that there was a variety of sources used for, and approaches taken to develop, industry benchmarks in the countries concerned:
• Australia: The Australian Taxation Office (ATO) derives its own industry benchmarks from data disclosed principally in monthly (for larger taxpayers) and quarterly (for SMEs) Business Activity Statements (BAS)4 required from all businesses. Some benchmark data are also derived from return labels of annual tax returns for self-employed taxpayers, partnerships, trusts and corporations. The BAS data support the ATO’s ‘Outlier Project’.
The Business Activity Statement (BAS) ‘Outlier Project’ utilises information from the BAS to establish industry benchmarks (norms), and to identify taxpayers and industries that fall outside the industry norms (see detailed description of this approach in Box 1). The project aims to ensure the integrity of the tax system by 1) establishing industry benchmarks on a real time basis; 2) providing intelligence of industry trends and identifying where risks are emerging; and 3) identifying behaviours and practices that lead to errors in the BAS so that appropriate responses can be developed. The concept of an ‘outlier’ is based on the assumption that businesses which are similar in characteristics (e.g., same specific (fine) industry and turnover ranges) should have similar business performance, especially if the performance is measured in the form of ratios instead of absolute values. Inquiries with the ATO also revealed that it regularly publishes industry benchmark data. As noted in its official publication………………. “Benchmarks assist tax advisors identify averages for groups of activities and, therefore businesses that vary significantly from those averages. Tax advisers can use this information to determine reasons for any variation and identify action that should be taken to correct problems and improve business practices, in particular, those related to record-keeping. The business community and business owners generally may use benchmarks to compare the performance of their business with business averages. ”
4 The BAS is an integrated tax return in which businesses are required to report details of their regular tax
liabilities (e.g., advance payments of income tax, value added tax, employee withholdings, and employee fringe benefits) and make a single payment. Within a BAS, a business is required to report, among other things, its monthly or quarterly sales (as well as export sales and other VAT free sales), capital and non-capital purchases, wages and salaries, employee withholdings, and VAT input credits and net amount payable. A copy of a BAS form is at Annex 3.

13
Box 1. Australian Taxation Office—Risk Identification and Benchmarks
What is an Outlier? The ‘Outlier’ concept uses real time BAS information to identify taxpayers and industries that fall outside the industry norms. BAS data are analysed quarterly (all monthly and quarterly BAS data) to establish industry benchmarks for that quarter and to identify ‘outliers’ that fall outside the norms and the accepted tolerances. For the purposes of outlier detection, taxpayers are segmented into fine industry levels and turnover ranges. Seven ratios are used to measure the performance of a business and to highlight potential anomalies. These ratios are (team leaders have a guide that provides more details on these ratios):
• Gross Profit Ratio (GPR); • Net Profit Ratio (NPR); • Wages to Sales Ratio; • PAYG(W) to Total Salary & Wages; • Input Tax Credits to Turnover (Total Business Income); • GST Payable to Total Business Expense; and • GST Payable to Turnover (Total Business Income)
The outlier ratio information can be used as a guide during an audit. However, generally before a case progresses to audit the respective project team and or auditor performs further work to add value and improve the quality of cases. Many of the outlier cases are not actioned as the further work identified the reason why they were an outlier (e.g. the ANZIC industry code used by the taxpayer was incorrect) and there is no risk based on this new information.
Scope of the outlier process: The outlier concept is only intended for use for “micro” businesses as larger businesses often have interposed entities and multiple industry income and thus this methodology does not work. Also some micro industries such as finance and business service can have every diverse practices and operations and therefore may also not be suitable for this form of analysis.
Outlier case overview: In the context of tax compliance, ratio analysis can be used for evaluating performance and estimating risk. Ratios are expressions of a mathematical relationship between different sets of data and are generally not significant in themselves but may assume significance when they are compared with: 1) previous ratios of the same business; 2) predetermined standard or benchmark; 3) ratios of other businesses with similar turnovers in the same industry, and 4) ratios of the industry within which the business operates.
The selection of ‘Outlier’ cases used by the Tax Office is based on the comparison of businesses in the same industry (same fine level ANZSIC) and similar turnover ranges. An ‘Outlier’ is a business which has one or more financial ratios that are significantly different to those of similar businesses. An adverse ratio for a taxpayer, when compared to a benchmark, does not necessarily mean that the taxpayer is non-compliant. It is an indicator only and tax officials need to make further enquiries to ascertain and be satisfied with the reasons for this. There may be genuine reasons why this could be the case. Generally, if a financial ratio for a business indicates that it falls outside the norm then either the business has unusual (abnormal) operating circumstances or they are not reporting correctly on their BAS and are a compliance risk. It is up to the Tax Officer to investigate and determine which alternative is relevant to the business. Although investigation usually requires contact with the business, this is not always the case as information held by the Tax Office can sometimes provide the answer. To action a case, tax officers are usually provided with a BAS ratio calculator (MS Excel spreadsheet based) and an attachment which is a profile of the taxpayer and includes information on the BAS ratios including those which are outside the norm. It is expected that a Tax Officer will also undertake necessary investigation of other relevant information held by the ATO before actioning an ‘Outlier’ case.
Source: ATO survey response
• Germany: Regional tax officials have access to benchmark data that is prepared on a regional basis by assembling data captured from all audits of SMEs taxpayers and made accessible on line for audit inquiry purposes (see description in Box 2).

14
Box 2. Germany—Use of Industry Benchmarks
Benchmarking of industries has been used for over 15 years by German tax authorities to identify taxpayers who fall outside industry norms, to test the declared income of businesses, and to make estimations of income in the case of taxpayers with incomplete books and records. The underlying principle is that businesses of comparable size working in the same industry should perform similarly. Benchmarks exist for 147 industries and are updated annually.
Until 2005, auditors conducted test audits to develop the country-wide benchmark data. From 2005, benchmarks have been prepared drawing on data from all completed audits. On a full year basis these number around 180,000. The procedure of obtaining the industry benchmarks was changed to reduce costs for the revenue body administration and to facilitate the provision of data that reflect regional characteristics.
For the purpose of developing industry benchmarks, relevant taxpayer information reported in tax returns, adjusted for the results of audit activity, along with the taxpayer’s unique industry code (based on the Government wide system of industry classification) are captured by local tax offices and compiled on regional databases that are made widely accessible to audit officials. In practice, five different ratios are computed for benchmarking purposes:
• Gross profit ratio I: (Turnover — purchases) / turnover • Gross profit ratio II: (Gross profit I — wages) / turnover • Gross profit ratio III (Gross profit II — general business expenses) • Net profit ratio (Gross profit III — specific business expenses) • Gross profit mark up (Net purchase price x gross profit mark up = sales price)
The industry benchmarks are published on the website of the Federal Ministry of Finance, publication is freely available for taxpayers, tax advisors and Laender tax administrations. In practice, the ratios are used externally by accountants and tax professionals to advise their clients on the likely acceptability of their accounting records for tax purposes. Example: Hairdressers Ratio 1 Ratio 2 Ratio 3 Ratio 4 Ratio5 Turnover < €100,000 Range 49-81 23-62 15-48 Average 90 64 41 31 Turnover > €100,000 Range 42-63 17-43 8-35 Average 80 53 30 21
Source: German Ministry of Finance
• New Zealand: The IRD obtains benchmark data from a university survey that is conducted and published annually (see Box 3). The survey data are compiled in conjunction with accounting authorities and cover over 200 business categories from a sample of over 5000 businesses. The information is generally made available around 12 months after the end of the relevant financial year and is used selectively in data mining exercises to identify “outlier” taxpayers.

15
Box 3. New Zealand Inland Revenue—Industry Benchmarks
Description: The New Zealand Business Benchmarking Survey has been produced annually by the Management Research Centre at Waikato Management School for the past 20 plus years. The 2004 publication, produced in association with ASB BANK and the Institute of Chartered Accountants, was released in March 2005. The survey provides financial ratios covering income, profitability, overhead structure, ratios per person, liquidity, and capital structure for a range of industries in the retail, mining, service, wholesale and manufacturing sectors. The 2004 survey features results for 212 different industry categories and represents data submitted for over 5,100 individual businesses. The categories represent a comprehensive list of common small to medium sized enterprises throughout the country. The IRD purchases the survey information. This enables a comparison of potential audit candidates to industry norms. The information is not provided in an electronic format which limits the opportunities for automated matching. IRD is able to interrogate its taxpayer database through a data warehouse facility. Using parameters obtained from the Waikato Study risk analysts are able to sort data to identify taxpayers who operate outside of industry norms on areas such as: 1) ratios including gross profit; and 2) specific or groups of expense or overhead items. Outliers are then targeted for further enquiry by audit activity.
Source: IRD survey response
• United States: The IRS obtains benchmark data from a commercial body website: BizStats. This body compiles its data from a variety of sources (e.g., US Departments of Labor and Commerce, US Census Bureau, and the Internal Revenue Service (IRS)), edits the data and publishes it in a unique format useful and easily accessible for business analysis purposes. The website provides an extensive array of benchmark data (by industry, entity type, financial ratio criteria) on a national basis. For small business operating statistics, BizStats notes that it relies on a significant amount of its raw data from agencies such as the IRS, while tax data typically has a two to three year time lag they consider it to be statistically superior to data from other sources for a number of reasons: 1) all businesses are covered; 2) all businesses must report in the same format; and 3) all businesses must sign an accuracy format.
National Industry Associations for different industries also collect data on average income and expense ratios. For example, the National Restaurant Association (NRA) has data on income that is generated by the size of the establishment as well as the price range on the menu. The NRA can provide data on table turnover needed to generate a profit and stay in business.
23. For the countries surveyed, the availability of benchmark data supports audit officials in gauging the likely accuracy of business-related financial data in tax returns, ascertaining the likely extent of any variation from industry “norms” (if deemed necessary, to be substantiated), and also serves as the basis for estimating income where a taxpayer’s books and records are poor or inadequate.
24. Significantly, there are differences in the way benchmarking data is accumulated/obtained by revenue bodies, each with their various advantages (e.g., timeliness, cost, and accuracy) and disadvantages (time lags, high cost). Revenue bodies that currently do not have systematic access to such data on a comprehensive industry basis may wish to study further the different approaches of the observed revenue bodies.

16
Business specific guidance
25. Survey responses revealed that two revenue bodies (i.e., UK HMRC and the US IRS) have both established an extensive array of business-specific guidance to assist audit staff in their examination of taxpayers’ affairs:
• United Kingdom: HMRC has developed a series of industry profile reports known as ‘Tactical Information Packages’ (see description in Box 4).
Box 4. United Kingdom Her Majesty’s Revenue and Customs—Tactical Information Packages
HMRC holds detailed reports on specific industries. These reports explain how an industry operates and provide information about industry performance and trends. The industries that HMRC hold reports on tend to be ones that have, from experience, been non-compliant. The reports are called ‘Tactical Information Packages’ (TIPs).
These reports are used to provide background on an industry before an investigator begins an enquiry. They are also used to help the investigators create “business economics models (BEMs)”. In situations where the records of a taxpayer have been discredited, the investigator may use these BEMs. The investigator establishes the facts needed to make the model with the taxpayer then uses the model to create an estimate of income. BEMs are effective in circumstances where there is enough information, but much of the information needed to compile a business model comes from the taxpayer who explains his business to the investigator. However, if facts are established before the taxpayer is told about what the investigator wishes to do then accurate estimations can be made.
TIPs are prepared by the Business Information Unit (BIU) within National Compliance. The role of this unit is to inform on trade sectors and professions, including details on markets, customers, competition, legislation and sector performance ratios etc (i.e. industry benchmarks). The BIU also assists in identifying drivers and compliance risk areas within the trade/professions and presents ideas for project methodology and opportunities for compliance improvement within the trade/profession based sector, making best use of the wealth of information available within the HMRC and outside for compliance staff to support compliance activity and interventions. Internal researchers up-date the TIPs using feedback and knowledge from the enquiry teams within Local Compliance, Tax specialists and externally available data. There is an increasing use of Trade Sector Consultants who are employed from the private sector on short term contracts. The BIU currently has a range of approximately 220 TIPs. Of these approximately 70% are available on the IR Intranet site. Although TIPs are currently available on the Intranet, a phased program of work is planned to place a number of TIPs on the Internet. There is a robust maintenance program and selection of TIPs process is in place and can take into account changes in priorities and issues coming from National Compliance.
Source: HMRC survey response and additional inquiries
• United States: The IRS has established an extensive series of ‘Audit Techniques Guides’ (ATGs) that focus on developing highly trained examiners for a particular market (industry) segment. The guides, which are made public and appear on the IRS’s website, contain information concerning examination techniques, common and unique industry issues, business practices, industry terminology and other information to assist examiners in performing examinations and, in particular, highlight unique issues and approaches that may be relevant for an industry/ business type using one or more of the various indirect income measurement techniques. For example, the guide on laundromats focuses on the use of water consumption to reconstruct business turnover and thus helps verify taxpayers’ claims of gross receipts in their tax returns.
Key industries and businesses covered by this series include banking, bars, construction, direct sellers, farming, garden supplies, laundromats, mobile food

17
vendors, motor vehicle dealership, motor vehicle repair, poultry industry, retail (covering multiple industry types), and scrap metal.
3) Obtaining taxpayer-related information (i.e., new sources, methods of accessing those sources) that can be used in applying the methods
26. The effective use of indirect measurement tools typically requires comprehensive data from taxpayers concerning their expenditures, including details of private living costs and lifestyle. In order to conceal any tax evasion through the under-reporting of income, taxpayers may seek to minimise their private expenditure and conceal information of their lifestyle in the course of audit inquiries. Hence, audit officials need to find ways of establishing private living costs, either directly by identifying potential sources of information that evidence such amounts (e.g., cheques, utility bills, and credit card statements) or indirectly by extrapolating likely costs using data representing typical taxpayers in similar circumstances (e.g., consumer expenditure survey data). Survey responses revealed a number of sources that revenue bodies have been using to assist in this way:
• United States: The IRS identified a variety of sources that its audit officials use to make estimates of the personal expenses of taxpayers. These are:
National Standards for Allowable Living Expenses (ALE): National Standards for Allowable Living Expenses for the Continental U.S., Hawaii and Alaska are charts that summarize what Americans spend based on income, number of persons per household and expense item. To view the charts, click here or go to Appendix 4.
Bureau of Labor Statistics (BLS) Consumer Expenditure Survey: The BLS Consumer Expenditure Survey provides information regarding allowable amounts such as average annual personal living expenses that the IRS uses to develop national standards. For more information, visit the BLS website at http://www.bls.gov/
Bureau of the Census: Information from Census is used to determine local expenses for housing, utilities and transportation. For more information, visit the Bureau of the Census website at http://www.census.gov/
In addition, application of these methods is supported by providing audit staff with automated access to third party information reports received by the IRS under mandated reporting obligations. The IRS receives over 1.5 billion reports annually that in addition to covering wage, interest and divided income also cover an extensive variety of other income categories (e.g. allocated tips, mortgage interest paid, points paid, savings bond, pension/annuity, IRA contribution, non-employee compensation, capital gain, real estate sales, gross distributions, stocks & bond, short term capital gain, and long term capital gain). Information of this nature assists audit staff in their inquiries and can facilitate the use of indirect measurement methods.
• Sweden: The Swedish Tax Agency reported details of a major project undertaken involving the use of credits cards linked to banks in tax haven countries. By obtaining large scale information on all transactions over an extended period they have been able to more accurately quantify lifestyle expenses and in turn unreported income that is used to fund such expenditure. A description of this project and the steps taken is provided in Box 5.

18
Box 5. Case Study: Indirect Income Measurement Tools– Bank Cards Linked to Tax Havens
This case study explains a new approach to obtain information on assets in tax havens via domestic bank card transactions. Background: The Swedish tax administration has estimated that €200-500 million in Swedish taxes are evaded due to transactions linked to tax havens. Substantial assets are also placed in banks located in tax havens. Investigations shows that very often these assets are not declared for tax purposes and that they often originate from undeclared income. Due to the fact that virtually no information can be obtained from the tax havens themselves, alternative methods for finding such information need to be found. One approach is to trace transactions via the use of bank cards. To have tax haven assets at one’s disposal in their country of residence (i.e. Sweden), these tax evaders can use international bank cards linked to these accounts. The assets can then be used for purchases, restaurant visits, etc as well as ATM withdrawals in Sweden and abroad. The use of bank cards has been promoted by tax consultants in different tax evasion schemes. By identifying the individuals using such cards, the tax administration will be able to find
• Unreported income from work and from business activities. • Unreported savings (interest, dividends, capital gains etc). • Individuals that should be regarded as residents for tax purposes.
Approach and working methods: In Sweden, some companies act as intermediaries for running technical systems for the distribution of card transactions. All transactions made in Sweden, regarding both domestic and foreign cards, pass through these intermediaries. By using third party audits, the Swedish tax administration has obtained information on all card transactions made between 2001 and 2003 from these intermediaries. Most of these transactions concerned domestic cards but about 3% of the total number of transactions originated from foreign bank cards, some of them from tax havens. The information regarding foreign cards consisted of approximately 48 million transactions, 7 million bank cards, a total amount of €4 billion, and cards issued in 123 different countries. A selection has to be made in order to target persons who are suspected to evade tax via tax havens. The first step is to identify all cards which are linked to tax haven banks. This can be done via each card number which indicates the issuing bank. All transactions linked to that card are then combined and a further selection is done. Cards containing the highest amounts and/or most frequent use for example could be selected for further investigation. Furthermore, the trade pattern connected to each card needs to be assessed. A lot of purchases made via foreign cards are, of course, made by persons who are not residents in Sweden but tourists, on business trips etc. A trade pattern indicating that the person is a Swedish residential could be that transactions are made for food, home electronics, furniture and gasoline. A pattern showing transaction in several different locations, hotels, rental cars etc may indicate that the person is a non-residential. The next step is to identify the card holder. The identification of card holders is possible by doing third party audits. The use of a personal identity number5 facilitates the identification. The process could be a quite burdensome process. Finally, when the person is identified, an investigation has to be started in order to establish if the assets originates from tax evasion. For example, could the assets be linked to transfer of business profits to tax havens? Is the person not registered as a resident in Sweden but is in fact residing there (and consequently taxable)?
5 According to Swedish law, each Swedish citizen receive a personal identity number at birth
which is being used for several purposes in the society (taxes, population registration, insurances, drivers license etc).
19
Media usage: A part of the Swedish strategy to improve tax compliance is to use the media to inform the public about activities carried out by the tax administration. The primary objective is to make honest tax payers aware that tax evaders are investigated. In the case of bank cards, the tax administration has via daily newspapers and TV news informed about the possibility to retrieve such information and the ongoing control activities. Results: The work with bank cards in tax havens is an ongoing project. So far, approximately 2000 card holders have been identified and about half of these have been examined more closely leading to about 500 (mostly ongoing) investigations.
Source: Swedish Tax Agency
• Japan: National Tax Agency (NTA) officials reported that audit activities are greatly facilitated by the availability of third party reporting systems that cover an extensive variety of income (and asset) categories—overall, some 40 separate categories affecting the personal income tax.
In addition to reporting arrangements that include wages, interest and dividend income, as seen in virtually all countries, Japan’s system of third party reporting also extends to professional fees and charges, contract payments, prizes, rents on immovable properties, purchases of shares and real estate, real estate commissions, grants and transfers of stock acquisitions, records of futures transactions, and money transfers to foreign countries. NTA officials obtain about 158 million (including non-statutory third party information reports) pieces of information that are managed in an integrated way by their KSK computer system to assist in the conduct of follow-up action and tax examinations. The third party information is electronically classified by individual taxpayer and associated with the taxpayer’s (physical) examination file, and then used for checking. The checking involves matching the contents of the taxpayer’s return against the third party information of the taxpayer. On the basis of this match, the individual return is classified as being potentially subject to a thorough field examination or a simple post-filing inquiry.
As a result of these information gathering activities, for many audits the auditor has a variety of information to assist his planning and audit inquiries to establish the accuracy of reported taxable incomes and to identify unreported income.
4) The use of cash flow estimations together with a letter strategy to encourage future compliance
27. Sweden reported the use of an innovative strategy designed to leverage compliance through a warning letter strategy targeted at ‘below average income’ taxpayers. A description of the project is set out in Box 6.
Box 6. Using cash flow estimations in combination with a letter strategy The cash flow estimation method has in a special project been used together with a so-called “letter strategy”. The cash flow estimation method was used for selection and detection; the letters were used as leverage. The purpose of this project was to influence the behavior of the taxpayer before the filed the tax return. The project is briefly described below.
Letters were sent to two similar groups of businesses, self-employed in the construction sector. The letters were sent during the year of income, long before the tax return should be filed. One group received a letter that said that some (of those that received the letter) would be audited the following year. The selection method was also described. Those with the lowest cash flow estimation would be audited. The other group received a letter explaining that some would be chosen for audit by random (used only for measuring purpose). A third group was also used for measuring purpose. This group, the control-group, did not receive any letter at all (but was otherwise similar to the two letter-groups).
The purpose of the letters was to influence the behavior of the taxpayers so they would declare a

20
higher (more correct) income. The number of audits carried out was not higher for the letter-groups than for other self-employed businesses.
The results of the letters were measured when the tax returns were filed (and before any audits were carried out). The result showed that average income increased slightly more in the group that received the letter explaining the selection method than the other groups. The group that received the random audit letter showed a very small increase in average income than the no letter group. The group receiving the letter about the cash flow estimation increased their income the most. This means that the strategy had some effect, even if it was quite small.
Source: Swedish Tax Agency
5) Application of technology to enhance the use of indirect methods
28. A number of countries (e.g., Australia and New Zealand) indicated that they have automated the production of the various statements used as part of the indirect methods adopted, although few details were provided. The example provided in Box 7 briefly describes their development of a ‘private affairs analyser’ to assist audit officials.
Box 7. New Zealand— Private Affairs Analyser
Description: The Private Affairs Analyser is a Microsoft Access based tool, developed by NZ IRD (Computer Tax Audit). The tool enables the investigator to analyse a taxpayer’s living expenditure and determine whether or not there is sufficient income declared to support the taxpayer’s lifestyle.
One of IRD’s most critical tasks is the ability to follow money from its source through to its disposition. By undertaking financial analysis it is able to determine the amount of income required by a taxpayer to fund their standard of living. There are a variety of ways in which this analysis can be conducted.
The appropriate method to use for an investigation will depend on the circumstances of each audit. One particular method may be more appropriate than another given the circumstances. However, if possible, various methods of income determination should be used to build a stronger argument. The Private Affairs Analyser database tool was developed to assist investigators complete this analysis. This access database allows an investigator to easily input data and produce three different reports from the one set of data. The database tool produces these reports:
• Asset Accretion Statement • Source & Disposition Statement • Cash Available Statement
The tool is designed to determine whether there are "gaps" in the expenditure e.g. missing power bills or insufficient provision basic needs ((food etc.)) having regard to the taxpayers domestic situation, which may indicate payments made from unidentified bank accounts or from undeclared cash. The tool requires all known expenditure of taxpayer and dependants and all transactions from identified bank accounts, to be entered manually or imported from an electronic file, together with assets and their value at the beginning of the period under analysis. These would usually be obtained from the taxpayers business records and completion by the taxpayer of asset and liability statements
The investigator is then able to examine the expenditure and ask further questions on any missing items etc. Items identified but not being recorded through bank accounts are then entered as having 'cash' as the source.
Source: NZ IRD survey response
Conclusions
29. For the countries surveyed, a number of innovations have been identified that may be of general interest to member countries. In particular, the use of industry benchmarks was a common theme and the survey brought to light a variety of methods for

21
systematically obtaining such information. Of particular note here was the ATO’s system of business activity statements which enables the production of industry benchmarks at considerably earlier point in time than other approaches. Similarly, the systematic development of a comprehensive industry/business sectoral guide appears to play a highly useful role in the countries where they are used in improving auditors’ awareness of unique risk factors within an industry/business and generally guiding them in their examination of taxpayers’ records.
30. Unfortunately, it was not possible from the survey responses to ascertain the extent of use of indirect income measurement tools or the tangible benefits realised from the innovations identified.

22
ANNEX 1
Income Tax: Use of Indirect Income Measurement Methods – Description of Available Methods and Issues Associated with their Use6
1. Name of Method: Source and Application of Funds Method (also known as the T-account method)
Description of method
The Source and Application of Funds Method of reconstructing income to determine the actual tax liability is an analysis of a taxpayer’s cash flows and comparison of all known expenditures with all known receipts for the period. Net increases and decreases in assets and liabilities are taken into account along with nondeductible expenditures and nontaxable receipts. The excess of expenditures over the sum of reported and nontaxable income is unreported taxable income.
This method is based on the theory that any excess expense items (applications) over income items (sources) represent an understatement of taxable income. Only the net increase or decrease in assets and liabilities are considered along with other expenditures and receipts.
When to use this method
The Source and Application of Funds Method is recommended in the following situations:
1) The review of a taxpayer’s return indicates that the taxpayer’s deductions and other expenditures appear out of proportion to the income reported.
2) The taxpayer’s cash does not all flow from a bank account which can be analyzed to determine its source and subsequent disposition.
3) The taxpayer makes it a common business practice to use cash receipts to pay business expenses.
2. Name of method: Bank Deposits and Cash Expenditures Method
Description of method
The Bank Deposits and Cash Expenditures Method computes income by showing what happened to a taxpayer’s funds. It is based on the theory that if a taxpayer receives money, only two things can happen: it can either be deposited or it can be spent. This method is based on the assumptions that:
1) Proof of deposits into bank accounts, after certain adjustments have been made for nontaxable receipts, constitutes evidence of taxable receipts.
2) Outlays, as disclosed on the return, were actually made. These outlays could only have been paid for by credit card, check, or cash. If outlays were paid by cash, then the source of that cash must be from a taxable source unless otherwise accounted for. It is the burden of the taxpayer to demonstrate a nontaxable source for this cash.
The Bank Deposits and Cash Expenditures Method can be used in the examination of both business and nonbusiness returns. It may supply leads to additional unreported income, not only from the amounts and frequency of deposits, but also by identifying the sources of such deposits. Determining how deposited funds are dispersed or accumulated (to whom and for what purpose) might also provide leads to other sources of income.
If the Bank Deposits & Cash Expenditures Method indicates an understatement of income, it may be due to either unreporting of gross receipts or overstating expenses, or a combination of both.
6 Identification and description of the formal indirect methods and their use for this note were obtained
from the US Internal Revenue Service’s Examination Manual. The information provided in this note is a short extract only and parties interested in finding out more information on these methods can access the manual on the website of the IRS or the International Tax Dialogue (www.itdweb.org), an initiative of the OECD, IMF and World Bank.

23
When to use this method
The Bank Deposits and Cash Expenditures Method should not be the automatic choice when selecting a formal indirect method to make the actual determination of tax liability. For example, cash intensive businesses, where significant amounts of gross receipts are not deposited and numerous cash outlays occur, do not lend themselves to this method.
If the Bank Deposits and Cash Expenditures Method is the method of choice, the entire analysis must be completed; shortened versions that do not account for business and personal cash expenditures are insufficient.
The Bank Deposits and Cash Expenditures Method is recommended when:
1) The taxpayer’s books and records are unreliable, unavailable, withheld, or incomplete.
2) The taxpayer makes periodic deposits of funds into bank account(s) which appear to be generated from an income-producing activity.
3) The taxpayer pays most business expenses by check.
4) The taxpayer previously used bank account deposits to determine and report taxable income.
The advantages of the Bank Deposits and Cash Expenditures Method include:
1) Provides a complete picture of the taxpayer's activities; it clearly reflects the size and scope of the taxpayer's financial activities.;
2) Avoids necessity of documenting business expenses, with the exception of technical adjustments such as depreciation.
3) When the taxpayer overstates business expenses, Gross Receipts is automatically adjusted in the mechanics of the calculation
3. Name of method: Markup Method
Description of method
The Markup Method produces a reconstruction of income based on the use of percentages or ratios considered typical for the business under examination in order to make the actual determination of tax liability. It consists of an analysis of sales and/or cost of sales and the application of an appropriate percentage of markup to arrive at the taxpayer’s Gross Receipts. By reference to similar businesses, percentage computations determine sales, cost of sales, gross profit or even net profit. By using some known base and the typical applicable percentage, individual items of income or expenses may be determined. These percentages can be obtained from analysis of relevant declared items in tax returns, official data of Government statistical bodies or industry publications. However, it is preferable to use the taxpayer’s actual markups if possible.
The Markup Method is a formal indirect method that can overcome the weaknesses of the Bank Deposits & Cash Expenditures Method, Source & Application of Funds Method, & Net Worth Method, which do not effectively reconstruct income when cash is not deposited and the total cash outlays cannot be determined unless volunteered by the taxpayer. If personal enrichment occurs that cannot be identified, the effectiveness of these methods is diminished. For example, the possibility exists that significant personal acquisitions or expenditures are paid with cash & are not evident.
The Markup Method can also be used when conducting audits of indirect taxes (e.g, retail sales taxes). The cost of goods sold is verified and the resulting Gross Receipts are determined based on actual markup. This method is most effective when applied to businesses whose inventory is regulated or purchases can be readily broken down in groups with the same percentage of markup. An effective initial interview with the taxpayer is the key to determining the pertinent facts specific to the business being examined.
24
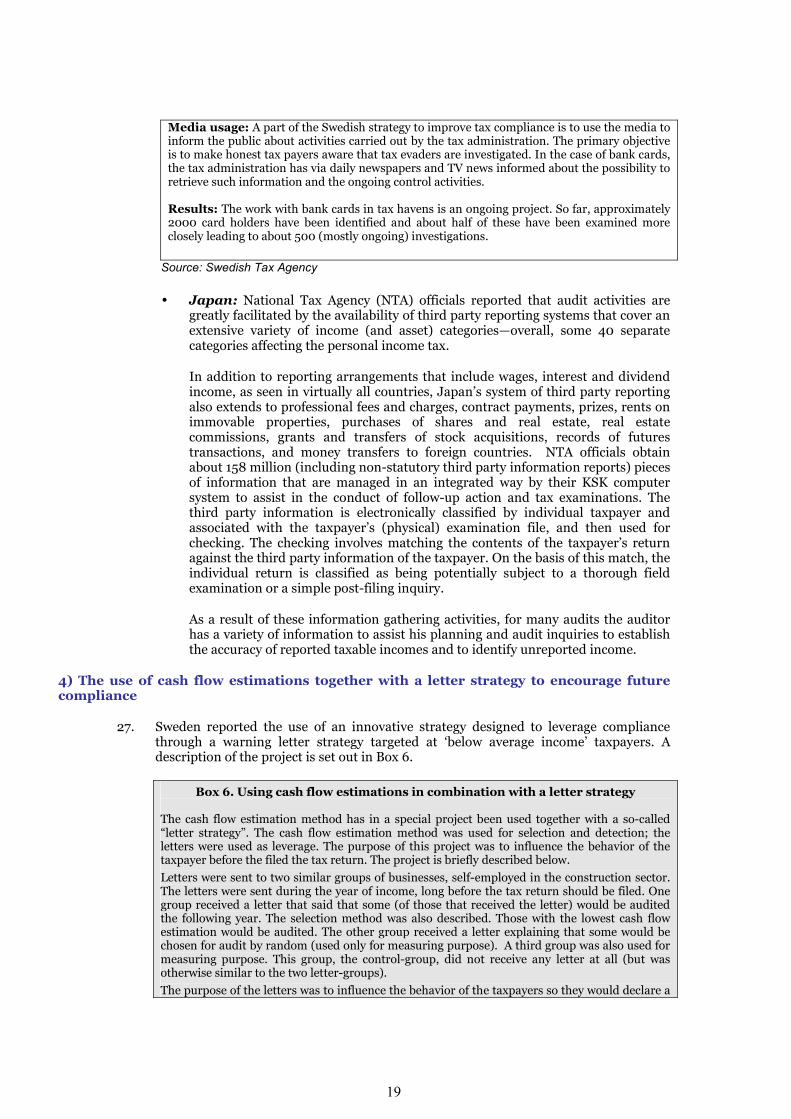
When to use this method
The Markup Method is recommended in the following situations:
1. When inventories are a principal income producing factor and the taxpayer has nonexistent or unreliable records.
2. Where a taxpayer’s cost of goods sold or merchandise purchased is from a limited number of sources, these sources can be ascertained with reasonable certainty, and there is a reasonable degree of consistency as to sales prices.
This method is effective for industries such as liquor stores, taverns, gasoline retailers, restaurants, and jewelry stores.
Auditors should address the following issues when applying the Markup Method:
1. Use the taxpayer's own records and oral testimony to establish the markup percentages based on known costs and sales prices. This should be the best source of information. Plausible explanations for why the taxpayer's markup percentages differ from national averages should be accepted.
2. If it appears that the cost of goods sold and/or purchases are also understated, issue a summons to the taxpayer's suppliers for sales records.
3. Judgment should be exercised by examiners when using industry standards or surveys to make sure the comparisons are valid and are for similar situations. Consider the availability of valid sources of information containing the necessary percentages and ratios. Adjust percentages and ratios to reflect those during the time of the return under audit.
Relevant to the use of this method is the prevailing law concerning burden of proof. In some countries, the law places the burden of proof on the revenue body (e.g. IRC section 7491(b) in the USA) with respect to any item of income that was reconstructed solely through the use of statistical information or unrelated taxpayers.
4. Name of method: Unit and Volume Method
Description of method
In many instances gross receipts may be determined or verified by applying the sales price to the volume of business done by the taxpayer. The number of units or volume of business done by the taxpayer might be determined from the taxpayer’s books as the records under examination may be adequate as to cost of goods sold or expenses. In other cases, the determination of units or volume handled may come from third party sources.
This method for determining the actual tax liability has been effectively applied in carryout pizza businesses, coin operated laundry mats, and mortuaries.
When to use this method
The Unit and Volume Method is recommended for making the actual determination of tax liability when: 1. The examiner can determine the number of units handled by the taxpayer and also
know the price charged per unit.
2. The business has only a few types of products which are sold or there is little variation in the types of services performed, and the charges made by the taxpayer (sales price) for merchandise or services are relatively the same throughout the tax period.

25
5. Name of method: Net worth method
Description of method
The Net Worth Method for determining the actual tax liability is based upon the theory that increases in a taxpayer’s net worth during a taxable year, adjusted for nondeductible expenditures and nontaxable income, must result from taxable income. This method requires a complete reconstruction of the taxpayer’s financial history, since the Government must account for all assets, liabilities, nondeductible expenditures, and nontaxable sources of funds during the relevant period. The theory of the Net Worth Method is based upon the fact that for any given year, a taxpayer’s income is applied or expended on items which are either deductible or nondeductible, including increases to the taxpayer’s net worth through the purchase of assets and/or reduction of liabilities. The taxpayer’s net worth (total assets less total liabilities) is determined at the beginning and at the end of the taxable year. The difference between these two amounts will be the increase or decrease in net worth. The taxable portion of the income can be reconstructed by calculating the increase in net worth during the year, adding back the nondeductible items, and subtracting that portion of the income which is partially or wholly nontaxable. The purpose of the Net Worth Method is to determine, through a change in net worth, whether the taxpayer is purchasing assets, reducing liabilities, or making expenditures with funds not reported as taxable income.
When to use this method
The Net Worth Method is generally recommended in the following situations: 1) Two or more years are under examination. 2) Numerous changes to assets and liabilities are made during the period. 3) No books and records are maintained. 4) The books and records are inadequate or not available. 5) The books and records are withheld by the taxpayer. The fact that the taxpayer’s books and records accurately reflect the figures on a return does not prevent the use of the Net Worth Method of proof. The Government can still look beyond the "self-serving declarations" in a taxpayer’s books and records and use any evidence available to determine whether the books accurately reflect the taxpayer's financial history. While the Net Worth Method was originally used against taxpayers whose principal source of income was from an illegal activity, it is now regularly recommended in fraud cases, especially where significant changes in net worth have occurred and other methods of proof are insufficient. In addition to being used as a primary means of proving taxable income so that an actual determination of tax liability can be made, the Net Worth Method is relied upon to corroborate other methods of proof and test the accuracy of reported taxable income.
Potential Taxpayer Defenses against Formal Indirect Methods of Computing Income: If the use of a formal indirect method results in an apparent understatement of taxable income, it is important that the auditor be prepared to address the taxpayer's potential defenses. The defenses can be grouped into three categories:
1. Showing that the computation is inaccurate or flawed, 2. Showing that the unexplained difference is due to a nontaxable source, or 3. Showing that the unexplained difference is from expenditures of available cash
accumulated in prior years. Computation is Inaccurate or Flawed Bank Deposits and Cash Expenditures Method—Most challenges to the accuracy of this method focus on the nature of the individual deposits in the account(s). The taxpayer may claim that the deposits consist of taxable and nontaxable items that were not correctly classified by the examiner. Deposits of loan proceeds, gifts and inheritances, as well as
26
transfers from other accounts are some of the most common claims. Redeposits of items, such as insufficient funds checks, may also cause inaccuracy if counted twice. The examiner should carefully review the analysis and attempt to identify the source and character of each deposit before presenting results as an understatement of taxable income. Source and Application of Funds Method—Most common errors are in the areas of adjustments for the accrual method of accounting and the handling of loan transactions. Examiners should insure these areas, as well as the entire computation, are correct and fundamentally sound. Markup Method—The main challenges to this method are to show that the computation relies upon improper percentages, improper cost of sales, or that the examiner’s computation fails to give adequate consideration to significant items such as spillage, breakage or theft losses. These issues should be addressed and quantified during the initial interview. Since the method relies on a comparison of a situation similar to that under examination, defenses could be formulated based on dissimilarities in several areas such as type of merchandise handled, size of the operation, locality, time period covered, or general merchandising policy. Net Worth Method—Challenges to the accuracy of this formal indirect method are generally aimed at the correctness of the opening net worth figure and the failure to prove "cash on hand " in the understatement years. An accurate opening net worth figure is essential and should be computed based on solid evidence. The amount of "Cash on Hand," and/or "Accumulated Funds" if any, must be established early in the examination to refute this defense. The concepts of "Cash on Hand" and "Accumulated Funds" is an important concept in formal indirect methods and is discussed below. Unexplained Difference is Due to a Nontaxable Source
The taxpayer may attempt to refute the findings of the examiner’s formal indirect method by claiming the unexplained difference is actually caused by the receipt of nontaxable sources of funds. If it can be shown that all nontaxable sources of income have been considered, then it can be concluded that the only likely source remaining is a taxable one. Examiners need to show that increases in taxable income arose from a likely taxable source. This can be demonstrated by specific omissions, showing the taxpayer’s business had the capacity to generate more sales, or comparisons over time. To the extent that the possible source can be identified, the more acceptable the computation will be. Unexplained Difference is Due to Cash on Hand or Accumulated Funds
The taxpayer may attempt to refute the findings of the examiner’s formal indirect method by claiming the unexplained difference is actually caused by the use of nontaxable funds accumulated in prior years. Since Cash on Hand and Accumulated Funds are important fundamental aspects of the examination of income and the formal indirect methods, examiners should establish the amount and verify the taxpayer’s statements of cash accumulations during the initial interview. This is necessary because:
A. Cash on Hand and Accumulated Funds can explain Financial Status Analyses that appear to identify a potentially significant imbalance. The issue can be resolved quickly and with the least amount of burden to the taxpayer if it is addressed early in the examination.
B. The information is needed to determine whether a formal indirect method should be used, and which method is most appropriate.
C. An adjustment for unreported income can be challenged if the availability of Cash on Hand and Accumulated Funds is not addressed at the beginning of the audit. The after-the-fact "cash in the mattress" defense cannot be used if the actual Cash on Hand and Accumulated Funds have already been established.

27
ANNEX 2
Selected Case Study Examples (Australia, Finland, Japan, United Kingdom and United
States)
1) AUSTRALIA: T-account method (also known as the Source and Application of Funds method) of taxable income measurement
Background
The T–account is a method that indirectly measures taxable income and is designed to look at 'unreported transactions’. It was first introduced in 1976, and has been effective in increasing audit coverage while maintaining a high level of examination quality. It is widely used in Australian Taxation Office audit areas and an electronic version with accompanying schedules has been developed. Whilst not specifically mentioned in Australian taxation legislation, the use of the T–account technique of taxable income measurement by the Tax Office has been established by acceptance in numerous tax Tribunal cases and several Federal and Full Federal Court tax cases.
The T-account is based on the following principles:
• taxable income is correct, where Funds Available equal Funds Expended • all cash transactions, whether business or non-business, entered into by a taxpayer
during the period under review must be reflected in the T-account • non-cash items are not shown on the T-account, and • a T-account covers one income year only.
The T-account enables an auditor to ascertain in the shortest possible time whether an understatement exists and the extent of that understatement. The T-account is appropriate for cases dealing with small businesses that are simple in structure, such as sole traders and partnerships. Its successful application to more complex structures such as companies or trusts will depend on the experience and judgment of the auditor.
T-account theory
The T-account deals with cash and cash flows. Any non-cash items included in the Income Tax Return (ITR) figures must be eliminated e.g., depreciation, stock on hand, work-in-progress (W.I.P.). Owing to continual changes in the law there may at any time be other claims which do not represent an expenditure of cash during the relevant period. This could include items such as Investment, Research & Development or Landcare Incentives. All non cash items are removed from the T-account. The T-account compares cash available at the beginning of the period plus cash received during the period with cash expended during the period plus cash on hand at end of the period. In other words, the basic principle is:
Cash at beginning +
Funds received =
Cash at end +
funds expended Given that all information is correct then cash available must equal cash expended.

28
The T Account includes the following information which is obtained from both the income tax returns under review and the taxpayer's books and records: Funds available Funds expended Opening bank balances Closing unpresented cheques
*Closing creditors *Opening debtors
Gross receipts as per return Capital receipts GST on sales
Other items, e.g. spouse and associates income, private loans, interest, gifts & prizes, wills, exempt income etc.
Closing bank balances Opening unpresented cheques
*Opening creditors *Closing debtors
Business expenditure as per return Capital expenditure GST on Purchases
Other expenditure, e.g. income tax paid, net wages expense, loan repayments, personal living expenses, and child support payments etc.
* Exclude when returns are prepared and are acceptable on the cash receipts basis.
Transactions affect the T-account in three different ways:
1. An increase in funds available matched by a similar increase in funds expended e.g. Sales of $200 increases funds available and increases the Current Account Balance by $200
2. A decrease in funds available matched by a similar decrease in funds expended e.g. payment of $350 to a creditor results in a decrease of $350 in the balance of creditors and a decrease of $350 in the Current Account Balance, and
3. An increase in funds expended matched by a similar decrease also in funds expended e.g. payment of rent $700 results in expense increase by $700 and Bank balance decrease by $700 both funds expended.
T-account case study
During the course of an audit of the income tax return for the period from 1 July 2003 to 30 June 2004 of Mr Terry Beckie, the following information was obtained from the initial interview questionnaire, the books of his newsagency business, his bank accounts and also from third parties: Bank account balance Account 123 456 999 Balance 1 July 2003 $3,000 Total deposits $220,000 Total withdrawals $221,000 Balance 30 June 2004 $2,000 Deposits of $220,000 were vouched (deposit slips were obtained from the bank) and are comprised of the following: a) cheque for a lotto win 1,500 b) cash deposits from the business 218,500 Total deposits $220,000
Withdrawals of $221,000 were comprised of the following expenses: a) Acquisitions (expenses paid) $202,517 b) Balance withdrawals attributed to personal living expenses $18,483

29
Third party searches reveal the following purchases a) purchase of used motor vehicle for spouse (13/09/00) $15,000 b) payment of capital improvements to residence (15/12/00) $6,000 Total unsourced expenses $21,000
Personal living schedule information stated by taxpayer Food and clothing at $350 per week $18,200 per annum Cigarettes (1 packet a day which cost $5) $4,825 per annum Medical expenses (approx $30 per month) $ 360 per annum Electricity ($125 per month) $1,500 per annum School fees ($1000 per quarter) $4,000 per annum Other incidental expenses $50 per month $ 600 per annum Total personal living expenses $29,485 per annum
Business activity statement information for the four quarters Sales(taxpayer advises he makes no GST-free supplies) $218,500 Acquisitions (expenses paid) $202,517 Net Payment (during the 2004 financial year) $1,453 Income tax return information Assessable Income returned $198,637 Business expenses claimed $184,107 Taxable income $14,530
Given the above information the T-account for Mr Beckie is reproduced as follows: The amount of the discrepancy is $33,455 and is traced to the payment of the following expenses via unsourced funds:
• payment of GST liability of $1,453 • purchase of spouse's motor vehicle for $15,000 • payment for home improvements for $6,000, and • personal living expenses of $11,002.

30
Australian Taxation Office: NORSTATEMENT OF FUNDS AVAILABLE & FUNDS EXPENDED - Year Ended 2004
Client: File No:
Folio FUNDS AVAILABLE $ FUNDS EXPENDED $ FolioBank/Credit Union Accounts Bank/Credit Union Accounts
3,000 2,000
Unpresented Cheques as at 30 June 2004Cash on Hand as at 1 July 2003
Trade Creditors at 30 June 2004 Trade Creditors at 1 July 2003Trade Debtors at 1 July 2003 Trade Debtors at 30 June 2004
Items as per return/BAS Items as per return/BAS Total Sales 198,637 Business Expenses claimed 184107 Less PAYG tax withheld 198,637 GST on Purchases 18,410 GST on Sales 19,863 218,500 202,517
Less Non Cash Items & PAYG withheld Capital Allowances/Depreciation
Capital Receipts (per bank records) Bad DebtsOther capital (inc Tax refunds) 1,500 Other non-cash expsSale of assets PAYG withheld 202,517Private LoansBusiness loans Loan Repayments (per bank records)Exempt Income 1,500 Business (Nil or Capital only)
Private Loan repayments
Other Items (per bank records) Capital Expenditure (per bank records) Net Salary Business Net Dividends/Interest Private Rent Other Income Other Expenses (per bank records) Spouse & Assoc Income BAS Payment Amount
Private (100%) 18,483 Private Portion Unexplained/Misc Withdrawals Tax paid Cashed Cheques (personal living exps) 18,483
Other private expenses
Vehicle for spouse 15,000Improvements to residence 6,000Balance of Living expenses 11,002
BAS payment 1,453
33,455
TOTAL FUNDS AVAILABLE 223,000 TOTAL FUNDS EXPENDED 256,455
(from Validation of Non Bank Expenditure sheet)
Other non bank receipts (from Validation of Non Bank Receipts sheet)
Related Entities Loan Acc as at 1 July 2003Cash on Hand as at 30 June 2004Related Entities Loan Acc as at 30 June 2004
123456782
Unpresented Cheques as at 1 July 2003
Total opening balance (per summary sheet) as at 1 July 2003
Total closing balance (per summary sheet) as at 30 June 2004
Mr Terry Beckie

31
Income tax returns and activity statements were amended based on this along with appropriate Tax Shortfall Penalty based on taxpayer behaviour.
Australian Taxation Office: NORCalculation of Understatement/Amended Taxable Income/GST-Year Ended 2004
Client: Mr Terry BeckieFile No: 123456782
TOTAL FUNDS EXPENDED 256,455Less: TOTAL FUNDS AVAILABLE 223,000
STATEMENT OF ADJUSTMENTS INTERIM UNDERSTATEMENT 33,455ADD:
Increase in Goods Own UseIncrease in Living AdvantagesIncrease in Non-Bus Motor Veh ExpensesIncrease in Non-Bus Motor Veh DepreciationImputation Credit not included in tax return
(NB: Allow imputation credit in amendment)Withholding Taxes not included in tax returnPrepayments made but not claimedOther (Please specify)
Total Additions (A) 0 Total Deductions (B) 0Total Additions/Deductions (A-B) 0
PRELIMINARY UNDERSTATEMENT 33,455Understatement of GST Payable (Transfer to BAS)* 3,041
TOTAL UNDERSTATEMENT 30,414 LESS: Understatement not belonging to client
CLIENT'S UNDERSTATEMENT 30,414NET/TAXABLE INCOME ASSESSED** 14,530
AMENDED NET/TAXABLE INCOME 44,944* The "Understatement of GST Payable" is 1/11 of the GST Applicable subtotal in the Reconciliation below **Extracted from Income Tax Return Lodged
Australian Taxation Office: NORCalculation & Reconciliation of Preliminary Understatement-Year Ended 2004
Client: Mr Terry BeckieFile No: 123456782
Preliminary Understatement 33,455
Yes NoUnidentified DepositsPurchase of Assets-sources unknown 15,000Personal Living Expenses-sources unknown 11,002Payments of Business Exp.-sources unknownBAS payment 1,453Home improvements 6,000
Sub-total 33,455 0 Discrepancy 0
LESS:Prepayments claimed but not made
GST Applicable

32
2) FINLAND: Use of indirect income measurement tools auditing catering business in Finland Example 1:
A tax audit report of company A includes the following facts:
Explanation
Amount Percentage
Monthly sales according to book-keeping
60,000 100 %
Sales of food (estimated) 10,000
Sales of alcoholic beverages 50,000 83,33 %
Purchases of alcohol beverages 40,000
Gross margin of alcoholic beverage sales
10,000 20 %
Purchases of alcoholic beverages are 50.000 € (according to comparison data).
In Finland selling and serving alcohol is a licenced trade and traders have to buy alcoholic beverages by using the licence number of the place concerned. Tax authorities obtain the information about these purchases from the licence authority (wholesalers declare their sales to the licence holders).
Estimated sales of alcoholic beverages = purchases + margin 81,8 % (= 45 %/of sales): 50.000 € x 1,81818 = 90.909 €
45 per cent is estimated gross margin according to prices this company has charged their customers (selling prices were found out in cash receipts or checked during tax audit in restaurant). Therefore the amount of hidden income is 30.909 € (90.909 € - 60.000 € = 30.909 €).
Whenever the company’s bookkeeping is unreliable, tax auditors normally make bank account inquiries in order to find out whether the hidden income or part of them are deposited in the owners (and their household) bank accounts. If there is any evidence of the money flows connected to the business (restaurant), it strengthens the measurement of non-reported income. By the same time tax auditors compare the lifestyles and expenses of the owners of the company to their reported income and if there is considerable “gap” without reasonable explanation this gives also grounds to make tax assessment by estimation. Anyway, it should be pointed out that the burden of proof lies with the tax authorities to invoke the facts that justify the tax assessment by estimation.
Example 2:
Here is another example of measurement of hidden income in a pub. This example is based on our experiences obtained during our Tax Audit project, which we conducted in the Finnish catering business.

33
Explanation Beer Cider Soft drinks
Sales according to cash 328 716 € 29 553 € 9 108 € receipts and invoices
Purchases according 217 204 € 16 693 € 7 872 € to accounting records Discounts 17 240 € Purchases of sold beverages 199 964 € 16 693 € 7 872 € Gross margin 128 751 € 12 840 € 1 236 € Gross margin -% 39,17 % 43,45 % 13,57 %
Gross margin - % by comparison of purchase and selling price 53 % 62 % 66 % Purchases of sold beverages 199 965 € 16 693 € 7 872 € Estimated sales (VAT) 425 457 € 43 929 € 23 153 € Sales according to cash 328 716 € 29 553 € 9 108 € receipts and invoices Difference 96 741 € 14 376 € 14 045 € Hidden incomes (rounded off) 97 000 € 14 000 € 14 000 €
Estimated hidden income was in total 125.000 € (97.000 €+ 14.000 € + 14.000 €). While calculating the compared gross-margin per cent we got the comparable selling price by interviewing the staff of pub and from cash receipts and invoices.
The facts that raised doubts concerning hidden income in this case were:
• Finding that the control tapes of pub’s cash registers included a lot of so called zero - strokes (non –sales) without reasonable explanation (indicia of suppressed registered sales).
• The gross margins of the sold beverages (beer, cider, soft drinks) were remarkably lower compared traders in the similar business.
• The gross margins of the sold beverages calculated in the pub’s book-keeping were also remarkably lower than the gross margin estimated in a calculation based on the purchase invoices of restaurant and the selling prices it used to have.
• According to the restaurants bookkeeping the purchases of beer in litres were higher than the sales of beer in litres in the same period (waste and supply were taken into account).
• The cash account in the bookkeeping showed sometimes a negative balance.
• The amounts of salaries to the owners of the company were low.

34
3) JAPAN: Taxation by Estimation Method 4 various case studies
Case 1 【 】Estimation method Taxpayer’s own business ratio Method 【 】Business type Greengrocer Estimated taxable income of the past year is estimated based on the taxpayer’s sales and gross purchase figures for the period from January to September of the current taxable year. ・ Amount of the greengrocer’s gross purchases of the past year: 33,617,428 Yen ・ Ratio of gross purchase over sales of the current year: 76.02% ・ Ratio of taxable income over gross purchase of the current year: 9.50% ・ Estimated amount of taxable income of the past year: 4,201,072 Yen 【 】Calculation 33,617,428 ÷ 76.02% = 44,221,820 Yen (Estimated sales amount) 44,221,820 × 9.50% = 4,201,072 Yen Case 2 【 】Estimation method Percentage for businesses in the same trade method 【 】Business type Freight transporters Estimated taxable income is estimated from the average percentage of taxable income obtained in the tax audit for businesses in the same trade.
People in the same
trade
Annual revenue
(Yen)
Cost of sales (Yen)
Taxable Income (Yen)
Ratio of taxable income Remarks
A 13,567,000 1,634,567 6,578,500 48.49%
B 25,989,400 2,890,300 8,890,350 34.21% Sales more than
twice of that of the transporter
C 22,567,200 2,125,900 8,340,200 36.96% D 8,907,330 1,202,500 4,500,300 50.52% E 11,000,500 1,358,900 5,450,400 49.55% F 13,670,390 1,780,500 6,450,120 47.18%
G 5,250,000 550,120 3,100,300 59.05% Sales less than half
of that of the transporter
Average ratio of taxable income for businesses in the same trade 〔 + + + + 〕(A C D E F)÷5 (Note: excluding those whose businesses are too large/small compared to the taxpayer (i.e. B and G above))
46.54%
・ Annual revenue of the freight transporter: 12,000,000 Yen ・ Average ratio of taxable income for businesses in the same trade: 46.54 % ・ Estimated amount of taxable income: 5,584,800 Yen
【 】Calculation 12,000,000 × 46.54% = 5,584,800 Yen

35
Case 3 【 】Estimation method Efficiency method 【 】Business type A barbecue restaurant Taxable income is estimated using the sales amount per ‘grill’ of businesses in the same trade.
(Note: in this type of restaurant, the customers cook the meat themselves over a grill embedded in the table. Therefore, the number of grills represents the sales of the restaurant.)
・ The number of grills for cooking meat in the restaurant: 18 ・ Sales amount per stove of businesses in the same trade: 2,900,000 Yen
・ Estimated sales amount: 52,200,000 Yen
【 】Calculation 2,900,000 × 18 = 52,200,000 Yen Case 4 【 】Estimation method Change of assets method (Net worth method) 【 Business type】 Recycling service Estimated taxable income is estimated according to the increase/decrease of the taxpayer’s net worth since actual figures for sales and purchases are difficult to obtain.
Item Beginning
of Jan. 2004(Yen)
End of Dec. 2004
(Yen)
Changes (Yen)
Increase/ decrease
(Yen) Remarks
Deposits 15,000,000 16,700,000 1,700,000 1,700,000 Land and bldg. 33,000,000 33,000,000 0 0
Assets Account receivables-
trade 4,500,000 5,500,000 1,000,000 1,000,000
Account payables-trade 1,400,000 2,000,000 600,000 -600,000
Liabilities Borrowings 20,000,000 18,000,000 -2,000,000 2,000,000
Living expenses 4,000,000 4,000,000 Additional adjustment Adjustment
Interest income 100,000 -100,000 Subtractive adjustment
Income estimated 8,000,000
【 】Calculation (Total assets at the end of the year – total assets at the beginning of the year) – (total liabilities at the end of the year – total liabilities at the beginning of the year) + additional adjustment – subtractive adjustment = Income of the enterprise before the deduction of expenditures for family employees

36
4) UNITED KINGDOM: Various methods Business Economics Models
HMRC holds detailed reports on specific industries. These explain how an industry operates and provide information about industry trends. The industries that HMRC hold reports on tend to be ones that have, from experience, been non-compliant. They are called Tactical Information Packages (TIPs).
These are used to provide background on an industry before an investigator begins an enquiry. They are also used to help the investigators create Business Economics Models. In situations where the records of a taxpayer have been discredited, the investigator may use these Business Economics Models. The investigator establishes the facts needed to make the model with the taxpayer then uses the model to create an estimate of income.
The Business Economics Model is effective in circumstances where there is enough information, but much of the information needed to compile a business model comes from the taxpayer who explains his business to the investigator. However, if facts are established before the taxpayer is told about what the investigator wishes to do then accurate estimations can be made.
Information Available
The information for income estimation can be categorised broadly into four categories detailed below. Statistics are also included with the information as support.
NB: Throughout, excerpts are taken from the report on “fish and chips” shops.
1. A picture of the industry is developed. This could be features that all businesses in this industry exhibit or a look at the factors affecting things such as the size and profitability of the industry. It will also look at the level of competition in the industry and how this impacts upon profitability.
For Example: Fried fish and chips have been the traditional British ‘fast food’ since Victorian times. Fish and chip shops usually do better the nearer they are located to shopping centres, housing estates or trading estates…
…The fish and chip shop sector is fragmented being mainly made up of small independent businesses, consisting of only one or two shops…
…Proprietors are keen not to pass price increases on, as customers often come from less affluent areas. Recently the price of cod has suffered dramatic price increases… it is likely that profit margins will be depressed.
2. How the business works. Detailed information about how the business is run, the equipment needed for the business and use of raw materials is provided. This is not always relevant to income estimation but often a rough estimate of revenue is obtained from the amount of inputs taking account of wastage.
For Example: The weight of potato lost during the various preparatory stages, losses at the frying stage and together with the weight of fried chips that have to be
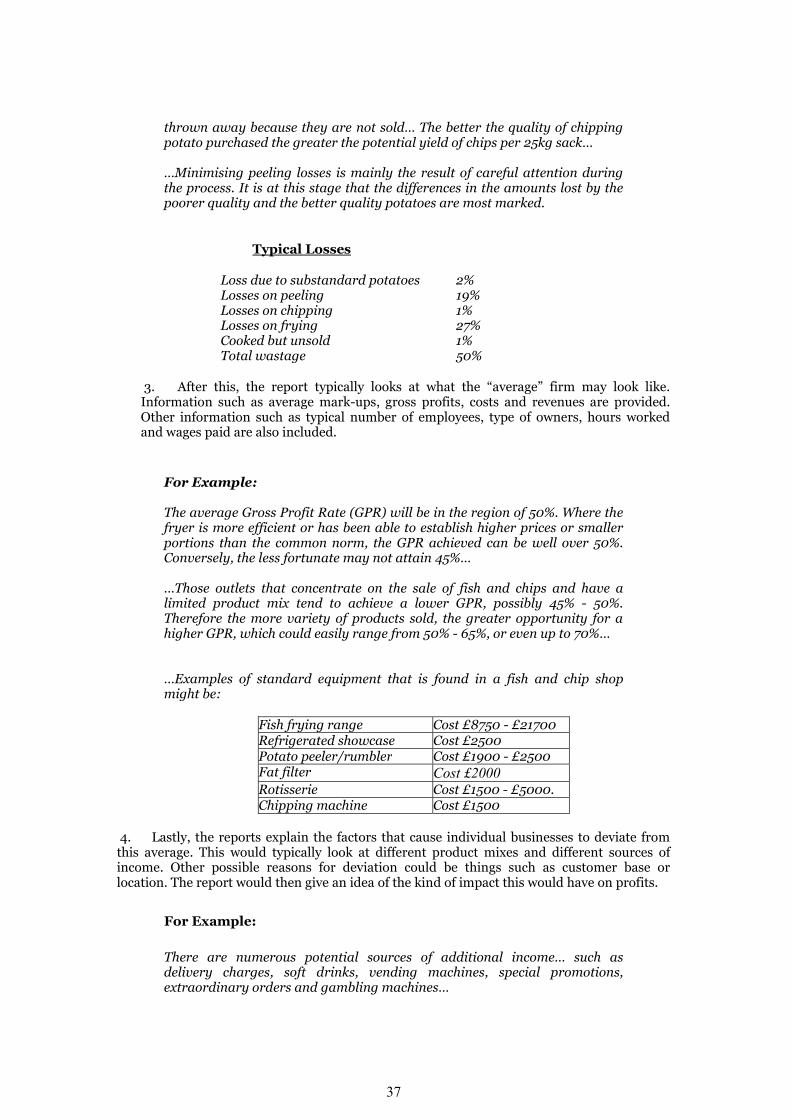
37
thrown away because they are not sold… The better the quality of chipping potato purchased the greater the potential yield of chips per 25kg sack… …Minimising peeling losses is mainly the result of careful attention during the process. It is at this stage that the differences in the amounts lost by the poorer quality and the better quality potatoes are most marked.
Typical Losses
Loss due to substandard potatoes 2% Losses on peeling 19% Losses on chipping 1% Losses on frying 27% Cooked but unsold 1% Total wastage 50%
3. After this, the report typically looks at what the “average” firm may look like. Information such as average mark-ups, gross profits, costs and revenues are provided. Other information such as typical number of employees, type of owners, hours worked and wages paid are also included.
For Example: The average Gross Profit Rate (GPR) will be in the region of 50%. Where the fryer is more efficient or has been able to establish higher prices or smaller portions than the common norm, the GPR achieved can be well over 50%. Conversely, the less fortunate may not attain 45%… …Those outlets that concentrate on the sale of fish and chips and have a limited product mix tend to achieve a lower GPR, possibly 45% - 50%. Therefore the more variety of products sold, the greater opportunity for a higher GPR, which could easily range from 50% - 65%, or even up to 70%… …Examples of standard equipment that is found in a fish and chip shop might be:
Fish frying range Cost £8750 - £21700 Refrigerated showcase Cost £2500 Potato peeler/rumbler Cost £1900 - £2500 Fat filter Cost £2000 Rotisserie Cost £1500 - £5000. Chipping machine Cost £1500
4. Lastly, the reports explain the factors that cause individual businesses to deviate from this average. This would typically look at different product mixes and different sources of income. Other possible reasons for deviation could be things such as customer base or location. The report would then give an idea of the kind of impact this would have on profits.
For Example:
There are numerous potential sources of additional income… such as delivery charges, soft drinks, vending machines, special promotions, extraordinary orders and gambling machines…

38
…Occasionally the outlet will also include a café … Where the café is more of a restaurant, the proprietor may be able to charge higher prices… …As part of their promotional strategy they may consider adopting a number of simple ways to attract new custom, such as discounts for certain groups of customers, e.g. students or senior citizens.
Example of the tool
A fish and chips shop submits its declaration of income to HMRC. It is looked at by RIAT who find that the GPR is 25% which is much lower than other fish and chip shops. An investigator takes up the case and meets with the taxpayer, he finds that the taxpayer made no record of money taken out of the company. The investigator also discusses in detail the aspects of the business that may ultimately impact on the business economics model. This means going through possible reasons why the GPR is so low and either ruling them out or making suitable adjustments to the model. The investigator looks at:
• What price cuts have been made and what discounts are offered? • What sort of product mix does the shop offer? • Whether there is any evidence of theft? • What sort of levels of wastage there is in the preparation of fish and chips? • What competition is there from other takeaways or other fish and chip shops? • Is the owner experienced or new to the industry? • Can external factors affect low GPR? E.g. Health scares over fast food.
The investigator establishes that the shop does have a low product range and relatively high wastage but other factors are ruled out. The shop mainly sells fish and chips but has some other goods such as soft drinks and packaged Cornish pasties etc. The investigator does not believe that low product variety and wastage is enough to explain the low mark-up so looks further. Analysis of a sample of purchase invoices and discussion with the owner shows the following product mix. Taking wastage and other costs into consideration, the investigator and taxpayer work out some mark-ups that they are both happy with.
Product Mix Mark Up Fish 25% 45% Chips 40% 50% Soft Drinks 15% 15% Misc. 20% 15%
(0.25 x 0.45) + (0.40 x 0.5) + (0.15 x 0.15) + (0.20 x 0.15) = 0.365 = 36.5% The investigator finds that there should be a larger GPR of 36.5% and adjusts the owner’s tax liability accordingly. However, the owner objects on the grounds that the method is too imprecise and cannot show the true profit. The investigator acknowledges that the business economics may not be precise but remains satisfied that the records are unreliable and that they are entitled to base their estimate on appropriate evidence. The taxpayer is offered the opportunity to present a revised calculation based on a detailed analysis of the whole year's invoices using the agreed mark-ups. The taxpayer, after discussion with a tax adviser, decides not to pursue this and accepts the investigator’s decision.

39
Methods used for indirect taxes Commonly used methods of calculating income when the credibility of VAT returns is in question include –
◊ Cash reconciliation – similar to Capital Statements. ◊ Mark Up – similar to Business Economics Models. ◊ Parts to Total. ◊ Subsidiary records. ◊ Components
1) Parts to total The principle of Parts to total is to calculate expected sales by using the relationship between elements of a supply. For example; Parts: Total – for repairers, installers Drinks: Total – for restaurants The ratios are calculated from an analysis of sales invoices in the case of repairers etc, or meal slips in the case of restaurants. Example: On an assurance visit to the Chinese Flower Restaurant the auditor extracts the following information. Restaurant Bills One month’s bills, agreed with the taxpayer as being typical and representative of the normal pattern of trade have provided these totals: £ Total Charge (Sales) 19,533 Tax Inclusive Charge for Drinks 3,709 Tax Inclusive Purchase Records From three months purchase records the following details have been extracted: Purchases (Tax Exclusive) £ Mark-Up % Bottled Beer 1200 44 Whisky, Gin etc 1300 193 Wine 8600 75 Sherry 900 305 Liqueurs 750 167 Other Information Output Tax Declared for the Year 36,526 Input Tax Declared for the Year 8,220 Total Paid 28,306 Input Tax on Expenses 3,232 Stock of Liquor said to have increased by £2000 (Tax Exclusive)

40
Examination of the Purchase record substantiates the Input Tax claimed and confirms that the Input Tax incurred on goods is only for Beer, Wines and Spirits. Tax Rate 17½% The Officer uses the information above to calculate a drinks-to-total ratio as follows – Stage 1 Drinks Charge 3709/19533 x 100 = 18.98%
Stage 2 £ £
Bottled Beer 1200 + 44% = 1728.00 Whisky, Gin etc 1300 + 193% = 3809.00 Wine 8600 + 75% = 15050.00 Sherry 900 + 305% = 3645.00 Liquors 750 + 167% = 2002.50 12750 26234.50 Sales = £26,234.50 Purchases = £12,750 Gross Profit = £13,484.50 Mark-Up = 13484.50/ 12,750 x 100 = 105.76%
Stage 3
Calculation of cost of drinks sold: £ 1. Total input tax deducted = 8,220 2. Less input tax on expenses = 3,232 4,988 3. Net drinks therefore £4,988 x 40/7 = 28,502 4. Less stock increase = (2,000) 5. Therefore cost of drinks sold = 26,502 Stage 4 £26,502 + 105% M/UP on drinks = £54329.10 (VAT exclusive sales of drink) (rounded down). Stage 5 £54329.10/18.98 x 100 = £286,243.94 Output tax due at 17½% = £50,092.68 Declared Output tax = £36,526.00 ****** Under-declaration assessed = £13,566.68
2) Subsidiary records Subsidiary records are generally the ones that are additional to those that make up the VAT audit trail. The actual subsidiary records available for a business will very much depend upon the type of business, and whether it is an invoice or retail business. Subsidiary records are particularly useful for an invoice business, where it is possible to trace transactions through the system, although some cash businesses will maintain subsidiary records (e.g. a hairdresser’s appointments diary). For example, the sales VAT audit trail for an invoice business supplying goods may look like this: -

41
Sales Invoice SDB
VAT Account VAT Return
Staff Sales Cash Book The records shown are those that will normally be examined as part of the basic checks. However what happens prior to the sales invoice being received? There is likely to be the receipt of an order from the customer. The goods may be taken from stock, for which a picking list may be created, advising the warehouse staff to select the goods for despatch. A despatch note may then be raised with one copy going with the goods to the customer, and one copy to the accounts team, from which the sales invoice will be raised. In this case the full audit trail will look like this: - Order received Orders in book Picking list Despatch note Sales Invoice SDB VAT account VAT Return
Staff Sales Cash Book
There can be a number of stages prior to the raising of the invoice and if there is a breakdown in any of these stages then an invoice may not be raised and/or output tax may not be accounted for on the supply. By asking the taxpayer to describe how the business goes about securing an order or work, and getting them to show the records, procedures and paperwork used at each stage through to the invoice being recorded in the SDB (or sales ledger etc). The Assurance Officer should then have a complete picture of how the whole system operates. This is equally applicable to all businesses, regardless of whether they are supplying goods or services. Through evaluating this whole system the Assurance Officer, should then be able to decide how best to use these records, procedures and paperwork in order to test the completeness of the output tax records. This may involve using the records making up the full audit trail, or additional paperwork used for the administration of the business e.g. job cards, delivery records, diaries, customer files, time sheets, commission records, customer guarantees etc. etc. In addition to tracing transactions through the sales system, by establishing how the whole system operates, we may be able to link sales to purchases. If a taxpayer buys goods and puts them into stock, then they will not be for any particular customer. However when an order is received, goods may not be in stock, which means that they may need to be ordered. The order received will probably be entered into an orders received book, and a purchase order will then be raised which will be sent to their supplier. There will probably be a separate set of records to record the Purchase Order. When the goods arrive the taxpayer will need to know to which customers order they relate and so will need to have a link between the customers order and the order issued to the taxpayers supplier. If we can identify what this link is, (i.e. how he knows which customer the goods are for – reference numbers etc.) the Assurance Officer can use this same link to test the credibility by selecting purchase orders/invoices and tracing these to their sales invoice to confirm output tax has been accounted for. One of the advantages of invoice businesses is that it may be possible to trace quantities through the system. In addition to looking at complete orders we may be able to look at quantities in and compare these to quantities out. Both the purchase and sales invoices should

42
show the quantity of goods supplied. For example, the number of boilers purchased by a central heating installer should equal the number installed (adjusted for any held in stock). There is one other primary way of using subsidiary records – Third Party Information. This is by using information contained on invoices or other subsidiary records and tracing this to the related sales invoice. There can be many types of transactions where this can be applied, but one of the most common is where the delivery address shown on the purchase invoice can be traced through to sales invoices. For example:
• Goods delivered direct to the customer • Where a taxpayer has passed work to another business, the invoice from the sub-
contactor will show the work done, which will usually include the customer’s details. For example, a carpet fitter may show the address where the carpet was fitted.
Example: A private-hire car company declared 15 cars, each of which is rented to a self-employed taxi driver for £150 per week. After an extensive interview with the taxpayer during which he confirmed that each vehicle used a unique “call sign” and that the fee charged was the same whether the car was used full-time or part-time the Officer examined subsidiary records. From licence information, insurance documents and call sheets listing all journeys booked by the business it was clear that 25 cars were hired each week. The taxpayer eventually admitted to suppressing his income and an under-declaration of £9,293 VAT per year was assessed after allowances. 3) Components In many industries there is a relationship between the goods purchased and the final goods sold, for example, a manufacturer of jeans will purchase zips or buttons and there can easily be established a relationship between the number of zips purchased and the number of jeans manufactured. Assurance Officers will examine the final product, to determine: 1) What is it made from? 2) How is it made? 3) How is it presented? 4) How is it sold/delivered? Are there any common components, i.e. every X supplied has 2 Ys, therefore by establishing the total Ys used, the volume of supplies can be determined Examples of areas that are checked include –
• Linked Components: E.g. clothing/zips, electric kettles/elements etc
• Bulk ingredients – industrial recipes • Labour charges
• Piecework
• Sub-contractors
• Machine capacity
• Packaging (costs and types used)
• Commission (sales staff)

43
• Delivery charges – weight
• Postage Having established one or two common components they can be used to establish credibility. For Example: A company’s main business activity is the manufacture, sale and installation of double-glazing units. Sales are obtained through 4 sales representatives who receive a commission on each completed contract. The commission is an agreed percentage of the VAT - exclusive contract price and is paid by self-billed tax invoice. The commission paid to each representative net of VAT over the last year, which is given below, has been obtained from the purchase daybook. Representative Commission % Commission Paid £ South West 15 19,850.78 South East 20 35,402.64 Midlands 17.5 29,180.35 North 25 24,242.20 The subsidiary activity of the company is the sale of burglar alarm systems to an associated company. Three types of system are supplied. £ Proportion of sales Intrudaguard 750 20% of sales by volume Intrudaguard - Plus 1150 55% of sales by volume Intrudaguard - Super 1950 25% of sales by volume Each unit contains a control unit and an alarm The above figures are net of VAT. Over the past year, the following component parts have been bought: Component Unit Cost Opening Stock Purchase Closing Stock Wire 40p/metre £200 £1300 £50 Relays 50p £75 £518 £65 Switches 50p £80 £250 £70 Alarm Control Unit
£60 £1200 £7320 £120
Infra-Red Detectors
£20 £400 £15080 £200
Pressure Pads £12.50 £125 £5100 £50 Alarms £17.50 £350 £2135 £35 Halogen Lamps £3 £60 £810 £30 The declared outputs for the year were £705,936. The Officer calculates the expected income from the information provided above - a. Calculation of double-glazing sales: South West: £19,850.78 ÷ 15 x 100 = £132,338.53 South East: £35,402.64 ÷ 20 x 100 = £177,013.20 Midlands: £29,180.35 ÷ 17.5 x 100 = £166,744.85 North: £24,242.20 ÷ 25 x 100 = £ 96,968.80 £573,065.38

44
b. There is one alarm and one alarm control unit per system. Alarm Control Units: £1200 + £7320 - £120 = £8400 ÷ £60 = 140 Alarms: £350 + £2135 - £35 = £2450 ÷ £17.50 = 140 Therefore, 140 systems have been supplied over the past year; the respective
percentage of each has been given. Intrudaguard 140 x 20% = 28 x £750 = £ 21,000 Intrudaguard - Plus 140 x 55% = 77 x £1150 = £ 88,550 Intrudaguard - Super 140 x 25% = 35 x £1950 = £ 68,250 £177,800 Total calculated sales = £573065.38 + £177800 = £750,865 Total declared sales = £705,936 Discrepancy = £44,929 VAT on the discrepancy = £44,929 x 17.5% = £7,862.58 As the taxpayer can provide no plausible explanation for the discrepancy an assessment is issued for £7,862.

45
5) UNITED STATES: Various methods Bank Deposit and Cash Expenditure Method The taxpayer operated a convenience store with gross receipts in the $800,000 range. The taxpayer reported a profit of $25,000. Similar profits have been reported for several years. The taxpayer claimed a cash hoard of $40,000 in the initial interview. The following was uncovered during the audit: 1. While analyzing the deposit detail, the examiner uncovered $105,000 in checks received
from a major cigarette manufacturer, not booked as income. 2. The agent discovered through internal sources that the taxpayer paid $90,000 in cash to
pay off his home mortgage. An unrelated Form 8300 cash transaction compliance review on an attorney was completed by another agent. A bank had filed a notice with the IRS that an attorney deposited $27,000 in cash in an escrow account. The cash was used to purchase land by the taxpayer.
The taxpayer was confronted with the evidence of cash transactions. In addition to the initially disclosed cash hoard of $40,000, the taxpayer now stated that four relatives brought him $25,000 each from Egypt for an additional $100,000 in cash.
Results: The cash hoard (accumulation of funds) explanation was not accepted based on minimal income reporting in prior years and other factors. An understatement of over $100,000 for two years was determined using the bank deposit and Cash Expenditures indirect method. The mortgage payoff, land purchase, and other items purchased with cash, that had never been reported as taxable income, were included in the calculations. Mark-up Method Example 1 An agent used the Mark Up indirect method to determine the gross receipts for a bagel shop. First, the agent determined how much flour the taxpayer purchased by analyzing the purchase invoices; 9,648 100lbs. bags. From the taxpayer’s records, the agent knew the sales prices of bagels to be $3.60 per dozen when sold to the public, which was 25% of his sales. When sold wholesale (75% of sales), the price was $1.43 per dozen. Therefore, the agent knew that 2,451 bags of flour were used for bagels sold at the retail price, and 7,197 bags were used for bagels sold at the wholesale price. The last piece of information needed to determine the gross receipts is the number of bagels that can be made from a single 100lbs. bag of flour. By observing the process, the agent knew that 1 bag of flour produced 18 baking boards of bagels and that there were 2.5 dozen bagels per board. Therefore, 45 dozen bagels were possible. After consideration of promotions, theft, and damaged goods, the agent estimated that 40 dozen bagels were produced from each bag of flour. Gross Receipts was determined to be $764,613.
RETAIL WHOLESALE # of Bags of Flour 2,451 7,197 Dozens of Bagels per Bag of Flour x 40 x 40 Dozens of Bagels Produced 98,040 287,880 Price per Dozen of Bagels $3.60 $1.43 Total Gross Sales from Bagels
$352,944
$411,669
Result: An understatement of income was determined.

46
Example 2 The taxpayer (TP) has been in the restaurant business for 15 years, which was the taxpayer’s sole source of income. The majority of the income is from “dine in” business; however, there is a significant carry-out business. The TP never netted more than $15,000 in any one year of operation. The restaurant served a variety of Italian dishes. The TP stated that he worked at the business 14 hours a day, usually 7 days a week. The TP indicated that the books and records were lost in a break-in at his home. The agent concluded that income and expenses reported on the tax return were either estimated or just made up because of the large variances in operating costs during the tax periods. The agent obtained some personal bank statements that reflected little activity. Accounts were disclosed through internal sources indicating money was being funnelled to his sister. A former bookkeeper revealed at least one of the taxpayer’s schemes to skim income. The owner had tight controls on the take-out business; when payments for take out service were received, the tickets were destroyed and the cash diverted to the taxpayer. The examiner took the following steps: 1. The examiner visited the restaurant during different hours of operation and observed that
the taxpayer’s estimate of volume of business was understated. The examiner counted the number of customers, segregated by time of day.
2. An interview was conducted to develop a mark-up method based on the menu. The menu
items were separated into broad categories and the costs and profit margin discussed and then validated. The examiner secured food purchase documents for the tax year under audit and reviewed Sales Tax Filings for consistency.
Results: This four-year examination resulted in the identification of approximately $70,000 of unreported income each year. Example 3 - Combined Mark Up/Bank Deposit and Cash Expenditure Method The examiner toured the Chinese restaurant business to document the number of booths, tables, cash registers, unrelated sources of income, and assets. A current menu was secured, as well as some basic information from the taxpayer in spite of a language barrier (the agent used a Chinese dictionary). The agent observed over 100 customers enter for lunch and determined the percent of customers ordering the set price buffet. The examiner also visited the court house for business license information and records for real property, and checked motor vehicle information. The owner’s vehicle was later observed in the rear of the building. A “drive by” of the personal residence was completed as part of the financial analysis. An analysis of checks disclosed a notable absence of “purchases.” The taxpayer had only disclosed that rent was paid by cash. The examiner also utilized techniques found in the Restaurant Audit Technique Guide which increased thoroughness while saving time. Results: The agent determined that the taxpayer arrived at income through bank deposits and that most purchases were paid in cash (approximately $75,000 each year). The inspection of source documents for purchases, and contacts with third party vendors, confirmed that all cash purchases should be added to the bank deposits. Hence, taxable income was increased. An alternative position, using the Markup Method, was documented and was consistent with the Bank Deposit and Cash Expenditure Method.

47
ANNEX 3
National Standards for Allowable Living Expenses
Collection Financial Standards for Food, Clothing and Other Items. Due to their unique geographic circumstances and higher cost of living, separate standards have been established for Alaska and Hawaii .
One Person National Standards: Based on Gross Monthly Income Item less
than $833
$833 to
$1,249
$1,250 to
$1,666
$1,667 to
$2,499
$2,500 to
$3,333
$3,334 to
$4,166
$4,167 to
$5,833
$5,834 and over
Food 197 215 231 258 300 339 369 543
Housekeeping supplies 19 20 25 26 29 36 37 51
Apparel & services 60 61 70 75 100 124 134 207
Personal care products & services
19 24 26 27 40 42 43 44
Miscellaneous 108 108 108 108 108 108 108 108
Total $403 $428 $460 $494 $577 $649 $691 $953
Two Persons National Standards: Based on Gross Monthly Income Item less
than $833
$833 to
$1,249
$1,250 to
$1,666
$1,667 to
$2,499
$2,500 to
$3,333
$3,334 to
$4,166
$4,167 to
$5,833
$5,834 and over
Food 336 337 338 424 439 487 559 691
Housekeeping supplies 36 37 38 48 52 53 107 108
Apparel & services 81 88 91 95 125 132 164 276
Personal care products & services
33 34 35 43 44 51 56 71
Miscellaneous 134 134 134 134 134 134 134 134
Total $620 $630 $636 $744 $794 $857 $1,020 $1,280
Three Persons National Standards: Based on Gross Monthly Income Item less
than $833
$833 to
$1,249
$1,250 to
$1,666
$1,667 to
$2,499
$2,500 to
$3,333
$3,334 to
$4,166
$4,167 to
$5,833
$5,834 and over

48
Food 467 468 469 470 490 546 622 778
Housekeeping supplies 41 42 43 49 53 55 108 109
Apparel & services 132 144 157 158 159 188 204 303
Personal care products & services
34 36 37 44 45 52 61 79
Miscellaneous 161 161 161 161 161 161 161 161
Total $835 $851 $867 $882 $908 $1,002 $1,156 $1,430
Four Persons National Standards: Based on Gross Monthly Income Item less
than $833
$833 to
$1,249
$1,250 to
$1,666
$1,667 to
$2,499
$2,500 to
$3,333
$3,334 to
$4,166
$4,167 to
$5,833
$5,834 and over
Food 468 525 526 527 528 640 722 868
Housekeeping supplies 42 43 44 50 54 61 109 110
Apparel & services 146 169 170 171 174 189 217 317
Personal care products & services
37 42 43 45 46 53 62 81
Miscellaneous 188 188 188 188 188 188 188 188
Total $881 $967 $971 $981 $990 $1,131 $1,298 $1,564
More than Four Persons National Standards: Based on Gross Monthly Income
Item less than $833
$833 to
$1,249
$1,250 to
$1,666
$1,667 to
$2,499
$2,500 to
$3,333
$3,334 to
$4,166
$4,167 to
$5,833
$5,834 and over
For each additional person, add to four person total allowance:
$134 $145 $155 $166 $177 $188 $199 $209
effective January 1, 2005