Strategy updates Foto gebouw. 2 Start of a new decade In Q1 2005, KBC merged with its parent company...
15
Strategy updates Foto gebouw
-
Upload
shanon-pierce -
Category
Documents
-
view
212 -
download
0
Transcript of Strategy updates Foto gebouw. 2 Start of a new decade In Q1 2005, KBC merged with its parent company...

Strategy updates
Foto gebouw
2
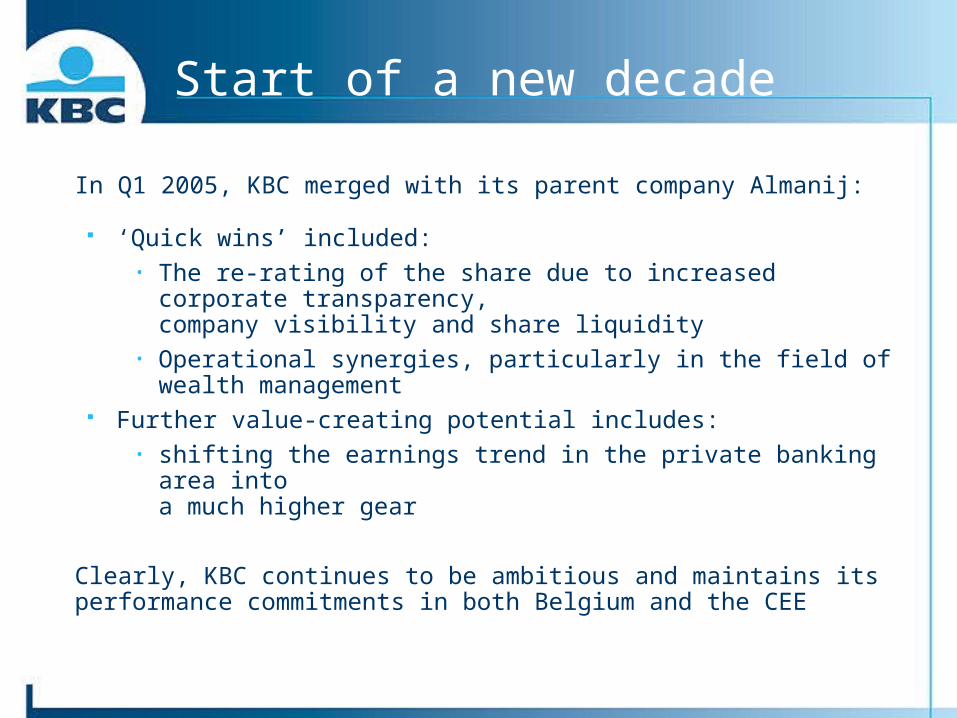
Start of a new decade
In Q1 2005, KBC merged with its parent company Almanij:
‘Quick wins’ included:• The re-rating of the share due to increased corporate transparency,
company visibility and share liquidity• Operational synergies, particularly in the field of wealth management
Further value-creating potential includes:• shifting the earnings trend in the private banking area into
a much higher gear
Clearly, KBC continues to be ambitious and maintains its performance commitments in both Belgium and the CEE

3
The first harvest is in
105 104
100
104
100
105
112
115
108
117
100102
Dec-04 Jan Feb Mar Apr May-05
An initial layer of ‘merger benefits’ has already appeared: The ‘ugly duckling’ discount has disappeared
(indication: at pre-merger price of 48 € - avg. 3Q04 - a hypothetical 10% discount represents 4.8 €/share - total 1.8 bn)
Today, KBC has grown to 25 bn market cap with a ytd average daily trading turnover of 47 m (velocity, last 12 months: 50%)
DJES
DJES
• Outperformance driven by strong fundamentals • Outperformance facilitated by increased stock visibility and liquidity
DJESDJES
DJES
DJES
Share price, 31 May 05, ytd (KBC +17% vs. DJES banks 4%)(Dec04 = 100)

4
0
20
40
60
80
By Area By Type
Operational synergies - reminder
Type of Benefits*
€m
Revenue(40%)
Cost (60%)
ICT & Overheads
Asset Managemen
t
Insurance
Corporate
Fin. Markets
Securities
Payments
16.7
12.6
27.7
74.6
12.6
3.9 1.0
0
10
20
30
40
50
60
70
80
Cross Sales
NewBus'ness
Optimi-zation
Pro-cure-ment
People
Source of Benefits*€m
* Synergy benefits described as peak recurring annual increase in pre-tax bottom-line result (peak level as of 2009)
In Q1 2005, we announced operational synergies in the areas of private
banking and fund management of net 1.4 € / share - total 500 m (75 m pre-tax recurring per year, 50% of which as of 2006)
CostsAvoided
Total
Securities

5
Operational synergies - update
SYNERGY PLAN ACHIEVED IN 2Q 2005
No. of projects
Recurring synergy
O/w in 2005
O/w in 2006
Recurringsynergies achieved
ImpactP&L 2005
IT and overheadsAsset ManagementInsuranceCorporatesFinancial marketsSecuritiesPayments
7534374
29 m16 m
9 m8 m7 m5 m1 m
3 m-
3 m-
2 m--
11 m12 m
4 m3 m5 m3 m
-
3 m-
1 m----
3 m-
1 m----
TOTAL 33 75 m 8 m 37 m 4 m 4 m
In Q2 2005, group-wide risk management methodology implemented in enlarged Group
At the same time, detailed implementation of synergy projects started: Agreed milestones and delivery profile for 33 projects Transparency on execution risks Incorporation into business & individual targets
At end of Q2 2005, 4 m in recurring synergies already realized (6% of total)
By end of 2005, 8 m is expected - in 2006, level will increase to 37 m

6
Gevaert portfolio - update
P’folioDec-04
Profit 2004
Strategy Completion by
Equity holdings in listed companies
a. Held for trading b. Held as investment c. Agfa Gevaert (atypical) (2) (3)
17 m 578 m 854 m
pm20 m42 m
Integration into 'KBC Securities‘Exit (sale on market) Exit (opportunistic)
Q2 2005Q2 2005 (1) At right moment
Private equity holdings
a. Private equity 79 m pm Integration into 'KBC Private Equity' (integrated portfolio 360 m)
Q3 2005
Real estate activities
a. Real estate 299m pm Selective integration into KBC Bank Q3 2005 (4)
Specialized leasing activities
a. Entertainment sector b. Railway freight cars c. Audiovisual material (vendor lease)
163 m35 m37 m
2 m1 m
0.4 m
Exit (if not successful: run-off)Exit (if not successful: run-off)Integration into KBC Lease
Q4 2005Q4 20051Q 2006
Gevaert is expected to upstream ca. 300 m cash dividend in Q3 2005(1) 30 m capital gains realized in Q2 2005, excl. gains on KBL and KBC (150 m) eliminated in consolidated group P&L(2) Position of 34.1 m shares booked in KBC’s accounts at 17 euros/share(3) 2004 profit contribution (42 m) excludes one-off loss of consumer imaging (-81 m) and amortization of goodwill (-27 m)(4) Legal and practical winding-up and exit from discontinued operations may be drawn out

7
We build a solid future
We still see a lot of ‘growth and value’ in our current strategic scope: Retail- and wealth-management-oriented, with focus on Belgium and
CEE-5 and selected Western-European activities Further enhancement of efficiency (with emphasis on, but not
exclusively, in CEE and European private banking) Standalone basis (opportunistic operational alliances in certain areas
to generate economies of scale, if needed) Stable dividend policy and solid level of financial strength/solvency
This outlook is reflected in ambitious financial targets, valid until 2008
In 2H 2005, we will re-assess our strategic horizons to ensure ‘growth and value’ post-2008 (project ‘next’)

8
Enhancing efficiency - banking
65% 65%
60%58%
62%
58%
71%
2001 2002 2003 2004 2005target
2004new
2005 2006 2007 2008target
• Branch closures in Belgium • IT integrations• FTE reductions
• Impact of co-sourcing with 3rd parties• Cost savings due to ‘private banking hub’
Well on track to deliver on current 2005 cost/income target (58%)
Adverse impact by Group enlargement and IFRS reclassificiations - new C/I target (58%) therefore more ambitious than previous target (58%)
Cost/income, banking
(KBC Old, GAAP) (KBC Mergco, IFRS)
• Further cost cutting in CEE• Bus’ss-process simplification• Centralized procurement

9
Enhancing efficiency - insurance
96% 95% 95% 95% 95%
105%104%
2001 2002 2003 2004 2005target
2004new
2005 2006 2007 2008target
• Optimization of inbound R/I• Increased underwriting discipline in CEE• Pricing discipline (hard market)
• Increased price competition• Further improvement in CEE
Well on track to deliver on current 2005 combined ratio target (95%)
Positive view on underlying drivers (market growth, claims frequency, claims inflation, etc.), but market is expected to soften - new C/R target (95%) therefore more ambitious than previous target (95%)
Combined ratio, non-life
KBC Old, GAAP KBC Mergco, IFRS

10
Enhancing bottom-line profit
3.68
5.66
4.96 5.07
7.42
3.423.39
2001 2002 2003 2004 2005target
2004new
2005 2006 2007 2008target
• Sound business growth• Strict cost management• Risks adequately managed
Expected to exceed current 2005 EPS growth target (10% CAGR)
Downward impact of IFRS reclassificiations and Group enlargement
Growth outlook: our reality check makes us believe a 10% CAGR is sustainable at least until 2008 - growth target reconfirmed
Earnings per share
(KBC Old, GAAP) (KBC Mergco, IFRS)
CAGR target+10%
CAGR target> 10%
*
* Adjusted 2004 level after adding back 210 m in one-off charges
4.49

11
Tier-1, banking
10% 10% 10%9%9%
2001 2002 2003 2004 2004new
Securing financial strength In the last few years, we stayed above our minimum safety levels and
accumulated excess capital for add-on investments in CEE
Minimum solvency levels are maintained (8% Tier-1, banking – incl. 15% hybrid, and 200% solvency margin, insurance)*
Solvency margin, insurance
316%389% 347%320%
504%
2001 2002 2003 2004 2004new
• Solid earnings momentum• Stable dividend payout range
• Recovery of capital markets
* under Basel I / Solvency I regulatory frameworks

12
Securing financial strength
Capital position as at 31 March 2005
Available capital 1 Surplus capital 2 Immediatefree surplus 3
Banking 10.7 bn 2.1 bn 1.5 bn
Insurance 2.8 bn 1.2 bn 0.4 bn
Gevaert 1.2 bn 1.0 bn 0.4 bn
Total 14.7 bn 4.3 bn 2.3 bn
Internal capital budget requirements
Deleveraging of the holding company 0.4 – 0.6 bn
Buy-out of 3rd parties in CEE 0.8 – 1.3 bn
External growth in CEE 1.0 – 2.0 bn
1 Regulatory capital under Basel I/Solvency I, (incl. hybrids and minority interests, after elimination of intangibles and goodwill)2 Difference between available capital and internal minimum level3 Surplus capital excl. adverse IFRS impact on Tier-1 (as of 2006), unrealized gains on tied-up assets and value of Agfa- Gevaert (timing of disposal uncertain)

13
Generating high return level
13%
18%
16%
14%
16%
13%13%
2001 2002 2003 2004 2005target
2004new
2005 2006 2007 2008target
• Strong earnings growth (19% CAGR)• Dividend payout of 40-45%• Signifcant capital accumulation
• Sound EPS growth (>10% CAGR)• Stable dividend policy• Further accumulation of capital
Well on track to exceed current 2005 ROE target (16%)
Carry-on of excess capital for add-on investments in CEE and higher capital base according to IFRS - new ROE target (16%1) is therefore more ambitious than previous target (16%)
Return on equity
(KBC Old, GAAP) (KBC Mergco, IFRS)1 Equity excl. changes in revaluation reserve on AFS assets.

14
Financial targets - overview
Efficiency: Cost/income, banking
Combined ratio, non-life
max. 58% (1)
max. 95% (1)
Financial strength:
Tier-1, banking
Solvency margin, insurance
min. 8% (3)
min. 200% (3)
Value creation: Adjusted ROE (2)
EPS growth (CAGR)
min. 16% (1)
Min. 10% (3)
(1) By 2008 at the latest(2) Equity excl. change revaluation reserve AFS assets(3) For 2006-2008 period

15
Assessing the Romanian opportunity
Since the largest bank (BCR) is up for privatization now, we cannot postpone our views on this until our new strategy charter is defined in 2H05 (project ‘next’)
Since optimization of CEE activities has progressed well and an immediate acquisition in Poland is rather unlikely, management capacity and capital gradually becomes available for new areas of investment
At first sight, the BCR opportunity may be attractive and is in line with our past CEE strategy: Material size (5.5 bn assets) and dominant market position (29% share) Profitable franchise Possibility to pursue double-digit growth, based on fast growing market Possibility to focus on retail/SME Availability of an insurance operation, allowing start-up of bancassurance Progressive development in legal and political environment since EU
accession schedule is expected
In order to understand the opportunity fully, assess the risks and quantify the value-creation potential, KBC is studying the case