Strategies for Cytochrome P450 Induction Testing in …€¦ · Strategies for Cytochrome P450...
33
Strategies for Cytochrome P450 Induction Testing in Human Hepatocytes and Alignment with FDA Guidance George Zhang, Ph.D. BD Biosciences – Discovery Labware www.bdbiosciences.com/admetox
Transcript of Strategies for Cytochrome P450 Induction Testing in …€¦ · Strategies for Cytochrome P450...

Strategies for Cytochrome P450 Induction Testing in Human Hepatocytes and Alignment with FDA Guidance
George Zhang, Ph.D.BD Biosciences – Discovery Labwarewww.bdbiosciences.com/admetox

• Guidance documents and position papers• Experimental design for P450 induction studies
– Choice of model– Choice of enzymes– Incubation period– Positive control inducers– End points
• Other technical considerations• Industry survey and comparison with 2004 "consensus"
guidance• Key BD Gentest™ Products and Services
for P450 induction
Presentation Overview
Presentation Overview

• Therapeutic failure and safety issues – Higher rate of drug inactivation, so less
of the (oral) parent drug reaches target• Autoinduction (self)
• Drug-interaction (co-medication)
– More potentially toxic metabolite
• May be clinically manageable– Reduction in drug concentration can
be circumvented by increasing drug dosage
• FDA expects data for enzyme induction potential
Wilkinson KR N Engl J Med 352;2211 www.nejm.org
Why Is Enzyme Induction a Concern for Drug Candidate Developability?

• Co-medication of rifampicin with warfarin reduces plasma concentration of warfarin, leading to a reduction in the thrombin time
• Co-medication of rifampicin with oral contraceptives resulted in unplanned pregnancies
• Co-medication of rifampicin with rosiglitazone caused 60% decrease in AUC, Cmax, and T½ of rosiglitazone
• Therapeutic failure due to co-medication of cyclosporine or HIV-protease inhibitors with St. John’s wort
Examples—Clinical Drug InteractionsDue to Induction

• FDA (April, 1997)– Drug Metabolism/Drug Interaction Studies in the Drug Development Process:
Studies In Vitro• Tucker, et al (2001) – Basel conference
– sponsored by the FDA, EUFEPS, and AAPS • Bjornsson, et al (2003) – PhRMA “consensus”• FDA (Oct, 2004) Prelim “consensus paper”• FDA (Sept, 2006) DRAFT Guidance for Industry
– Drug Interaction Studies – Study Design, Data Analysis and Implications for Dosing and Labeling
– http://www.fda.gov/cder/guidance/index.htm• Huang, et al. Clin. Pharmacol. Ther. 81:298–304 (2007)• Strong and Huang, in “Drug-drug interaction in pharmaceutical development” Li
ed., Wiley. pp 201-226 (2008)• Huang, et al. J. Clin. Pharmacol. 48:662-670 (2008)
“update on drug interaction evaluation”
Guidance and Position Papers

• Over 400 draft or final guidance documentshttp://www.fda.gov/cder/guidance/index.htm
• Represents the Agency's current thinking
• Does not bind the FDA or the public, but provides pharmaceutical companies with assurance– An alternative approach may be used if it satisfies
requirements of the applicable statute, regulations, or both
– If in doubt, contact the originating office (e.g. CDER)
FDA Guidance Documents
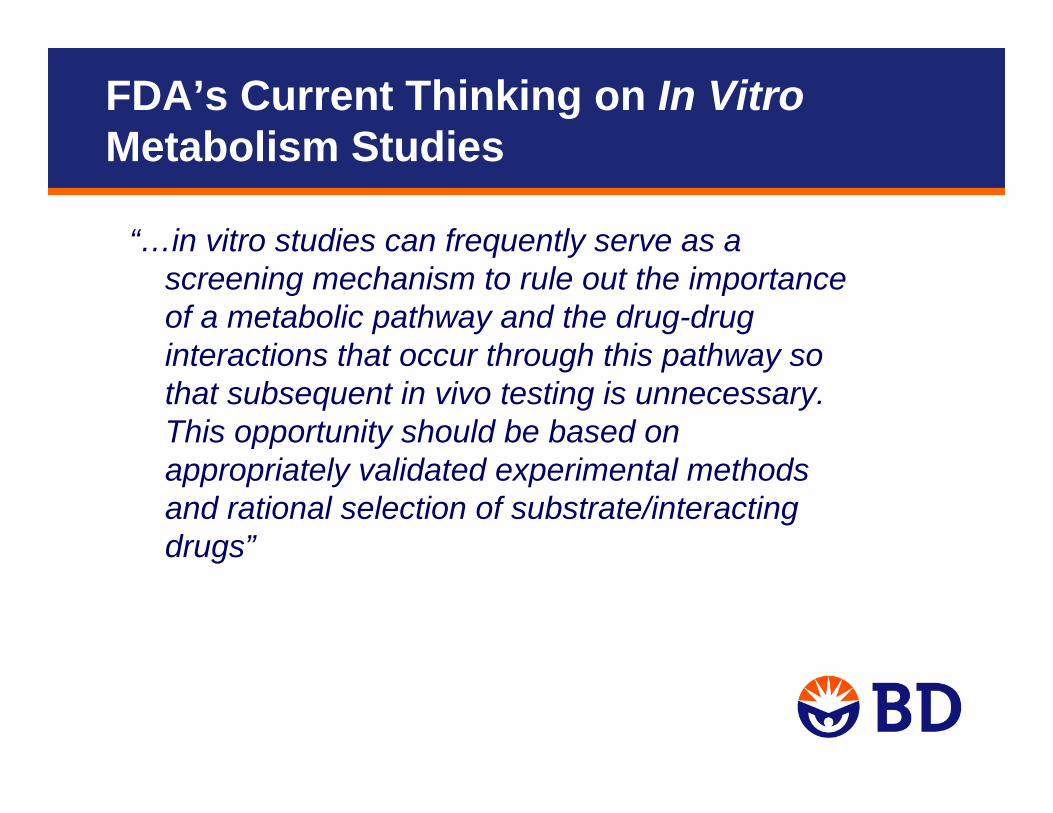
“…in vitro studies can frequently serve as a screening mechanism to rule out the importance of a metabolic pathway and the drug-drug interactions that occur through this pathway so that subsequent in vivo testing is unnecessary. This opportunity should be based on appropriately validated experimental methods and rational selection of substrate/interacting drugs”
FDA’s Current Thinking on In VitroMetabolism Studies

• Primary cultures of animal hepatocytesUse of animal hepatocytes for induction studies is not recommended
• Immortalized hepatic cell lines such as HepG2, HepaRG, and Fa2N-4“Immortalized liver cells are acceptable if it can be demonstrated with positive controls that CYP3A4 and CYP1A2 are inducible in these cell lines.”
• Primary cultures of human hepatocytes (fresh/cryopreserved)—gold standard“Experiments should be conducted with hepatocytes prepared from at least three individual donor livers.”
Experimental Design—Choice of Model

Inter-Individual Variation- Example of CYP3A4 Induction by RIF in 64 Donors
0
200
400
600
800
1000
1200
1400
1600
1800
2000
Test
oste
rone
6ß-
OH
act
ivity
(p
mol
/min
/mg)
DMSO
RIF
0
20
40
60
80
100
120
140
fold
indu
ctio
n
DMSO RIF Fold inductionCount 64 64 64Max 567 2171 122Min 6.5 239 1.4Median 38 930 20Mean 83 957 28

Experimental Design- Choice of Enzymes
“The initial in vitro induction evaluation may include only CYP1A2 and CYP3A4.”
Although CYP2B6, 2C8, 2C9 and 2C19 are inducible, they co-induce with CYP3A4, which can serve as a surrogate. However, many investigators like to include these enzyme to avoid the need to retest, to examine inducers acting via CAR or circumvent 3A4-selective inhibitors.
Update: “Because CYP2B6 may not be co-induced with CYP3A4, the potential for induction of CYP2B6 should be evaluated regardless of the CYP3A results”—Huang, S-M. J. Clin. Pharmacol. 48:662 (2008)

Example—Co-Induction of CYP2B6 and CYP3A4
• 31 New Chemical Entities (NCEs) were analyzed for CYP3A4 and CY2B6 induction (mRNA)
• Close concordance of CYP2B6 induction with CYP3A4 induction found• However, there were some notable exceptions• Some compounds found to be 2B6 inducers in the absence of significant 3A4
induction; these may be acting as preferential CAR activators• Such observations suggest a need to modify the draft guidance document
0
20
40
60
80
100
120
140
160
1 2 3 4 5 6 7 8 9 10 11 12 13 14 15 16 17 18 19 20 21 22 23 24 25 26 27 28 29 30 31
% o
f Pos
itive
Con
trol
s
2B6
3A4

Presentation Overview
Experimental Design-Positive Control Inducers
Table 5. Sept, 2006 guidance
Presentation Overview
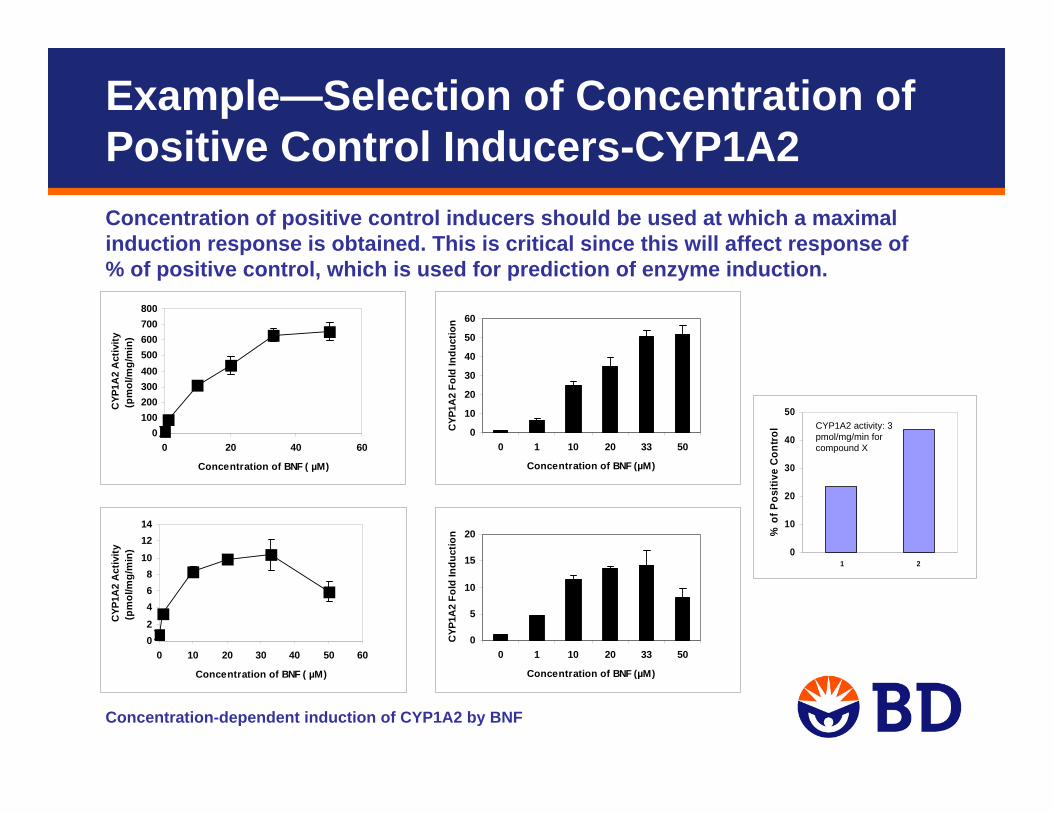
Example—Selection of Concentration of Positive Control Inducers-CYP1A2Concentration of positive control inducers should be used at which a maximal induction response is obtained. This is critical since this will affect response of% of positive control, which is used for prediction of enzyme induction.
0100200300400500600700800
0 20 40 60
Concentration of BNF ( µM)
CYP
1A2
Act
ivity
(p
mol
/mg/
min
)
0
10
20
30
40
50
60
0 1 10 20 33 50
Concentration of BNF (µM)C
YP1A
2 Fo
ld In
duct
ion
02468
101214
0 10 20 30 40 50 60
Concentration of BNF ( µM)
CYP
1A2
Act
ivity
(p
mol
/mg/
min
)
0
5
10
15
20
0 1 10 20 33 50
Concentration of BNF (µM)
CYP
1A2
Fold
Indu
ctio
n
Concentration-dependent induction of CYP1A2 by BNF
0
10
20
30
40
50
1 2
% o
f Pos
itive
Con
trol CYP1A2 activity: 3
pmol/mg/min for compound X

Example—Selection of Concentration of Positive Control Inducers-CYP3A4
Concentration-dependent induction of CYP3A4 by RIF
010203040506070
0 0.5 1 10 20 50
Concentration of RIF (µM)
CYP
3A4
Fold
Indu
ctio
n
0
200
400
600
800
1000
0 10 20 30 40 50 60
Concentration of RIF ( µM)
CYP
3A4
Act
ivity
(p
mol
/mg/
min
)
0
50
100
150
200
250
300
0 20 40 60
Concentration of RIF ( µM)
CYP
3A4
Act
ivity
(pm
ol/m
g/m
in)
0
5
10
15
20
25
0 0.5 1 10 20 50
Concentration of RIF (µM)
CYP
3A4
Fold
Indu
ctio
n

Presentation Overview
Experimental Design—Concentrationsof Test Articles
• Based on the expected human plasma drug concentrations
• At least 3 concentrations spanning the therapeutic range including 1 concentration that is an order of magnitude > the average expected plasma drug concentration
• If information is not available, concentrations ranging over at least 2 orders of magnitude

Presentation Overview
Experimental Design—Exposure Timefor CYP1A2 Induction
Exposure time should be used at which a robust induction should be achieved. A 2-3 day treatment is recommended in the draft guidance.
0
10
20
30
40
50
0 20 40 60 80
Incubation Time (hours)
CYP
1A2
Act
ivity
(pm
ol/m
g/m
in)
ControlBNF
0
5
10
15
20
25
30
6H 24H 48H 72H
Incubation Time (hours)
CYP
1A2
Act
ivity
Fol
d In
duct
ion
0
5
10
15
20
25
30
35
0 20 40 60 80
Incubation Time (hours)
CYP
1A2
Act
ivity
(pm
ol/m
g/m
in)
ControlBNF
02468
1012141618
6H 24H 48H 72H
Incubation Time (hours)
CYP
1A2
Act
ivity
Fol
d In
duct
ion
0
5
10
15
20
25
0 20 40 60 80
Incubation Time (hours)
CYP
1A2
Act
ivity
(p
mol
/mg/
min
)
Cont rol
BNF
02468
1012141618
6H 24H 48H 72H
Incubation Time (hours)
CYP
1A2
Act
ivity
Fol
d In
duct
ion
Time-dependent induction of CYP1A2 by BNF

Presentation Overview
Time-dependent induction of CYP3A4 by RIF
0
500
1000
1500
2000
0 20 40 60 80
Incubation Time (hours)C
YP3A
4 A
ctiv
ity (p
mol
/mg/
min
)
Cont rol
RIF
0
5
10
15
20
25
30
6H 24H 48H 72H
Incubation Time (hours)
CYP
3A4
Act
ivity
Fol
d In
duct
ion
0
50
100
150
200
250
300
0 20 40 60 80
Incubation Time (hours)
CYP
3A4
Act
ivity
(p
mol
/mg/
min
)
Cont rol
RIF
0
5
10
15
20
25
6H 24H 48H 72H
Incubation Time (hours)
CYP
3A4
Act
ivity
Fol
d In
duct
ion
050
100150200250300350
0 20 40 60 80
Incubation Time (hours)
CYP
3A4
Act
ivity
(pm
ol/m
g/m
in)
Cont rol
RIF
0
10
20
30
40
50
6H 24H 48H 72H
Incubation Time (hours)
CYP
3A4
Act
ivity
Fol
d In
duct
ion
Experimental Design—Exposure Timefor CYP3A4 Induction

Experimental Design—Choice of Endpoints
• “..the most reliable method to study a drug’s induction potential is to quantify the enzyme activity of (human) primary hepatocyte cultures…”
• “..other methods are being evaluated”– Immunoblotting (relative quantitation)– Measurement of mRNA levels using reverse transcriptase-
polymerase chain reaction (RT-PCR). “Measurement of mRNA levels is helpful when both enzyme inhibition and induction are operative”
– Cell-based receptor gene assay or binding assay for receptors mediating induction of P450 enzymes.
• RT-PCR assay is more robust thanimmunobloting analysis

Presentation Overview
Example—mRNA vs. Protein Induction

Experimental Design—Choice of Probe Substrates and Enzyme Assay Conditions
Same as for CYP enzyme assaysCYP1A2 (AhR Mediated)
Phenacetin, ethoxyresorufinCYP3A4 (PXR Mediated)
Testosterone, midazolamCYP2B6 (CAR Mediated)
Bupropion, S-MephenytoinFor microsomal enzyme assay conditions, follow the general design
consideration for enzyme assay.For in situ enzyme assay conditions, it is necessary to determine the
following conditions with multiple donors: Time-courseSubstrate dependency

Presentation Overview
How to Define an Inducer?
“A drug that produces a change that is equal to or greater than 40% of the positive control can be considered as an enzyme inducer in vitro and
in vivo evaluation is warranted.”
% positive control =
(activity of test drug treated cells - activity of negative control) x 100(activity of positive control - activity of negative control)
“An alternative endpoint is the use of an EC50 (effective concentration at which 50% maximal induction occurs)”

Other Technical Considerations
• CYP inhibition/inactivation by the inducing agent or its metabolites (“masking”) – Metabolic competency of cells
• Hepatocyte concentrations of parent and metabolites– How close to nominal dose?– Consider free fraction
• Activity of metabolite > parent• PXR/CAR mediated induction of transporters/other enzymes• Pharmacogenetic variation (use multiple donors)• “Down-regulation”• Cytotoxicity• Test article solubility in medium

Test for Masking of Enzyme Activityby NCE
• Enzyme activity assays are gold-standard for induction testing. However, enzyme activity may be inhibited by the NCE (“masking”) – the inhibition can be due to either direct or time-dependent inhibition
• A direct inhibition test can be performed with a separate set of positive control inducer treated wells (in situassay)– Ensures high starting activity
• The potential confounding effect of enzyme inhibitionon enzyme induction response can be uncovered with mRNA or Western blot analysis

Example—Test for Masking of Enzyme Activity by NCE
0
200
400
600
800
DMSO
Rifampici
n
TAO
Ritonav
irRifa
mpicin + TAO
Rifampici
n+ Rito
navir
CYP
3A4
Act
ivity
(pm
ol/m
g/m
in)
Inhibition assay: test item (in this case TAO or ritonavir) added at end of 3 day treatment for 30 minutes, followed by wash and addition of probe substrate

Example—Ritonavir Induction Masked by Enzyme Inhibition Even in Hepatocyte Microsomes
0
200
400
600
800
1000
1200
1400
1600
DMSO 2 µM Ritonavir
Treatment
Test
oste
rone
6ß-
OH
act
ivity
(pm
ol/m
in p
er m
g)
Lot 73 - Microsomes
Lot 74 - Microsomes
• Ritonavir not washed out by microsome preparation
• Enzyme activity inhibited well below basal activity
• Immunoblot demonstrates induction
Lot 73
Lot 74
1 2 3 4 5ritonavir

Example—TAO Induction Masked by Enzyme Inhibition Compared with mRNA Data
Troleandomycin (TAO)-Donor 1
0
5
10
15
20
25
30
35
0.2 2 20
Concentration of TAO (uM)
Fold
Indu
ctio
n
ActivitymRNA
Troleandomycin (TAO)-Donor 2
0
2
4
6
8
10
12
14
16
18
20
0.2 2 20
Concentration of TAO (uM)
Fold
Indu
ctio
n
ActivitymRNA
Hepatocytes from two donor livers were treated with TAO (0.2, 2, and 20 µM) for 3 days. After treatment, CYP3A4 activity and mRNA expression were determined.

Apparent Down-Regulation in Enzyme Activity and mRNA
0
1
2
3
DMSO NME 1x µM NME 5x µM NME25x µM
• CYP3A4 enzyme activity demonstrates apparent down-regulation
• mRNA supports this conclusion
• No inhibition of enzyme activity found in liver microsomes or in hepatocytes in situ
0
10
20
30
40
50
60
70
80
DMSO NME 1x µM NME 5x µM NME 25x µM
CYP
3A4
activ
ity
(pm
ol/m
g/m
in)
0
1
2
3
DMSO NME 1x µM NME 5x µM NME25x µM

Hewitt, N. Chemical-Biological Interactions 168:51-65 (2007).A survey of 30 participants from 27 pharmaceutical companies
Presentation Overview
Industry Survey and Comparison with 2004 “Consensus" Guidance

Presentation Overview
Summary—Enzyme Induction Protocols
Hepatocytes are plated in multiwell plates or dishes (2-3 days)
3-day treatments with test article and positive control inducers
mRNA Enzyme activity “in situ”
RT-PCRAdjunct RT-PCR or
western blot with cells
Harvest cells and prepare microsomes
Microsomal enzyme activityWestern blot w/ microsomal protein

Recommended Strategies for Robust Analysis
• Follow recommendations in the draft FDA guidance • Until document is final, consider the docket comments• Consider “consensus” documents published by
representatives from industry and/or government• GLP is not required
– Laboratories conducting these assays should be GLP compliant– Validated methods, data tracking processes, SOPs, etc.
• Use well-accepted reagents from reputable suppliers• Use human hepatocyte for induction for late discovery
and/or development drug candidates.

Comments on Draft Guidance Document
Draft guidance has prompted extensive commentshttp://www.fda.gov/ohrms/dockets/dockets/06d0344/06d0344.htm
– Concerns about statement on “the initial in vitro induction evaluation may include only CYP1A2 and CYP3A”
– Oversight of the significance of CYP2E1 and inducers of this enzyme should be included
– Concerns to use immortalized liver cells for induction because of lack of CAR and transporter function in these cells and they are not fully characterized
– Concerns to use EC50 only to predict enzyme induction
– Interpretation of the % of the positive control (>40%) is only possible if the window for the control is reasonably high (>5-fold)

Key BD Gentest™ Products and Servicesfor Induction Studies
• BD Gentest Fresh and Inducible Human Hepatocytes• BD BioCoat™ Culture Plates and Flasks• BD™ Hepatocyte Culture Medium• BD Gentest CryoHepatocyte Purification Kit• BD Gentest Heavy-Labeled Metabolite Standards
• Comprehensive induction services for tier-1 (mRNA induction), tier-2 (in situ assay) and tier-3 (microsomalassay), solubility and toxicity assays are also available