Strategic Assessment 2020/21 - Torbay
47
Strategic Assessment 2020/21
Transcript of Strategic Assessment 2020/21 - Torbay

Strategic Assessment 2020/21

2 Torbay Strategic Assessment 2020
CONTENTS Introduction p3 Community safety priorities p4 Morile p4 Police and Crime Commissioner’s priorities p7 Torbay Context p8 Coronavirus p12 National Context p13 Recorded Crime p15 Outcomes p33 Reducing Reoffending p34 Appendix A – Morile p37 Appendix B – Morile Partner Engagement Sessions p46
If you require this document in a different language or format please telephone 01803 207262 or email [email protected]
Safer Communities Torbay Town Hall Castle Circus Torquay TQ1 3DR e: [email protected] w: www.safercommunitiestorbay.org.uk

3 Torbay Strategic Assessment 2020
Introduction Safer Communities Torbay is the name given to Torbay’s Community Safety Partnership. Community Safety Partnerships (CSPs) exist by law and their job is to bring agencies and people together to reduce crime and disorder, and make areas safer. Every year CSPs produce a document called a Strategic Assessment. The Assessment is written for the Partnership Board (Stronger Communities Board) and the aim is to identify priorities for the Partnership in its next plan. A lot of the document is based on statistical information which helps agencies to understand crime and disorder within Torbay. It also includes an overview of community safety issues, contextual information about Torbay, the delivery landscape and our priority areas. Throughout the report you will see reference to the following:
The good stuff
• These are examples of projects or best practice that are being undertaken
within Torbay.
• There is a brief description of the work being undertaken and the difference
it is making or the outcome that is achieved.
.
Next Steps
These are plans that the Safer Communities Board intend to implement
within the next year to address issues highlighted in the assessment.
4 Torbay Strategic Assessment 2020
Community Safety priorities
The Community Safety Strategic Priority for Torbay is “Protecting the most vulnerable individuals and communities from crime and disorder, whilst reducing reoffending” Some people and areas are, due to their circumstances, more vulnerable to serious harm from crime and disorder than others. As a partnership, our understanding of vulnerability and complex needs continues to increase with specific groups such as the homeless, adults with additional needs and mental health difficulties, those with substance misuse issues and young people being particularly vulnerable to exploitation in a variety of forms. With less money and resources the partnership will focus on its statutory duties and on protecting those of greatest vulnerability. The partnership continues to focus on both the recorded crimes and on those more “hidden” crimes such as criminal, financial, forced labour and sexual exploitation, which often go unreported but have a huge impact on vulnerable victims. A key factor in understanding vulnerability is the role that childhood adversity can play in the long term social, emotional and behavioural experiences of individuals. Individuals who have experienced multiple adversity such as childhood sexual and physical abuse, poverty, neglect, domestic violence and parental substance misuse alongside a lack of supportive adult relationships, are more likely to experience poor physical and mental health, to engage in risky behaviours and be vulnerable to exploitation and abuse from others. The partnership has therefore agreed to adopt a trauma informed approach across all of its’ work, building on existing research and good practice from both national and international studies. This one overarching priority at the start of the year includes a number of thematic areas which will underpin the focus of the partnership this year:
Domestic Abuse and Sexual Violence
Exploitation
Drugs
Assessing threat, risk and harm - Morile Prioritisation involves understanding what poses the greatest threat or risk to the safety of the community and a common framework for undertaking that assessment is vital to ensure that this process is fair, equitable and effective. Devon and Cornwall Police and the Peninsula CSPs are transitioning to a new nationally accredited tool to assess threat, risk and harm which was developed through the national Management of Risk in Law Enforcement (MoRiLE) programme. The MoRiLE programme was created in 2014 through the National Police Chiefs Council (NPCC)’s Intelligence Innovation Group. It was established with the aim of providing a common methodology and language for the assessment of threat, risk and harm in relation to law enforcement.

5 Torbay Strategic Assessment 2020
Morile is a matrix which generates a score for each community safety issue based on the individual scores assigned for the following areas:
Impact on the victim, community, and environment
Likelihood – frequency, volume, trend and forecast
Organisational position -reputation and politics, cost to respond, capacity and capability
Areas were then grouped into High, Moderate and Standard threats based upon their overall scores. These are referenced through the document and a full summary provided within appendix A.
The scoring process has been undertaken as a two stage process: Stage One – A list of 19 crime and disorder areas are selected and put through the scoring exercise. The results of this exercise have been reported on within our Strategic Assessments since 2018/19 and an update to the scores for this year are provided in Appendix A.

6 Torbay Strategic Assessment 2020
Stage Two – Key partners from both statutory and non-statutory agencies were consulted with in relation to the findings of the MoRilE scoring.Stakeholders were asked to provide comment on the findings and provide professional insight as to how effectively agencies are tackling crime and disorder issues and to highlight any pressures, new risks or emerging gaps. Feedback from partners was used alongside the findings of the MoRiLE assessment to provide a more holistic and enriched understanding of the challenges faced in Torbay. A summary of the partner engagement sessions can be found in Appendix B.
Next Steps
ACE’s and embedding a Trauma informed approach
The Board will continue to support the development of trauma informed approaches through the EMBRACE network, developing resources and
supporting continuous professional development
The Board will seek to influence and engage partner organisation’s in developing a trauma informed approach within their own service areas
The Board will ensure that any commissioning work they are directly involved in supports a trauma informed approach in line with agreed
principles and definitions
Exploitation
The Board will continue to engage in and support strategic and
operational partnerships across Devon to respond to emerging threats
and harm
The Board will seek to engage with older people living within our communities to highlight the risks of financial exploitation and fraud
The Board will work jointly with Devon to implement the Preventing
Exploitation Toolkit across Torbay
The Board will develop and implement practice guidance, training and resources to increase the understanding across the partnership of exploitation, vulnerability to exploitation and methods of disruption
and safeguarding
The Board will continue to support the sharing of intelligence across the partnership to improve our understanding and response to serious and organised crime

7 Torbay Strategic Assessment 2020
The Police and Crime Commissioner’s five priorities The Police and Crime Commissioner for Devon and Cornwall and the Isles of Scilly is Alison Hernandez. This strategic plan is shared with the PCC and also used to inform the Peninsular Strategic Assessment. Both these documents are used by the PCC to inform their own Police & Crime Plan. The Police & Crime Plan sets out the strategic priorities for Policing in Devon and Cornwall, the PCC’s strategic intent quoted in the plan is as follows: The police are here to help keep us safe. In particular, they are here to come to our assistance when someone or something threatens our safety. To do this well they need to be efficient, effective and, most importantly, well connected to their communities. They must also work closely and supportively with partners, including community safety partnerships (CSPs), health and wellbeing boards, and safeguarding boards who play vital roles within communities. The Police and Crime Commissioner wants to focus especially on those that are most vulnerable. People can be more vulnerable because of their ethnicity, age, a disability, where they live, who they live with or for a range of other personal reasons or external factors. Vulnerability must be thought about broadly – recognising that people become vulnerable for a range of reasons and that people will not always recognise themselves as being vulnerable. Police & Crime Plan Priorities There are the following 5 priorities laid out in the plan:
8 Torbay Strategic Assessment 2020
Effective partnership working
Torbay has effective partnership working models and processes in place. There are a number of long standing effective partnership working examples including: MARAC, MAPPA, IOM, YOT. The Community Safety Directorate of Torbay Council where CSP staff are based also houses police staff, Prison resettlement officer, ASB staff, licensing staff, housing standards, and Vulnerability and Complex Needs Officers. This aids effective communication and coordination of activity to tackle ASB and other community safety issues.
Torbay Context Whilst crime data is very important this section considers other contextual information applicable for Torbay. Torbay offers an unrivalled quality of life for individuals and families. Its natural environment, clean air, climate, location, excellent schools, growing arts and cultural sector and wide range of outdoor activities, mean that Torbay provides everyone the opportunity to live a healthy and fulfilled life. Torbay covers an area of over 24 square miles, located in South Devon, known as the English Riviera. It is made up of the three towns of Torquay, Paignton and Brixham and comprises over 20 beaches and secluded coves along 22 miles of coastline located around the east facing natural harbour of Torbay. With a population of over 135,000, Torbay is the second largest urban area within the Heart of the South West. Not only is it a popular tourist destination, Torbay is also a retirement destination for many fit, active, skilled and affluent older people which is reflected in the population structure. The delivery landscape There are many factors that have affected the work of Safer Communities Torbay in recent years and they are likely to continue to do so in the next year:
Increasing complexity of cases
A reduction of face to face services available to vulnerable people due to a reduction in prevention services.
Development of Government policy in a variety of key areas such as health, sentencing, probation, alcohol, welfare reform, troubled families and ASB.
Widespread restructuring and change across the public sector often resulting in less staff and cuts to services.
Devolution of accountability to local councils, empowerment of communities to influence and change service delivery with a strong drive for local solutions to local problems.

9 Torbay Strategic Assessment 2020
The Joint Strategic Needs Assessment
The Joint Strategic Needs Assessment (JSNA) provides an analysis of the current and future health and social care needs of the communities within Torbay. This provides context for Torbay in terms of demographic key issues facing the population of Torbay. To avoid duplication data is not included in detail within this report. Key issues highlighted for Torbay are:
Torbay is ranked as the most deprived Local Authority in the South West region
27% of Torbay residents live in an area classified as amongst the 20% most deprived areas of England
Torbay’s economy is amongst the weakest in England and has declined in recent years. With the disruption to the economy caused by COVID-19 the economy is expected to weaken further. Torbay’s economy is highly dependent on tourism and unemployment is beginning to rise.
There are high levels of Vulnerability within the population, with high levels of specialist need cohorts and high levels of mental ill health.
Highest domestic violence rate in the South West
Higher levels of alcohol related admissions to hospital.
The number of children looked after by the local authority remains amongst the highest in England and around 1 in 4 children continue to live in households where income is less than 60% of the median income (living in poverty).
Torbay’s aged population has further challenges in higher levels of dependency. 26 out of every 100 residents are aged 65 and over.
Public Health Outcomes Framework The Public Health Outcomes Framework includes a number of community safety indicators in its ‘Wider determinants of health’. Latest data reported that Torbay was higher than the English average for a number of indicators including the following:
Hospital admissions caused by unintentional and deliberate injuries
Suicide Rate
Alcohol related hospital admissions
Emergency Hospital Admissions for intentional self-harm
Adults in contact with secondary mental health services
Problematic use of alcohol This continues to present a high risk of harm to communities across Torbay and the Peninsula, and is a major cost driver across all public sector agencies. The impact of alcohol affects all aspects of partnership delivery and represents a significant challenge in tackling violent crime and anti-social behaviour. Problematic alcohol use is also frequently highlighted as a barrier that prevents services from helping individuals and their families with other issues, such as finding employment and addressing domestic and family abuse.

10 Torbay Strategic Assessment 2020
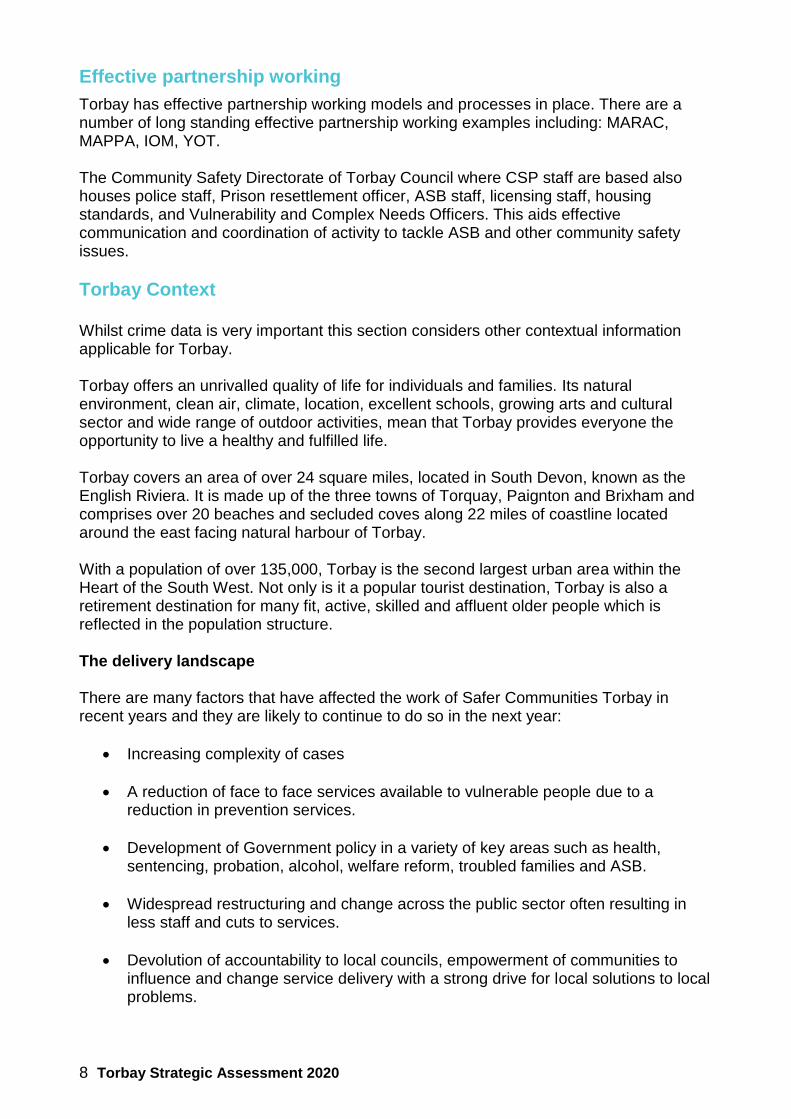
Data indicates that alcohol use is a problem for Torbay. Latest data showed that a number of indicators were significantly worse that the national average, these included: alcohol specific mortality and hospital admissions, including those for under 18s, alcohol related crimes and violence. The following represents some of the impacts of alcohol within Torbay:
12.911.4
17
9.9 10.8
0
2
4
6
8
10
12
14
16
18
Exeter Plymouth Torbay South West England
Alcohol Specific Mortality (per 100,000)
473348
669
392 412
0
100
200
300
400
500
600
700
800
Exeter Plymouth Torbay South West England
Admission Episodes for mental & behavioural disorder due to use of alcohol
(per 100,000)
11 Torbay Strategic Assessment 2020
The night time economy (NTE) has been a key issue for Torbay historically and there have been many initiatives over the years. While the NTE brings benefits to the local economy in terms of tourism and employment, it also brings issues in terms of public disorder and violence. These generate costs in termso of social, economic, helath and criminal justice. Wider than the night time economy, hazardous drinking (drinking above recommended safe and sensible levels but not yet experiencing harm) and harmful drinking (drinking above recommended safe and sensible levels and experiencing harm) within the home can be linked to reduced physical and mental well-being and increased uptake of bed space within the acute care setting.
Alcohol is a problem that extends across a number of community safety areas including other priority issues of domestic abuse, reoffending and ASB. Indices of Multiple Deprivation The published Indices of Multiple Deprivation (IMD) in 2019 reported that Torbay was the 48th most deprived local authority area out of 317 and in the 15% of most deprived authorities in England. When compared to our Most Similar Family Group Torbay has the second highest levels of multiple deprivation. The most deprived areas within Torbay provide the highest number of looked after children. Rates of Children in Care within Torbay have increased by approximately 65% when comparing 2011 to 2019. 13% of Torbay households are experiencing fuel poverty.
37.547.7
78.7
44.131.6
0
10
20
30
40
50
60
70
80
90
Exeter Plymouth Torbay South West England
Admission Episodes for Alcohol-specific conditions Under 18's
(per 100,000)

12 Torbay Strategic Assessment 2020
Coronavirus Torbay data should be examined in context with the overall crime levels in England and Wales. Sources of data are taken from Police recorded data, and data from the Crime Survey for England and Wales (CSEW) which is a face-to-face victimisation survey in which people resident in households in England and Wales are asked about their experiences of a selected range of offences in the 12 months prior to the interview. The impacts of Coronavirus against crime statistics within both the Crime Survey and recorded Police data in the year ending March 2020 should also be considered. CSEW – Data collection was paused for the final two weeks of March 20 due to lockdown restrictions, overall however the impact of this was minimal with target response rates reducing from 70% to 64% Police Recorded Data – This Data was for the period April 2019 to the end of March 2020. In response to the coronavirus pandemic, restrictions in England and Wales started from 12 March 2020 and lockdown was applied on 23 March 2020, which imposed strict limits on daily life. The start of the restrictions and the first eight days of lockdown are therefore captured in police recorded data for the year ending March 2020. During the first quarter (January to March) of 2020, the level of police recorded crime was 1% lower than the same period in 2019. During March 2020 the police recorded 379,246 crimes (excluding fraud), this was an 11% reduction in police recorded crime compared with March 2019. By contrast, January and February 2020 both saw a rise in police recorded crime compared with 2019, with increases of 4% and 6% respectively. Reductions during March 2020 are likely to have been influenced by the restrictions imposed as part of lockdown, including the closure of all but essential retail, although some differences may be the result of normal monthly variation within the crime types. Within each crime section of this report, a breakdown has been provided of the impacts Coronavirus have had locally, comparing Crime Statistics for the period between April – July 2020 against the same period last year.
13 Torbay Strategic Assessment 2020
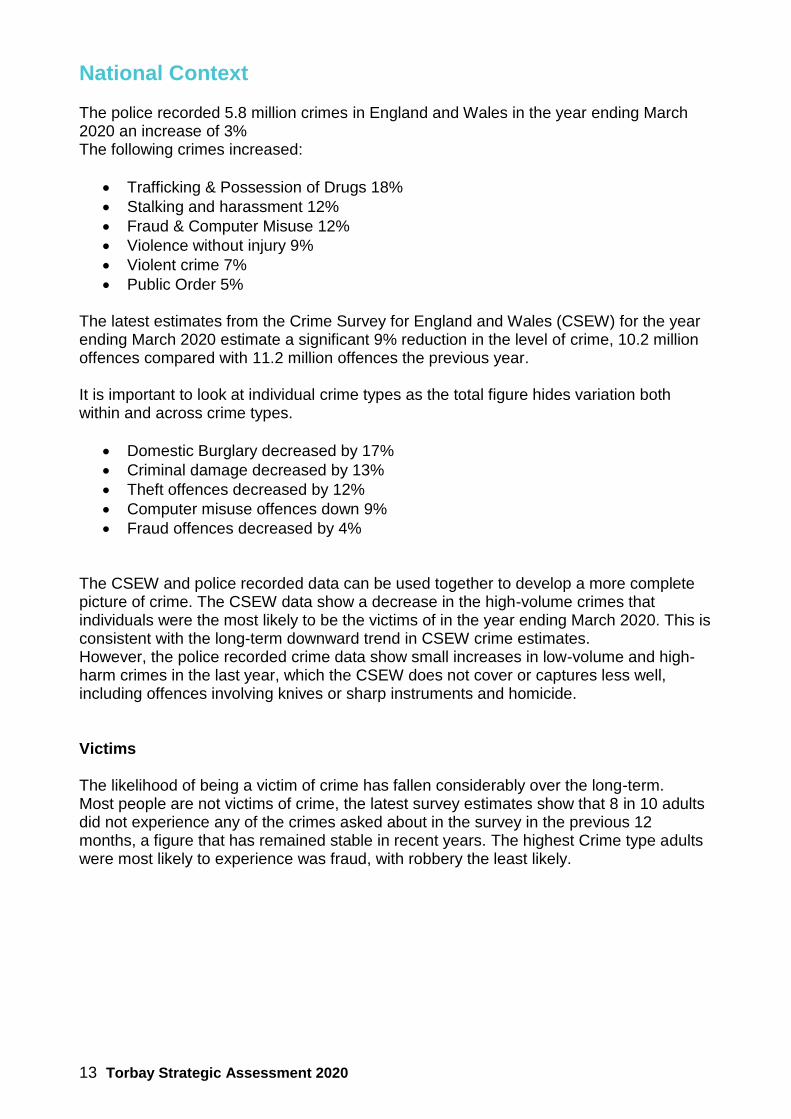
National Context The police recorded 5.8 million crimes in England and Wales in the year ending March 2020 an increase of 3% The following crimes increased:
Trafficking & Possession of Drugs 18%
Stalking and harassment 12%
Fraud & Computer Misuse 12%
Violence without injury 9%
Violent crime 7%
Public Order 5%
The latest estimates from the Crime Survey for England and Wales (CSEW) for the year ending March 2020 estimate a significant 9% reduction in the level of crime, 10.2 million offences compared with 11.2 million offences the previous year. It is important to look at individual crime types as the total figure hides variation both within and across crime types.
Domestic Burglary decreased by 17%
Criminal damage decreased by 13%
Theft offences decreased by 12%
Computer misuse offences down 9%
Fraud offences decreased by 4% The CSEW and police recorded data can be used together to develop a more complete picture of crime. The CSEW data show a decrease in the high-volume crimes that individuals were the most likely to be the victims of in the year ending March 2020. This is consistent with the long-term downward trend in CSEW crime estimates. However, the police recorded crime data show small increases in low-volume and high-harm crimes in the last year, which the CSEW does not cover or captures less well, including offences involving knives or sharp instruments and homicide. Victims The likelihood of being a victim of crime has fallen considerably over the long-term. Most people are not victims of crime, the latest survey estimates show that 8 in 10 adults did not experience any of the crimes asked about in the survey in the previous 12 months, a figure that has remained stable in recent years. The highest Crime type adults were most likely to experience was fraud, with robbery the least likely.

14 Torbay Strategic Assessment 2020
Experiences of crime by the victim’s gender identity have been reported on for the first time within this years survey. The data show those people whose gender identity is different from their sex registered at birth, were significantly more likely to have been a victim of crime (excluding fraud). In the year ending March 2020, more than 1 in 4 people who were trans (28%) had experienced crime compared with 14% of those whose gender identity is the same as the sex they were registered at birth. People of a White ethnic background were the least likely to have experienced crime (excluding fraud) in the year ending March 2020, at 13%, whilst people of Mixed or Multiple ethnic backgrounds were the most likely, with 20% having experienced crime in the same period. People of an Asian ethnic background were also significantly more likely to have experienced crime than those of a White ethnic background, with 15% having experienced crime in the last year. There were no other significant differences in the likelihood of being a victim of crime between ethnic groups. A total of 600,000 crimes were estimated to have been experienced by children aged 10 to 15 years: The issues that present the greatest threat and risk to our communities can be described collectively under two key thematic headings: Domestic Abuse and Sexual Violence These present the highest risk of harm and, at its extreme, it carries risks of domestic homicide and suicide. It has a devastating impact on the lives of victims, can increase vulnerability to victimisation or offending for future generations and results in massive costs to society. Child sexual abuse and sexual exploitation is included under this thematic heading. The latest figures from the Crime Survey for England and Wales show little change in the prevalence of domestic abuse in recent years. In the year ending March 2020, 6.1% of adults aged 16 to 59 years experienced domestic abuse, an estimated 1.2 million adults.
15 Torbay Strategic Assessment 2020
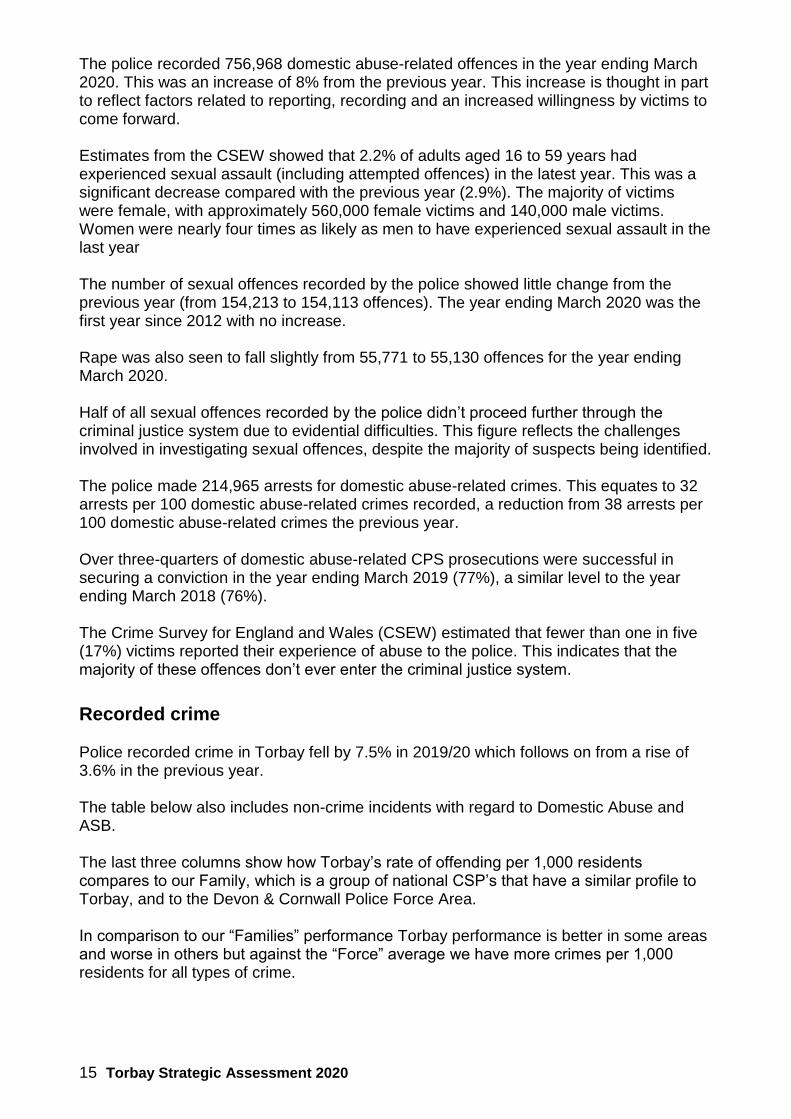
The police recorded 756,968 domestic abuse-related offences in the year ending March 2020. This was an increase of 8% from the previous year. This increase is thought in part to reflect factors related to reporting, recording and an increased willingness by victims to come forward. Estimates from the CSEW showed that 2.2% of adults aged 16 to 59 years had experienced sexual assault (including attempted offences) in the latest year. This was a significant decrease compared with the previous year (2.9%). The majority of victims were female, with approximately 560,000 female victims and 140,000 male victims. Women were nearly four times as likely as men to have experienced sexual assault in the last year The number of sexual offences recorded by the police showed little change from the previous year (from 154,213 to 154,113 offences). The year ending March 2020 was the first year since 2012 with no increase. Rape was also seen to fall slightly from 55,771 to 55,130 offences for the year ending March 2020. Half of all sexual offences recorded by the police didn’t proceed further through the criminal justice system due to evidential difficulties. This figure reflects the challenges involved in investigating sexual offences, despite the majority of suspects being identified. The police made 214,965 arrests for domestic abuse-related crimes. This equates to 32 arrests per 100 domestic abuse-related crimes recorded, a reduction from 38 arrests per 100 domestic abuse-related crimes the previous year. Over three-quarters of domestic abuse-related CPS prosecutions were successful in securing a conviction in the year ending March 2019 (77%), a similar level to the year ending March 2018 (76%). The Crime Survey for England and Wales (CSEW) estimated that fewer than one in five (17%) victims reported their experience of abuse to the police. This indicates that the majority of these offences don’t ever enter the criminal justice system.
Recorded crime Police recorded crime in Torbay fell by 7.5% in 2019/20 which follows on from a rise of 3.6% in the previous year. The table below also includes non-crime incidents with regard to Domestic Abuse and ASB. The last three columns show how Torbay’s rate of offending per 1,000 residents compares to our Family, which is a group of national CSP’s that have a similar profile to Torbay, and to the Devon & Cornwall Police Force Area. In comparison to our “Families” performance Torbay performance is better in some areas and worse in others but against the “Force” average we have more crimes per 1,000 residents for all types of crime.

16 Torbay Strategic Assessment 2020
Crime / incident type 2018/19 2019/20 Change Trend Crimes per 1,000 residents.
Torbay Family D & C Force
All Crime 12241 11319 -7.5% ▼ 83.1 98.5 ▼ 56.6 ▲
All Domestic Abuse 3712 3645 -1.8% ▼
All ASB 4210 3714 -11.8% ▼
Violent Crime
Violence with injury 1978 1845 -6.7% ▼ 13.6 10.4 ▲ 8.8 ▲
Violence with no injury 3067 2952 -3.7% ▼ 21.7 25.4 ▼ 14.5 ▲
Homicide 2 0 -100.0% ▼
Domestic abuse and sexual offences
Domestic abuse Incidents 1247 1253 0.5% ▲
Domestic Abuse Crime Related 2465 2392 -3.0% ▼
Other sexual offences 301 267 -11.3% ▼ 1.9 2.0 ▼ 1.5 ▲
Rape 141 164 16.3% ▲ 1.2 1.1 ▲ 0.9 ▲
Acquisitive Crime
Domestic Burglary 279 283 1.4% ▲ 4.8 10.7 ▼ 3.2 ▲
Non domestic burglary 263 262 -0.4% ▼ 1.9 2.0 ▼ 1.6 ▲
Shoplifting 782 658 -15.9% ▼ 4.9 7.3 ▼ 3.5 ▲
Other theft 1283 979 -23.7% ▼
Vehicle Crime 666 641 -3.8% ▼ 4.7 6.8 ▼ 2.6 ▲
Robbery 113 108 -4.4% ▼ 0.8 0.9 ▼ 0.4 ▲
Drug offences
Drug trafficking 120 125 4.2% ▲ 0.9 0.8 ▲ 0.5 ▲
Possession of drugs 367 380 3.5% ▲ 2.8 2.2 ▲ 1.9 ▲
Anti-Social Behaviour
Criminal Damage 1487 1454 -2.2% ▼ 10.6 11.8 ▼ 7.6 ▲
Arson 53 51 -3.8% ▼ 0.4 0.6 ▼ 0.4
▲
Public Order 906 811 -10.5% ▼ 5.9 10.0 ▼ 4.0 ▲
Possession of Weapons 153 141 -7.8% ▼ 1.0 0.9 ▲ 0.6 ▲
ASB Incidents 4210 3714 -11.8% ▼
17 Torbay Strategic Assessment 2020
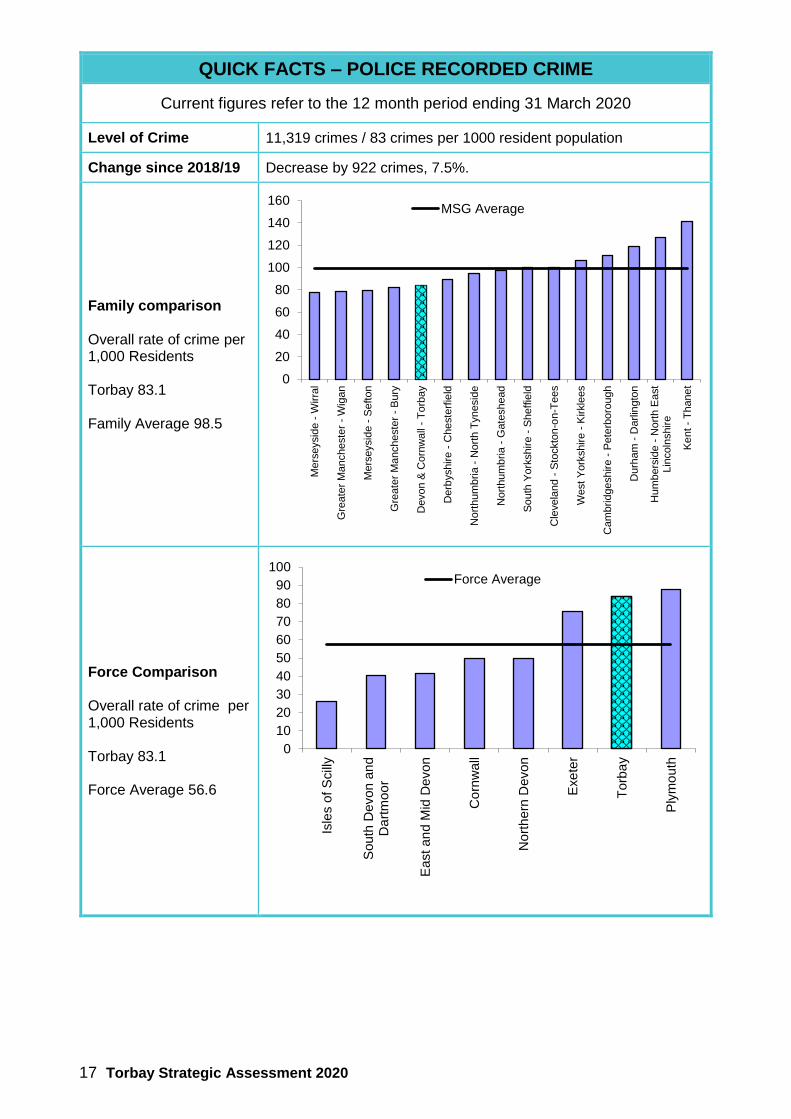
QUICK FACTS – POLICE RECORDED CRIME
Current figures refer to the 12 month period ending 31 March 2020
Level of Crime 11,319 crimes / 83 crimes per 1000 resident population
Change since 2018/19 Decrease by 922 crimes, 7.5%.
Family comparison Overall rate of crime per 1,000 Residents Torbay 83.1 Family Average 98.5
Force Comparison Overall rate of crime per 1,000 Residents Torbay 83.1 Force Average 56.6
0
20
40
60
80
100
120
140
160
Me
rseysid
e -
Wirra
l
Gre
ate
r M
ancheste
r -
Wig
an
Me
rseysid
e -
Sefton
Gre
ate
r M
ancheste
r -
Bury
Devon &
Corn
wall
- T
orb
ay
Derb
yshire -
Cheste
rfie
ld
Nort
hum
bria
- N
ort
h T
ynesid
e
Nort
hum
bria
- G
ate
shead
So
uth
York
shire -
Sheffie
ld
Cle
vela
nd -
Sto
ckto
n-o
n-T
ees
West Y
ork
shire -
Kirkle
es
Cam
brid
gesh
ire -
Pete
rboro
ugh
Durh
am
- D
arlin
gto
n
Hum
bers
ide -
Nort
h E
ast
Lin
coln
shire
Ke
nt -
Th
ane
t
MSG Average
0
10
20
30
40
50
60
70
80
90
100
Isle
s o
f S
cill
y
South
Devon
an
dD
art
moo
r
East an
d M
id D
evon
Co
rnw
all
No
rth
ern
Devon
Exe
ter
Torb
ay
Ply
mo
uth
Force Average

18 Torbay Strategic Assessment 2020
Overall crime levels
Breakdown of crime types
*includes violence against the person, sexual offences and robbery
8,9888,568
9,678
11,81612,241
11,319
0
2,000
4,000
6,000
8,000
10,000
12,000
14,000
2014/15 2015/16 2016/17 2017/18 2018/19 2019/20

19 Torbay Strategic Assessment 2020
Violent crime
Morile Ranking Threat, Risk & Harm Assessment
2018/2019 2019/2020
Violence with Injury Standard Standard
Violence without Injury Standard Standard
During 2019/20 Violent Crime in Torbay decreased by 5% reducing from 5,045 to 4,797 (The first reduction in this crime type for the last 8 years) Violent Crime with Injury fell by 7% to 1,845 and Violent Crime without Injury fell by 4% to 2,952. This includes crimes that are also categorised as Domestic Abuse which are detailed later within the report. The most common offences included within the category Violence with Injury are:
ACTUAL OFFENCES 2018/19 2019/20 Change
ASSAULT A PERSON THEREBY OCCASIONING THEM ACTUAL BODILY HARM
1763 1634 -129
SECTION 18 - GRIEVOUS BODILY HARM WITH INTENT 48 58 10
OWNER / PERSON IN CHARGE OF DOG DANGEROUSLY OUT OF CONTROL CAUSING INJURY
43 50 7
The most common offences included within the category violence without injury are:
ACTUAL OFFENCES 2018/19 2019/20 Change
COMMON ASSAULT 1568 1365 -203
SEND LETTER / COMMUNICATION / ARTICLE CONVEYING A THREATENING MESSAGE
421 375 -46
HARASSMENT WITHOUT VIOLENCE 329 346 17
Compared to similar CSP areas, Torbay was slightly below average for violent crimes and above average for those within Devon & Cornwall.
Violent Crimes by month, rate per 1,000 Residents Comparison Overall rate of crime per 1,000 Residents Annual Rates Torbay 35.3 Force Average 23.3 Family Average 35.8
20 Torbay Strategic Assessment 2020
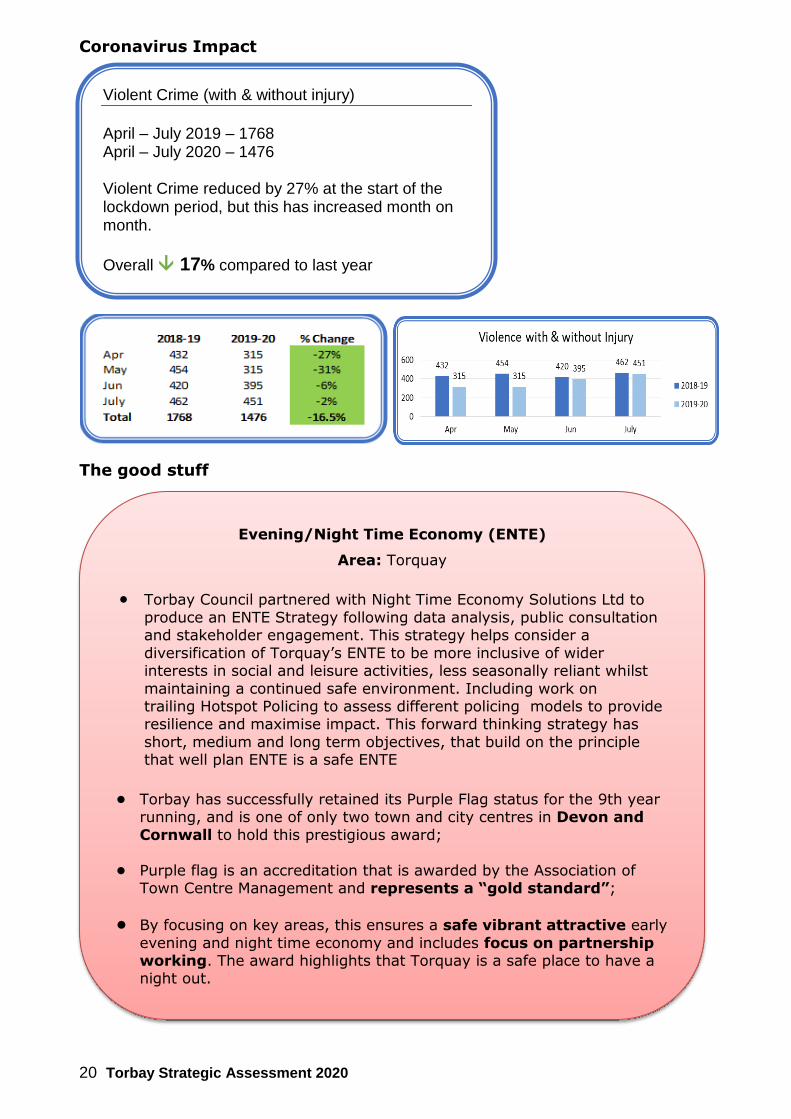
Coronavirus Impact
The good stuff
Evening/Night Time Economy (ENTE)
Area: Torquay
Torbay Council partnered with Night Time Economy Solutions Ltd to
produce an ENTE Strategy following data analysis, public consultation and stakeholder engagement. This strategy helps consider a
diversification of Torquay’s ENTE to be more inclusive of wider interests in social and leisure activities, less seasonally reliant whilst
maintaining a continued safe environment. Including work on trailing Hotspot Policing to assess different policing models to provide resilience and maximise impact. This forward thinking strategy has
short, medium and long term objectives, that build on the principle that well plan ENTE is a safe ENTE
• Torbay has successfully retained its Purple Flag status for the 9th year running, and is one of only two town and city centres in Devon and
Cornwall to hold this prestigious award;
• Purple flag is an accreditation that is awarded by the Association of Town Centre Management and represents a “gold standard”;
• By focusing on key areas, this ensures a safe vibrant attractive early
evening and night time economy and includes focus on partnership working. The award highlights that Torquay is a safe place to have a night out.
Violent Crime (with & without injury)
April – July 2019 – 1768 April – July 2020 – 1476 Violent Crime reduced by 27% at the start of the lockdown period, but this has increased month on month.
Overall 17% compared to last year

21 Torbay Strategic Assessment 2020
Domestic Abuse
Morile Ranking Threat, Risk & Harm Assessment
2018/2019 2019/2020
Domestic Abuse High HighHigh
It should be taken into account that figures only relate to those crimes and incidents that are reported. Most domestic abuse (DA) incidents are unreported for example the latest available estimates from the Crime Survey for England and Wales (CSEW) estimated that fewer than one in five (17%) victims reported their experience of abuse to the police. Women were more likely than men to have experienced all types of domestic abuse in the last 12 months, with the exception of non-sexual family abuse, where the difference was non-significant. Sexual assault (including attempts) by a partner is where the largest difference between men and women was observed, with women being four times as likely as men to have experienced this type of abuse in the last year. Within Torbay 96% of DA Crimes had a victim gender recorded. This equates to 1669 women and 632 men. With regard to the ages of the victims 130 were children. DA Victims 1,696 victims were recorded against 2,316 DA Crimes. 1,319 were a victm of one DA crime, whilst 377 were victims of multiple DA Crimes reported within this year. Repeat victims, (22% of the total number of victims identified), were victims in 997 DA Crimes, 42% of total DA Crime. 2035 DA risk assessments were completed by the police during the year out of the 2392 DA Crimes. Children were reported as being present during the incident on 537 occasions (22%). In Torbay the following chart represents how much crime was domestic abuse related in the last year compared to England & Wales. As you can see in every category apart from Public Order offences Torbay has a higher percentage of offences flagged as domestic abuse.
73% 27%

22 Torbay Strategic Assessment 2020
In Torbay the overall level of reported Domestic Abuse in the last year has decreased from 3,712 to 3,645 this year a 2% fall. This includes Domestic Abuse Incidents & Domestic Abuse related to crimes. The number of incidents which are crime related as a total of all Domestic Abuse has remained at 66% this year, the same as for 2018/19. The following 6 offences account for 95% of all Domestic Abuse related crimes:
ACTUAL OFFENCE 2018/19 2019/20 CHANGE
Criminal Damage 203 212 9
Other Theft 103 87 -16
Public Order Offences 71 61 -10
Rape 55 61 6
Violence with Injury 694 654 -40
Violence without Injury 1229 1202 -27
Coronavirus Impact
Domestic Abuse (Crimes & Incidents)
April – July 2019 – 1244 April – July 2020 – 1263 April was the only month during lockdown where Domestic Abuse Crimes/Incidents decreased
Overall 1.5% compared to last year
0% 5% 10% 15% 20% 25% 30% 35% 40%
Violence against the person
Sexual Offences
Public Order offences
Criminal damage & arson
All offences
Percentage of Offences flagged as Domestic Abuse
England & Wales Torbay

23 Torbay Strategic Assessment 2020
The good stuff
Multiple and Complex Needs: Alliance Commissioning
Area: Torbay • Recognising that many people with multiple and complex needs often
fall between the gaps of single-issue services, Torbay Council is in the process of re-commissioning its domestic abuse, substance misuse and homelessness hostel services under an alliance contract model;
• This will ensure that decisions are made on a ‘best for person’ basis
and enable the providers to respond more holistically to people by adapting their offers to the specific needs of those requiring their services.
• Process the culmination of multiple stakeholder engagement and
learning from other areas. Services will commence 2022.
Developing a community response: Standing Tall Partnership
Area: Torbay
• Community groups and organisations based in Paignton have come together to form a partnership around domestic abuse and sexual
violence, it formed out of the Torbay DASV Community Forum;
• The partnership includes Ladies Lounge, Make Amends,
Shekinah,The Devon Clinic, Rising Moments, What’s Your Problem CIC, Torbay Community Development Trust,
Healthwatch Torbay;
• Since its formation in 2020 and during covid the partnership has
received over 100 referrals.

24 Torbay Strategic Assessment 2020
Next Steps
Sexual Offences
Morile Ranking Threat, Risk & Harm Assessment
2018/2019 2019/2020
Other Sexual Offences Moderate Standard
Rape Moderate High
The number of reported Sexual offences decreased by 2% in 2019/20, 431 compared to the previous year of 442. Within these offences Rape increased by 16% in the year from 141 offences in 2018/19 to 164 this year. With regards to the victims of these rapes 150 were female and 12 were male. There were 12 repeat victims which accounted for 28 of the 164 offences and 61 of the offences were flagged as Domestic Abuse. There was a wide age range of victims, 47 aged under 16, 47 in their 20’s and 13 between the age of 41 and 59.
Domestic Abuse & Sexual Violence
The Board will continue to support the development of new and
innovative roles across the system and contribute to the
development of best practice
The Board will continue to work with commissioners and
community safety partners across the peninsular to ensure we
share good practice, ideas and expertise to provide the best
coordinated and evidence-led responses possible
The Board will ensure that Torbay is ready to enact provisions of
the Domestic Abuse Act 2020 when it comes into statute
The Board will continue to support the strategic embedding of the
CRAFT framework across agencies, to raise system-wide levels of
competency to respond to domestic abuse
The Board will continue to support the development of the
community and voluntary sector support offer

25 Torbay Strategic Assessment 2020
Whilst 164 rape offences were reported this year, 64 (39%), of the cases were historic with 12 committed within the last 2 years, 9 between 3-5 years, 11 between 6-10 years and 32 committed more than 10 years ago. Of the 106 rape crimes with a location recorded, 76 of these were committed within a dwelling. Other Sexual Offences have decreased by 11% to 267 crimes. The most prolific offences in this category are:
ACTUAL OFFENCE 2018/19 2019/20 CHANGE
ASSAULT A FEMALE 13 AND OVER BY PENETRATION WITH PART OF BODY / A THING - SOA 2003
21 19 -2
ASSAULT A GIRL UNDER 13 BY TOUCHING - SOA 2003 13 30 17
EXPOSURE - SOA 2003 13 8 -5
SEXUAL ASSAULT ON A FEMALE 110 92 -18
SEXUAL ASSAULT ON A MALE 16 19 3
Compared to similar CSP areas and those within Devon & Cornwall, Torbay was above the average rate.
Sexual offences by month, rate per 1,000 Residents
Comparison Overall rate of crime per 1,000 Residents Annual Rates Torbay 3.2 Force Average 2.5 Family Average 3.0

26 Torbay Strategic Assessment 2020
Coronavirus Impact
Acquisitive crime
Morile Ranking Threat, Risk & Harm Assessment
2018/19 2019/20
Burglary Dwelling Standard Moderate
Burglary Non-Dwelling Standard Standard
Shoplifting Standard Standard
Other Theft Standard Standard
Vehicle Crime Standard Standard
Robbery Moderate Standard
Torbay has seen a decrease in total Acquisitive Crime. In 2019/20 the total acquisitive crimes were 2,931 compared to 3,386 the previous year, a decrease of 13% If you consider just serious Acquisitive Crime - Domestic Burglary, Robbery and Vehicle Crime, overall this has decreased by 2% reducing from 1,058 crimes to 1,032 crimes. Domestic Burglary increased by 1.4% whilst Vehicle Crime reduced by 3.8% and Robbery reduced by 4.4%
Sexual Offences
April – July 2019 – 135 April – July 2020 – 111 At the beginning of lockdown incidents decreased significantly. July is the first month incidents have increased.
Overall 18% compared to last year

27 Torbay Strategic Assessment 2020
Coronavirus Impact
Drug Offences
Morile Ranking Threat, Risk & Harm Assessment
2018/2019 2019/20
Trafficking Drugs High High
Possession of Drugs High Moderate
There was a 3.5% increase in Possession of Drugs, from 367 offences to 380 and also an increase in Drug Trafficking offences of 4% from 120 to 125. 74% of all the possession offences related to Class B drugs. Compared to similar CSP areas and those within Devon & Cornwall, Torbay was above the average rate.
Acquistive Crime
April – July 2019 – 948 April – July 2020 – 771 May and June saw the largets decreases, reducing by 28% & 30% retrospectively.
Overall 19% compared to last year

28 Torbay Strategic Assessment 2020
Coronavirus Impact
Drug offences by month, rate per 1,000 Residents
Comparison Overall rate of crime per 1,000 Residents Annual Rates Torbay 3.7 Force Average 2.4 Family Average 3.1
Possession of Drugs
April – July 2019 – 144 April – July 2020 – 148 Possession of Drugs has not significantly changed during lockdown
Overall 3% compared to last year
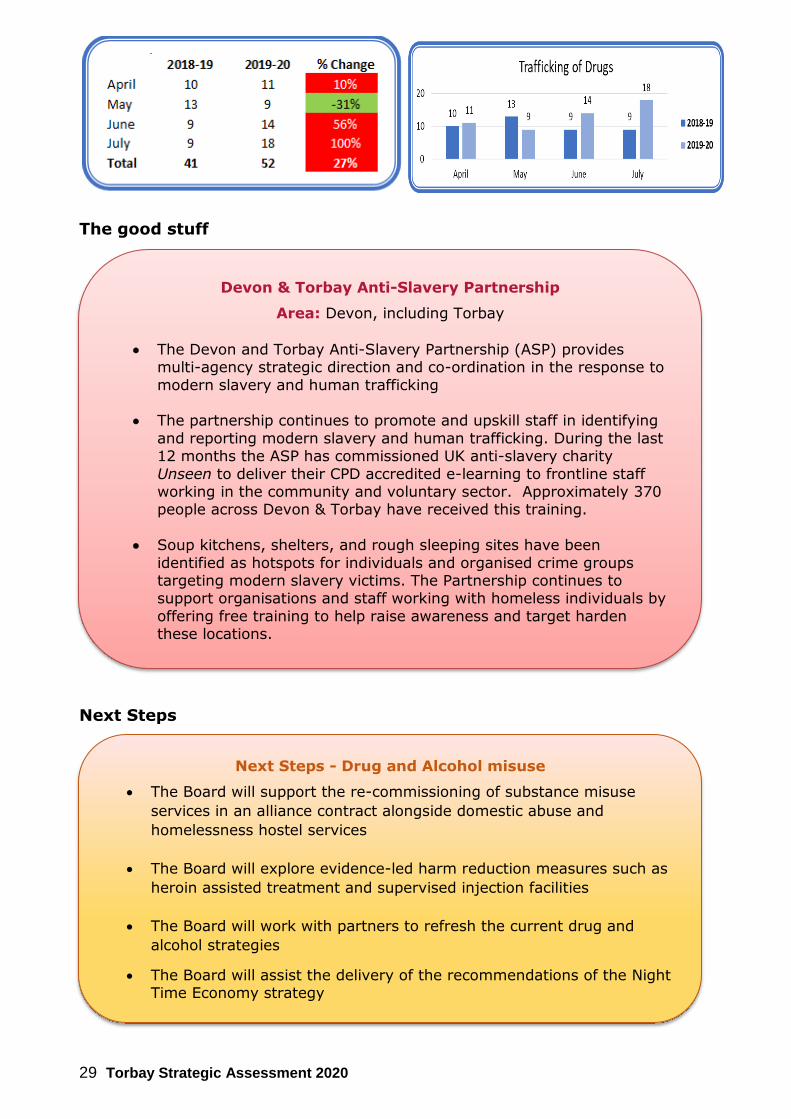
Trafficking of Drugs
April – July 2019 – 41 April – July 2020 – 52 Trafficking of Drugs has seen significant increases within June & July.
Overall 27% compared to last year
29 Torbay Strategic Assessment 2020
The good stuff
Next Steps
Devon & Torbay Anti-Slavery Partnership
Area: Devon, including Torbay
The Devon and Torbay Anti-Slavery Partnership (ASP) provides
multi-agency strategic direction and co-ordination in the response to
modern slavery and human trafficking
The partnership continues to promote and upskill staff in identifying
and reporting modern slavery and human trafficking. During the last 12 months the ASP has commissioned UK anti-slavery charity
Unseen to deliver their CPD accredited e-learning to frontline staff working in the community and voluntary sector. Approximately 370 people across Devon & Torbay have received this training.
Soup kitchens, shelters, and rough sleeping sites have been
identified as hotspots for individuals and organised crime groups targeting modern slavery victims. The Partnership continues to support organisations and staff working with homeless individuals by
offering free training to help raise awareness and target harden these locations.
Next Steps - Drug and Alcohol misuse
The Board will support the re-commissioning of substance misuse
services in an alliance contract alongside domestic abuse and
homelessness hostel services
The Board will explore evidence-led harm reduction measures such as
heroin assisted treatment and supervised injection facilities
The Board will work with partners to refresh the current drug and
alcohol strategies
The Board will assist the delivery of the recommendations of the Night Time Economy strategy

30 Torbay Strategic Assessment 2020
Anti-Social Behaviour Anti-social behaviour (ASB) in all forms is linked to many community safety challenges such as fear of crime (i.e. how people perceive crime and how it makes them feel) and substance misuse (e.g. the misuse of alcohol or drugs). ASB can have a detrimental impact on the quality of life for individuals, families and communities. Although reports of ASB have fallen in recent years, ASB has been the main crime and disorder priority of the public. Alcohol, drugs, mental health, family issues and accommodation are all things that can contribute to ASB problems.
Morile Ranking Threat, Risk & Harm Assessment
2018/2019 2019/2020
Criminal Damage Standard Standard
Arson Standard Standard
Public order offences Standard Standard
Possession of Weapons Standard Standard
Anti-social Behaviour Moderate Moderate
The total number of Criminal Damage, Arson and Public Order offences showed no significant change from the previous year. Criminal damage and Arson both decreased by 2% and 4% respectively. Public Order decreased by 11% and Possession of Weapons decreased by 8%. The most common offences included within Possession of Weapons are:
ACTUAL OFFENCE 2018/1
9 2019/2
0 CHANG
E
POSSESS AN OFFENSIVE WEAPON IN A PUBLIC PLACE 44 45 1
POSSESS KNIFE BLADE / SHARP POINTED ARTICLE IN A PUBLIC PLACE 45 42 -3
THREATEN A PERSON WITH A BLADE / SHARPLY POINTED ARTICLE IN A PUBLIC PLACE
20 22 2
THREATEN A PERSON WITH AN OFFENSIVE WEAPON IN A PUBLIC PLACE 6
12 6
Torbay has experienced a decrease in police reported ASB of 12%, from 4,210 to 3,714 incidents in 2019/20.

31 Torbay Strategic Assessment 2020
Coronavirus Impact
The good stuff
Homelessness & Vulnerability Meeting (H&V)
Area: Torbay • The ASB and Vulnerabiliy Team of Torbay Council Chair a bi-weekly
multi-agency meeting that brings together representatives from agencies including: substance misuse services, adult social care,
Housing First, Resettlement (outreach) Team, Police, hostel, housing options and support services;
• Information is shared with consent to help provide the best multi-
agency response to persons identified in need, where necessary
separate more focused meetings are held for individuals who are included in the process;
• Where all system offers have been exhausted, a referral can be made
to the Creative Solutions Panel supported by the Safeguarding Adults
Board.
Anti-Social Behaviour
April – July 2019 – 1444 April – July 2020 – 1867 Incidents increased month on month during ockdown, with the highest increases during May and June at 47% & 41% retrospectively.
Overall 29% compared to last year

32 Torbay Strategic Assessment 2020
Next Steps
ASB and Criminal Damage
The Board will explore new approaches to drug policy in an effort to
reduce crime, disorder and ASB related to substance misuse
The Board will review partnership approach in relation to exploitation,
vulnerability, youth crime and ASB to identify areas of good practice
and opportunities for development as part of co-ordinated approach.
Hate Crime
The Board will support the Zero Tolerance to Hate campaign and
continue to engage with partners and the community in raising
awareness of this campaign
The Board will work with partners to understand the prevalence and
profile of hate crime within Torbay and support activity to tackle specific
areas as appropriate
Terrorism, Radicalisation and Extremism
The Board will support the implementation of a PREVENT and CHANNEL
training competency framework and the Act Eary Prevent Safeguarding
Campaign across the partnership
The Board will support the implementation of the new CHANNEL Duty
Guidance.
The Board will continue to support the work of the Torbay and Devon
PREVENT Partnership.
33 Torbay Strategic Assessment 2020
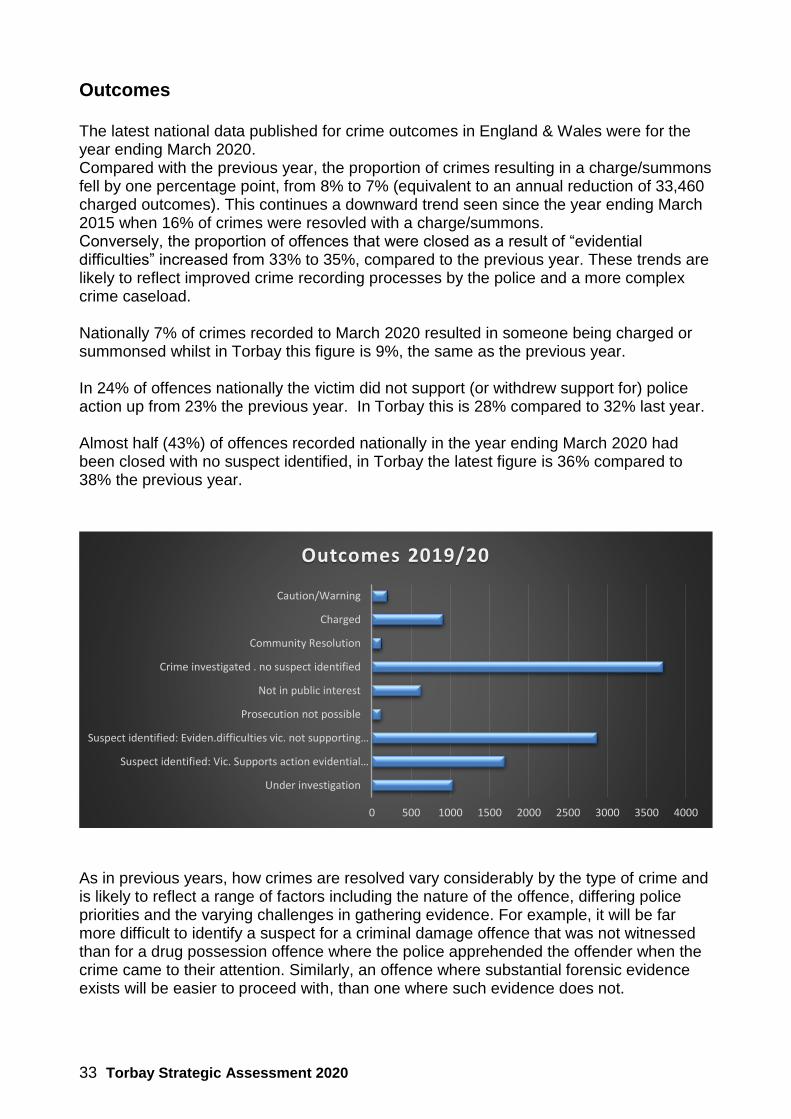
Outcomes The latest national data published for crime outcomes in England & Wales were for the year ending March 2020. Compared with the previous year, the proportion of crimes resulting in a charge/summons fell by one percentage point, from 8% to 7% (equivalent to an annual reduction of 33,460 charged outcomes). This continues a downward trend seen since the year ending March 2015 when 16% of crimes were resovled with a charge/summons. Conversely, the proportion of offences that were closed as a result of “evidential difficulties” increased from 33% to 35%, compared to the previous year. These trends are likely to reflect improved crime recording processes by the police and a more complex crime caseload. Nationally 7% of crimes recorded to March 2020 resulted in someone being charged or summonsed whilst in Torbay this figure is 9%, the same as the previous year. In 24% of offences nationally the victim did not support (or withdrew support for) police action up from 23% the previous year. In Torbay this is 28% compared to 32% last year. Almost half (43%) of offences recorded nationally in the year ending March 2020 had been closed with no suspect identified, in Torbay the latest figure is 36% compared to 38% the previous year.
As in previous years, how crimes are resolved vary considerably by the type of crime and is likely to reflect a range of factors including the nature of the offence, differing police priorities and the varying challenges in gathering evidence. For example, it will be far more difficult to identify a suspect for a criminal damage offence that was not witnessed than for a drug possession offence where the police apprehended the offender when the crime came to their attention. Similarly, an offence where substantial forensic evidence exists will be easier to proceed with, than one where such evidence does not.
0 500 1000 1500 2000 2500 3000 3500 4000
Under investigation
Suspect identified: Vic. Supports action evidential…
Suspect identified: Eviden.difficulties vic. not supporting…
Prosecution not possible
Not in public interest
Crime investigated . no suspect identified
Community Resolution
Charged
Caution/Warning
Outcomes 2019/20
34 Torbay Strategic Assessment 2020
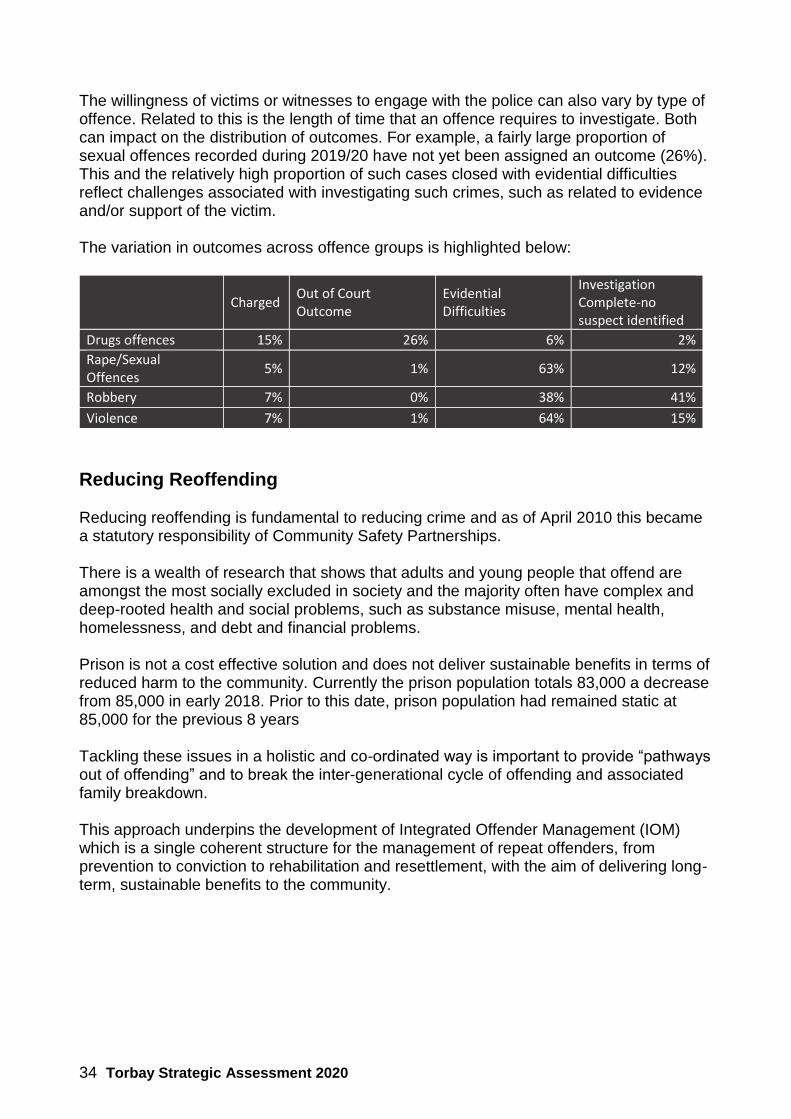
The willingness of victims or witnesses to engage with the police can also vary by type of offence. Related to this is the length of time that an offence requires to investigate. Both can impact on the distribution of outcomes. For example, a fairly large proportion of sexual offences recorded during 2019/20 have not yet been assigned an outcome (26%). This and the relatively high proportion of such cases closed with evidential difficulties reflect challenges associated with investigating such crimes, such as related to evidence and/or support of the victim. The variation in outcomes across offence groups is highlighted below:
Charged Out of Court Outcome
Evidential Difficulties
Investigation Complete-no suspect identified
Drugs offences 15% 26% 6% 2%
Rape/Sexual Offences
5% 1% 63% 12%
Robbery 7% 0% 38% 41%
Violence 7% 1% 64% 15%
Reducing Reoffending Reducing reoffending is fundamental to reducing crime and as of April 2010 this became a statutory responsibility of Community Safety Partnerships. There is a wealth of research that shows that adults and young people that offend are amongst the most socially excluded in society and the majority often have complex and deep-rooted health and social problems, such as substance misuse, mental health, homelessness, and debt and financial problems. Prison is not a cost effective solution and does not deliver sustainable benefits in terms of reduced harm to the community. Currently the prison population totals 83,000 a decrease from 85,000 in early 2018. Prior to this date, prison population had remained static at 85,000 for the previous 8 years Tackling these issues in a holistic and co-ordinated way is important to provide “pathways out of offending” and to break the inter-generational cycle of offending and associated family breakdown. This approach underpins the development of Integrated Offender Management (IOM) which is a single coherent structure for the management of repeat offenders, from prevention to conviction to rehabilitation and resettlement, with the aim of delivering long-term, sustainable benefits to the community.
35 Torbay Strategic Assessment 2020
Overall - Adult and Juvenile offenders
Trends in re-offending are measured by the frequency of re-offending and the proportion of offenders who re-offend, quarterly cohorts are tracked over 12 months to see if they reoffend and how many reoffences they commit. There is always a delay in reporting on a cohort as there is a 6 month waiting period added to the one year follow up period to allow offences to receive an outcome e.g. court sentencing. The most recent cohort is Apr 2017 to Mar 2018.
For that period in Torbay 1,044 adult and juvenile offenders were cautioned, received a non-custodial conviction at court or released from custody, 289 of these offenders committed a reoffence within a year. This gives an overall reoffending rate of 27.7% which is a decrease of 2.2% compared to the previous 12 months and is below the national rate of 29.2% Over the one year follow-up period 1,055 reoffences were committed, with those that reoffended committing on average 3.7 offences each compared to a rate of 3.6 in the previous 12 months. The current national rate is 4.04 Adult Offenders
Adult offenders represent 95% of the offending cohort and had a proven reoffending rate of 27.8%, representing a decrease of 2.0 percentage points compared to the previous 12 months. The national rate is 28.5%. Adults committed 1,026 reoffences over the one year follow-up period and those that reoffended committed on average 3.72 reoffences each. Juvenile Offenders
Juvenile offenders only represent 5% of the offending cohort and had a proven reoffending rate of 26%, a significant decrease of 5.5 percentage points from the previous 12 months and is below the national rate of 38.4%, the size of cohort has fallen from 92 in April 2016 to 50 in this period. Juveniles committed 29 reoffences over the one year follow-up period and those that reoffended committed on average 2.23 offences each. The table below demonstrates that re-offending rates for Adults have remained fairly consistent over the past 5 years but have reduced within the last year, whilst Juveniiles have reduced significantly year on year since Apr 2015.

36 Torbay Strategic Assessment 2020
Next Steps
Re-offending
Apr
2011 to
Mar
2012
Apr
2012 to
Mar
2013
Apr
2013 to
Mar
2014
Apr
2014 to
Mar
2015
Apr
2015 to
Mar
2016
Apr
2016 to
Mar
2017
Apr
2017 to
Mar
2018
Trend
Adult
Proportion of offenders who reoffend (%) 32.5 28.2 28.2 29.1 29.0 29.8 27.8
Average number of reoffences per reoffender 3.81 3.36 3.37 3.53 3.33 3.61 3.72
Juvenile
Proportion of offenders who reoffend (%) 31.7 30.4 33.9 27.6 39.3 31.5 26.0
Average number of reoffences per reoffender 2.83 2.57 3.75 2.37 2.86 3.14 2.23
Reducing Offending/reoffending
The Board will refresh our Reducing Offending and Reoffending
Strategy, ensuring alignment with regional and peninsula wide
strategies
The Board will ensure that reducing offending and reoffending is a core
theme throughout all of its work and will proactively learn from and
consider Desistance Theory
The Board will continue to engage with and support the work of the
regional Improving Outcomes for Women in the Criminal Justice
System Board
37 Torbay Strategic Assessment 2020
Appendix A - Morile
MoRiLE – Strategic version
MoRiLE is a tool to enable law enforcement agencies to understand their strategic risk and should be incorporated within the strategic assessment process: with all law enforcement agencies in the UK using the MoRiLE process it will be possible to establish a national picture of risk.
The key features of the MoRiLE process are:
1. Prioritisation of resources through a transparent and informed decision making process.
2. Assessment of a range of thematic areas alongside each other. 3. Assessment of capability and capacity in relation to each thematic area. 4. Avoidance of bias in risk assessment. 5. Use of a common language in relation to risk.
6. A clear process that is easy to use and understand.
Definitions
Definitions for key terms used within MoRiLE have been established to ensure a common language is used across all agencies. These definitions were developed through group discussions with representatives from a wide range of agencies present and the terms were debated until a consensus was reached.
The following are the definitions to be used throughout the process:
Thematic Area An area of business that poses a threat with the intention to inflict harm against a person, group, organisation, event or property coupled with the capability to do so.
Impact Criteria The anticipated Impact of the Thematic Area on individuals, communities, the environment, the organisation or the economy.
Likelihood The scale of criminality (frequency & volume) seen by the agency alongside trend and forecast assessments.
Confidence Score Confidence is assessed in two ways, The Intelligence Assessment considers the confidence the Process Lead Author has regarding the intelligence picture and that the impacts have been correctly assessed. The Thematic Area Knowledge considers whether the criminality is a known subject matter area.
These two columns do not attract a score and as such do not affect the risk score: they are for information purposes only.
Risk Assessed by multiplying Impact by Likelihood. This represents the inherent risk to an agency without any consideration of the mitigation taken to reduce this risk.
Organisational Position
The impact on the agencies reputation and finances is considered along with their capacity and capability to manage the impact from the Thematic Area. This represents the residual risk to the agency after assessing the actions already in place to mitigate the risk.

38 Torbay Strategic Assessment 2020
The Matrix
A risk matrix has been created to assist in the MoRiLE process. The MoRiLE Matrix assists agencies in identifying the following in relation to the Thematic Areas they need to assess:
the nature and degree of the Impact for each Thematic Area.
the Likelihood of the Impact occurring.
the level of Risk posed before and after mitigation has been considered.
The Matrix is a tool to help decision making and is designed to be used in conjunction with narrative which explains why scores have been given for the Impact Criteria, Likelihood or Organisational Position: for example, why modern slavery may have a rating of ‘severe’ in the Individual and Financial Impact columns, and why there may be ratings indicating serious Capacity and Capability problems under the Organisational Position section.
The matrix is made up of the following sections:
Thematic Areas
It is essential to separate Thematic Areas into clear categories to ensure each score is pertinent and gives an accurate reflection of the risk posed. For example, burglary would separate into dwelling burglary, distraction burglary, aggravated burglary, commercial burglary etc. Aggravated burglary is likely to be considered to be of greater risk than standard dwelling burglary due to the violent nature of the action taken by the perpetrators. If the different types of burglary were scored as a whole, the issues around aggravated burglary might not be identified.
Impact
The scoring scheme has been designed to cover the fundamental impacts experienced across all Thematic Areas.
These are explained in a table below:
MATRIX AREA
Impact This is the harm or impact caused by the criminality and/or criminals. Definition - The anticipated Harm of the Thematic Area on individuals, communities, the environment, the organisation or the economy.
Victim This is our first impact area and focuses on assessing the harm to the victim across three areas, physical, psychological and financial.
Victim Physical
What is the physical impact on the victim? What level of harm has been caused to them? Have they required medical assistance? Are there any deaths/murders linked to the operation? Catastrophic – would be looking at the likes of a terrorist attack and multiple deaths/injuries.
Victim Psychological
What is the psychological impact on the victim? Was medical assistance required? Is the individual a danger to themselves or to others?
Victim Financial
What is the financial impact on the victim? Is the financial loss recoverable? How much hardship does this financial impact cause?

39 Torbay Strategic Assessment 2020
MATRIX AREA
Community
What is the impact on the community? How do the public feel about what is happening? Are they vocal about the issue? How many partner agencies will need to be involved in order to resolve this issue?
Public Expectation
Which groups or organisations expect the agency to deal with the crime or incident? How much pressure is exerted on the agency to deal with the issue? What sort of response to the issue is required and at what level?
Environment
What is the impact on the environment? Who, or what, is affected? How widespread is the impact? Is the damage permanent? Are endangered species involved?
The Impacts for each Thematic Area are considered by working through the matrix. This will enable the agency to identify the most significant impacts for each thematic area and will provide an understanding of how targeted activity, aimed at these impacts, could reduce the overall risk.
The Scoring Guide (Appendix 1) should be used alongside the Matrix to make sure that scoring is accurate and consistent.
Likelihood
This looks at the scale of criminality seen by the agency, the trends shown in the data for the last 12 months and the expected forecast for the next 12 months for the Thematic Area.
MATRIX AREA
Likelihood The scale of criminality (frequency & volume) seen by the agency alongside trend and forecast assessments.
Frequency How often is the individual/group committing criminal activity?
Volume How much activity is seen each time?
Trend Has the number of crimes increased or decreased? By how much (%) has this increase/decrease happened?
Forecast
Is it expected that the number of crimes will continue to increase or decrease in the next 12months? By how much (%) is it expected that this area will increase/decrease in the next 12months? What does horizon scanning reveal?

40 Torbay Strategic Assessment 2020
Confidence Score
The Confidence Score is split into two columns, the Intelligence Assessment and the Thematic Area Knowledge. These two columns are non-scoring and do not affect the risk score. They are included to aid the decision maker but are for information purposes only.
MATRIX AREA
Confidence Score
Confidence is assessed in two ways, The Intelligence Assessment considers the confidence the Process Lead Author has regarding the intelligence picture and that the impacts have been correctly assessed. The Thematic Area Knowledge considers whether the criminality is a known subject matter area.
Intelligence Assessment
Does the intelligence picture contain weaknesses? How significant are these weaknesses? Do these weaknesses affect how confident you are in being able to accurately score the impact criteria?
Knowledge
Is this a standard area of crime that law enforcement have been fighting for many years? Is it an easy area to investigate or does it require additional skills? Are there any new elements – i.e. how it is being carried out? Is this area classed as a SIR or an emerging issue?
Risk
This column is automatically calculated when the Impact and Likelihood values are selected. To calculate you multiply the two scores together. This score represents the Risk to the agency before any mitigation has been considered.
Organisational Position (OP)
The Organisational Position section is divided into four columns. This section is aimed at identifying how an agency is responding to the Thematic Area.
MATRIX AREA
Organisational Position
The impact on the agencies reputation and finances is considered along with their capacity and capability to manage the impact from the Thematic Area. This represents the residual risk to the agency after assessing the actions already in place to mitigate the risk.
Reputation & Politics
Is the agency receiving political pressure to deal with this issue? Where does this pressure come from? What is the damage to the organisation if we do not act?
Economic Cost
What is the cost to the organisation to deal with this issue….over and above Business As Usual? How long is it expected that resources will be committed? What is the effect on the organisation to do other work?
Capacity Do we have people to work on this? Do we need more resources?
Capability Do we have the right people to work on this? Do we need more resources with specific skills? Do we need different equipment?

41 Torbay Strategic Assessment 2020
Morile Scoring Guide
The Scoring Guide should be used alongside the Matrix to ensure scoring is accurate and consistent.
The Matrix grades the columns along a linear scale, which, when added, draw a multiplier from a set table and performs a calculation. The calculation has been configured to allow the Risk score to increase or decrease dependent upon the mitigation already in place.
This ensures that those Thematic Areas which score at the upper extremities receive due attention while lower scoring themes are not over emphasised and are dealt with as “business as usual”.
The result of the calculation is the Organisation Position Grading which represents the risk posed to the organisation by that particular issue.
If the agency is responding to the risk and this activity is effective, it is in effect saying that the agency is taking positive steps to mitigate the risk and as such the risk faced by them from this issue is reduced.
It is important to note that it is not saying that the inherent risk has reduced, but that the risk to the organisation is reduced due to activity being taken. Therefore, the reduction in score should be viewed positively by the agency.
If the agency is not doing anything to mitigate the risk because it does not have the resources, capability or if the action being taken is not effective the score will go up, it is highlighting that the agency needs to do something otherwise it could have negative consequences for them.

42 Torbay Strategic Assessment 2020
MoRiLE Scoring Guide RISK
Title CommunityPublic
ExpectationEnvironmental
Total Harm
Score
Total
Likelihood
Score
Risk ScoreReputation and
PoliticsEconomic Cost Capacity Capability
Organisational
Position Grading
Detail
PHYSICAL
The physical
impact suffered
by an individual
PSYCHOLOGIC
AL
The
psychological
impact suffered
by an individual
FINANCIAL
The financial
impact suffered
by the victim
The impact on
the community
What would the
public expect, if
they knew what
you knew about
the issue
The impact on
the environment
and ecological
infrastructure
CALCULATING
TOTAL HARM
SCORE
FREQUENCY
The Frequency
with which the
activity is seen
to be committed
VOLUME
The volume of
actvity seen to
be committed by
the
individual/group
TREND
Based on last
12months data
FORECAST
Expectation for
the next
12months
CALCULATING
TOTAL
LIKELIHOOD
SCORE
CALCULATING
RISK SCORE
INTELLIGENCE
ASSESSMENT
How confident are
we that the impact
and likelihood
scores refects the
true scale of the
threat?
THEMATIC AREA
KNOWLEDGE
Is the criminality a
known subject matter
area?
The impact on
the
organisation's
reputation and
the effect of
internal and
external political
factors
The additional
cost to the
organisation to
resolve the
issue
Do we have
resources to
deal with the
issue?
Do we have the
expertise and/or
equipment
required to deal
with the issue?
CALCULATING THE
ORGANISATIONAL
POSITION SCORE
None/
Negligible
No / Negligible
impact
(0)
No / Negligible
impact
(0)
No / Negligible
impact
(0)
No / negligible
impact
(0)
No public
expectation
(0)
No / negligible
impact
(0)
Five years
(0.25)
No / Negligible
activity
(0.25)
Downward
(>10%
decrease)
(0.25)
Downward
(>10%
decrease)
(0.25)
Almost Certain
(>90% chance)
STANDARD
SITUATION
(Very well known
subject area)
Attracts attention
of local media
and/or political
group
(0)
Short term,
(small resource
implication for a
limited period of
time)
(0)
Yes
(0)
Yes
(0)
Low
Short term
physical impact
and/or
recoverable
without medical
assistance
(0.5)
Short term
psychological
impact and/or
recoverable
without medical
assistance
(0.5)
Short term
financial impact
and/or impact
has a minimal
effect on day to
day life.
(1)
Short term
impact and
awareness of
the issue but,
daily life largely
unaffected
(1)
Individuals place
expectations
upon
organisation to
act
(1)
Short term
impact and/or
low impact on
the environment
(1)
Annually
(0.5)
Small Volumes
(0.5)
Downward
(<10%
decrease)
(0.5)
Downward
(<10%
decrease)
(0.5)
Highly/Very
Probable/Likely
(>75% - <85%
chance)
STANDARD
SITUATION
(Well known, but not
an area to be
concerned about)
Attracts the
attention of
regional media
and/or
MEP/party view
(1)
Medium term,
(medium
resource
implication for
intermediate
time period),
managable
within the
agency.
(1)
Limited
resourcing
issues exist but
management of
the issue
continues
(1)
Minimal lack of
skills and
equipment but
management of
the issue
continues
(1)
Moderate
Medium term
physical impact
and/or requiring
medical
assistance.
(1)
Medium term
psychological
impact and/or
requiring
assistance of
local GP
(1)
Short term
financial impact
and/or impact is
recoverable
within a short
period of time
(ie.insurance)
(2)
Medium term
impact and an
increase in
concerns which
requires
involvement of
one partner
agency to tackle
issue
(2)
Group places
expectations
upon
organisation
which relates to
a specific
community
(2)
Medium term
impact and/or
incident is
contained within
a specific area
with limted
damage
(2)
Six Monthly
(1)
Moderate
Volumes
(1)
Same Level
(1)
Same Level
(1)
Probable/Likely
(>55% - <70%
chance)
KNOWN EMERGING
ISSUE
(but not a strategic
intelligence
requirement)
Attracts the
attention of
national media
and/or national
political interest
(ie: party leader)
(2)
Long term (large
resource
implication for
prolonged
period of time)
managable
within the
agency
(2)
Resourcing
issues exist
which have a
limited impact on
the management
of the issue
(2)
Lack of skills
and equipment
which has a
limited impact on
the management
of the issue
(2)
Substantial
Long term
physical impact
and/or requiring
hospitalisation
for 7+ days.
(2)
Long term
psyhcological
impact and/or
requiring
assistance of
local GP.
(2)
Medium term
financial impact
and/or loss is
not recoverable
due to
sentimental
nature of loss
(4)
Medium term
impact and an
increase in
concerns which
requires
involvement of 2-
3 partner
agencies to
tackle
(4)
Group places
expectations
upon
organisation
which relates to
a specific county
(4)
Medium term
impact and/or
incident causes
substantial
damage across
a large area
(4)
Monthly
(1.5)
Large Volumes
(1.5)
Upward
(<10% increase)
(1.5)
Upward
(<10% increase)
(1.5)
Realistic possibility
(>25% - <50%
chance)
EXISTING
STRATEGIC
INTELIGENCE
REQUIREMENT
Impact of issue
is felt at
international
levels and/or
attracts
international
political interest
(3)
Medium to long
term resource
implication
which requires
additional
resources to be
sought from
suitable
agencies
(3)
Resourcing
issues impede
the management
the issue
(3)
Lack of skills
and equipment
impedes
management of
the issue
(3)
SevereLoss of
individual life
(4)
Individual
requires specific
treatment which
involves partner
agencies (ie
Sectioned)
(4)
Medium term
financial impact
and/or loss is
not recoverable
through
insurance and
therefore causes
hardship
(8)
Long term
impact and
increase in
concerns
requires
involvement of 2-
3 partner
agencies to
tackle
(8)
Group places
expectations
upon
organisation
which relates to
a specific region
(8)
Long term
impact and/or
incident causes
sustained
damage across
a large area
(8)
Weekly
(2)
Very Large
Volumes
(2)
Upward
(>10% increase)
(2)
Upward
(>10% increase)
(2)
Improbable/Unlikely
(15-20%chance)
NEW AREA OF
CRIMINALITY
Impact of issue
is felt at
international
levels and/or
results in an
international
dispute (trade
embargoes, etc)
(4)
Severe
economic
consequences
(large,
prolonged
resource
implication
which is
unsustainable,
restricts the
ability to conduct
daily business)
(4)
No
(4)
No
(4)
CriticalLoss of two or
more lives
(8)
Individual
endangers
and/or causes
loss of own life
(8)
Long term
financial impact
to an inidvidual
or organisation
and/or impact
causes
significant
hardship
(homelessness,
redundancies)
(16)
The increase in
concerns
requires a multi-
agency (4+)
response to
tackle
(16)
Group places
expectations
upon
organisation
regarding an
issue which
impacts
nationally
(16)
Requires a multi-
agency (4+)
response to
tackle, incident
endangers the
environment and
all things living
in that area
(16)
Remote/Highly
Unlikely
(<10%)
Catastrophic
Mass casualty,
impact affects
the wider
community
(16)
Inidvidual
endagers and/or
causes loss of
others lives
(16)
Loss of business
causing financial
hardship in the
wider community
(32)
Critical Incident
declared
requiring
significant, co-
ordinated multi-
agency (4+)
approach to
tackle
(32)
Group places
expectations
upon
organisation
regarding an
issue which has
an international
impact
(32)
Critical Incident
declared
requiring
significant,
incident causes
permanent
damage to the
environment
(32)
-32
Add the score
for each of the
Harm criteria
together
(Individual +
Community +
Public
Expectation +
Environmental
= Total Harm
Score)
LIKELIHOOD ORGANISATIONAL POSITION
MoRiLE Thematic Model Version 7.2
IMPACT
Scale of CriminalityConfidence Assessment
(non scoring)
CONFIDENCE SCORE
PredictionIndividual
Add the scores
from the two
criteria
together (Scale
of Criminality +
Prediction =
Total
Likelihood
Score)
Multiply the
TOTAL HARM
SCORE by the
TOTAL IMPACT
SCORE
(Total Harm x Total
Likelihood = Risk
Score)
Organisational
Position Grading is
achieved by
populating the
Reputation &
Politics, Economic
Cost, Capacity and
Capability columns.
The resulting score
from these columns
will pull back a set
multiplier and a
calculation will be
performed providing
this final score.

43 Torbay Strategic Assessment 2020
The following 3 tables are the completed Morile matrix for crime types in Torbay:
IMPACT LIKELIHOOD
Thematic area Broad group
Ph
ysic
al
Ph
ysic
al S
core
Psych
olo
gic
al
Psych
olo
gic
al
Score
Fin
an
cia
l
Fin
an
cia
l S
core
Com
mu
nit
y
Com
mu
nit
y S
core
Pu
blic E
xp
ecta
tion
Pu
blic E
xp
ecta
tion
score
En
vir
on
men
tal
En
vir
on
men
tal
Score
Tota
l H
arm
Score
Violence with Injury Violence Moderate 1 Moderate 1 Low 1 Low 1 Low 1 None/Neglible 0 5
Violence without Injury Violence None/Neglible 0 Moderate 1 Low 1 Moderate 2 Moderate 2 None/Neglible 0 6
Homicide Violence Severe 4 Severe 4 Severe 8 Moderate 2 Moderate 2 None/Neglible 0 20
Domestic abuse DASV Moderate 1 Severe 4 Moderate 2 Severe 8 Substantial 4 None/Neglible 0 19
Other Sexual Offences DASV Moderate 1 Substantial 2 None/Neglible 0 Moderate 2 Substantial 4 None/Neglible 0 9
Rape DASV Substantial 2 Severe 4 Substantial 4 Moderate 2 Substantial 4 None/Neglible 0 16
Burglary Dwelling Theft None/Neglible 0 Moderate 1 Moderate 2 Substantial 4 Moderate 2 None/Neglible 0 9
Burglary Non-Dwelling Theft None/Neglible 0 Low 0.5 Moderate 2 Low 1 Low 1 None/Neglible 0 4.5
Shoplifting Theft None/Neglible 0 None/Neglible 0 Low 1 Moderate 2 Low 1 None/Neglible 0 4
Other Theft Theft None/Neglible 0 Low 0.5 Low 1 Low 1 Low 1 None/Neglible 0 3.5
Vehicle Crime Theft None/Neglible 0 Low 0.5 Moderate 2 Moderate 2 Low 1 None/Neglible 0 5.5
Robbery Theft Low 0.5 Moderate 1 Moderate 2 Moderate 2 Moderate 2 None/Neglible 0 7.5
Trafficking Drugs Drugs Moderate 1 Moderate 1 Moderate 2 Severe 8 Severe 8 Low 1 21
Possession of Drugs Drugs Moderate 1 Moderate 1 Moderate 2 Severe 8 Substantial 4 Low 1 17
Criminal Damage ASB & criminal damage None/Neglible 0 Low 0.5 Low 1 Low 1 Low 1 Moderate 2 5.5
Arson ASB & criminal damage Low 0.5 Low 0.5 Moderate 2 Moderate 2 Moderate 2 Low 1 8
Public Order Offences ASB & criminal damage None/Neglible 0 Low 0.5 None/Neglible 0 Moderate 2 Moderate 2 Low 1 5.5
Possession of Weapons Other crime None/Neglible 0 None/Neglible 0 None/Neglible 0 Substantial 4 Moderate 2 None/Neglible 0 6
Anti-social behaviour ASB & criminal damage None/Neglible 0 Low 0.5 Low 1 Substantial 4 Moderate 2 Moderate 2 9.5

44 Torbay Strategic Assessment 2020
LIKELIHOOD
Thematic area Broad group
Fre
qu
en
cy
Fre
qu
en
cy S
core
Volu
me
Volu
me S
core
Tre
nd
Tre
nd
Score
Fore
cast
Fore
cast
Score
Tota
l Lik
elih
ood
score
Risk
Violence with Injury Violence Daily 2.5 Very Large Volumes 2 <10% decrease 0.5 >10% decrease 0.25 5.25 26
Violence without Injury Violence Daily 2.5 Very Large Volumes 2 <10% decrease 0.5 <10% decrease 0.5 5.5 33
Homicide Violence Five Years 0.25 No / Negligible activity 0.25 >10% decrease 0.25 >10% decrease 0.25 1 20
Domestic abuse DASV Daily 2.5 Very Large Volumes 2 <10% decrease 0.5 <10% increase 1.5 6.5 124
Other Sexual Offences DASV Daily 2.5 Small Volumes 0.5 >10% decrease 0.25 >10% decrease 0.25 3.5 32
Rape DASV Weekly 2 Small Volumes 0.5 >10% increase 2 >10% increase 2 6.5 104
Burglary Dwelling Theft Daily 2.5 Small Volumes 0.5 <10% increase 1.5 Same 1 5.5 50
Burglary Non-Dwelling Theft Daily 2.5 Small Volumes 0.5 Same 1 Same 1 5 23
Shoplifting Theft Daily 2.5 Moderate Volumes 1 >10% decrease 0.25 >10% increase 2 5.75 23
Other Theft Theft Daily 2.5 Large Volumes 1.5 >10% decrease 0.25 >10% decrease 0.25 4.5 16
Vehicle Crime Theft Daily 2.5 Moderate Volumes 1 <10% decrease 0.5 <10% decrease 0.5 4.5 25
Robbery Theft Weekly 2 Small Volumes 0.5 <10% decrease 0.5 >10% decrease 0.25 3.25 24
Trafficking Drugs Drugs Weekly 2 Small Volumes 0.5 <10% increase 1.5 <10% increase 1.5 5.5 116
Possession of Drugs Drugs Daily 2.5 Small Volumes 0.5 <10% increase 1.5 <10% decrease 0.5 5 85
Criminal Damage ASB & criminal damage Daily 2.5 Very Large Volumes 2 <10% decrease 0.5 >10% decrease 0.25 5.25 29
Arson ASB & criminal damage Weekly 2 Small Volumes 0.5 <10% decrease 0.5 >10% decrease 0.25 3.25 26
Public Order Offences ASB & criminal damage Daily 2.5 Large Volumes 1.5 >10% decrease 0.25 <10% decrease 0.5 4.75 26
Possession of Weapons Other crime Weekly 2 Small Volumes 0.5 <10% decrease 0.5 >10% decrease 0.25 3.25 20
Anti-social behaviour ASB & criminal damage Daily 2.5 Very Large Volumes 2 >10% decrease 0.25 Same 1 5.75 55

45 Torbay Strategic Assessment 2020
CONFIDENCE SCORE ORGANISATIONAL POSITION
Thematic area Broad group
In
tellig
en
ce
Assessm
en
t
Th
em
ati
c A
rea
Kn
ow
led
ge
Rep
uta
tion
&
Politi
cs
Rep
uta
tion
an
d
Politi
cs S
core
Econ
om
ic C
ost
Econ
om
ic C
ost
Score
Cap
acit
y
Cap
acit
y S
core
Cap
ab
ilit
y
Cap
ab
ilit
y S
core
Tota
l O
P S
core
OP
Calc
ula
tion
OP
Gra
din
g
Ris
k G
rad
ing
Violence with Injury Violence >90% Standard/Very Local Media 0 Short Term 0 Issues exist 2 Yes 0 2 0.6 15.8 Standard
Violence without Injury Violence >90% Standard/Very Local Media 0 Short Term 0 Issues exist 2 Minimal lack of skills 1 3 0.6 19.8 Standard
Homicide Violence >90% Standard/Very Local Media 0 Medium Term - Internal 1 Issues exist 2 Yes 0 3 0.6 12 Standard
Domestic abuse DASV 75-85% Standard/Very National Media 2 Short Term 0 Impede management 3 Lack of skills 2 7 1 124 High
Other Sexual Offences DASV 75-85% Standard/Very National Media 2 Short Term 0 Issues exist 2 Minimal lack of skills 1 5 0.75 23.6 Standard
Rape DASV 75-85% Standard/Very National Media 2 Medium Term - Internal 1 Limited issues 1 Minimal lack of skills 1 5 0.75 78 High
Burglary Dwelling Theft >90% Standard/Very Local Media 0 Short Term 0 Impede management 3 Minimal lack of skills 1 4 0.75 37.1 Moderate
Burglary Non-Dwelling Theft >90% Standard/Very Local Media 0 Short Term 0 Issues exist 2 Minimal lack of skills 1 3 0.6 13.5 Standard
Shoplifting Theft 55-70% Standard/Very Local Media 0 Short Term 0 Impede management 3 Minimal lack of skills 1 4 0.75 17.3 Standard
Other Theft Theft >90% Standard/Very Local Media 0 Short Term 0 Issues exist 2 Yes 0 2 0.6 9.45 Standard
Vehicle Crime Theft >90% Standard/Very Local Media 0 Short Term 0 Limited issues 1 Minimal lack of skills 1 2 0.6 14.9 Standard
Robbery Theft >90% Standard/Very Local Media 0 Short Term 0 Impede management 3 Minimal lack of skills 1 4 0.75 18.3 Standard
Trafficking Drugs Drugs >90% Standard/Very Regional Media 1 Short Term 0 Impede management 3 Lack of skills 2 6 0.75 86.6 High
Possession of Drugs Drugs >90% Standard/Very Local Media 0 Short Term 0 Issues exist 2 Minimal lack of skills 1 3 0.6 51 Moderate
Criminal Damage ASB & criminal damage >90% Standard/Very Local Media 0 Short Term 0 Issues exist 2 Minimal lack of skills 1 3 0.6 17.3 Standard
Arson ASB & criminal damage >90% Standard/Very Local Media 0 Short Term 0 Issues exist 2 Minimal lack of skills 1 3 0.6 15.6 Standard
Public Order Offences ASB & criminal damage >90% Standard/Very Regional Media 1 Short Term 0 Issues exist 2 Minimal lack of skills 1 4 0.75 19.6 Standard
Possession of Weapons Other crime >90% Standard/Very Local Media 0 Short Term 0 Issues exist 2 Lack of skills 2 4 0.75 14.6 Standard
Anti-social behaviour ASB & criminal damage >90% Standard/Very National Media 2 Short Term 0 Impede management 3 Lack of skills 2 7 1 54.6 Moderate

46 Torbay Strategic Assessment 2020
Appendix B – Morile MoRiLE – Partner Engagement Sessions
Overview:
Key partners from both statutory and non-statutory agencies were consulted with in relation to the findings of the MoRilE scoring. Stakeholders were asked to provide comment on the findings and provide professional insight as to how effectively agencies are tackling crime and disorder issues and to highlight any pressures, new risks or emerging gaps. Feedback from partners was used alongside the findings of the MoRiLE assessment to provide a more holistic and enriched understanding of the challenges faced in Torbay.
Agencies involved in the consultation included: Devon & Cornwall Police, Probation Services, Drug & Alcohol Service, Children Services, Adult Safeguarding, Vulnerability and Complex Needs Team, Torbay Youth Trust, and Community Groups.
Summary:
Partners agreed with the findings of the MoRiLE scoring which identified domestic abuse, drug trafficking and rape as the areas of highest threat, risk and harm. In addition, a number of cross-cutting themes which impact on crime and reoffending were identified during the consultation.
Cross-Cutting Themes:
Substance Misuse
Mental Health
Vulnerability and Complex Needs
Exploitation
Stakeholder feedback identified the level of vulnerability and complexity presenting to police, victim and criminal justice agencies has continued to increase in Torbay. This includes a rise in individuals experiencing severe multiple disadvantage who present with a combination of needs often in relation to substance abuse, mental health or both. By virtue of their vulnerability and complexity, these individuals may present to service providers as victims, perpetrators, people at risk, or a combination of all three. Supporting these individuals can prove particularly challenging due to their often complex and inter-related needs which require specialist multi-agency support.
Addressing vulnerability, substance misuse and mental ill-health emerged as a key gold thread within discussions with partners. Many of the crime and disorder issues we see in our community have their roots in underlying issues associated to these cross-cutting themes. A clear example being the ‘toxic trio’ – a term used to describe the interconnecting issues of domestic abuse, substance misuse and mental ill-health.
Moreover, a significant proportion of people impacted by the issues outlined in this assessment have encountered adversity, trauma and challenging life experiences in childhood, adulthood, or both. These experiences make them significantly more vulnerable to become victims or perpetrators of harm, exploitation and criminality.
Emerging Issues
The number of first time entrants entering the youth justice system has increased over the last 12 months. Of particular concern is the escalating behaviour displayed by groups of young people exhibiting ‘gang’ type behaviours including carrying/using knives and weapons.

47 Torbay Strategic Assessment 2020
Individuals with co-occurring conditions are often unable to access the care they need. It is not uncommon for mental health services to exclude people because of co-occurring alcohol/drug use, a particular problem for those diagnosed with serious mental illness, who may also be excluded from substance misuse services due to the severity of their mental illness.
Substance misuse services have seen an increase in the number of referrals following the ease of lockdown restrictions in relation to alcohol use. With increasing economic instability, stakeholders raised concerns regarding an emerging new cohort of individuals developing substance dependency as a coping strategy.
Services also noted a slight change in illicit drug habits, with some known drug users moving away from opiates towards crack cocaine, as well as young people accessing a wider variety of substances.
Mental health services for both young and adult age groups were highlighted as an issue with responses often too late and only dealt with at crisis point. Increases in self-harm and hospital admissions among young people during the pandemic is of growing concern.
There are strong and prevalent links of domestic abuse in a high percentage of cases held by the probation service. Many non-related domestic abuse cases such as drink driving and acquisitive crime have inherent and underlying issues linked to domestic abuse.
Identified Gaps
A need to keep prevention and early intervention work at the heart of community safety strategy. Stakeholders raised concern at the lack of diversionary and crime prevention work, particularly with young people at risk of entering the youth justice system and/or being exploited.
The hidden nature of many high risk/harm offences such as domestic abuse, sexual violence and exploitation makes them extremely difficult for frontline professionals to identify. Confidence in reporting concerns from and by the community is a gap.
The provision of Mental Health services is vastly underfunded across the country and does not meet the needs of the growing numbers of people of varying ages needing to access mental health support, including those who are accessing other services.
The Key Challenges of Covid-19
Growing financial constraints coupled with rising demand and the increasingly complex needs of people presenting to services are creating greater resource, capacity and capability challenges.
The way partner agencies are operating in response to Covid-19 remains mixed and at times fragmented. Whilst many organisations have adapted quickly to the challenges posed by the pandemic there remain inconsistencies in relation to how services are delivered.
The wider challenges and vulnerabilities brought about by COVID-19 are increasing risk and vulnerability. These vulnerabilities are becoming fertile ground for individuals and groups looking to exploit and harm the most vulnerable in society.
The number of vulnerable children and adults will increase because of the additional pressures placed on families and communities. The coronavirus pandemic has meant that vulnerable children and adults are ‘hidden’ from vital support services.
Increased mental health and wellbeing issues among both adults and young people was highlighted as a key and growing challenge during the pandemic.