Strategic and Master Facilities Plan - Physicswilkins/osu_and_ohio/deloitte... · Strategic and...
81
Deloitte Consulting LLP Final Report to the Board of Trustees Strategic and Master Facilities Plan The Ohio State University August 28, 2007
Transcript of Strategic and Master Facilities Plan - Physicswilkins/osu_and_ohio/deloitte... · Strategic and...
Deloitte Consulting LLP
Final Report to the Board of Trustees
Strategic and Master Facilities Plan
The Ohio State University
August 28, 2007

U.S.
Con
sulti
ngR
epo
rtTe
mpl
ate
_022
307
Table of contents
Response to Key Questions 10
Benchmarking of top AMCs 25
Benchmarking of top CCCs 30
Financial risk 20
Execution risk 32
Engagement scope and approach 8
Appendices 35
Service and quality risk 23
Market and competitive risk 16
Strategic and organizational risk 13
Executive summary 3

Executive summary
- 4 - 3639
65O
hio
Stat
eU
nive
rsity
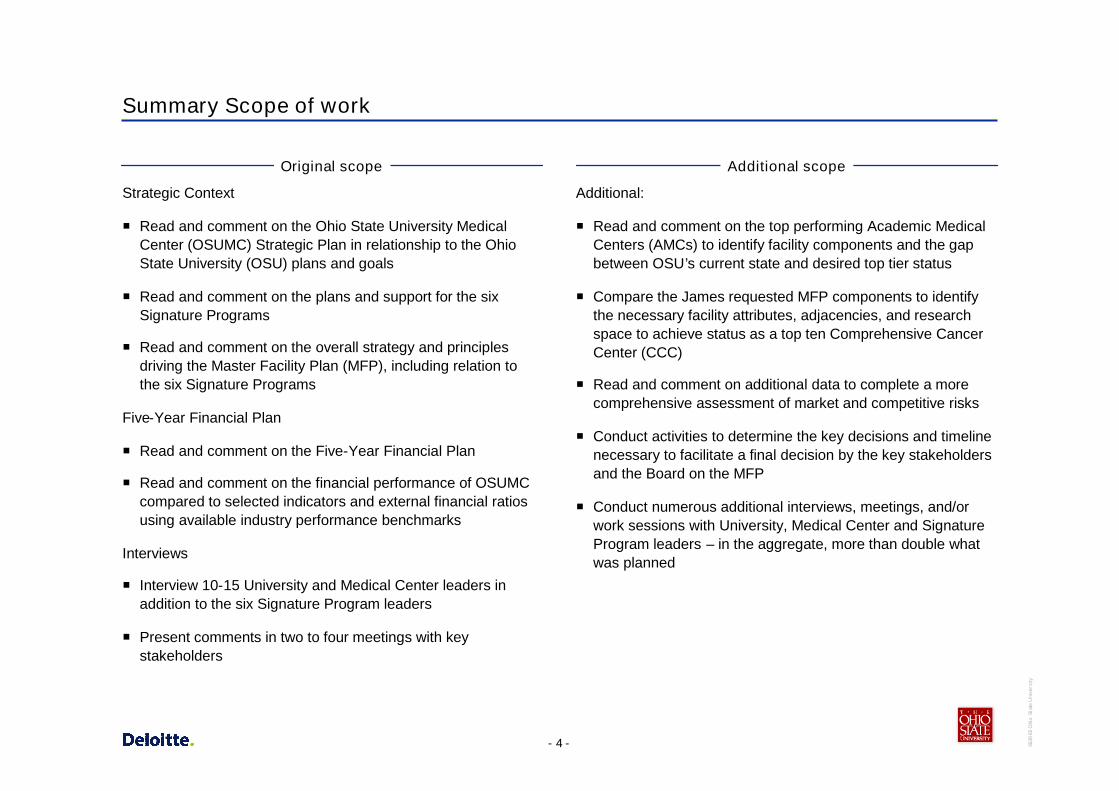
Summary Scope of work
Strategic Context
Read and comment on the Ohio State University MedicalCenter (OSUMC) Strategic Plan in relationship to the OhioState University (OSU) plans and goals
Read and comment on the plans and support for the sixSignature Programs
Read and comment on the overall strategy and principlesdriving the Master Facility Plan (MFP), including relation tothe six Signature Programs
Five-Year Financial Plan
Read and comment on the Five-Year Financial Plan
Read and comment on the financial performance of OSUMCcompared to selected indicators and external financial ratiosusing available industry performance benchmarks
Interviews
Interview 10-15 University and Medical Center leaders inaddition to the six Signature Program leaders
Present comments in two to four meetings with keystakeholders
Original scope Additional scope
Additional:
Read and comment on the top performing Academic MedicalCenters (AMCs) to identify facility components and the gapbetween OSU’s current state and desired top tier status
Compare the James requested MFP components to identifythe necessary facility attributes, adjacencies, and researchspace to achieve status as a top ten Comprehensive CancerCenter (CCC)
Read and comment on additional data to complete a morecomprehensive assessment of market and competitive risks
Conduct activities to determine the key decisions and timelinenecessary to facilitate a final decision by the key stakeholdersand the Board on the MFP
Conduct numerous additional interviews, meetings, and/orwork sessions with University, Medical Center and SignatureProgram leaders – in the aggregate, more than double whatwas planned
- 5 - 3639
65O
hio
Stat
eU
nive
rsity
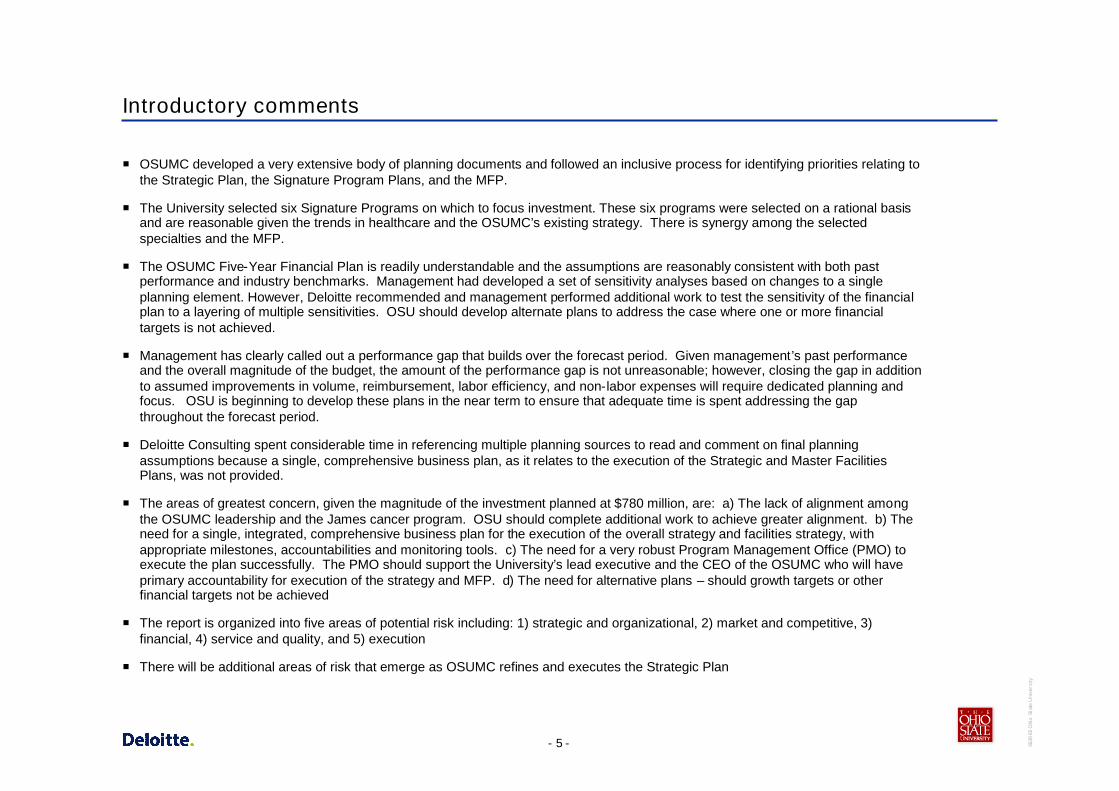
Introductory comments
OSUMC developed a very extensive body of planning documents and followed an inclusive process for identifying priorities relating tothe Strategic Plan, the Signature Program Plans, and the MFP.
The University selected six Signature Programs on which to focus investment. These six programs were selected on a rational basisand are reasonable given the trends in healthcare and the OSUMC’s existing strategy. There is synergy among the selectedspecialties and the MFP.
The OSUMC Five-Year Financial Plan is readily understandable and the assumptions are reasonably consistent with both pastperformance and industry benchmarks. Management had developed a set of sensitivity analyses based on changes to a singleplanning element. However, Deloitte recommended and management performed additional work to test the sensitivity of the financialplan to a layering of multiple sensitivities. OSU should develop alternate plans to address the case where one or more financialtargets is not achieved.
Management has clearly called out a performance gap that builds over the forecast period. Given management’s past performanceand the overall magnitude of the budget, the amount of the performance gap is not unreasonable; however, closing the gap in additionto assumed improvements in volume, reimbursement, labor efficiency, and non-labor expenses will require dedicated planning andfocus. OSU is beginning to develop these plans in the near term to ensure that adequate time is spent addressing the gapthroughout the forecast period.
Deloitte Consulting spent considerable time in referencing multiple planning sources to read and comment on final planningassumptions because a single, comprehensive business plan, as it relates to the execution of the Strategic and Master FacilitiesPlans, was not provided.
The areas of greatest concern, given the magnitude of the investment planned at $780 million, are: a) The lack of alignment amongthe OSUMC leadership and the James cancer program. OSU should complete additional work to achieve greater alignment. b) Theneed for a single, integrated, comprehensive business plan for the execution of the overall strategy and facilities strategy, withappropriate milestones, accountabilities and monitoring tools. c) The need for a very robust Program Management Office (PMO) toexecute the plan successfully. The PMO should support the University’s lead executive and the CEO of the OSUMC who will haveprimary accountability for execution of the strategy and MFP. d) The need for alternative plans – should growth targets or otherfinancial targets not be achieved
The report is organized into five areas of potential risk including: 1) strategic and organizational, 2) market and competitive, 3)financial, 4) service and quality, and 5) execution
There will be additional areas of risk that emerge as OSUMC refines and executes the Strategic Plan
- 6 - 3639
65O
hio
Stat
eU
nive
rsity
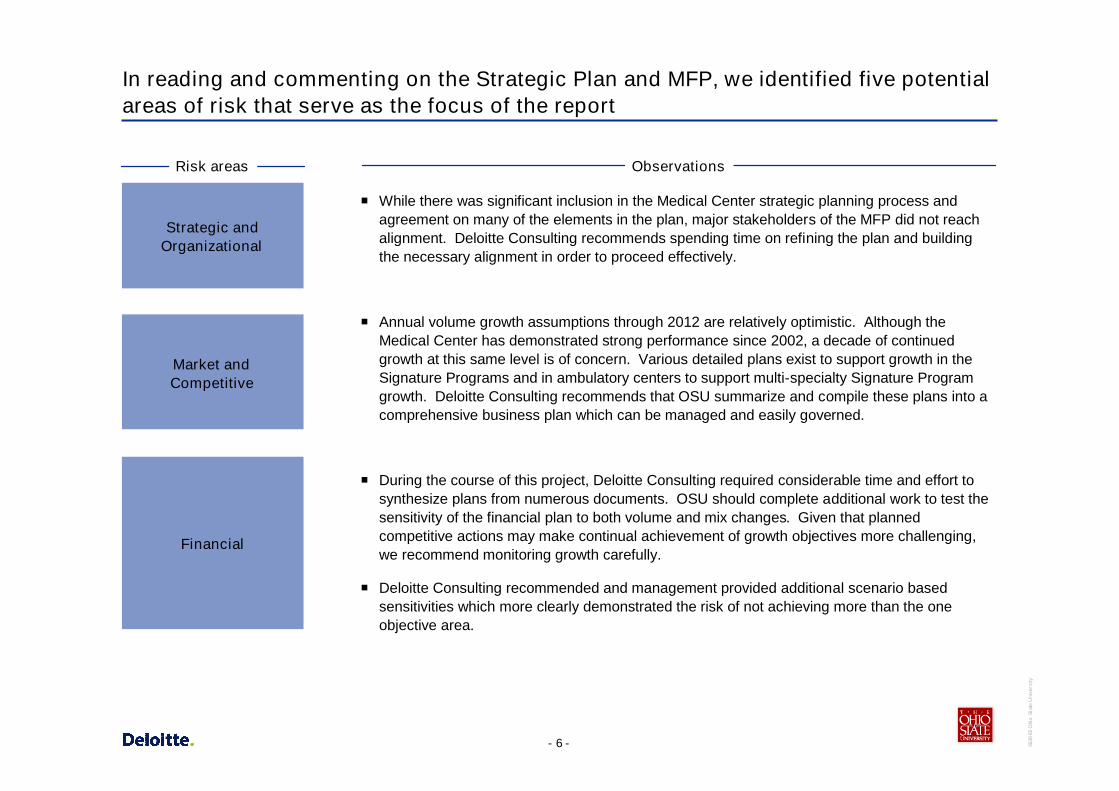
In reading and commenting on the Strategic Plan and MFP, we identified five potentialareas of risk that serve as the focus of the report
While there was significant inclusion in the Medical Center strategic planning process andagreement on many of the elements in the plan, major stakeholders of the MFP did not reachalignment. Deloitte Consulting recommends spending time on refining the plan and buildingthe necessary alignment in order to proceed effectively.
Annual volume growth assumptions through 2012 are relatively optimistic. Although theMedical Center has demonstrated strong performance since 2002, a decade of continuedgrowth at this same level is of concern. Various detailed plans exist to support growth in theSignature Programs and in ambulatory centers to support multi-specialty Signature Programgrowth. Deloitte Consulting recommends that OSU summarize and compile these plans into acomprehensive business plan which can be managed and easily governed.
During the course of this project, Deloitte Consulting required considerable time and effort tosynthesize plans from numerous documents. OSU should complete additional work to test thesensitivity of the financial plan to both volume and mix changes. Given that plannedcompetitive actions may make continual achievement of growth objectives more challenging,we recommend monitoring growth carefully.
Deloitte Consulting recommended and management provided additional scenario basedsensitivities which more clearly demonstrated the risk of not achieving more than the oneobjective area.
ObservationsRisk areas
Strategic andOrganizational
Market andCompetitive
Financial
- 7 - 3639
65O
hio
Stat
eU
nive
rsity
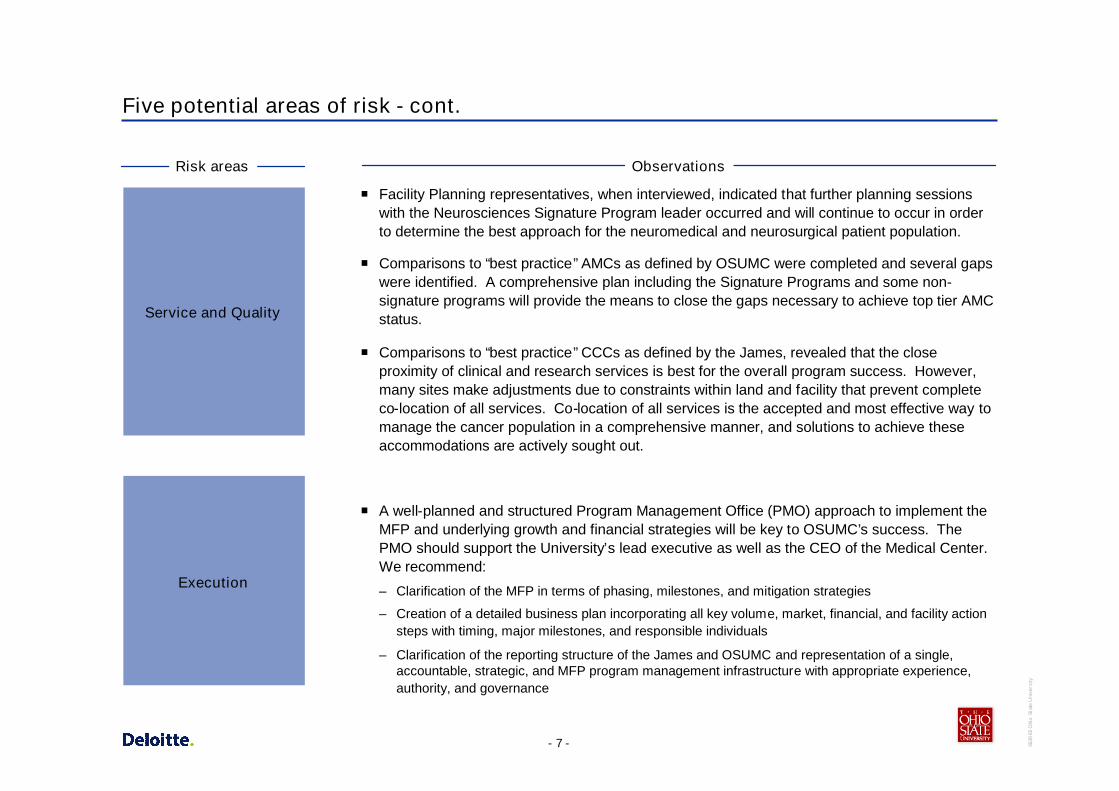
Five potential areas of risk - cont.
Facility Planning representatives, when interviewed, indicated that further planning sessionswith the Neurosciences Signature Program leader occurred and will continue to occur in orderto determine the best approach for the neuromedical and neurosurgical patient population.
Comparisons to “best practice” AMCs as defined by OSUMC were completed and several gapswere identified. A comprehensive plan including the Signature Programs and some non-signature programs will provide the means to close the gaps necessary to achieve top tier AMCstatus.
Comparisons to “best practice” CCCs as defined by the James, revealed that the closeproximity of clinical and research services is best for the overall program success. However,many sites make adjustments due to constraints within land and facility that prevent completeco-location of all services. Co-location of all services is the accepted and most effective way tomanage the cancer population in a comprehensive manner, and solutions to achieve theseaccommodations are actively sought out.
A well-planned and structured Program Management Office (PMO) approach to implement theMFP and underlying growth and financial strategies will be key to OSUMC’s success. ThePMO should support the University’s lead executive as well as the CEO of the Medical Center.We recommend:
– Clarification of the MFP in terms of phasing, milestones, and mitigation strategies
– Creation of a detailed business plan incorporating all key volume, market, financial, and facility actionsteps with timing, major milestones, and responsible individuals
– Clarification of the reporting structure of the James and OSUMC and representation of a single,accountable, strategic, and MFP program management infrastructure with appropriate experience,authority, and governance
ObservationsRisk areas
Service and Quality
Execution
Engagement scope and approach
- 9 - 3639
65O
hio
Stat
eU
nive
rsity
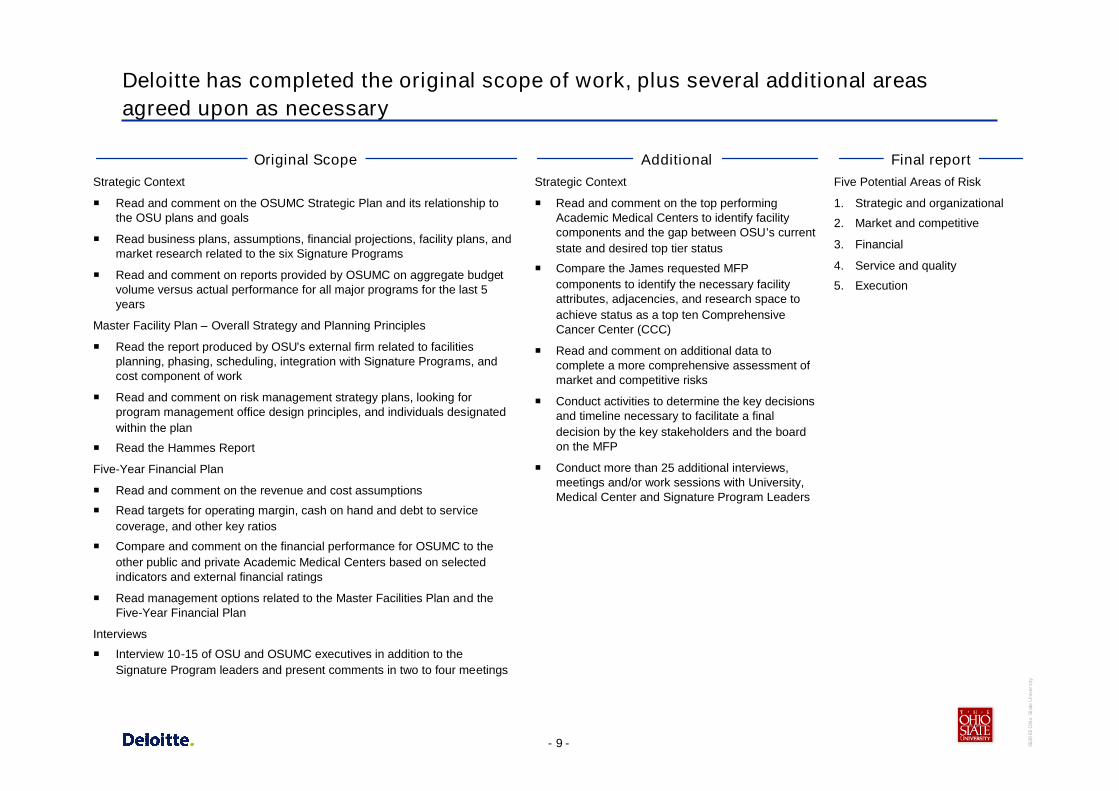
Deloitte has completed the original scope of work, plus several additional areasagreed upon as necessary
Additional Final reportOriginal ScopeFive Potential Areas of Risk
1. Strategic and organizational
2. Market and competitive
3. Financial
4. Service and quality
5. Execution
Strategic Context
Read and comment on the top performingAcademic Medical Centers to identify facilitycomponents and the gap between OSU’s currentstate and desired top tier status
Compare the James requested MFPcomponents to identify the necessary facilityattributes, adjacencies, and research space toachieve status as a top ten ComprehensiveCancer Center (CCC)
Read and comment on additional data tocomplete a more comprehensive assessment ofmarket and competitive risks
Conduct activities to determine the key decisionsand timeline necessary to facilitate a finaldecision by the key stakeholders and the boardon the MFP
Conduct more than 25 additional interviews,meetings and/or work sessions with University,Medical Center and Signature Program Leaders
Strategic Context
Read and comment on the OSUMC Strategic Plan and its relationship tothe OSU plans and goals
Read business plans, assumptions, financial projections, facility plans, andmarket research related to the six Signature Programs
Read and comment on reports provided by OSUMC on aggregate budgetvolume versus actual performance for all major programs for the last 5years
Master Facility Plan – Overall Strategy and Planning Principles
Read the report produced by OSU’s external firm related to facilitiesplanning, phasing, scheduling, integration with Signature Programs, andcost component of work
Read and comment on risk management strategy plans, looking forprogram management office design principles, and individuals designatedwithin the plan
Read the Hammes Report
Five-Year Financial Plan
Read and comment on the revenue and cost assumptions
Read targets for operating margin, cash on hand and debt to servicecoverage, and other key ratios
Compare and comment on the financial performance for OSUMC to theother public and private Academic Medical Centers based on selectedindicators and external financial ratings
Read management options related to the Master Facilities Plan and theFive-Year Financial Plan
Interviews
Interview 10-15 of OSU and OSUMC executives in addition to theSignature Program leaders and present comments in two to four meetings
- 10 - 3639
65O
hio
Stat
eU
nive
rsity
Response to Key Questions

- 11 - 3639
65O
hio
Stat
eU
nive
rsity
Deloitte has compiled responses to key questions posed by OSU leadership,additional detail to support these responses can be found throughout the report
Regarding the Strategic Context:
What is the basis for having six signature programs and is this number appropriate?
The University selected six Signature Programs on which to focus investment. These six programs were selected through a thoughtful and inclusive strategic planningprocess. They appear to build upon the existing strengths of the medical center and are reasonably consistent with national trends. Further, there is synergy among theselected specialties and the MFP in terms of tactics, recruitment, and facility space.
Has the strategic planning process been inclusive of all key medical center and business unit leaders/personnel?
While there was significant inclusion in the Medical Center strategic planning process and agreement on many of the elements in the plan, major stakeholders of the MFP didnot reach alignment. Deloitte Consulting recommends spending time on refining the plan and building the necessary alignment in order to proceed effectively.
Regarding the Five-Year Financial Plan:
How has the health system performed financially over the last five years and how does that compare to appropriate benchmarkinstitutions?
Based on financial statements and planning documents provided by OSUMC, the Medical Center appears to have performed well since 2003, with revenues outpacingexpenses. Specifically, net revenues per adjusted admission grew 5.7% annually over the same time period. Cash and equivalents have increased by $47.5M since 2003with a slight decline in 2005 when the Ross Heart Hospital opened.
In comparison to medians for Moody's AA rated non profit hospitals, OSUMC performs better than median on net revenue, operating income, and total income (includinginvestment income). OSUMC performs worse than the median on cash; however, the lower cash reserves do not currently appear to be a concern to the rating agenciesgiven OSU's overall strong cash position.
How do the financial ratios (margin, cash, debt service coverage) compare with the appropriate benchmarks? How can we be surewe're comparing apples to apples?
OSUMC performs well against Moody’s AA benchmarks for debt service coverage and debt to capitalization in addition to margin as stated above. Once the MFP is fullyimplemented and debt is issued, OSUMC will slip behind Moody’s benchmarks on both debt service coverage and debt to capitalization. Operating income will continue tooutperform benchmarks.
During the engagement, Deloitte Consulting referenced the Moody's AA Medians for non profit hospitals. This is a widely utilized and respected set of benchmark standards.In reviewing the Five Year Financial Plan, the Finance department at OSUMC utilized these same benchmarks. The detailed report demonstrates that neither A nor AAbenchmarks for cash reserves are attained individually by the Medical Center during the planning period.
Some concern was expressed by the cancer center and university leadership that the financial analyses prepared by the medical center used a different methodology tocalculate certain statistics. There appears to be a lack of clarity among leaders as to how various financial metrics are calculated. These definitions should be clarified byfinancial leadership so that all parties understand and agree upon the validity of the approach.
- 12 - 3639
65O
hio
Stat
eU
nive
rsity
Key Question Responses (cont.)
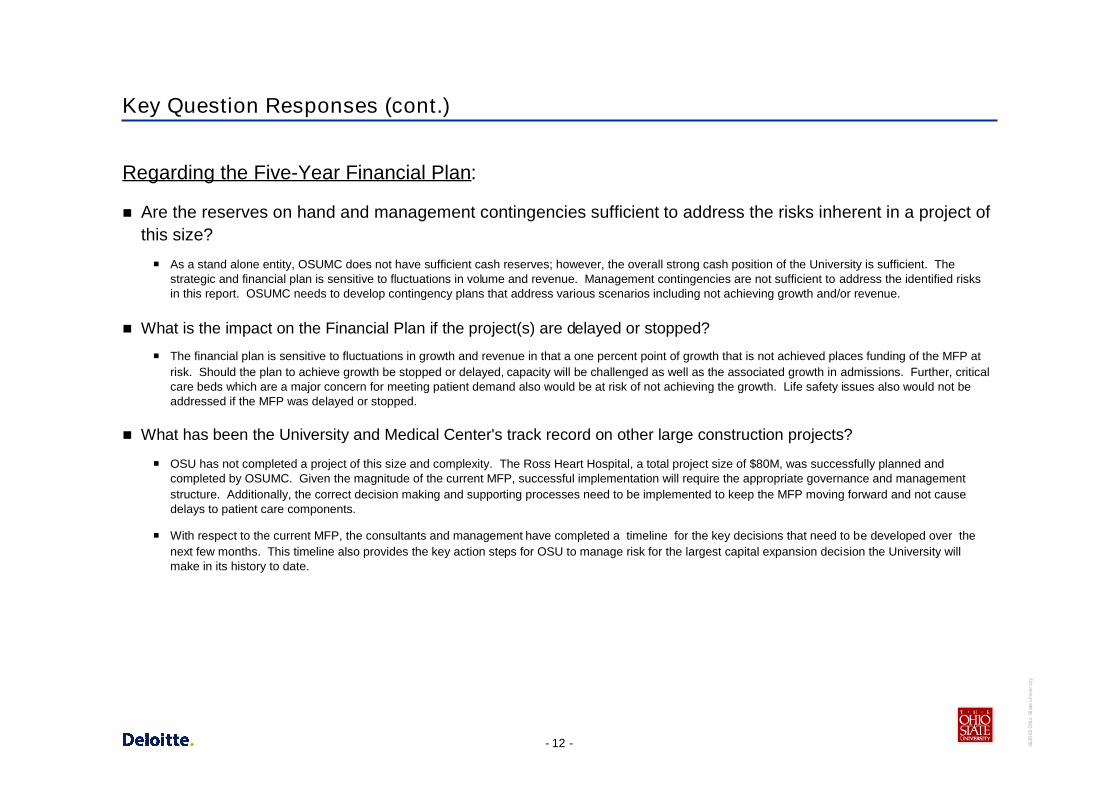
Regarding the Five-Year Financial Plan:
Are the reserves on hand and management contingencies sufficient to address the risks inherent in a project ofthis size?
As a stand alone entity, OSUMC does not have sufficient cash reserves; however, the overall strong cash position of the University is sufficient. Thestrategic and financial plan is sensitive to fluctuations in volume and revenue. Management contingencies are not sufficient to address the identified risksin this report. OSUMC needs to develop contingency plans that address various scenarios including not achieving growth and/or revenue.
What is the impact on the Financial Plan if the project(s) are delayed or stopped?
The financial plan is sensitive to fluctuations in growth and revenue in that a one percent point of growth that is not achieved places funding of the MFP atrisk. Should the plan to achieve growth be stopped or delayed, capacity will be challenged as well as the associated growth in admissions. Further, criticalcare beds which are a major concern for meeting patient demand also would be at risk of not achieving the growth. Life safety issues also would not beaddressed if the MFP was delayed or stopped.
What has been the University and Medical Center's track record on other large construction projects?
OSU has not completed a project of this size and complexity. The Ross Heart Hospital, a total project size of $80M, was successfully planned andcompleted by OSUMC. Given the magnitude of the current MFP, successful implementation will require the appropriate governance and managementstructure. Additionally, the correct decision making and supporting processes need to be implemented to keep the MFP moving forward and not causedelays to patient care components.
With respect to the current MFP, the consultants and management have completed a timeline for the key decisions that need to be developed over thenext few months. This timeline also provides the key action steps for OSU to manage risk for the largest capital expansion decision the University willmake in its history to date.

Strategic and organizational risk

- 14 - 3639
65O
hio
Stat
eU
nive
rsity
Due to the lack of organizational alignment on the MFP, a set of key decisions and atimeline was developed to facilitate refinements to the plan over the next few months
OSUMC developed detailed strategic plans for each of the SignaturePrograms, with specific strategies, tactics, action steps and benchmarks.
OSUMC created an inclusive process for the development of the MedicalCenter Strategic Plan and process. Agreement occurred on many of theelements of the plan, however, the Medical Center and the James are not inalignment with respect to the Master Facilities Plan (MFP).
Cancer program leadership does not believe the current plan will allow it toattract the researchers needed to achieve its goal of NCI Top 10designation based on volume of research grants. They do not believe thespace planned for research or research offices is adequate (see appendixfor comparison of plans).
Several University leaders cited the dissatisfaction of potential donors withthe cancer component of the MFP.
The facility, as planned, is under review to determine if it meets CMS PPSrequirements.
Cancer and Neuro Signature Program Leaders believe the plans for patientcare delivery do not address the need for convenient as well as “bestpractice” treatment spaces for patients and physicians.
Not all University leaders are in alignment as to whether the MFPcomponent of the Strategic Plan is too skewed toward expanding patientcare as opposed to meeting the University’s goals of excellence in researchand education.
Strategic and organizational observations Implications for strategy
For comparative purposes, Deloitte Consulting studied top tier AMC’s forranked clinical programs, financial performance, research funding, andother available characteristics.
While it would be ideal for all inpatient, outpatient, and research spaces tobe co-located, the review of top ten CCCs revealed that other organizationsprovide care and recruit physician scientists and researchers withoutcompletely co-located facilities. It is important to note that these top CCCsmay do more with less because of their existing superior reputations. Thisrisk may be reduced by creating a revised plan that will attract patients,faculty, researchers, and potential donors.
A summary of the key decisions and timeline was created to facilitate arefined MFP regarding the Cancer Signature Program and other SignaturePrograms to create greater alignment.
OSU is already implementing a plan to reduce the risk of loss of PPSdesignation. This will be important in achieving the financial targets in theLong Range Financial Plan.
Sufficient dissent and concern exists over the changes to the CCC plan and the potentialimpact on donors, research funding, and improvements to patient care quality. Deloitte
Consulting recommends that Executive Management spend time on refining the plan andbuilding alignment in order to proceed effectively. Deloitte Consulting, Hammes, and OSU
leadership have developed a process to refine the MFP and identified key decisions to be madeby leadership for implementation in the coming months.

- 15 - 3639
65O
hio
Stat
eU
nive
rsity
The timeline provides the key action steps for OSU to achieve greater alignment forthe largest capital expansion decision the University will make in its history
5. MFP Cost andTimelineSign-off
5. MFP Cost andTimelineSign-off
1. New OrganizationDesign
1. New OrganizationDesign
4. ProposedNew MFP
4. ProposedNew MFP
3. CriticalAttributes
of the New MFP
3. CriticalAttributes
of the New MFP
2. Fact Base forRevising the MFP2. Fact Base forRevising the MFP
Reporting structure, authority,and accountability
– Appointment of decisionmaker
Process for refining the MFP
Management ground rules forrefinements to the MFP
Compliance with PPSexemption for the James
Capital expansion fundingstructure and levels for theJames and the remainingbusiness entities of theMedical Center
Required elements forachieving status as a toptier Academic MedicalCenter (AMC)
Required elements forachieving status as a toptier ComprehensiveCancer Center (CCC)
• Set of growthassumptions for inpatientand outpatient to meetminimum competitivethresholds
• Basic renovation requiredto meet the health andsafety regulations
• Set of financial targetsincluding operationalperformance, keyfinancial ratios, andphilanthropy goals
• Schedule of expendituresand commitments to dateapplicable to the $780Mceiling
Facility priorities withinthe MFP
Capital expenditures forrefinements to theJames, the core facilities,and the supportingstructures (e.g., parking,grounds, etc)
Key adjacencies andpoints of integration forthe six signatureprograms andancillary/support services
Clear definition ofcomponents in phasesone and two includingtimeline, budget andfunding mechanisms
Set of facility optionsincluding the costs,benefits, andimplications to eachoption
Facilitated process toselect the preferredalternative for the newMFP
Required phasing forthe new MFP andtimeline with thefollowing:
– Key milestones
– Break points
• Revised growth,financial, andphilanthropic targets forboth the first phase andfuture second phase
Month 1 TBDMonths 2 - 3 Months 4 - 5
Revised constructionproject managementstructure, authority andaccountability
Implementation plan forcontingency andallowance management
• Approval to begindetailed planning phaseon the new MFP
Key Dates
5. MFP Cost andTimelineSign-off
5. MFP Cost andTimelineSign-off
1. New OrganizationDesign
1. New OrganizationDesign
4. ProposedNew MFP
4. ProposedNew MFP
3. CriticalAttributes
of the New MFP
3. CriticalAttributes
of the New MFP
2. Fact Base forRevising the MFP2. Fact Base forRevising the MFP
Reporting structure, authority,and accountability
– Appointment of decisionmaker
Process for refining the MFP
Management ground rules forrefinements to the MFP
Compliance with PPSexemption for the James
Capital expansion fundingstructure and levels for theJames and the remainingbusiness entities of theMedical Center
Required elements forachieving status as a toptier Academic MedicalCenter (AMC)
Required elements forachieving status as a toptier ComprehensiveCancer Center (CCC)
• Set of growthassumptions for inpatientand outpatient to meetminimum competitivethresholds
• Basic renovation requiredto meet the health andsafety regulations
• Set of financial targetsincluding operationalperformance, keyfinancial ratios, andphilanthropy goals
• Schedule of expendituresand commitments to dateapplicable to the $780Mceiling
Facility priorities withinthe MFP
Capital expenditures forrefinements to theJames, the core facilities,and the supportingstructures (e.g., parking,grounds, etc)
Key adjacencies andpoints of integration forthe six signatureprograms andancillary/support services
Clear definition ofcomponents in phasesone and two includingtimeline, budget andfunding mechanisms
Set of facility optionsincluding the costs,benefits, andimplications to eachoption
Facilitated process toselect the preferredalternative for the newMFP
Required phasing forthe new MFP andtimeline with thefollowing:
– Key milestones
– Break points
• Revised growth,financial, andphilanthropic targets forboth the first phase andfuture second phase
Month 1 TBDMonths 2 - 3 Months 4 - 5
Revised constructionproject managementstructure, authority andaccountability
Implementation plan forcontingency andallowance management
• Approval to begindetailed planning phaseon the new MFP
Key Dates
Exhibit 1: Key Decision Timeline for Refinement to the Master Facilities Plan

Market and competitive risk
- 17 - 3639
65O
hio
Stat
eU
nive
rsity
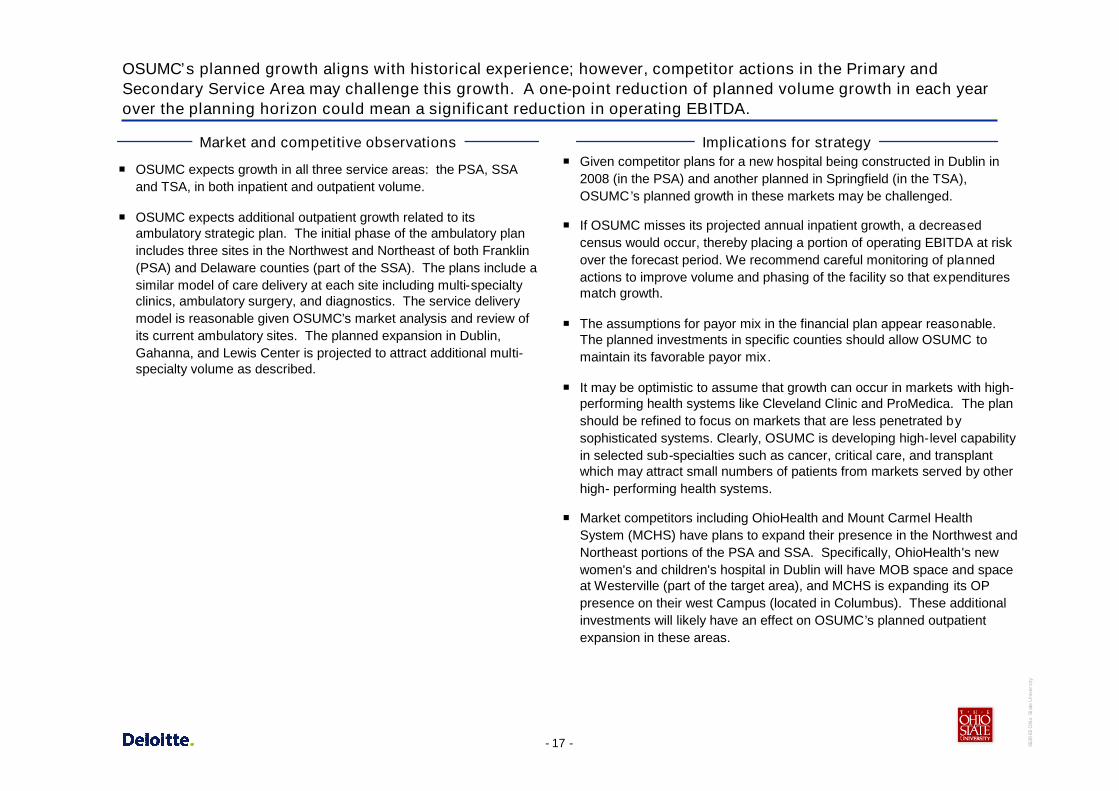
OSUMC’s planned growth aligns with historical experience; however, competitor actions in the Primary andSecondary Service Area may challenge this growth. A one-point reduction of planned volume growth in each yearover the planning horizon could mean a significant reduction in operating EBITDA.
OSUMC expects growth in all three service areas: the PSA, SSAand TSA, in both inpatient and outpatient volume.
OSUMC expects additional outpatient growth related to itsambulatory strategic plan. The initial phase of the ambulatory planincludes three sites in the Northwest and Northeast of both Franklin(PSA) and Delaware counties (part of the SSA). The plans include asimilar model of care delivery at each site including multi-specialtyclinics, ambulatory surgery, and diagnostics. The service deliverymodel is reasonable given OSUMC’s market analysis and review ofits current ambulatory sites. The planned expansion in Dublin,Gahanna, and Lewis Center is projected to attract additional multi-specialty volume as described.
Market and competitive observations Implications for strategy Given competitor plans for a new hospital being constructed in Dublin in
2008 (in the PSA) and another planned in Springfield (in the TSA),OSUMC’s planned growth in these markets may be challenged.
If OSUMC misses its projected annual inpatient growth, a decreasedcensus would occur, thereby placing a portion of operating EBITDA at riskover the forecast period. We recommend careful monitoring of plannedactions to improve volume and phasing of the facility so that expendituresmatch growth.
The assumptions for payor mix in the financial plan appear reasonable.The planned investments in specific counties should allow OSUMC tomaintain its favorable payor mix .
It may be optimistic to assume that growth can occur in markets with high-performing health systems like Cleveland Clinic and ProMedica. The planshould be refined to focus on markets that are less penetrated bysophisticated systems. Clearly, OSUMC is developing high-level capabilityin selected sub-specialties such as cancer, critical care, and transplantwhich may attract small numbers of patients from markets served by otherhigh- performing health systems.
Market competitors including OhioHealth and Mount Carmel HealthSystem (MCHS) have plans to expand their presence in the Northwest andNortheast portions of the PSA and SSA. Specifically, OhioHealth's newwomen's and children's hospital in Dublin will have MOB space and spaceat Westerville (part of the target area), and MCHS is expanding its OPpresence on their west Campus (located in Columbus). These additionalinvestments will likely have an effect on OSUMC’s planned outpatientexpansion in these areas.

- 18 - 3639
65O
hio
Stat
eU
nive
rsity
Several competing hospitals in the market today serve 80% of the PSA and SSA patients with anew OhioHealth hospital planned in Dublin. A new hospital, planned in Springfield (part of theTSA), is the result of a merger between Mercy and Community Hospital
Memorial Hospital ofUnion County
Madison County Hospital
Doctor’s Hospital West
Grady Memorial Hospital Mt. Carmel St. Ann’s
Riverside Methodist
Licking MemorialHospital
Mt. Carmel East
New Albany SurgicalHospital
Fairfield Medical Center
Berger Health System
OSU Medical Center
Mt. Carmel West
Grant Medical Center
Children’s Hospital
University HospitalEast
Red = Key competitors within primary market areaBlue = Competitors outside the primary market area
New OhioHealth women’s and children’s hospital in DublinNew hospital planned Springfield, OH
Exhibit 2: Competitor hospitals in the primary and secondary service areas

- 19 - 3639
65O
hio
Stat
eU
nive
rsity
OSUMC developed the Signature Program Plans in great detail; however, it is unclearwhich tactics and what capital will be spent to support growth of the remaining non-Signature Program volume
The Signature Plans, Space Plans, and the Long Range FinancialPlan each have different definitions for expected growth whichmakes comparison of these plans difficult. The Space Plan and LongRange Financial Plan are more conservative than the SignaturePlans due to capacity, bonding and other financial constraints.
OSUMC developed detailed strategic plans and tactics for theSignature Programs, business units, and ambulatory services.
The Signature Programs including cancer, heart, neurosciences, andtransplant comprise approximately 42% of the total inpatient volumeand have grown 36% from 2002 to 2006 while non-SignaturePrograms have grown 12% over the same time frame.
Since 2003, OSUMC has outpaced the market in inpatientdischarges leading to additional market capture in each SignatureProgram. OSUMC expects the Signature Programs to grow in allthree markets.
For the Heart Signature Program, OSUMC is in the top 10 in thestate of Ohio behind OhioHealth, Cleveland Clinic, MCHS and otherCleveland area hospitals. Large health systems including ClevelandClinic have had strong growth historically.
Critical care beds today account for 11.6% of the total acute carebeds; however, OSUMC is very challenged to find adequate spacefor these patients requiring intensive level care. OSUMC is planningto increase critical care space, and improve capacity for this patientpopulation.
We recommend that OSUMC utilize a common definition forprojecting volume so that interpretation of plans, priorities, andmetrics is standardized.
Further, we recommend that OSUMC Planning develop acomprehensive business plan that combines the Signature Plans,ambulatory plans, and facilities plans into a single document.
Although the Signature Programs have growth plans and tactics, thenon-Signature Programs do not have clearly defined tactics andcapital plans to address growth assumptions. Deloitte Consultingrecommends that OSUMC define these tactics and plans toaccomplish the growth.
Competitive forces will continue for each Signature Program, but willbe particularly strong in the tertiary market for Heart, where OSUMCis ranked 26th. Strong physician recruitment efforts are required toattract the projected volume.
Interviews with Critical Care leaders revealed that regional providersalso are capacity constrained by the limited ICU space. OSUMC willhave an opportunity to create a competitive advantage once theadditional critical care capacity is built. The added capacity mayallow OSUMC to meet patient demand as well as recover thereferral base it has lost due to the current constraints.
More detailed plans need to be developed to support the non-Signature Program growth.

Financial risk
- 21 - 3639
65O
hio
Stat
eU
nive
rsity
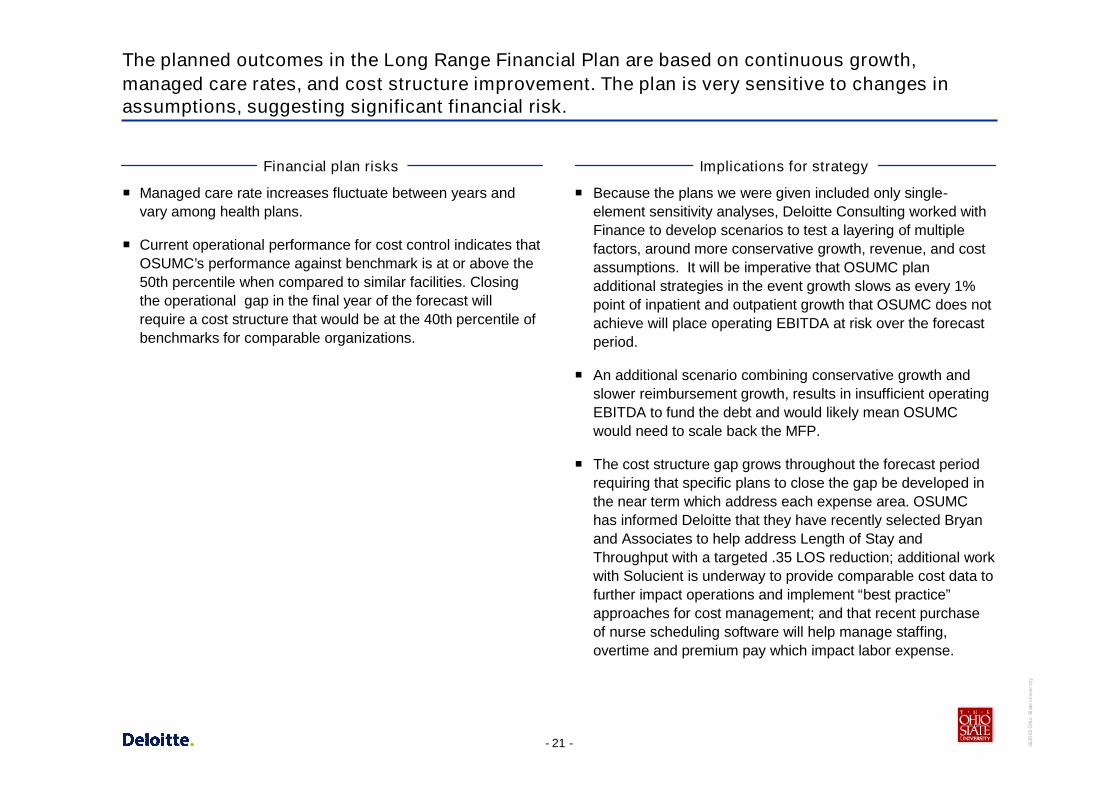
The planned outcomes in the Long Range Financial Plan are based on continuous growth,managed care rates, and cost structure improvement. The plan is very sensitive to changes inassumptions, suggesting significant financial risk.
Managed care rate increases fluctuate between years andvary among health plans.
Current operational performance for cost control indicates thatOSUMC’s performance against benchmark is at or above the50th percentile when compared to similar facilities. Closingthe operational gap in the final year of the forecast willrequire a cost structure that would be at the 40th percentile ofbenchmarks for comparable organizations.
Financial plan risks
Because the plans we were given included only single-element sensitivity analyses, Deloitte Consulting worked withFinance to develop scenarios to test a layering of multiplefactors, around more conservative growth, revenue, and costassumptions. It will be imperative that OSUMC planadditional strategies in the event growth slows as every 1%point of inpatient and outpatient growth that OSUMC does notachieve will place operating EBITDA at risk over the forecastperiod.
An additional scenario combining conservative growth andslower reimbursement growth, results in insufficient operatingEBITDA to fund the debt and would likely mean OSUMCwould need to scale back the MFP.
The cost structure gap grows throughout the forecast periodrequiring that specific plans to close the gap be developed inthe near term which address each expense area. OSUMChas informed Deloitte that they have recently selected Bryanand Associates to help address Length of Stay andThroughput with a targeted .35 LOS reduction; additional workwith Solucient is underway to provide comparable cost data tofurther impact operations and implement “best practice”approaches for cost management; and that recent purchaseof nurse scheduling software will help manage staffing,overtime and premium pay which impact labor expense.
Implications for strategy

Service and quality risk

- 23 - 3639
65O
hio
Stat
eU
nive
rsity
Service and quality risk
As previously indicated, both Cancer and Neuro ProgramLeaders cited concern with care convenience and qualitygiven the current facilities plan.
One of OSUMC‘s stated strategic objectives is to achieve toptier status as a nationally recognized AMC (using nationallyaccepted practices to determine their ranking). Whencomparing OSUMC to top AMCs nationally on reputation,opportunity exists to close the gap on multiple measurementcriteria necessary to move them into top tier.
OSUMC has demonstrated that significant research occurredto assess the gap areas necessary to achieve status as a toptier AMC. Current gaps exist within each of the three missionareas—education, research and clinical services.
Service and quality observations
OSUMC is investing in the six Signature Programs whichshould yield services that are convenient and accessible toboth patients and physicians.
The U.S. News and World Report characteristics, such asmedical school and specialty program ranks lag behind toptier AMCs nationally. During interviews, OSUMC leadershipand Signature Program Leaders articulated specific strategiesrequired to take the Medical Center to a higher ranking in botheducation and clinical services nationally. These strategiesare included in the Signature Program Plans as well asoverall plans for University advancement of faculty to studentratio, increased student GPA, and MCAT scores amongothers.
An additional research characteristic of top tier AMCs is thetotal amount of NIH awarded grants. OSUMC and itsrespective entities need to significantly increase the amount ofNIH awards. To accomplish this goal, OSUMC will requirethe appropriate mix of funded faculty/faculty researchers.
Implications for strategy

- 24 - 3639
65O
hio
Stat
eU
nive
rsity
Service and quality risk – cont.
The James believes it is advantageous to co-locate all or asignificant majority of clinical services and research spaceincluding offices within the new planned facility. Currently, aspreviously discussed, there is a lack of alignment between theJames and OSUMC on the MFP.
The top CCCs nationally have a variety of spaceconfigurations. In many cases, the inpatient and outpatientservices were not co-located.
Service and quality observations
While OSUMC is considering the steps necessary to achievealignment between the James and the Medical Centerleadership on the MFP, the current facility design is similar tomany of the top CCCs nationally, and there may beappropriate elements of the current plan that could beimplemented to allow the Cancer Signature Program to stillachieve its top ten status.
Research of top ranked CCCs found that patient care is bestprovided when clinical services and supporting activities suchas research are co-located with the main center of care.However, CCCs commented that due to land and currentfacility constraints, many times compromises were reachedand services did not suffer. The James and the MedicalCenter are in a unique position to achieve, through alignment,agreement on the most advantageous MFP.
Other PPS-exempt CCCs have demonstrated success inremaining a Comprehensive Cancer Center even withservices that were not co-located for the reasons statedabove. Working to ensure that transportation for the cancerpatient population appears seamless to the patient andfamilies, as well as ensuring that consistent branding isevident among services that are not co-located within themain facility, is imperative in order to retain CCC designation.
Implications for strategy
It is warranted to continue studying the above facility concerns in relationship to “bestpractices” in order to achieve alignment prior to implementing the MFP.

Benchmarking of top AMCs
- 26 - 3639
65O
hio
Stat
eU
nive
rsity
The OSU Academic Plan, released in October 2000, stated the University’s 10-yearvision which chartered the course for the Medical Center
The vision as published:
– “To be among the world’s truly great universities – advancing thewell-being of the people of Ohio and the global communitythrough the creation and dissemination of knowledge.”
One of the stated keys to reaching the above goal isachieving top tier Academic Medical Center status.
A variety of nationally-accepted practices exist to determinerankings such as:
– U.S. News and World Report Characteristics• Current programs which achieve top rankings (16 programs
able to be ranked in 2006)• Medical School Rankings – which include Peer and Resident
Assessment, undergrad GPA, average MCAT score,acceptance rate, NIH research grants, and faculty to studentratios
The OSUMC conducted research to determine which topmedical schools on the U.S. News & World Report should setthe standard for top achievement and have developed plansfor each Signature Program that will assist in closing theidentified gaps to top tier status.

- 27 - 3639
65O
hio
Stat
eU
nive
rsity
The OSUMC currently ranks as 31 by U.S. News & World Report on the Top MedicalSchools with Research based programs using 2006 data
23Emory University
10University of Michigan – Ann Arbor
15University of Pittsburgh
18Vanderbilt University
27University of Alabama – Birmingham
3University of Pennsylvania
5University of California – San Francisco
6University of Washington
8Duke University
1Harvard University (MA)
2Johns Hopkins University (MD)
27University of Wisconsin – Madison
31Ohio State University
Academic Medical Center Current U.S. News & World Report Ranking
Exhibit 6: Medical School Rankings for AMCs
Source: List of top Academic Medical Centers was compiled using the 2006 best practice study of Academic Medical Centers completed by the planning department of OSUMC. The criteria forselecting these organizations was based on OSUMC’s scorecard benchmark list, the OSUMC leadership survey, the USN & WR Best Medical Schools top 30, USN & WR Best Hospitals (ranked in atleast 7 specialties), and the NIH top 30.

- 28 - 3639
65O
hio
Stat
eU
nive
rsity
Based upon the selected comparison group, OSUMC will need to focus on thefollowing gaps relating to education to achieve top tier Academic Medical Centerstatus
The above data represents actual average scores amongst the selected comparison group and indicates that OSU and OSUMChave opportunities in terms of enhancing reputation-based scoring, improving the overall accepted medical students based ontighter GPA requirements and improved MCAT scores, as well as achieving additional awarded NIH Research Grants.
During interviews, leadership articulated plans that would assist in closing the above gaps. These tactics, found within the SignatureProgram Plans, call for the hiring of additional faculty and faculty / researchers to assist in closing the gap on awarded NIH grants.
$174.2
.25
.02
.70
.90
Current Gap to AchieveMid Point
$224.4
10.8
3.72
3.5
3.3
OSU &OSUMC Ranking
3.74’06 Average Undergrad GPA
11.05’06 Average MCAT Score
$398.6’06 NIH Research grants (in millions)
4.2Peer Assessment Score
4.2Assessment Score by Residency Directors
Gap Criteria (not all inclusive)Average of Selected Peer
Grouping
Exhibit 7: Criteria and Gaps for Medical School Ranking
Source: List of top Academic Medical Centers was compiled using the 2006 best practice study of Academic Medical Centers completed by the planning department of OSUMC. The criteria forselecting these organizations was based on OSUMC’s scorecard benchmark list, the OSUMC leadership survey, the USN & WR Best Medical Schools top 30, 2006 results, USN & WR Best Hospitals(ranked in at least 7 specialties), and the NIH top 30.

- 29 - 3639
65O
hio
Stat
eU
nive
rsity
In addition, OSUMC’s gap relating to the number of Specialty Rankings within thecomparison group provides further basis for ongoing program development andinvestment
The average of the compare group for Specialty Rankings is 11 – 12 areas, out of a possible 16 Specialty Rankings for 2006
Currently, OSUMC is specialty ranked in 9 areas (Cancer, ENT, Endo, Gyn, Kidney Disease, Neuro, Ortho, Respiratory Diseaseand Rehab)
13Harvard University (MA)
7University of Alabama – Birmingham
8Emory University
9Ohio State University
12University of Pittsburgh
15University of California – San Francisco
15Duke University
16University of Michigan – Ann Arbor
16Johns Hopkins University (MD)
7Vanderbilt University
15University of Pennsylvania
12University of Washington
4University of Wisconsin – Madison
Academic Medical Center Current U.S. News & World Report Ranking
Exhibit 8: U.S. News and World Report Best Hospital Ranking

Benchmarking of top CCCs

- 31 - 3639
65O
hio
Stat
eU
nive
rsity
Among the top Comprehensive Cancer Centers, there is wide variation in theproximity of inpatient, outpatient, and research accommodations
Source: Key Information acquired through interviews conducted with Top CCCs from 05/25/07 – 06/01/07
The majority of Comprehensive Cancer Centers (CCCs):
– Deliver cancer care in multiple buildings
– Deliver outpatient care both in the CCC and in other buildingseither in the vicinity of the CCC or within the region
– Provide radiological services within the CCC or within the vicinityof the CCC, or both locations
– Locate physician / researcher’s offices either within the CCC oracross the street / within walking distance
– Place radiation oncologists on the same floor / near equipment
– Claim that neither patients nor staff have concerns with cancercare being delivered in multiple buildings
– Offer walkways / tunnels for easy access among buildings
– Provide shuttles for patients, families, physicians and staff fortransportation among buildings• Transportation provided to buildings separate from the CCC
that may be dedicated to outpatient care, radiologicalservices, inpatient services, research, etc.
– Offer parking garages that are adjacent to or across the streetfrom the CCC with transit services between the parking structureand the CCC
Only 1 of the 12 interviewed CCCs houses all of its cancercare services in one building
Of those CCCs that are considered “a hospital within ahospital,” most adjacencies are vertical in nature

Execution risk

- 33 - 3639
65O
hio
Stat
eU
nive
rsity
Execution risk
Given the magnitude of the concerns raised by the CancerLeadership and Cancer Signature Program, and the related potentialimpact on financial results to overall University fundraising, the riskof implementing the current plan is greater than the risk of delayingimplementation to address potential plan modifications to buildalignment.
A structure for governance and management of the construction ofthe MFP, as well as the contingency assumptions and plans, hasbeen developed. The structure in place is consistent with staterequirements.
OSU is in the process of modifying decision making authoritiesamong the James and Medical Center leadership.
The MFP is the largest project in University history, and DeloitteConsulting was told in interviews that the University has experiencedcost overruns on a few major capital expenditures, most recentlyprojects that have been expedited. Some additional rigor has beenadded to the project management process.
Organizational dynamics
Not having alignment among the major constituencies places a highlevel of risk on executing the plan.
It is important to have milestones and checkpoints so thatmodifications can be made, as appropriate, for the implementation ofthe MFP.
Governance and management of the implementation of the MFP willbe more complex given the new organizational design. DeloitteConsulting recommends developing a detailed business plan withthe following elements: Governance, Facilities Plan with milestonesand mitigation strategies, and an Execution Plan with growth andfinancial targets
Implications for strategy
- 34 - 3639
65O
hio
Stat
eU
nive
rsity
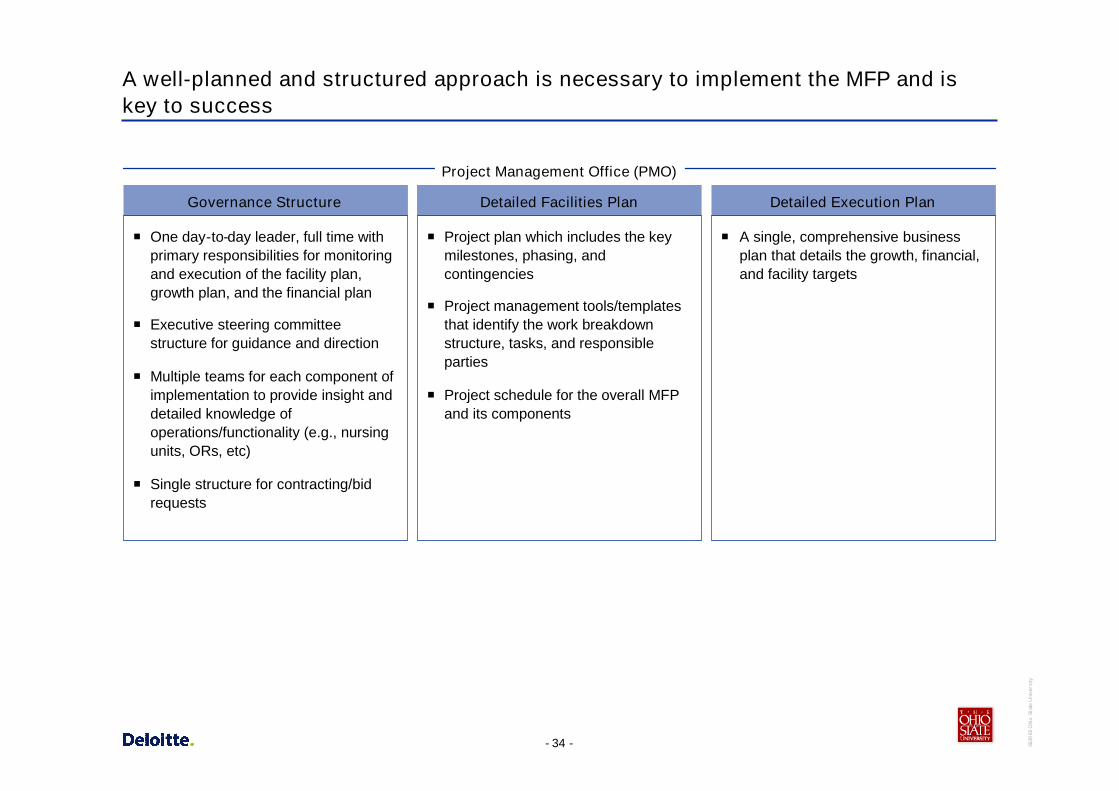
A well-planned and structured approach is necessary to implement the MFP and iskey to success
Project Management Office (PMO)
Governance Structure
One day-to-day leader, full time withprimary responsibilities for monitoringand execution of the facility plan,growth plan, and the financial plan
Executive steering committeestructure for guidance and direction
Multiple teams for each component ofimplementation to provide insight anddetailed knowledge ofoperations/functionality (e.g., nursingunits, ORs, etc)
Single structure for contracting/bidrequests
Detailed Facilities Plan
Project plan which includes the keymilestones, phasing, andcontingencies
Project management tools/templatesthat identify the work breakdownstructure, tasks, and responsibleparties
Project schedule for the overall MFPand its components
Detailed Execution Plan
A single, comprehensive businessplan that details the growth, financial,and facility targets

Appendices

- 36 - 3639
65O
hio
Stat
eU
nive
rsity
Appendix A – Overview of Strategic Plans
- 37 - 3639
65O
hio
Stat
eU
nive
rsity
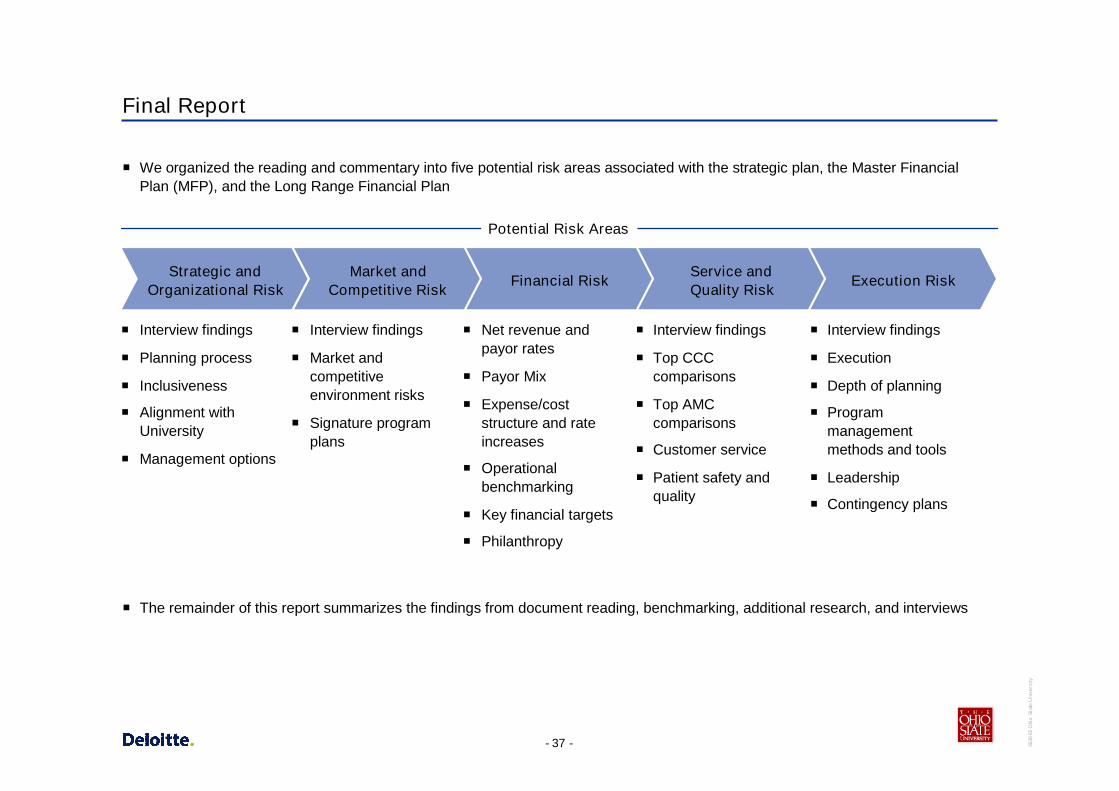
Final Report
We organized the reading and commentary into five potential risk areas associated with the strategic plan, the Master FinancialPlan (MFP), and the Long Range Financial Plan
The remainder of this report summarizes the findings from document reading, benchmarking, additional research, and interviews
Potential Risk Areas
Strategic andOrganizational Risk
Market andCompetitive Risk
Financial RiskService andQuality Risk
Execution Risk
Interview findings
Planning process
Inclusiveness
Alignment withUniversity
Management options
Interview findings
Market andcompetitiveenvironment risks
Signature programplans
Net revenue andpayor rates
Payor Mix
Expense/coststructure and rateincreases
Operationalbenchmarking
Key financial targets
Philanthropy
Interview findings
Top CCCcomparisons
Top AMCcomparisons
Customer service
Patient safety andquality
Interview findings
Execution
Depth of planning
Programmanagementmethods and tools
Leadership
Contingency plans
- 38 - 3639
65O
hio
Stat
eU
nive
rsity
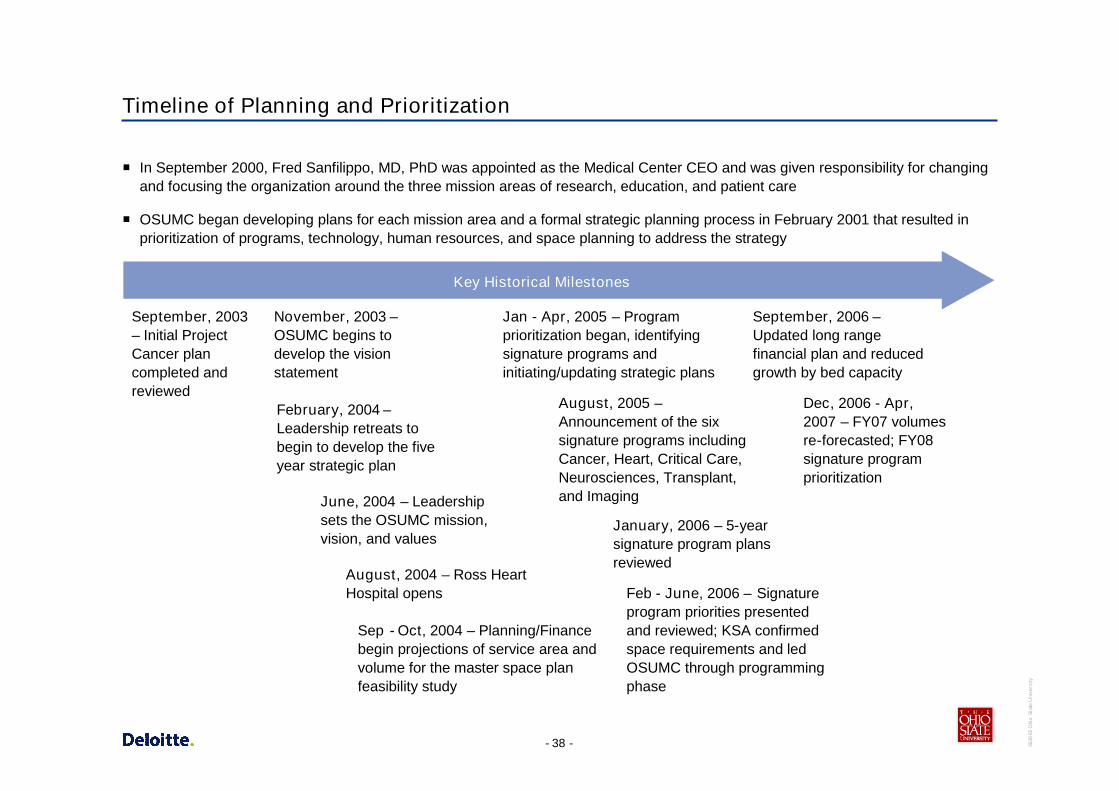
Timeline of Planning and Prioritization
In September 2000, Fred Sanfilippo, MD, PhD was appointed as the Medical Center CEO and was given responsibility for changingand focusing the organization around the three mission areas of research, education, and patient care
OSUMC began developing plans for each mission area and a formal strategic planning process in February 2001 that resulted inprioritization of programs, technology, human resources, and space planning to address the strategy
Key Historical Milestones
February, 2004 –Leadership retreats tobegin to develop the fiveyear strategic plan
June, 2004 – Leadershipsets the OSUMC mission,vision, and values
Jan - Apr, 2005 – Programprioritization began, identifyingsignature programs andinitiating/updating strategic plans
August, 2005 –Announcement of the sixsignature programs includingCancer, Heart, Critical Care,Neurosciences, Transplant,and Imaging
January, 2006 – 5-yearsignature program plansreviewed
November, 2003 –OSUMC begins todevelop the visionstatement
August, 2004 – Ross HeartHospital opens
Sep - Oct, 2004 – Planning/Financebegin projections of service area andvolume for the master space planfeasibility study
Feb - June, 2006 – Signatureprogram priorities presentedand reviewed; KSA confirmedspace requirements and ledOSUMC through programmingphase
September, 2006 –Updated long rangefinancial plan and reducedgrowth by bed capacity
Dec, 2006 - Apr,2007 – FY07 volumesre-forecasted; FY08signature programprioritization
September, 2003– Initial ProjectCancer plancompleted andreviewed
- 39 - 3639
65O
hio
Stat
eU
nive
rsity
OSU Medical Center Strategic Overview
Organization Overview and Highlights
– Affiliations with Columbus Children’s Hospital for pediatric services, a network of outpatient sites across Columbus and nearby communities,and 6,000 physicians in the referral network
– OSUMC is ranked 18th by U.S. News and World Report based on the number of specialties, and 5th by UHC for Top Quality Hospitals
Key Strategic Imperatives
Patient Care – be among the top tier of academic medical centers through program investment in focused areas (referred to as theSix Signature Programs) and delivery of the following:
– Better outcomes through evidenced based medicine
– Additional clinicians
– State of the art clinical facilities
Research – be among the top quartile of AMCs as measured by NIH funding and total research dollars
– Improve ranking for NIH funding (model AMCs receive $257.1M in funding)
– Additional space required
– Additional funded researchers required
Education – be among the top quartile of AMCs as measured by medical school rankings, university funding, and caliber of studentsrecruited
– Highly ranked on USN&WR for best medical schools
– Reduced number of students admitted, increased tuition, and increased scholarships
– Additional faculty to achieve faculty to student ratio in the top 25%
– Improved facilities
Sources: Requirements to Become a “Top Tier” Medical Center, September 8, 2003; OSU Medical Center FY08 Strategic Prioritization, February 2007
- 40 - 3639
65O
hio
Stat
eU
nive
rsity
Key Interviews
Senior Medical Center Leadership
Fred Sanfilippo (OSUMC CEO)
Peter Geier (OSUMC COO)
Chip Souba (OSUMC Dean, College of Medicine)
John Stone (OSUMC CFO)
Gail Marsh (OSUMC CSO)
Medical Center Leadership – Health System
Jay Kasey (COO, Health System)
David Schuller (Sr Exec Dir, James)
Dennis Smith (Exec Dir, James)
Larry Anstine (Exec Dir, Univ Hosp and Ross)
Mary Nash (CNO, Health System)
Eric Kunz (Associate Vice President for Medical CenterFacilities Management)
Additional Health System Leadership
Dr. Stephen Hoffman
Randy Smith (Director, Critical Care Nursing)
Elizabeth Seely (Administrative Liaison, Transplant andImaging Signature Programs)
Armin Rahmanian (Admin Director, Critical Care SignatureProgram)
Doug Mooney (Director, Finance Dept)
Dan Like (Director, Planning Dept)
Signature Program Physician-Scientist Leaders
Michael Caligiuri, MD – Cancer
Clay Marsh, MD – Critical Care
William Abraham, MD – Heart
Michael Knopp, MD – Imaging
E. Nino Chiocca, MD – Neurosciences
Ronald Ferguson, MD – Transplantation
University Senior Administration
Karen Holbrook – President
Barbara Snyder – Executive Vice President and Provost
David Frantz – Secretary, Board of Trustees
Chris Culley – University Legal Counsel
Bill Shkurti – Senior Vice President for Business andFinance
Jim Schroeder – Vice President for Development
Multiple Interviews Completed
- 41 - 3639
65O
hio
Stat
eU
nive
rsity
Appendix B – Detail Market Summary

- 42 - 3639
65O
hio
Stat
eU
nive
rsity
Market Demographics

- 43 - 3639
65O
hio
Stat
eU
nive
rsity
Market Demographics – Median Income and Unemployment
In the primary and secondary service areas, three counties have higher median income than the area median. Only Delaware countyhas both high income and low unemployment rate.
Median Income and Unemployment Rate for SSA - 2005
$0
$10,000
$20,000
$30,000
$40,000
$50,000
$60,000
$70,000
$80,000
Franklin Delaw are Fairf ield Licking Madison Pickaw ay Union0.0%
1.0%
2.0%
3.0%
4.0%
5.0%
6.0%
7.0%
8.0%
9.0%
Median Income Unemploymnet - %
Area MedianIncome: $48,952
HighUnemployment

- 44 - 3639
65O
hio
Stat
eU
nive
rsity
Market Demographics – Franklin County Payor Mix by Quadrant
Managed care and Medicare are the dominant payor types in each quadrant of Franklin County, with slightly higher Medicaid in thesouthwest.
36%45%
35%31%
30%
32%
30%
26%
22%
10%
22%
29%
6% 6% 7% 8%
4% 5% 3% 3%3%2% 1% 2%
0.4% 0.2% 0.4% 0.3%
0%
10%
20%
30%
40%
50%
60%
70%
80%
90%
100%
Northeast Northwest Southeast Southwest
Managed Care Medicare Medicaid Self Pay Commercial Insurance Other Champus

- 45 - 3639
65O
hio
Stat
eU
nive
rsity
Market Demographics – Secondary Service Area Payor Mix
In the secondary service area, Medicare is the dominant payor type in each county except Delaware and Union which also havehigher median income.
49%
26% 25%30%
21%
31%
27%
36% 37%35%
35%
26%
9%
15% 12%10%
13%20%
9%15%
18% 15%
16%
15%
4% 5% 5%4%
5%
5%10%
6%2%
1% 1% 2%0.4% 0.7% 0.3% 0.2% 0.1% 0.0%
0%
10%
20%
30%
40%
50%
60%
70%
80%
90%
100%
Delaware Fairfield Licking Madison Pickaway Union
Managed Care Medicare Commercial Insurance Medicaid Self Pay Other Champus

- 46 - 3639
65O
hio
Stat
eU
nive
rsity
Market Share
- 47 - 3639
65O
hio
Stat
eU
nive
rsity
Market Environment – PSA Market Share by Quadrant
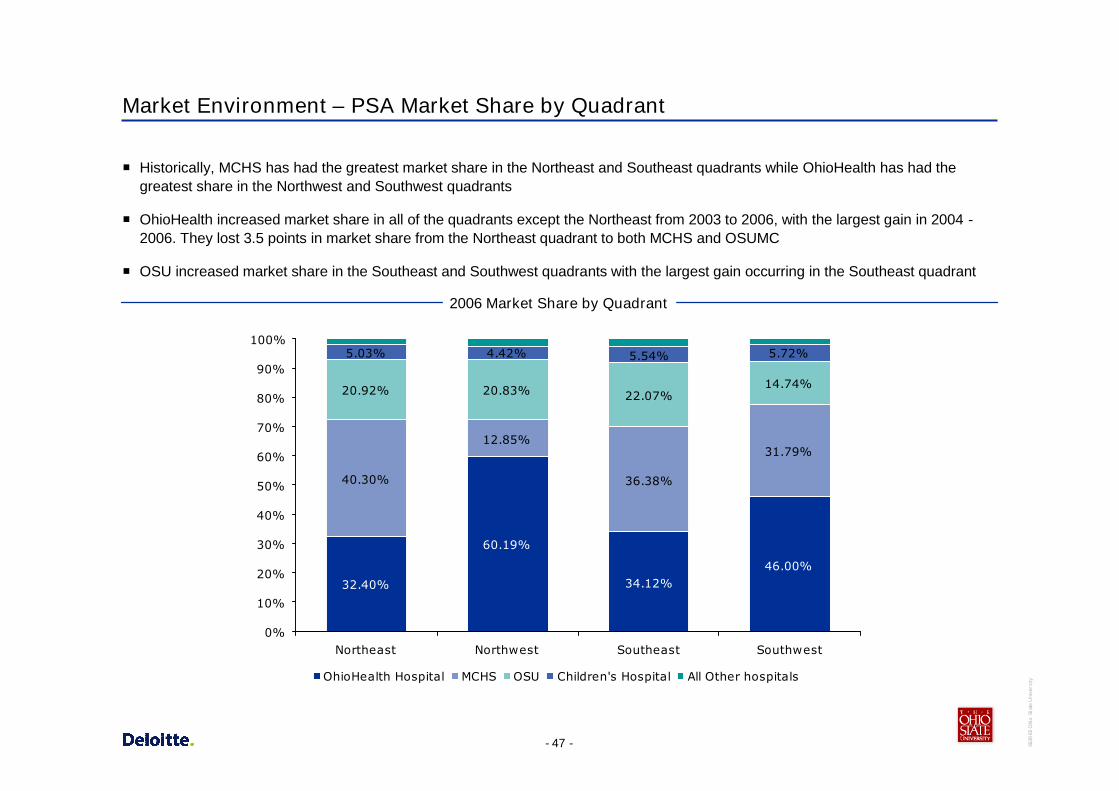
Historically, MCHS has had the greatest market share in the Northeast and Southeast quadrants while OhioHealth has had thegreatest share in the Northwest and Southwest quadrants
OhioHealth increased market share in all of the quadrants except the Northeast from 2003 to 2006, with the largest gain in 2004 -2006. They lost 3.5 points in market share from the Northeast quadrant to both MCHS and OSUMC
OSU increased market share in the Southeast and Southwest quadrants with the largest gain occurring in the Southeast quadrant
32.40%
60.19%
34.12%46.00%
40.30%
12.85%
36.38%
31.79%
20.92% 20.83% 22.07%14.74%
5.03% 4.42% 5.54% 5.72%
0%
10%
20%
30%
40%
50%
60%
70%
80%
90%
100%
Northeast Northwest Southeast Southwest
OhioHealth Hospital MCHS OSU Children's Hospital All Other hospitals
2006 Market Share by Quadrant
- 48 - 3639
65O
hio
Stat
eU
nive
rsity
Market Environment – PSA and SSA Market Share
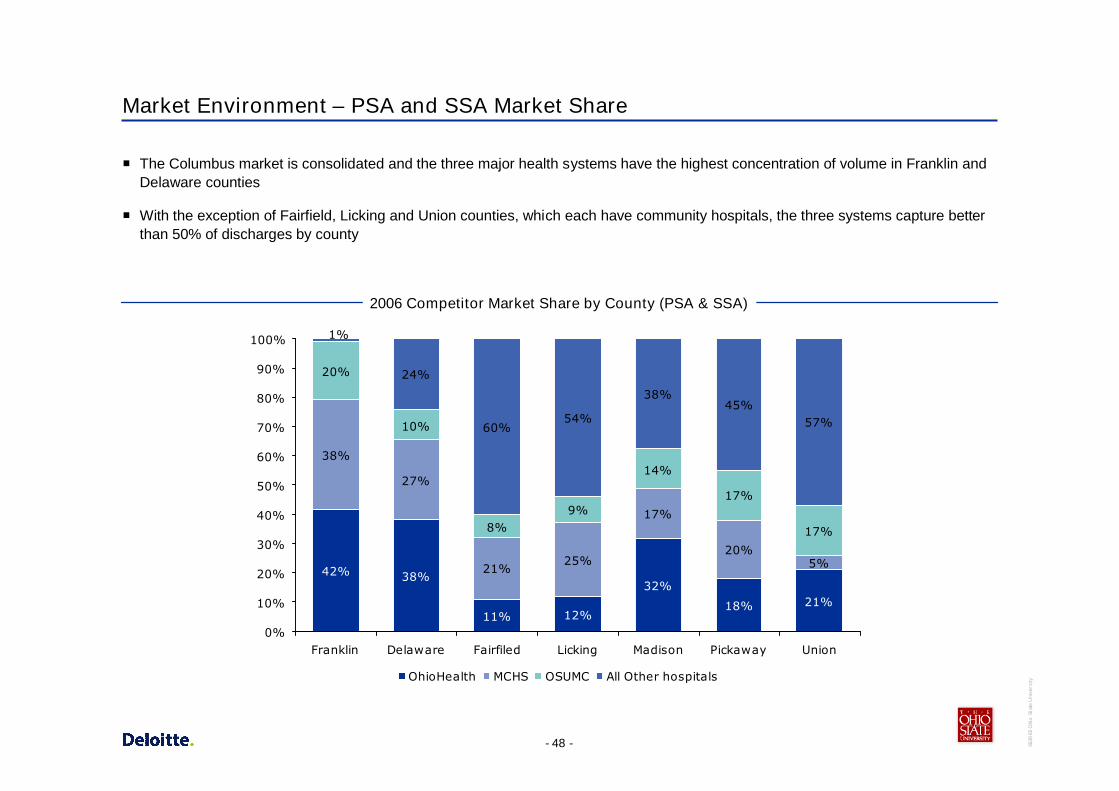
The Columbus market is consolidated and the three major health systems have the highest concentration of volume in Franklin andDelaware counties
With the exception of Fairfield, Licking and Union counties, which each have community hospitals, the three systems capture betterthan 50% of discharges by county
2006 Competitor Market Share by County (PSA & SSA)
42% 38%
11% 12%
32%
18% 21%
38%
27%
21%25%
17%
20%5%
20%
10%
8%9%
14%
17%
17%
24%
60%54%
38%45%
57%
1%
0%
10%
20%
30%
40%
50%
60%
70%
80%
90%
100%
Franklin Delaware Fairfiled Licking Madison Pickaway Union
OhioHealth MCHS OSUMC All Other hospitals

- 49 - 3639
65O
hio
Stat
eU
nive
rsity
Appendix C – Detail Signature Program Plans

- 50 - 3639
65O
hio
Stat
eU
nive
rsity
Signature Program Market Summary
- 51 - 3639
65O
hio
Stat
eU
nive
rsity
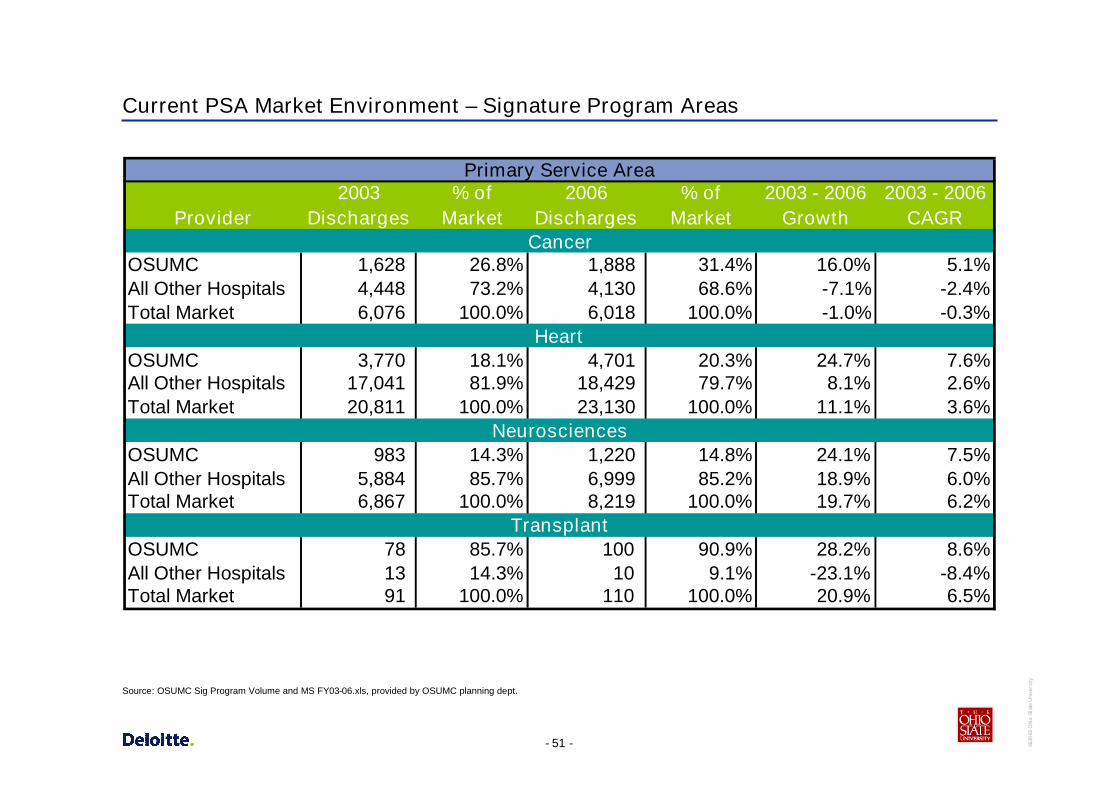
Current PSA Market Environment – Signature Program Areas
Provider2003
Discharges% of
Market2006
Discharges% of
Market2003 - 2006
Growth2003 - 2006
CAGR
OSUMC 1,628 26.8% 1,888 31.4% 16.0% 5.1%All Other Hospitals 4,448 73.2% 4,130 68.6% -7.1% -2.4%Total Market 6,076 100.0% 6,018 100.0% -1.0% -0.3%
OSUMC 3,770 18.1% 4,701 20.3% 24.7% 7.6%All Other Hospitals 17,041 81.9% 18,429 79.7% 8.1% 2.6%Total Market 20,811 100.0% 23,130 100.0% 11.1% 3.6%
OSUMC 983 14.3% 1,220 14.8% 24.1% 7.5%All Other Hospitals 5,884 85.7% 6,999 85.2% 18.9% 6.0%Total Market 6,867 100.0% 8,219 100.0% 19.7% 6.2%
OSUMC 78 85.7% 100 90.9% 28.2% 8.6%All Other Hospitals 13 14.3% 10 9.1% -23.1% -8.4%Total Market 91 100.0% 110 100.0% 20.9% 6.5%
Primary Service Area
Cancer
Heart
Neurosciences
Transplant
Source: OSUMC Sig Program Volume and MS FY03-06.xls, provided by OSUMC planning dept.

- 52 - 3639
65O
hio
Stat
eU
nive
rsity
Current SSA Market Environment – Signature Program Areas
Provider2003
Discharges% of
Market2006
Discharges% of
Market2003 - 2006
Growth2003 - 2006
CAGR
OSUMC 697 25.6% 810 27.3% 16.2% 5.1%All Other Hospitals 2,025 74.4% 2,159 72.7% 6.6% 2.2%Total Market 2,722 100.0% 2,969 100.0% 9.1% 2.9%
OSUMC 956 8.4% 1,343 11.2% 40.5% 12.0%All Other Hospitals 10,451 91.6% 10,597 88.8% 1.4% 0.5%Total Market 11,407 100.0% 11,940 100.0% 4.7% 1.5%
OSUMC 274 7.9% 396 9.8% 44.5% 13.1%All Other Hospitals 3,212 92.1% 3,637 90.2% 13.2% 4.2%Total Market 3,486 100.0% 4,033 100.0% 15.7% 5.0%
OSUMC 38 84.4% 32 74.4% -15.8% -5.6%All Other Hospitals 7 15.6% 11 25.6% 57.1% 16.3%Total Market 45 100.0% 43 100.0% -4.4% -1.5%
Secondary Service Area
Cancer
Heart
Neurosciences
Transplant
Source: OSUMC Sig Program Volume and MS FY03-06.xls, provided by OSUMC planning dept.

- 53 - 3639
65O
hio
Stat
eU
nive
rsity
Current TSA Market Environment – Signature Program Areas
Provider2003
Discharges% of
Market2006
Discharges% of
Market2003 - 2006
Growth2003 - 2006
CAGR
OSUMC 2,532 4.2% 3,105 5.4% 22.6% 7.0%All Other Hospitals 57,878 95.8% 54,398 94.6% -6.0% -2.0%Total Market 60,410 100.0% 57,503 100.0% -4.8% -1.6%
OSUMC 2,914 1.1% 3,275 1.3% 12.4% 4.0%All Other Hospitals 259,595 98.9% 253,817 98.7% -2.2% -0.7%Total Market 262,509 100.0% 257,092 100.0% -2.1% -0.7%
OSUMC 805 0.9% 1,151 1.3% 43.0% 12.7%All Other Hospitals 83,941 99.1% 86,821 98.7% 3.4% 1.1%Total Market 84,746 100.0% 87,972 100.0% 3.8% 1.3%
OSUMC 162 19.6% 188 20.9% 16.0% 5.1%All Other Hospitals 665 80.4% 712 79.1% 7.1% 2.3%Total Market 827 100.0% 900 100.0% 8.8% 2.9%
Tertiary Service Area
Cancer
Heart
Neurosciences
Transplant
Source: OSUMC Sig Program Volume and MS FY03-06.xls, provided by OSUMC planning dept.
- 54 - 3639
65O
hio
Stat
eU
nive
rsity
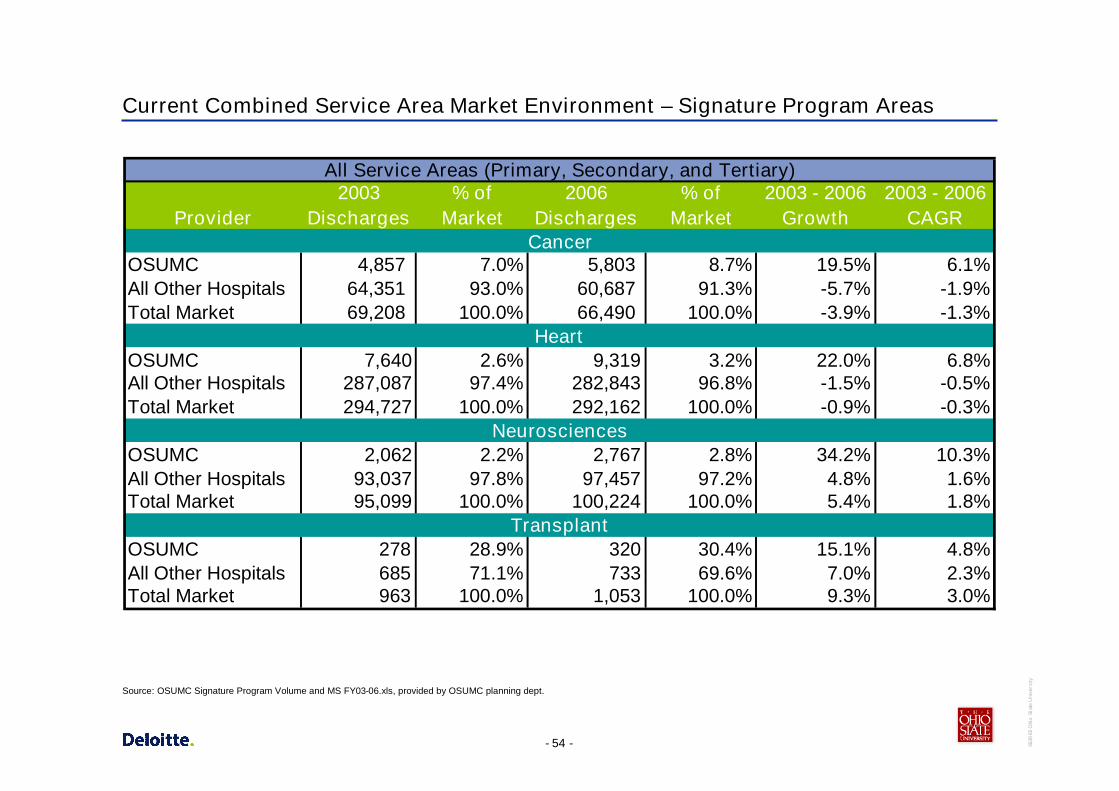
Current Combined Service Area Market Environment – Signature Program Areas
Provider2003
Discharges% of
Market2006
Discharges% of
Market2003 - 2006
Growth2003 - 2006
CAGR
OSUMC 4,857 7.0% 5,803 8.7% 19.5% 6.1%All Other Hospitals 64,351 93.0% 60,687 91.3% -5.7% -1.9%Total Market 69,208 100.0% 66,490 100.0% -3.9% -1.3%
OSUMC 7,640 2.6% 9,319 3.2% 22.0% 6.8%All Other Hospitals 287,087 97.4% 282,843 96.8% -1.5% -0.5%Total Market 294,727 100.0% 292,162 100.0% -0.9% -0.3%
OSUMC 2,062 2.2% 2,767 2.8% 34.2% 10.3%All Other Hospitals 93,037 97.8% 97,457 97.2% 4.8% 1.6%Total Market 95,099 100.0% 100,224 100.0% 5.4% 1.8%
OSUMC 278 28.9% 320 30.4% 15.1% 4.8%All Other Hospitals 685 71.1% 733 69.6% 7.0% 2.3%Total Market 963 100.0% 1,053 100.0% 9.3% 3.0%
Cancer
Heart
Neurosciences
Transplant
All Service Areas (Primary, Secondary, and Tertiary)
Source: OSUMC Signature Program Volume and MS FY03-06.xls, provided by OSUMC planning dept.
- 55 - 3639
65O
hio
Stat
eU
nive
rsity
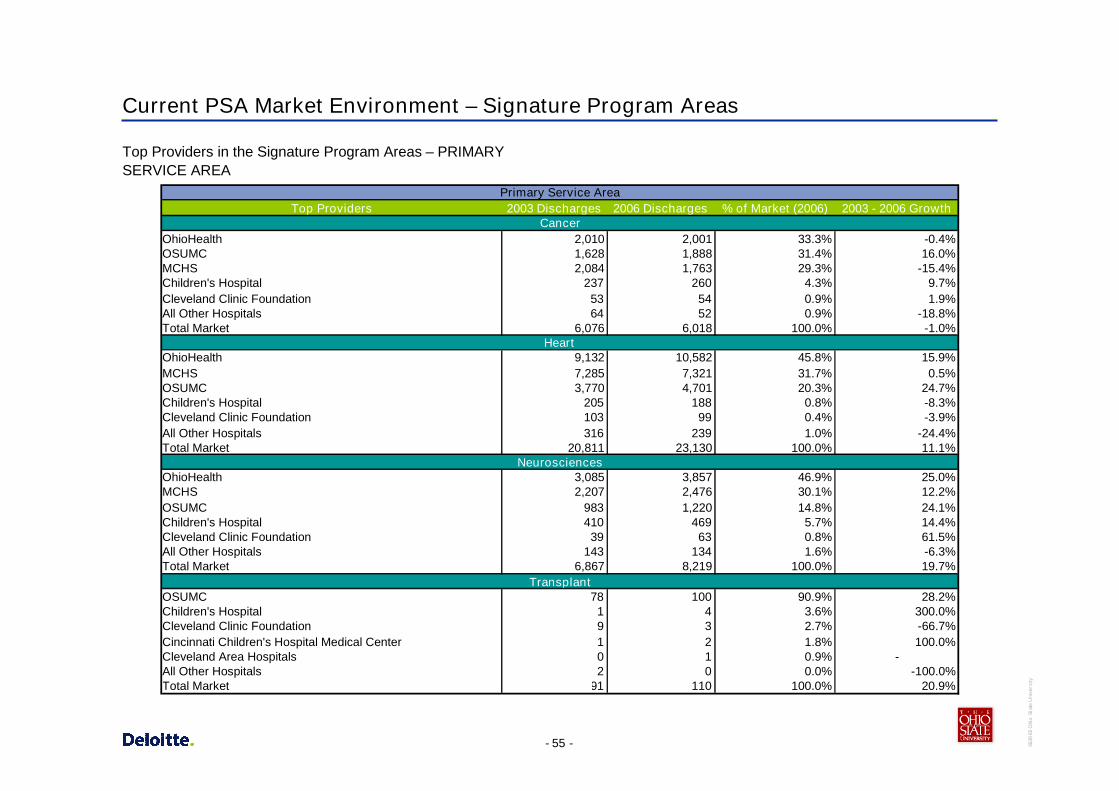
Current PSA Market Environment – Signature Program Areas
Top Providers in the Signature Program Areas – PRIMARYSERVICE AREA
Top Providers 2003 Discharges 2006 Discharges % of Market (2006) 2003 - 2006 Growth
OhioHealth 2,010 2,001 33.3% -0.4%OSUMC 1,628 1,888 31.4% 16.0%MCHS 2,084 1,763 29.3% -15.4%Children's Hospital 237 260 4.3% 9.7%Cleveland Clinic Foundation 53 54 0.9% 1.9%All Other Hospitals 64 52 0.9% -18.8%Total Market 6,076 6,018 100.0% -1.0%
OhioHealth 9,132 10,582 45.8% 15.9%MCHS 7,285 7,321 31.7% 0.5%OSUMC 3,770 4,701 20.3% 24.7%Children's Hospital 205 188 0.8% -8.3%Cleveland Clinic Foundation 103 99 0.4% -3.9%All Other Hospitals 316 239 1.0% -24.4%Total Market 20,811 23,130 100.0% 11.1%
OhioHealth 3,085 3,857 46.9% 25.0%MCHS 2,207 2,476 30.1% 12.2%OSUMC 983 1,220 14.8% 24.1%Children's Hospital 410 469 5.7% 14.4%Cleveland Clinic Foundation 39 63 0.8% 61.5%All Other Hospitals 143 134 1.6% -6.3%Total Market 6,867 8,219 100.0% 19.7%
OSUMC 78 100 90.9% 28.2%Children's Hospital 1 4 3.6% 300.0%Cleveland Clinic Foundation 9 3 2.7% -66.7%Cincinnati Children's Hospital Medical Center 1 2 1.8% 100.0%Cleveland Area Hospitals 0 1 0.9% -All Other Hospitals 2 0 0.0% -100.0%Total Market 91 110 100.0% 20.9%
Primary Service Area
Cancer
Heart
Neurosciences
Transplant

- 56 - 3639
65O
hio
Stat
eU
nive
rsity
Current SSA Market Environment – Signature Program Areas
Top Providers in the Signature Program Areas – SECONDARYSERVICE AREA
Top Providers 2003 Discharges 2006 Discharges % of Market (2006) 2003 - 2006 Growth
OSUMC 697 810 27.3% 16.2%OhioHealth 612 653 22.0% 6.7%MCHS 598 576 19.4% -3.7%Fairfield Medical Center 304 374 12.6% 23.0%Licking Memorial Hospital 185 185 6.2% 0.0%All Other Hospitals 326 371 12.5% 13.8%Total Market 2,722 2,969 100.0% 9.1%
OhioHealth 2,794 3,097 25.9% 10.8%MCHS 2,246 2,746 23.0% 22.3%Fairfield Medical Center 2,150 2,141 17.9% -0.4%OSUMC 956 1,343 11.2% 40.5%Licking Memorial Hospital 1,354 1,070 9.0% -21.0%All Other Hospitals 1,907 1,543 12.9% -19.1%Total Market 11,407 11,940 100.0% 4.7%
OhioHealth 1,166 1,364 33.8% 17.0%MCHS 673 901 22.3% 33.9%Fairfield Medical Center 457 483 12.0% 5.7%OSUMC 274 396 9.8% 44.5%Licking Memorial Hospital 304 284 7.0% -6.6%All Other Hospitals 612 605 15.0% -1.1%Total Market 3,486 4,033 100.0% 15.7%
OSUMC 38 32 74.4% -15.8%Children's Hospital 1 4 9.3% 300.0%Cleveland Clinic Foundation 6 4 9.3% -33.3%Cincinnati Children's Hospital Medical Center 0 2 4.7% -Pennsylvania Hospitals 0 1 2.3% -All Other Hospitals 0 0 0.0% -Total Market 45 43 100.0% -4.4%
Secondary Service Area
Cancer
Heart
Neurosciences
Transplant

- 57 - 3639
65O
hio
Stat
eU
nive
rsity
Current TSA Market Environment - Signature Program Areas
Top Providers in the Signature Program Areas – TERTIARYSERVICE AREA
Top Providers 2003 Discharges 2006 Discharges % of Market (2006) 2003 - 2006 Growth
Cleveland Clinic Foundation 5,133 5,413 9.4% 5.5%Cleveland Area Hospitals 5,036 5,014 8.7% -0.4%OSUMC 2,532 3,105 5.4% 22.6%Aultman Hospitals/Mercy/Harrison/Barberton 2,621 2,303 4.0% -12.1%Kettering Medical Center 1,314 1,517 2.6% 15.4%All Other Hospitals 43,774 40,151 69.8% -8.3%Total Market 60,410 57,503 100.0% -4.8%
Cleveland Area Hospitals 16,999 17,672 6.9% 4.0%Aultman Hospitals/Mercy/ Harrison/Barberton 12,406 11,781 4.6% -5.0%Cleveland Clinic Foundation 10,692 11,197 4.4% 4.7%Summa Health System/ Akron City and St. Thomas Hospital 6,226 6,552 2.5% 5.2%OhioHealth 7,249 6,416 2.5% -11.5%All Other Hospitals 208,937 203,474 79.1% -2.6%Total Market 262,509 257,092 100.0% -2.1%
Cleveland Area Hospitals 7,156 7,505 8.5% 4.9%Cleveland Clinic Foundation 3,635 4,531 5.2% 24.6%Aultman Hospitals/Mercy/ Harrison/Barberton 3,869 3,862 4.4% -0.2%Miami Valley Hospital 2,432 2,668 3.0% 9.7%Summa Health System/ Akron City and St. Thomas Hospital 2,782 2,530 2.9% -9.1%All Other Hospitals 64,872 66,876 76.0% 3.1%Total Market 84,746 87,972 100.0% 3.8%
Cleveland Clinic Foundation 211 290 32.2% 37.4%OSUMC 162 188 20.9% 16.0%Cleveland Area Hospitals 87 110 12.2% 26.4%University Hospital 98 89 9.9% -9.2%Summa Health System/ Akron City and St. Thomas Hospital 15 45 5.0% 200.0%All Other Hospitals 254 178 19.8% -29.9%Total Market 827 900 100.0% 8.8%
Heart
Neurosciences
Transplant
Tertiary Service Area
Cancer

- 58 - 3639
65O
hio
Stat
eU
nive
rsity
Appendix D – Detail Financial Summary
- 59 - 3639
65O
hio
Stat
eU
nive
rsity
Financial and Operational Results – OSU Health System (Historical)
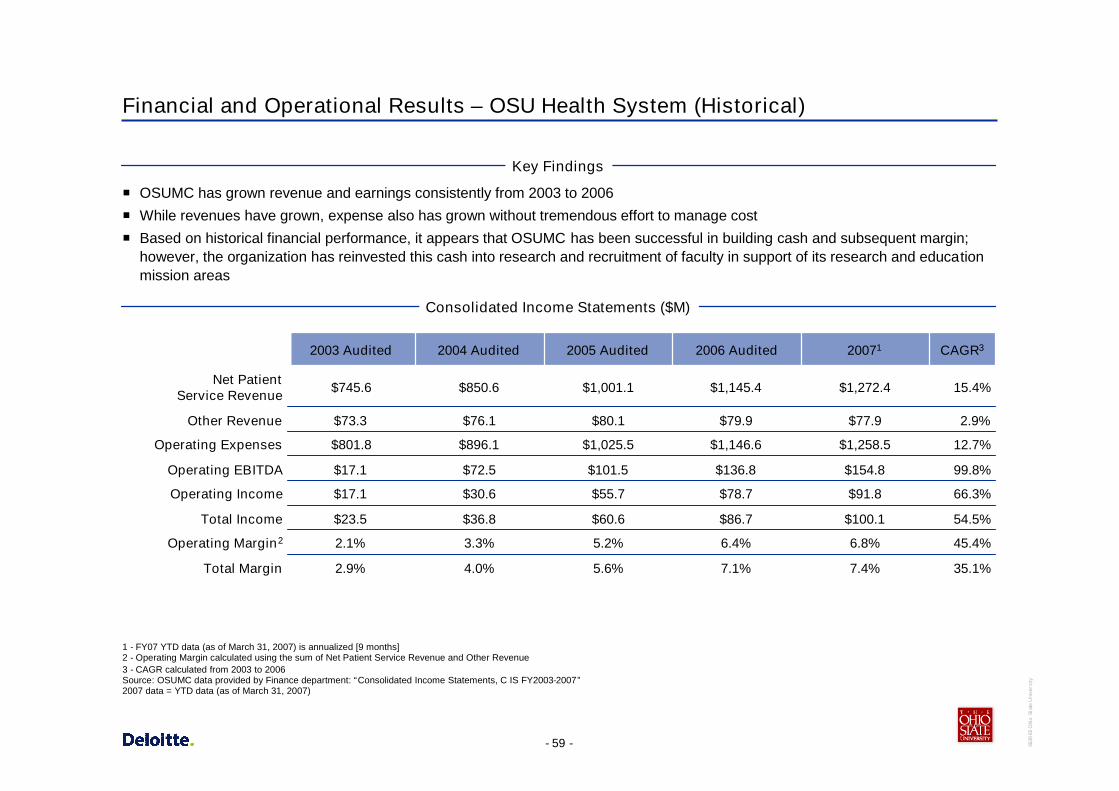
OSUMC has grown revenue and earnings consistently from 2003 to 2006
While revenues have grown, expense also has grown without tremendous effort to manage cost
Based on historical financial performance, it appears that OSUMC has been successful in building cash and subsequent margin;however, the organization has reinvested this cash into research and recruitment of faculty in support of its research and educationmission areas
Key Findings
Consolidated Income Statements ($M)
1 - FY07 YTD data (as of March 31, 2007) is annualized [9 months]2 - Operating Margin calculated using the sum of Net Patient Service Revenue and Other Revenue3 - CAGR calculated from 2003 to 2006Source: OSUMC data provided by Finance department: “Consolidated Income Statements, C IS FY2003-2007”2007 data = YTD data (as of March 31, 2007)
66.3%$91.8$78.7$55.7$30.6$17.1Operating Income
54.5%$100.1$86.7$60.6$36.8$23.5Total Income
45.4%6.8%6.4%5.2%3.3%2.1%Operating Margin2
Total Margin
Operating EBITDA
Operating Expenses
Other Revenue
Net PatientService Revenue
35.1%
99.8%
12.7%
2.9%
15.4%
CAGR3
7.4%
$154.8
$1,258.5
$77.9
$1,272.4
20071
7.1%
$136.8
$1,146.6
$79.9
$1,145.4
2006 Audited
5.6%
$101.5
$1,025.5
$80.1
$1,001.1
2005 Audited
4.0%
$72.5
$896.1
$76.1
$850.6
2004 Audited
2.9%
$17.1
$801.8
$73.3
$745.6
2003 Audited

- 60 - 3639
65O
hio
Stat
eU
nive
rsity
Payor Mix (Historical)
6.40% 6.30% 6.50% 6.40% 6.80% 6.50%
5.50% 2.90% 2.50% 2.30% 2.40% 2.90%
37.90%39.50% 39.20% 37.50% 36.90% 38.00%
16.30% 16.90% 16.80% 17.10% 17.50% 15.20%
28.90% 29.20% 29.90% 31.50% 30.60% 30.30%
5.20% 5.20% 5.20% 5.10% 5.90% 7.20%
0%
10%
20%
30%
40%
50%
60%
70%
80%
90%
100%
2002 2003 2004 2005 2006 2007*
Fiscal Year
%
All others Commercial Managed Care Medicaid Medicare Self Pay
Consolidated Inpatient Payor Mix
Source: Book3 payer trends.xls provided by Finance department.Note – FY07 payor mix is annualized based on February 2007

- 61 - 3639
65O
hio
Stat
eU
nive
rsity
$12,980$12,400
$10,871$10,236
$0
$2,000
$4,000
$6,000
$8,000
$10,000
$12,000
$14,000
2003 2004 2005 2006
Impact to Historical Net Revenue
6.2%14.1%
4.7%
Ross HeartHospitalopened
Historical Net Patient Revenue/Adjusted Admission Key Findings
Historical rate increases have been significant over the pastseveral years as OSUMC has negotiated better rate increaseswith the payers.
- 62 - 3639
65O
hio
Stat
eU
nive
rsity
$12,993$12,702
$11,452
$11,008
$10,000
$10,500
$11,000
$11,500
$12,000
$12,500
$13,000
$13,500
2003 2004 2005 2006
Historical Operating Expense
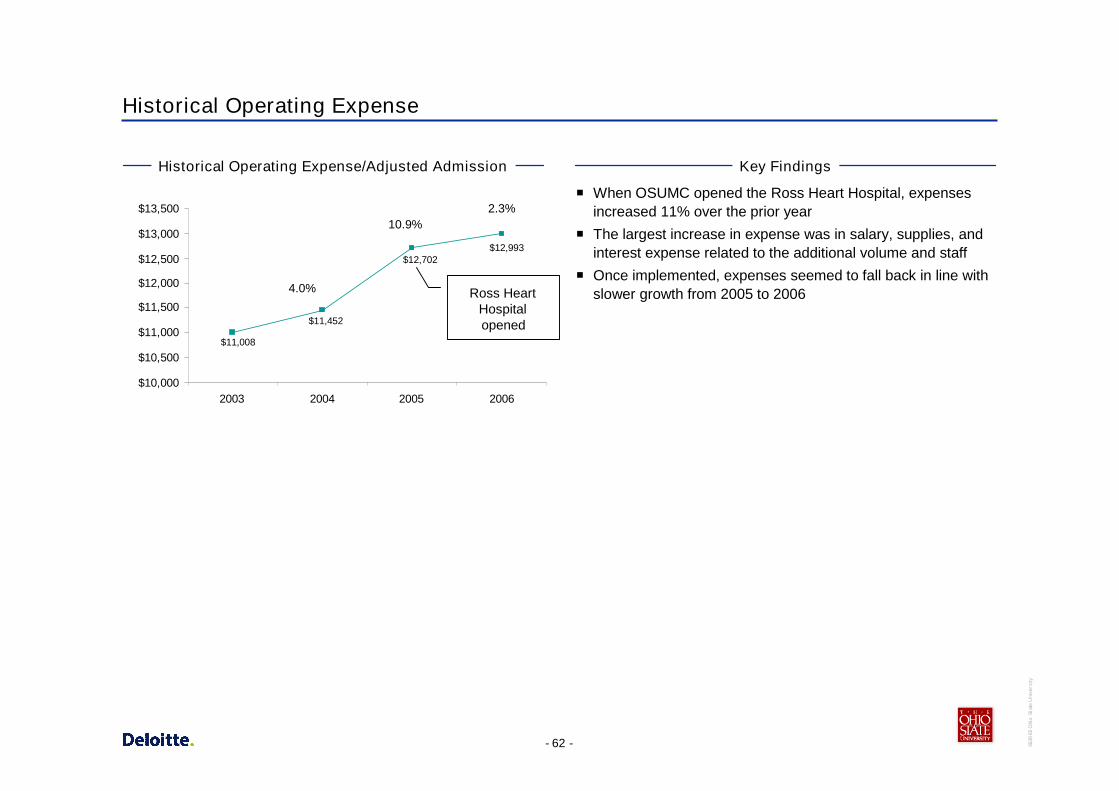
Historical Operating Expense/Adjusted Admission Key Findings
When OSUMC opened the Ross Heart Hospital, expensesincreased 11% over the prior year
The largest increase in expense was in salary, supplies, andinterest expense related to the additional volume and staff
Once implemented, expenses seemed to fall back in line withslower growth from 2005 to 20064.0%
2.3%10.9%
Ross HeartHospitalopened

- 63 - 3639
65O
hio
Stat
eU
nive
rsity
Appendix E – Detail of Top AMC and CCC Comparisons

- 64 - 3639
65O
hio
Stat
eU
nive
rsity
Organizational Characteristics of Top Academic Medical Centers
Only nationally designated CCC in Northern California;Northern California's only nationally designated Center ofExcellence in Women's Health; among top five hospitals innation for neurology/neurosurgery; largest brain tumortreatment program in nation
15.5Cancer, Heart Disease, Infertility, NeurologicalDisorders, Organ Transplantation, Orthopedics,special services for women/children
University of California,San Francisco
Minimally-Invasive Surgery, Cancer, Heart andVascular Services, Women's Health,Ophthalmology
Neonatal ICU, Trauma, Burn, Geriatrics,Women/Children Health, Heart, Cancer,Orthopedics, Surgery
Heart, Cancer, Surgery, Pulmonary & Thoracic,Neurosciences, GI/Liver, Women/Children’sHealth; Podiatry, ER & Trauma Medicine,Orthopedics
Cancer, Ophthalmology, Orthopedics,Neuroscience, Transplant
Cancer, Orthopedics, Fertility, Aesthetics, PrimaryCare,
Heart, Cancer, Critical Care, Transplant,Neurosciences, Imaging
Signature Programs
Active Grants/Contracts (does not include federal/statestudent aid): $460,588,605All, UAB ranking in NIH Funds(total direct costs): 20, School of Medicine ranking in NIHFunds (total direct costs): 16
As part of a 10-year master plan, Johns Hopkinsis building two connected clinical towers: thecardiovascular and critical care towers, and a newchildren's hospital
BIDMC: New strategic plan reaffirms commitment to four“heart and soul” programs: Palliative Care, Geriatric Care,Social Work, Community Health Centers; BWH: Toprecipient of research grants from NIH (>$400MM annually);MGH: Along with BWH, founded Partners HealthCare in1994.
Emory Healthcare includes Emory Crawford LongHospital, Emory Adventist Hospital, Wesley WoodsGeriatric Hospital and The Children’s Center. There arealso over 64 affiliated hospitals in GA.
“Signature Initiatives” include Global Health Institute,Institute for Genome Sciences & Policy, Duke-NUSGraduate Medical School Singapore, Duke TranslationalMedicine Institute
In 2000, OSUMC committed itself to org restructuring &alignment, culture change, aggressive recruitment &retention of talent, leadership development, strongfinancial management & growth
Other
N/A
9.5
11.9
9.6
N/A
20.2
Avg. Age of Plant
University of Alabama,Birmingham
Johns Hopkins University
Harvard University
Emory University
Duke University
Ohio State University
Academic Medical Center
Source: Individual organization web sites, Average age of Plant: Solucient Provider View
- 65 - 3639
65O
hio
Stat
eU
nive
rsity
Organizational Characteristics of Top Academic Medical Centers
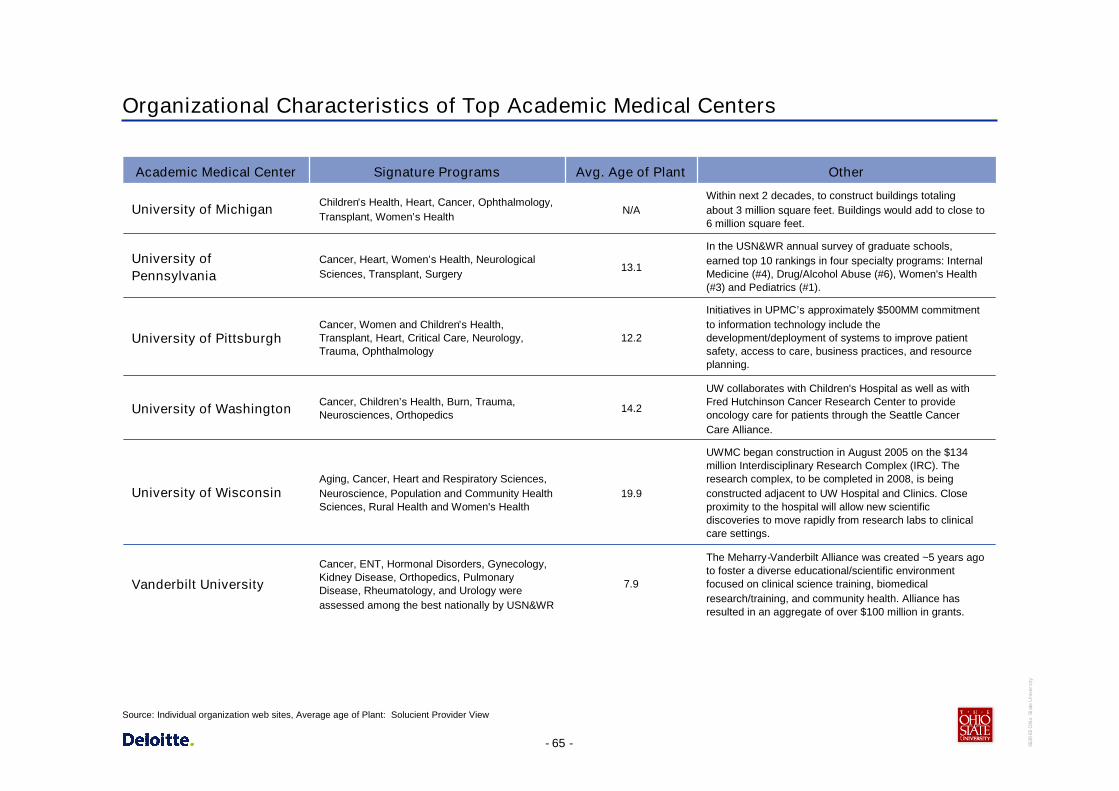
Cancer, ENT, Hormonal Disorders, Gynecology,Kidney Disease, Orthopedics, PulmonaryDisease, Rheumatology, and Urology wereassessed among the best nationally by USN&WR
Aging, Cancer, Heart and Respiratory Sciences,Neuroscience, Population and Community HealthSciences, Rural Health and Women's Health
Cancer, Children’s Health, Burn, Trauma,Neurosciences, Orthopedics
Cancer, Women and Children’s Health,Transplant, Heart, Critical Care, Neurology,Trauma, Ophthalmology
Cancer, Heart, Women’s Health, NeurologicalSciences, Transplant, Surgery
Children’s Health, Heart, Cancer, Ophthalmology,Transplant, Women’s Health
Signature Programs
The Meharry-Vanderbilt Alliance was created ~5 years agoto foster a diverse educational/scientific environmentfocused on clinical science training, biomedicalresearch/training, and community health. Alliance hasresulted in an aggregate of over $100 million in grants.
UWMC began construction in August 2005 on the $134million Interdisciplinary Research Complex (IRC). Theresearch complex, to be completed in 2008, is beingconstructed adjacent to UW Hospital and Clinics. Closeproximity to the hospital will allow new scientificdiscoveries to move rapidly from research labs to clinicalcare settings.
UW collaborates with Children's Hospital as well as withFred Hutchinson Cancer Research Center to provideoncology care for patients through the Seattle CancerCare Alliance.
Initiatives in UPMC’s approximately $500MM commitmentto information technology include thedevelopment/deployment of systems to improve patientsafety, access to care, business practices, and resourceplanning.
In the USN&WR annual survey of graduate schools,earned top 10 rankings in four specialty programs: InternalMedicine (#4), Drug/Alcohol Abuse (#6), Women's Health(#3) and Pediatrics (#1).
Within next 2 decades, to construct buildings totalingabout 3 million square feet. Buildings would add to close to6 million square feet.
Other
7.9
19.9
14.2
12.2
13.1
N/A
Avg. Age of Plant
Vanderbilt University
University of Wisconsin
University of Washington
University of Pittsburgh
University ofPennsylvania
University of Michigan
Academic Medical Center
Source: Individual organization web sites, Average age of Plant: Solucient Provider View
- 66 - 3639
65O
hio
Stat
eU
nive
rsity
Organizational Characteristics of Top Academic Medical Centers
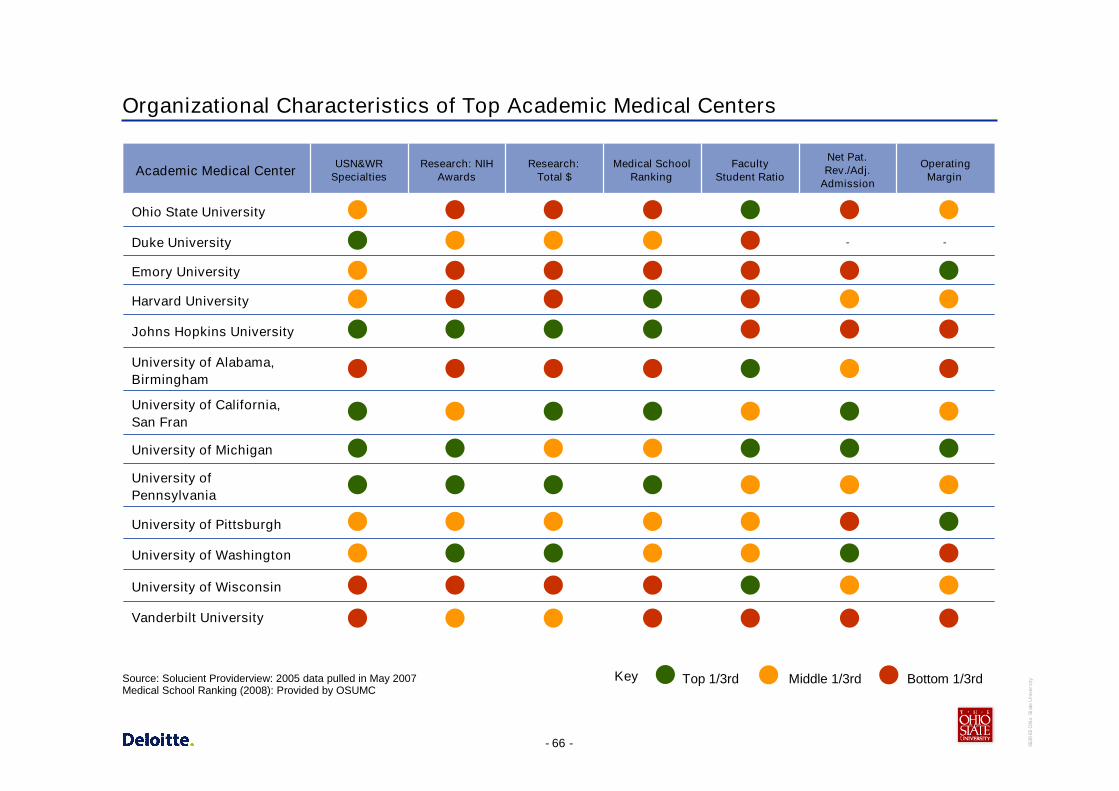
USN&WRSpecialties
Vanderbilt University
-
OperatingMargin
-
Net Pat.Rev./Adj.
Admission
FacultyStudent Ratio
Medical SchoolRanking
Research:Total $
University of Pittsburgh
University of Washington
University of Alabama,Birmingham
Johns Hopkins University
Harvard University
Emory University
Research: NIHAwards
University of Michigan
Duke University
Ohio State University
University of Wisconsin
University ofPennsylvania
University of California,San Fran
Academic Medical Center
Bottom 1/3rdTop 1/3rd Middle 1/3rdKeySource: Solucient Providerview: 2005 data pulled in May 2007Medical School Ranking (2008): Provided by OSUMC

- 67 - 3639
65O
hio
Stat
eU
nive
rsity
OSUMC US News & World Reports Ranking Comparison to Top Tier Hospitals
OSUMC ranks in the top 5% for two specialties, gynecology andkidney disease, in comparison to other top hospitals
40
21
33
20
35
2023
44
33
24
9
1618
1615
1918
8
0
5
10
15
20
25
30
35
40
45
50
Cance
rENT
Endo.
Gyn.
Kidn
eyDis.
Neuro.
Ortho.
Resp.
Dis.
Rehab
.
Specialty
Ran
k
OSU East OSU James OSU UH Top Hosp.
Specialty performing within 2+ SD/top 95%Source: USN&WR: RTI International, “America’s Best Hospitals 2006 Methodology.” Top Hosp. = last hospital within the 2+ SD.http://www.usnews.com/usnews/health/best-hospitals/methodology_report.pdf

- 68 - 3639
65O
hio
Stat
eU
nive
rsity
3
9
001
99
13
6
7
6
8
7
4
5
33
0
2
4
6
8
10
12
14
1990
19911992
1993
199419
951996
19971998
1999200
02001
20022003
200420
052006
Year
Num
ber
ofS
pec
ialti
esR
anke
d
OSUMC Performance – US News & World Reports Specialty Rankings
#8#10#7#9#9Rehabilitation
#49N/A#27#19#24Respiratory Disorders
N/AN/AN/A#28#33Orthopedics
N/AN/A#36#24#44Neurology & Neurosurgery
#48#39#35#28#23Kidney Disease
#32#35#24#19#35Endocrinology
#50N/A#33#26#20Gynecology
#30#27#17#18#20ENT
#21#25#39#29#21Cancer
20022003200420052006Specialty
Source: USN&WR “America’s Best Hospitals 2006” White Paper provided by OSUMC
Number of Specialties Ranked Over Time

- 69 - 3639
65O
hio
Stat
eU
nive
rsity
ACADEMIC MEDICAL CENTERResearch:
NIH AwardsResearch:
Total $Medical School
RankingFaculty
Student RatioNet Pat. Rev. /
Adj. AdmissionOperating
MarginUSN&WR
SpecialtiesDuke University 811 $407.5M 8 3.9 - - 15Emory University 584 $217.1M 23 3.8 $13,045 9.1% 8Harvard University 360 $165.6M 1 9.2 $14,760 7.4% 13Johns Hopkins University 1,264 $563.5M 2 5.2 $12,987 2.7% 16Ohio State University 371 $116.6M 31 2.3 $12,400 5.2% 9University of Alabama, Birmingham 473 $197.8M 27 1.7 $16,861 4.3% 7University of California, San Fran 965 $407.9M 5 2.8 $23,549 6.5% 15University of Michigan 966 $391M 10 2.2 $17,228 12.9% 16University of Pennsylvania 1,118 $452.6M 3 3.6 $16,298 5.6% 15University of Pittsburgh 952 $376.8M 15 3.2 $13,968 7.5% 12University of Washington 972 $432.4M 6 2.4 $20,158 1.1% 12University of Wisconsin 671 $242.7M 27 1.5 $16,727 6.1% 4Vanderbilt University 685 $268.5M 18 3.8 $4,117 3.9% 7
RANGEResearch:
NIH AwardsResearch:
Total $Medical School
RankingFaculty
Student RatioNet Pat. Rev. /
Adj. AdmissionOperating
MarginUSN&WR
Specialties
Top 1/3rd (Green) 966-1,264$407.9M-$563.5M 1-5 1.5-2.2 $17,228-$23,549 7.5%-12.9% 15-16
Middle 1/3rd (Yellow) 685-965$268.5M-$407.5M 6-15 2.4-3.6 $14,760-$16,861 5.6%-7.4% 8-13
Bottom 1/3rd (Red) 360-671$165.6M-$242.7M 18-27 3.8-9.2 $4,117-$13,968 1.1%-4.3% 4-7
Organizational Characteristics of Top Academic Medical Centers – Raw Data
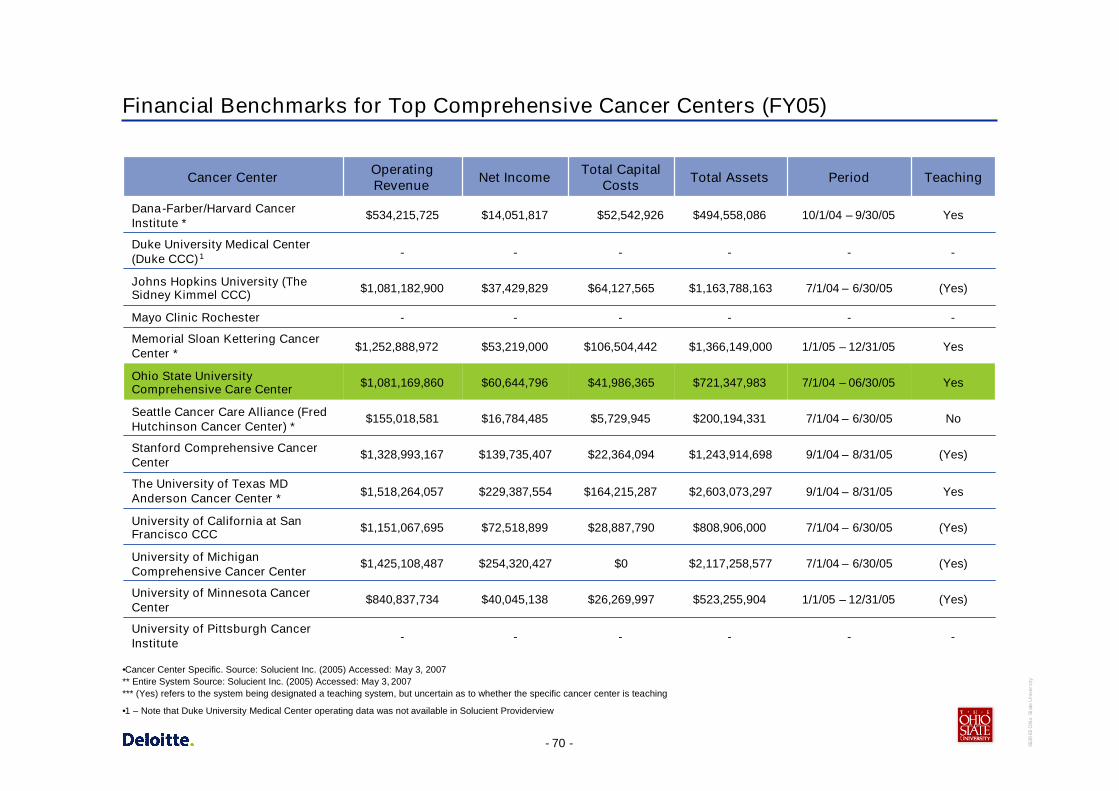
- 70 - 3639
65O
hio
Stat
eU
nive
rsity
Financial Benchmarks for Top Comprehensive Cancer Centers (FY05)
(Yes)7/1/04 – 6/30/05$2,117,258,577$0$254,320,427$1,425,108,487University of MichiganComprehensive Cancer Center
(Yes)1/1/05 – 12/31/05$523,255,904$26,269,997$40,045,138$840,837,734University of Minnesota CancerCenter
(Yes)7/1/04 – 6/30/05$1,163,788,163$64,127,565$37,429,829$1,081,182,900Johns Hopkins University (TheSidney Kimmel CCC)
No7/1/04 – 6/30/05$200,194,331$5,729,945$16,784,485$155,018,581Seattle Cancer Care Alliance (FredHutchinson Cancer Center) *
Yes7/1/04 – 06/30/05$721,347,983$41,986,365$60,644,796$1,081,169,860Ohio State UniversityComprehensive Care Center
(Yes)9/1/04 – 8/31/05$1,243,914,698$22,364,094$139,735,407$1,328,993,167Stanford Comprehensive CancerCenter
------Mayo Clinic Rochester
------Duke University Medical Center(Duke CCC)1
-
7/1/04 – 6/30/05
9/1/04 – 8/31/05
1/1/05 – 12/31/05
10/1/04 – 9/30/05
Period
-
$808,906,000
$2,603,073,297
$1,366,149,000
$494,558,086
Total Assets
-
(Yes)
Yes
Yes
Yes
Teaching
$28,887,790$72,518,899$1,151,067,695University of California at SanFrancisco CCC
---University of Pittsburgh CancerInstitute
$106,504,442$53,219,000$1,252,888,972Memorial Sloan Kettering CancerCenter *
$1,518,264,057
$534,215,725
OperatingRevenue
$52,542,926$14,051,817Dana-Farber/Harvard CancerInstitute *
$164,215,287$229,387,554The University of Texas MDAnderson Cancer Center *
Total CapitalCostsNet IncomeCancer Center
•Cancer Center Specific. Source: Solucient Inc. (2005) Accessed: May 3, 2007** Entire System Source: Solucient Inc. (2005) Accessed: May 3, 2007*** (Yes) refers to the system being designated a teaching system, but uncertain as to whether the specific cancer center is teaching
•1 – Note that Duke University Medical Center operating data was not available in Solucient Providerview

- 71 - 3639
65O
hio
Stat
eU
nive
rsity
Appendix F: Adjacencies

- 72 - 3639
65O
hio
Stat
eU
nive
rsity
Adjacencies
Stanford Comprehensive Cancer Center opened in 2004 and islocated on the Stanford medical campus
Patient Care Programs
Overview
– SCCC is a 150,000 ft2 facility with 59 clinic rooms, 3 procedurerooms, and is home to 14 disease-specific managementprograms
Equipment includes:
– 2 Cyberknife units
– 5 linear accelerators
– Diagnostic imaging (PET/CT scans)
Research/Education
Organizational Structure
Houses a tumor registry
– Clinical research suite
– Close proximity to other research
Part of Stanford University
Satellite at Northern California Cancer Center
“Home to a closely integrated research and patient care campus, the Stanford University Medical Center offers immense opportunitiesfor cross-disciplinary collaboration across the bench-to-bedside continuum. Unique among medical institutions, the center situates aworld-class medical school next to its primary teaching hospital while itself sitting within a major university setting.”
Source: Individual organization web sites

- 73 - 3639
65O
hio
Stat
eU
nive
rsity
Adjacencies
Michigan Comprehensive Cancer Center opened in 1997 and islocated on the Michigan medical campus.
Patient Care Programs
Overview
– 77 exam rooms, 7 consultation rooms, 8 procedure/treatmentrooms
– Connected to University Hospital for IP beds
Equipment includes:
– Adult radiology (x-ray, ultrasound, mammography)
– Long/short term infusion clinics
– Radiation Oncology, CT, MRI, and nuclear medicine at U.Hospital
Research/Education
Organizational Structure
Houses 4 floors of research
Close proximity to other research
Part of University of Michigan
Mott Children’s and Women’s Hospital will house both adultand pediatrics Bone Marrow Transplantation programs
“The U-M Comprehensive Cancer Center offers comprehensive diagnostic, treatment and support services to cancer patients in anenvironment that reflects our mission: the conquest of cancer through innovation and collaboration. The Center's building wasdesigned to maximize communication among specialists and facilitate the translation of research findings into meaningfuladvancements in patient care.”
Source: Individual organization web sites
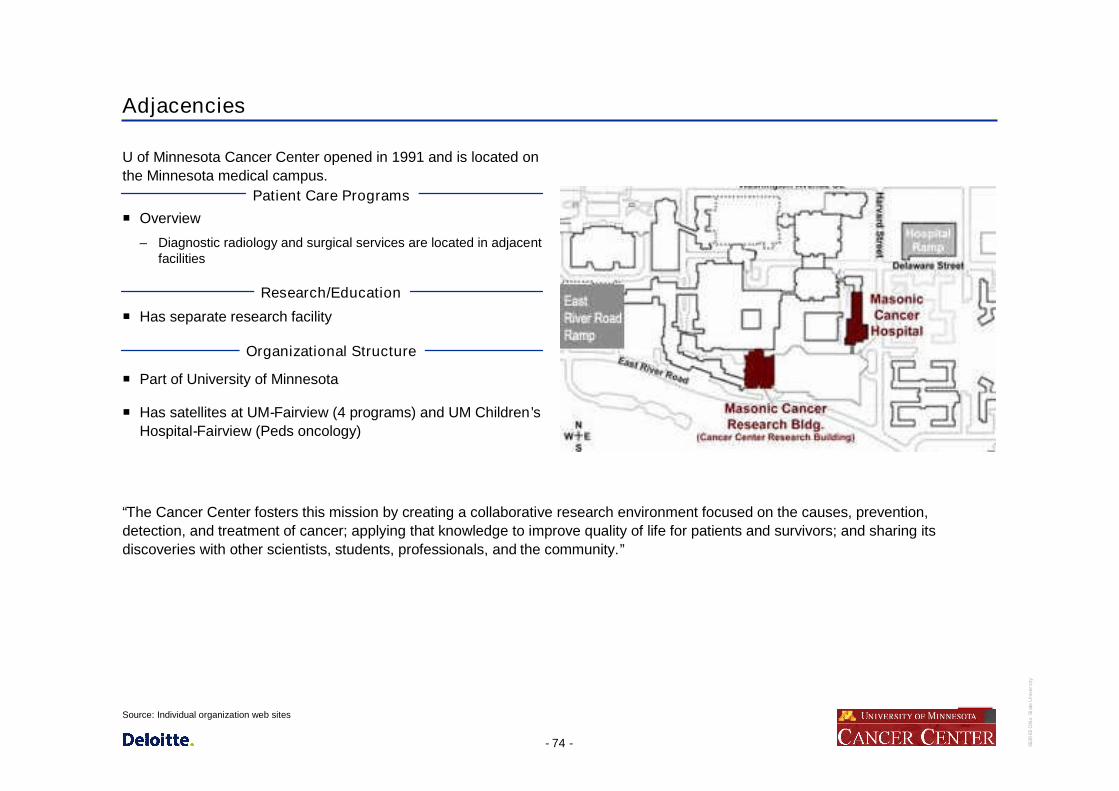
- 74 - 3639
65O
hio
Stat
eU
nive
rsity
Adjacencies
U of Minnesota Cancer Center opened in 1991 and is located onthe Minnesota medical campus.
Patient Care Programs
Overview
– Diagnostic radiology and surgical services are located in adjacentfacilities
Research/Education
Organizational Structure
Has separate research facility
Part of University of Minnesota
Has satellites at UM-Fairview (4 programs) and UM Children’sHospital-Fairview (Peds oncology)
“The Cancer Center fosters this mission by creating a collaborative research environment focused on the causes, prevention,detection, and treatment of cancer; applying that knowledge to improve quality of life for patients and survivors; and sharing itsdiscoveries with other scientists, students, professionals, and the community.”
Source: Individual organization web sites
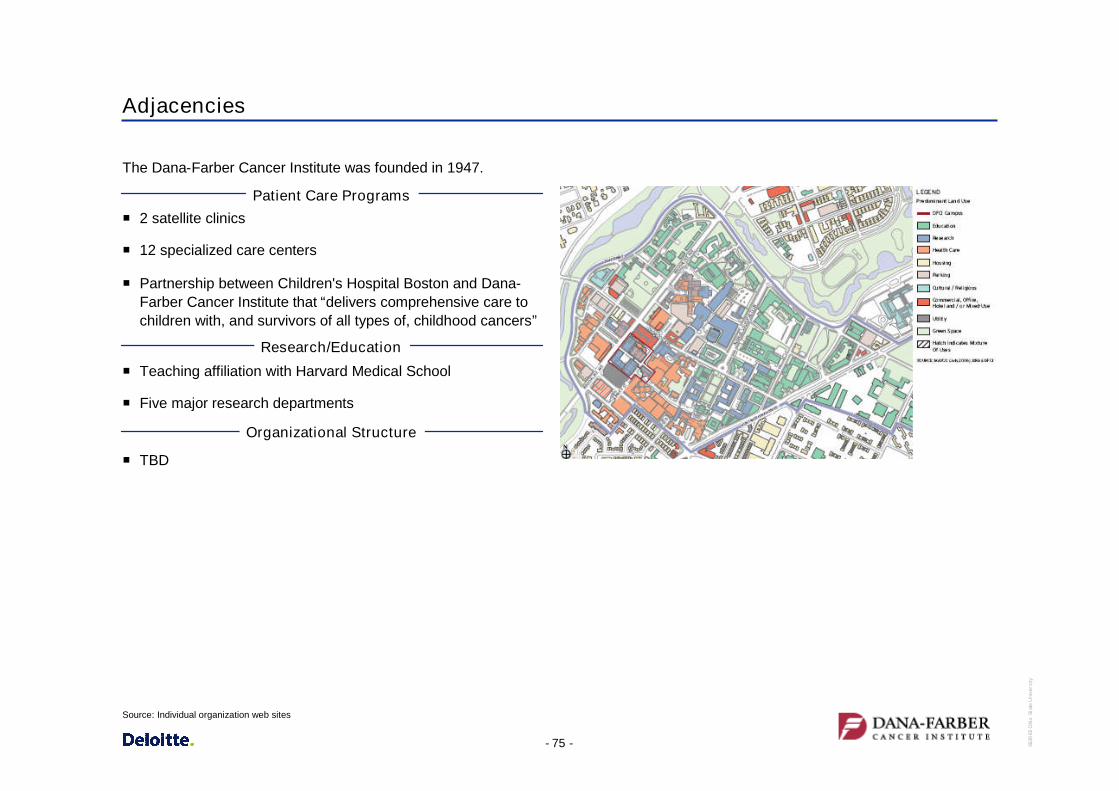
- 75 - 3639
65O
hio
Stat
eU
nive
rsity
Adjacencies
The Dana-Farber Cancer Institute was founded in 1947.
Patient Care Programs
2 satellite clinics
12 specialized care centers
Partnership between Children's Hospital Boston and Dana-Farber Cancer Institute that “delivers comprehensive care tochildren with, and survivors of all types of, childhood cancers”
Research/Education
Organizational Structure
Teaching affiliation with Harvard Medical School
Five major research departments
TBD
Source: Individual organization web sites

- 76 - 3639
65O
hio
Stat
eU
nive
rsity
Adjacencies
The Memorial Sloan-Kettering Cancer Center opened in 1884,and is the world's oldest and largest private cancer center.
Patient Care Programs
Five Outpatient Centers
Treats treat more than 400 different subtypes of cancer everyyear
Research/Education
Organizational Structure
Eight Research Programs
Academic Medical Center
Affiliation with:
– New York-Presbyterian Hospital
– The University Hospital of Columbia
– Weill Cornell Medical College of Cornell University
– Hospital for Special Surgery
– The Rockefeller University
TBD
Source: http://www.mskcc.org. May 3, 2007.

- 77 - 3639
65O
hio
Stat
eU
nive
rsity
Adjacencies
Patient Care Programs
Bone Marrow Transplant Program is the largest transplantprogram in the World
Research/Education
Organizational Structure
Research partners, the University of Washington andChildren's Hospital and Regional Medical Center
Focus on eight research initiatives
A member of the Seattle Cancer Care Alliance
Source: http://www.mskcc.org. May 3, 2007.

- 78 - 3639
65O
hio
Stat
eU
nive
rsity
Adjacencies
Patient Care Programs
A Cancer Counseling Center, survivors and palliative careprograms, and two residences for patients traveling from out-of-town to receive treatment
Research/Education
Organizational Structure
Six areas of cancer discovery
Built two new facilities in 1999 and 2000
John Hopkins University
Source: http://www.mskcc.org. May 3, 2007.

- 79 - 3639
65O
hio
Stat
eU
nive
rsity
Adjacencies
Located in Houston, Texas, The M. D. Anderson Cancer Centerwas created by the Texas Legislature in 1941 as a component ofThe University of Texas System.
Patient Care Programs
Facilities include an in-patient pavilion with 512 beds, two research buildings, an outpatient clinic building, a faculty office buildingand a patient-family hotel.
Research/Education
Organizational Structure
575 Laboratories
Building an institute 1.5 miles south of campus, to house six unique centers: genomics, proteomics, screening, diagnostic imagingand drug development
Runs jointly with The University of Texas Health Science Center at Houston
Part of The University of Texas System
Source: http://www.dana-farber.org/ May 3, 2007.
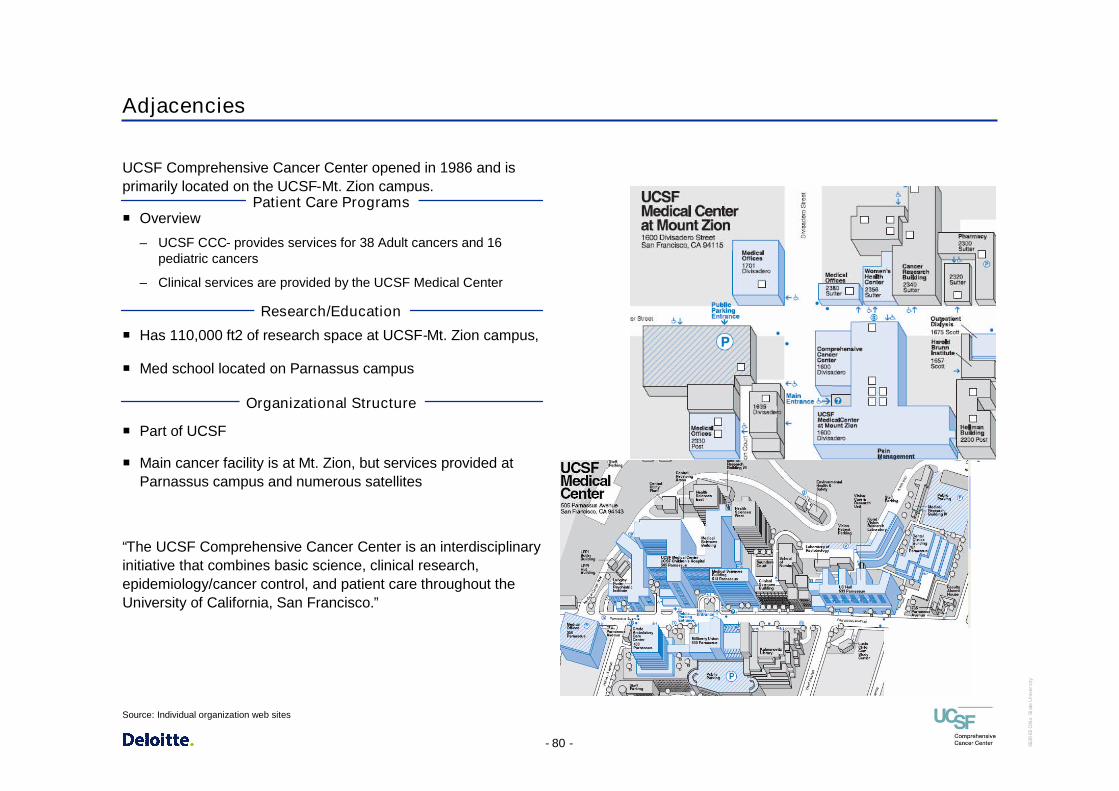
- 80 - 3639
65O
hio
Stat
eU
nive
rsity
Adjacencies
UCSF Comprehensive Cancer Center opened in 1986 and isprimarily located on the UCSF-Mt. Zion campus.
Patient Care ProgramsOverview
– UCSF CCC- provides services for 38 Adult cancers and 16pediatric cancers
– Clinical services are provided by the UCSF Medical Center
Research/Education
Organizational Structure
Has 110,000 ft2 of research space at UCSF-Mt. Zion campus,
Med school located on Parnassus campus
Part of UCSF
Main cancer facility is at Mt. Zion, but services provided atParnassus campus and numerous satellites
“The UCSF Comprehensive Cancer Center is an interdisciplinaryinitiative that combines basic science, clinical research,epidemiology/cancer control, and patient care throughout theUniversity of California, San Francisco.”
Source: Individual organization web sites
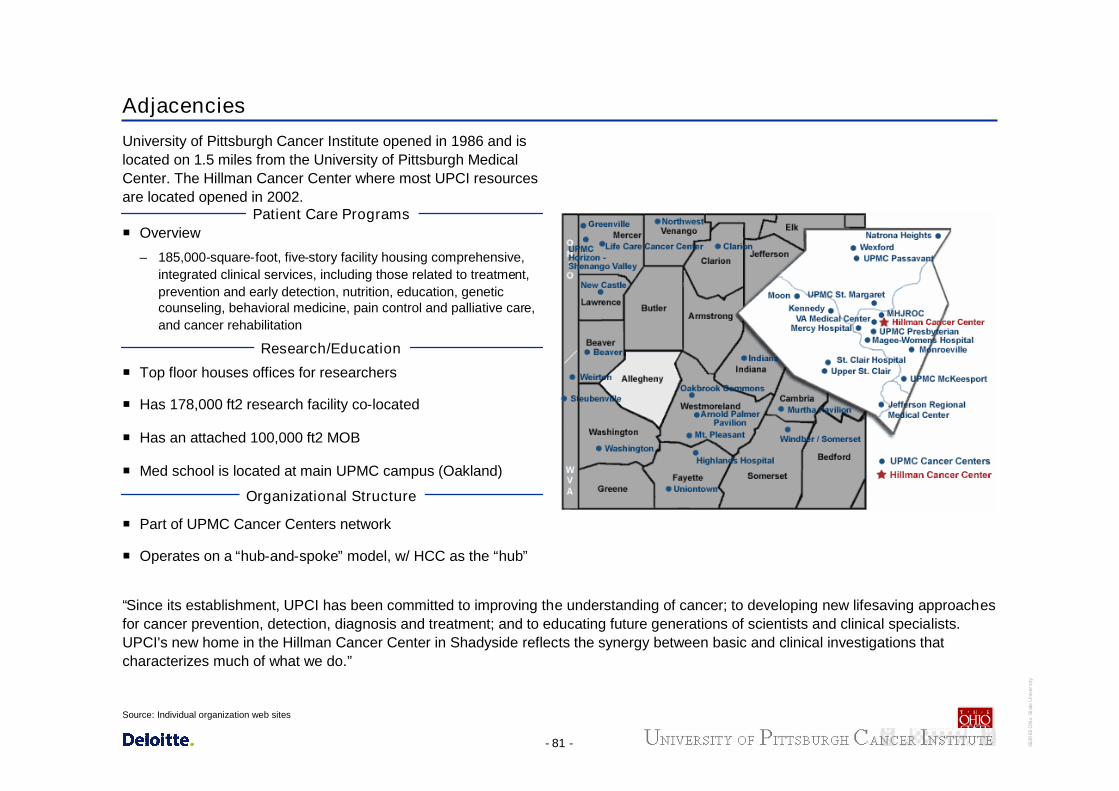
- 81 - 3639
65O
hio
Stat
eU
nive
rsity
Adjacencies
University of Pittsburgh Cancer Institute opened in 1986 and islocated on 1.5 miles from the University of Pittsburgh MedicalCenter. The Hillman Cancer Center where most UPCI resourcesare located opened in 2002.
Patient Care ProgramsOverview
– 185,000-square-foot, five-story facility housing comprehensive,integrated clinical services, including those related to treatment,prevention and early detection, nutrition, education, geneticcounseling, behavioral medicine, pain control and palliative care,and cancer rehabilitation
Research/Education
Organizational Structure
Top floor houses offices for researchers
Has 178,000 ft2 research facility co-located
Has an attached 100,000 ft2 MOB
Med school is located at main UPMC campus (Oakland)
Part of UPMC Cancer Centers network
Operates on a “hub-and-spoke” model, w/ HCC as the “hub”
“Since its establishment, UPCI has been committed to improving the understanding of cancer; to developing new lifesaving approachesfor cancer prevention, detection, diagnosis and treatment; and to educating future generations of scientists and clinical specialists.UPCI's new home in the Hillman Cancer Center in Shadyside reflects the synergy between basic and clinical investigations thatcharacterizes much of what we do.”
Source: Individual organization web sites