STEEL MARKET DEVELOPMENTS crude steel production developments in 2016.....15 Table 3. Steel trade...
41
STEEL MARKET DEVELOPMENTS Q4 2017
Transcript of STEEL MARKET DEVELOPMENTS crude steel production developments in 2016.....15 Table 3. Steel trade...
STEEL MARKET DEVELOPMENTS
Q4 2017
STEEL MARKET DEVELOPMENTS – Q4 2017
2
STEEL MARKET DEVELOPMENTS
Q4 2017
by Fabien Mercier, Hokuto Hotsuka and Filipe Silva OECD, Paris
This document, as well as any data and any map included herein, are without prejudice to the status of or
sovereignty over any territory, to the delimitation of international frontiers and boundaries and to the name of any territory, city or area.
© OECD 2018
You can copy, download or print OECD content for your own use, and you can include excerpts from
OECD publications, databases and multimedia products in your own documents, presentations, blogs, websites and teaching materials, provided that suitable acknowledgment of OECD as source and copyright
owner is given. All requests for commercial use and translation rights should be submitted to
STEEL MARKET DEVELOPMENTS – Q4 2017
3
TABLE OF CONTENTS
STEEL MARKET DEVELOPMENTS Q4 2017 ........................................................................................ 2
RECENT MARKET DEVELOPMENTS IN THE GLOBAL STEEL INDUSTRY .................................... 5
Summary ................................................................................................................................................ 5 1. The economic outlook remains weak .................................................................................................. 6 2. Developments in steel markets ............................................................................................................ 8
2.1. Steel consumption ...................................................................................................................... 10 2.2. Steel production ......................................................................................................................... 13 2.3. World steel trade ........................................................................................................................ 15 2.4. Steel prices................................................................................................................................. 17
3. Financial performance of steel companies ......................................................................................... 22 3.1. Profitability ................................................................................................................................ 22 3.2. Indebtedness .............................................................................................................................. 24
4. The global excess capacity situation: a brief overview ...................................................................... 26 5. The steel market outlook................................................................................................................... 28 6. Brief overview of selected downstream sectors ................................................................................. 31
6.1. Construction............................................................................................................................... 31 6.2. Automotive ................................................................................................................................ 32 6.3. Oil and gas ................................................................................................................................. 33 6.4. Shipbuilding............................................................................................................................... 34
7. Concluding remarks.......................................................................................................................... 35 References ........................................................................................................................................... 36
ANNEX 1: FINANCIAL DATA ............................................................................................................. 38
ANNEX 2: GRANGER CAUSALITY TESTS ON PMI INDICES .......................................................... 39
NOTES.................................................................................................................................................... 40
Tables
Table 1. OECD Economic Projections, June 2017 ............................................................................ 8 Table 2. World crude steel production developments in 2016 .......................................................... 15 Table 3. Steel trade developments across major steel producing economies) ................................... 17 Table 4. Latest forecasts for regional apparent steel use by the World Steel Association ................. 28
Figures
Figure 1. World industrial production, trade, and trade prices ............................................................. 6 Figure 2. Steel Purchasing Managers’ indices (PMIs)......................................................................... 9 Figure 3. Apparent steel use (finished steel products) ....................................................................... 10 Figure 4. Consumption of hot-rolled steel products, major economies .............................................. 11 Figure 5. Value added by sector, China ............................................................................................ 12 Figure 6. Global steel production ..................................................................................................... 14 Figure 7. World exports of steel: monthly volume (mmt) and export ratio (% of production) ............ 16 Figure 8. World steel prices (latest month July 2017) ....................................................................... 18 Figure 9. Steel price index for flat products, by region ..................................................................... 19 Figure 10. Key raw material price indicators .................................................................................. 20
STEEL MARKET DEVELOPMENTS – Q4 2017
4
Figure 11. Margin between steel and raw materials prices .............................................................. 21 Figure 12. Evolution of operating profits between 2000 and 2016 .................................................. 22 Figure 13. Evolution of net profits between 2000 and 2016 ............................................................ 23 Figure 14. Distribution of net profits in selected years .................................................................... 24 Figure 15. Evolution of indebtedness between 2000 and 2016 ........................................................ 25 Figure 16. Evolution of crude steelmaking capacity in OECD and non-OECD economies .............. 26 Figure 17. Global crude steelmaking capacity and crude steel production ....................................... 27 Figure 18. Chinese and Indian investment into real estate ............................................................... 31 Figure 19. Growth in new building permits or new house started in selected developed economies. 32 Figure 20. Car production in selected economies ............................................................................ 33 Figure 21. Oil and gas prices and oil rig count................................................................................ 34 Figure 22. Ship completions and future vessel requirements ........................................................... 34
STEEL MARKET DEVELOPMENTS – Q4 2017
5
RECENT MARKET DEVELOPMENTS IN THE GLOBAL STEEL INDUSTRY
Summary
Steel market conditions have improved slightly and there are signs of recovery in several markets. It is uncertain whether the recovery is robust and sustainable, with important headwinds related to financial
vulnerabilities and the slow pace of adjustment of capacity to demand. This document provides an
overview of recent steel market developments, as well as additional information about financial
vulnerabilities, the latest developments in global steelmaking capacity and a brief overview of developments in selected downstream sectors. Key developments discussed in this report include:
The economic outlook remains weak, but recent months have seen a modest improvement in
global economic growth, both in advanced and in emerging economies, after years of
sluggish data. OECD forecasts for the economic outlook have been revised upwards since March 2017, albeit only slightly.
The recovery in steel demand observed during the second and third quarters of 2016 appears
to be supported by 2017 data. Production data for the first six months of 2017 suggests that
world steel production continued to recover, growing by 4.3% when compared to the same period in 2016. This increase suggests that the global steel industry is on a path of a moderate
recovery. However, important structural imbalances remain unaddressed.
Global steel exports have been declining throughout 2016, a trend that continued during the
first months of 2017. A number of trade remedies have been introduced during 2015 and
2016 to alleviate the injury to domestic industries caused by unfair pricing practices or government subsidisation.
Steel prices continued to increase in 2017, despite a correction during the first quarter of the
year. The world steel price index, which had been trending downwards since the second
quarter of 2011, bottomed out in December 2015 and has been recovering since then. Iron ore and coking coal prices have been declining since the beginning of 2017 after a strong
performance in 2016, while ferrous scrap prices remain buoyant.
The financial situation in the steel sector has improved, but remains fragile. Removing
barriers to exit would help ensure the survival of the fittest companies and the viability of the sector. The latest available data suggest that global steelmaking capacity has finally started to
adjust to lower levels of production and demand. However, this adjustment still falls short of
alleviating the global excess capacity challenge significantly.
The two-year period from 2017 to 2018 is expected to be characterised by a modest recovery
in global steel demand growth, according to the World Steel Association's April 2017 Short Range Outlook. World steel demand is projected to grow by 1.3% in 2017 followed by 0.9%
in 2018. No substantial gains in terms of steel demand are expected to come from the main
steel using sectors in the short- and medium-term.
STEEL MARKET DEVELOPMENTS – Q4 2017
6
1. The economic outlook remains weak
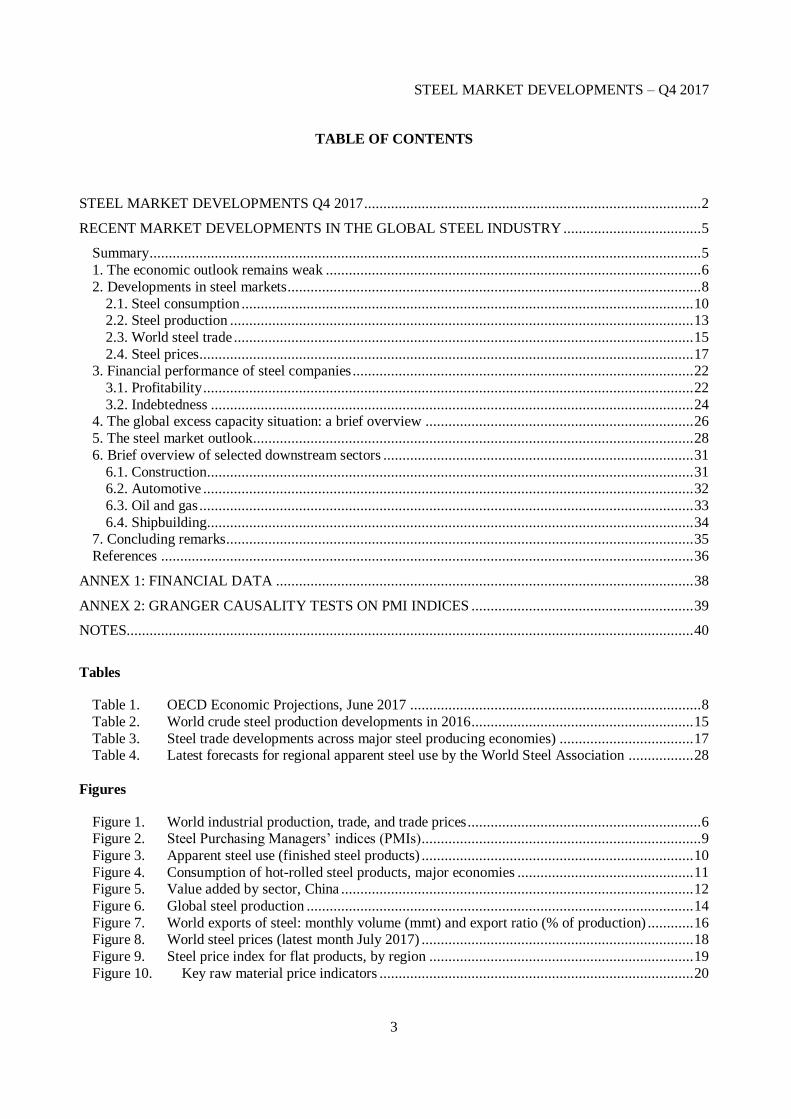
Recent months have seen a modest pick-up in global economic growth, both in advanced and in
emerging economies, after years of sluggish developments. World industrial production has improved in recent months, mostly driven by industrial output in advanced economies (Figure 1). Global trade and
commodity prices have also picked up since the last year, despite increasing trade frictions.
Figure 1. World industrial production, trade, and trade prices
% change from one year earlier
Source: Netherlands Bureau for Economic Policy Analysis (CPB).
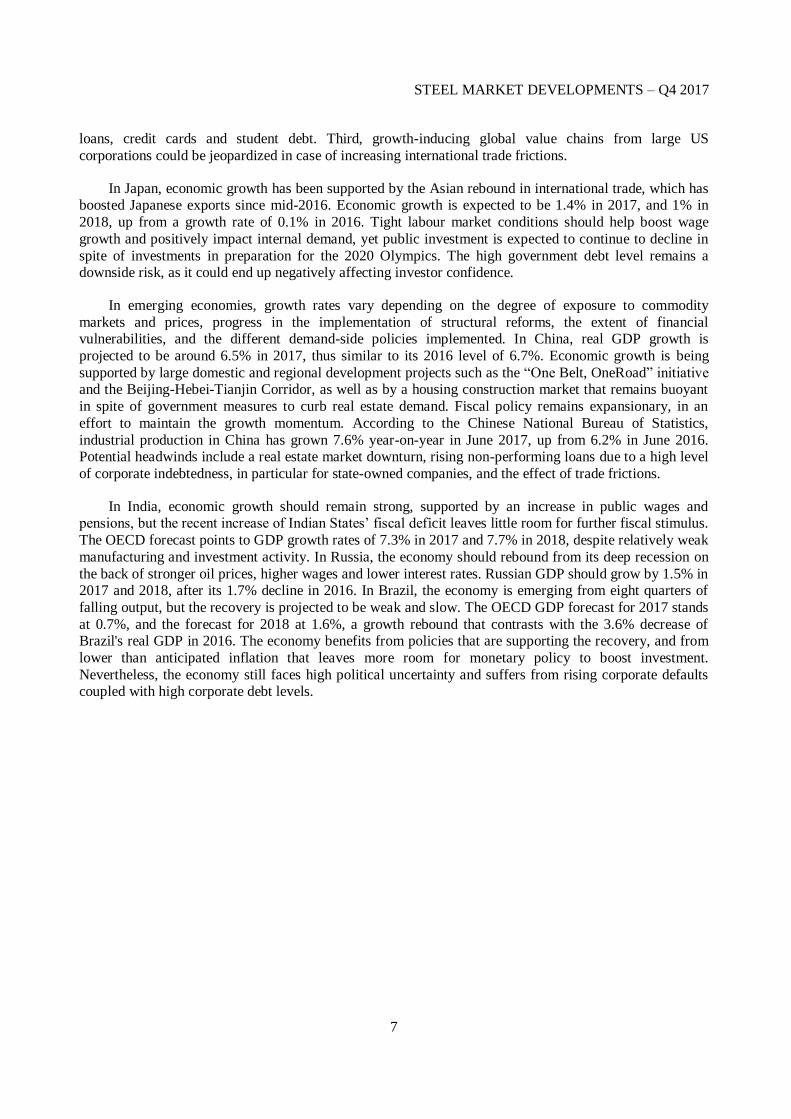
According to the OECD’s June 2017 Economic Outlook, world GDP growth is expected to remain
relatively weak, despite a gradual improvement from 3% in 2016 to a projected 3.5% in 2017 and 3.6% in
2018 (see Table 1 below for the latest OECD GDP growth forecasts). The OECD revised its forecasts for global growth in 2017 slightly upwards compared to the 3.3% growth projected in the OECD's March 2017
Interim Economic Outlook.
In the euro area, the ongoing moderate recovery should continue, with GDP growth reaching 1.8% per annum in both 2017 and in 2018, only marginally up from 1.7% in 2016. Growth in the region is being
supported by monetary policy that remains highly accommodative, some fiscal easing, and strong export
orders. Nevertheless high unemployment, particularly among the youth, and low real wage growth could
negatively affect domestic demand. Stronger growth in non-EU markets, particularly in Asia and in the United States, would help support export growth, but its effects could be mitigated by weaker-than-
expected demand growth in the United Kingdom due to the uncertainty surrounding the country’s future
relationship with the European Union.
In the United States, GDP growth projections stand at 2.1% in 2017 and 2.4% in 2018, thus
significantly higher than the growth rate of 1.6% registered in 2016. The OECD forecasts the US fiscal
stance to remain neutral in 2017 and becoming accommodative in 2018, thus supporting both domestic
consumption and investments. The end of the recent upswing in the external value of the US dollar should help boost US exports. Three main downside risks to domestic demand remain. First, the trend of
decreasing unemployment, which should have boosted household real income, has been largely offset by a
decreasing participation rate and the substitution of part-time jobs for full time jobs.1 Second, total
household debt has returned to its 2008 highs and is growing, particularly from the contribution of auto
-20
-15
-10
-5
0
5
10
15
20
%Industrial production (3 month moving average )
World Advanced economies Emerging & Developing economies
-25
-20
-15
-10
-5
0
5
10
15
20
25
%World trade and unit price in USD (3 month average )
World trade Trade prices (unit value in USD)
STEEL MARKET DEVELOPMENTS – Q4 2017
7
loans, credit cards and student debt. Third, growth-inducing global value chains from large US
corporations could be jeopardized in case of increasing international trade frictions.
In Japan, economic growth has been supported by the Asian rebound in international trade, which has boosted Japanese exports since mid-2016. Economic growth is expected to be 1.4% in 2017, and 1% in
2018, up from a growth rate of 0.1% in 2016. Tight labour market conditions should help boost wage
growth and positively impact internal demand, yet public investment is expected to continue to decline in
spite of investments in preparation for the 2020 Olympics. The high government debt level remains a downside risk, as it could end up negatively affecting investor confidence.
In emerging economies, growth rates vary depending on the degree of exposure to commodity
markets and prices, progress in the implementation of structural reforms, the extent of financial vulnerabilities, and the different demand-side policies implemented. In China, real GDP growth is
projected to be around 6.5% in 2017, thus similar to its 2016 level of 6.7%. Economic growth is being
supported by large domestic and regional development projects such as the “One Belt, OneRoad” initiative and the Beijing-Hebei-Tianjin Corridor, as well as by a housing construction market that remains buoyant
in spite of government measures to curb real estate demand. Fiscal policy remains expansionary, in an
effort to maintain the growth momentum. According to the Chinese National Bureau of Statistics,
industrial production in China has grown 7.6% year-on-year in June 2017, up from 6.2% in June 2016. Potential headwinds include a real estate market downturn, rising non-performing loans due to a high level
of corporate indebtedness, in particular for state-owned companies, and the effect of trade frictions.
In India, economic growth should remain strong, supported by an increase in public wages and pensions, but the recent increase of Indian States’ fiscal deficit leaves little room for further fiscal stimulus.
The OECD forecast points to GDP growth rates of 7.3% in 2017 and 7.7% in 2018, despite relatively weak
manufacturing and investment activity. In Russia, the economy should rebound from its deep recession on
the back of stronger oil prices, higher wages and lower interest rates. Russian GDP should grow by 1.5% in 2017 and 2018, after its 1.7% decline in 2016. In Brazil, the economy is emerging from eight quarters of
falling output, but the recovery is projected to be weak and slow. The OECD GDP forecast for 2017 stands
at 0.7%, and the forecast for 2018 at 1.6%, a growth rebound that contrasts with the 3.6% decrease of Brazil's real GDP in 2016. The economy benefits from policies that are supporting the recovery, and from
lower than anticipated inflation that leaves more room for monetary policy to boost investment.
Nevertheless, the economy still faces high political uncertainty and suffers from rising corporate defaults coupled with high corporate debt levels.
STEEL MARKET DEVELOPMENTS – Q4 2017
8
Table 1. OECD Economic Projections, June 2017
Real GDP growth (year-on-year)
Notes: 1. Moving nominal GDP weights using purchasing power parities.
2. Fiscal years starting in April. Source: OECD Economic Outlook, June 2017.
2. Developments in steel markets
Steel market sentiment has improved since 2016, potentially pushed higher by the increase of steel
prices, modest improvements in steel demand and expectations about capacity reductions. However, the
improvement could prove temporary given the extent of the unaddressed underlying structural imbalances coupled with sluggish demand growth in the years to come.
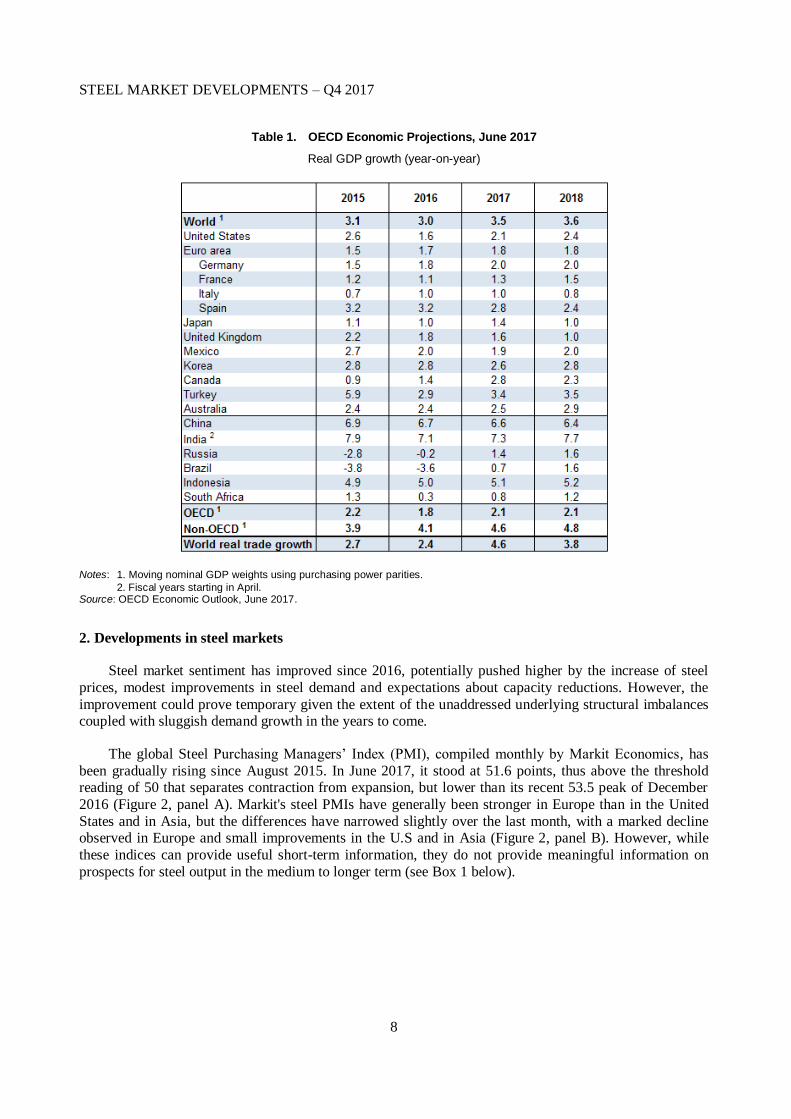
The global Steel Purchasing Managers’ Index (PMI), compiled monthly by Markit Economics, has
been gradually rising since August 2015. In June 2017, it stood at 51.6 points, thus above the threshold reading of 50 that separates contraction from expansion, but lower than its recent 53.5 peak of December
2016 (Figure 2, panel A). Markit's steel PMIs have generally been stronger in Europe than in the United
States and in Asia, but the differences have narrowed slightly over the last month, with a marked decline observed in Europe and small improvements in the U.S and in Asia (Figure 2, panel B). However, while
these indices can provide useful short-term information, they do not provide meaningful information on
prospects for steel output in the medium to longer term (see Box 1 below).
STEEL MARKET DEVELOPMENTS – Q4 2017
9
Figure 2. Steel Purchasing Managers’ indices (PMIs)
A. Global Steel PMI B. Steel PMI, selected economies
Source: Markit Economics.
Box 1. PMI indices
Markit PMI indices, with the exceptions of those concerning future output, are built from purchasing manager’s answers to questions such as: “is your current output (respectively: the amount of your new orders, your output price, the number of your employees, the average delivery times of your suppliers, the level of stocks of your purchases) higher / the same / lower than during the previous months”. Although answers are qualitative, they are meant to depend only on current (undisclosed) hard data accessible to Purchasing Managers. For each type of question, Markit defines numerical indices from its received qualitative answers through the formula:
INDEX = (Percentage responding ‘Higher’) + (Percentage responding ‘Same’)*0.5
Indices precisely equal to 50 should indicate a similar level this month compared to the month before, as the percentage of purchasing managers having answered higher equals the one having answered lower. Indices higher than 50 should denote an expansion and those below 50 a contraction. Markit then applies a method, based on the US Census Bureau X-12 ARIMA method, to obtain the seasonally adjusted indices. The interpretation of the seasonally adjusted indices nevertheless remains unchanged: indices above 50 indicate expansion whereas indices below 50 indicate contraction. The global index (Figure 2 above) is then computed as a weighted average of its individual sub-indices: new orders (30%), output (25%), employment (20%), supplier’s delivery times (15%) and stock of purchase (10%).
By construction, Markit PMI is a short-term indicator. In practice, Granger-causality tests performed in a vector autoregressive (VAR) setting that includes year-on-year price changes and production quantity changes confirm that current and past Markit PMI values are useful for predicting steel output quantities and prices for the current and the next month. These tests also indicate that only the global steel PMI index helps forecast both prices and quantities (see Annex 2). Other Markit PMI indices are built from answers of purchasing managers to questions such has “where do you see the future output of your firm 12 month ahead compared to your current situation.” Although those indices should be more forward looking, they unfortunately are not compiled separately for the steel sector (and instead assess the situation of the whole industrial sector).
35
40
45
50
55
60
25
30
35
40
45
50
55
60
65
Europe US Asia
STEEL MARKET DEVELOPMENTS – Q4 2017
10
2.1. Steel consumption
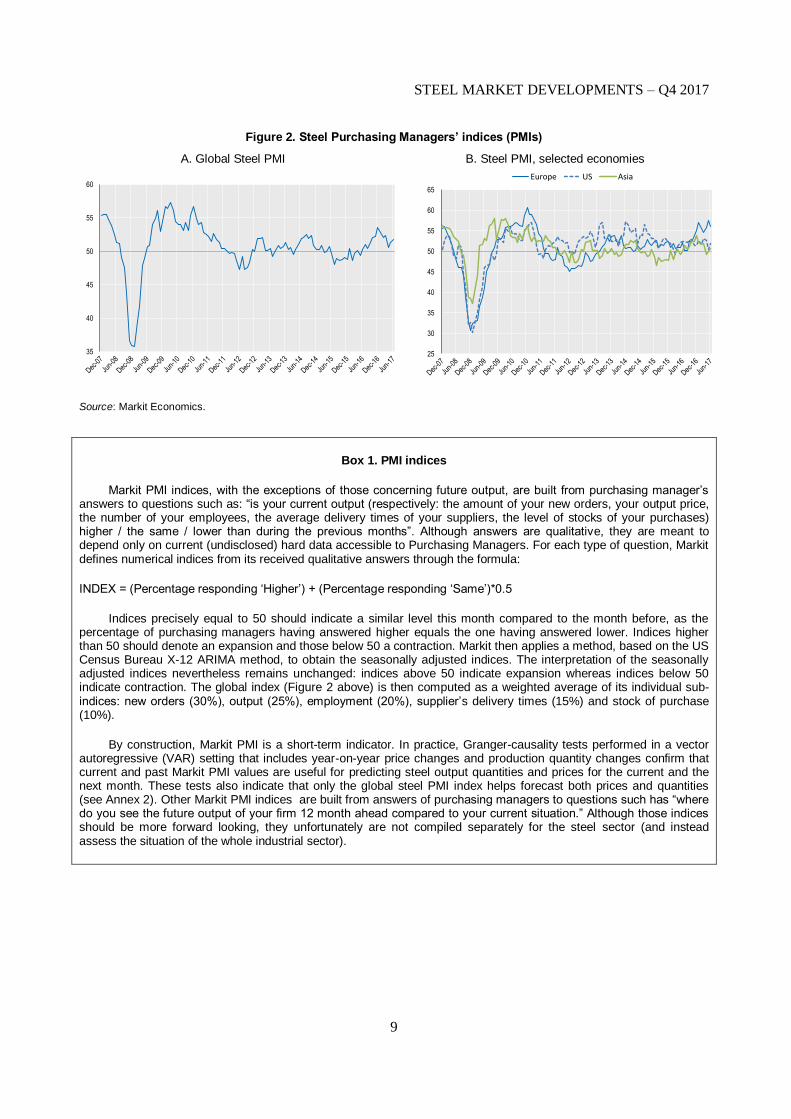
After the decline in global steel consumption during 2015, demand for steel products around the
world has recovered in 2016 to 1 515 mmt (Figure 3). Global steel demand is still below the peak attained in 2014 (1 546 mmt), but the recovery observed during the second and third quarters of 2016 appears to be
supported by 2017 data. This uptake was, however, felt differently across regions. In 2016 global steel
demand was supported by China (1% growth rate), India (4.1%), the European Union (2.2%), as well as
the ASEAN economies (11.4%). Demand growth in these regions was balanced by declining steel demand across important steel-consuming economies in Latin America (13.6%), the CIS (4.1%) and NAFTA
(1.6%). Steel demand also decreased in the Middle East (1.3%) and in Africa (2.1%).
Figure 3. Apparent steel use (finished steel products)
Source: World Steel Association
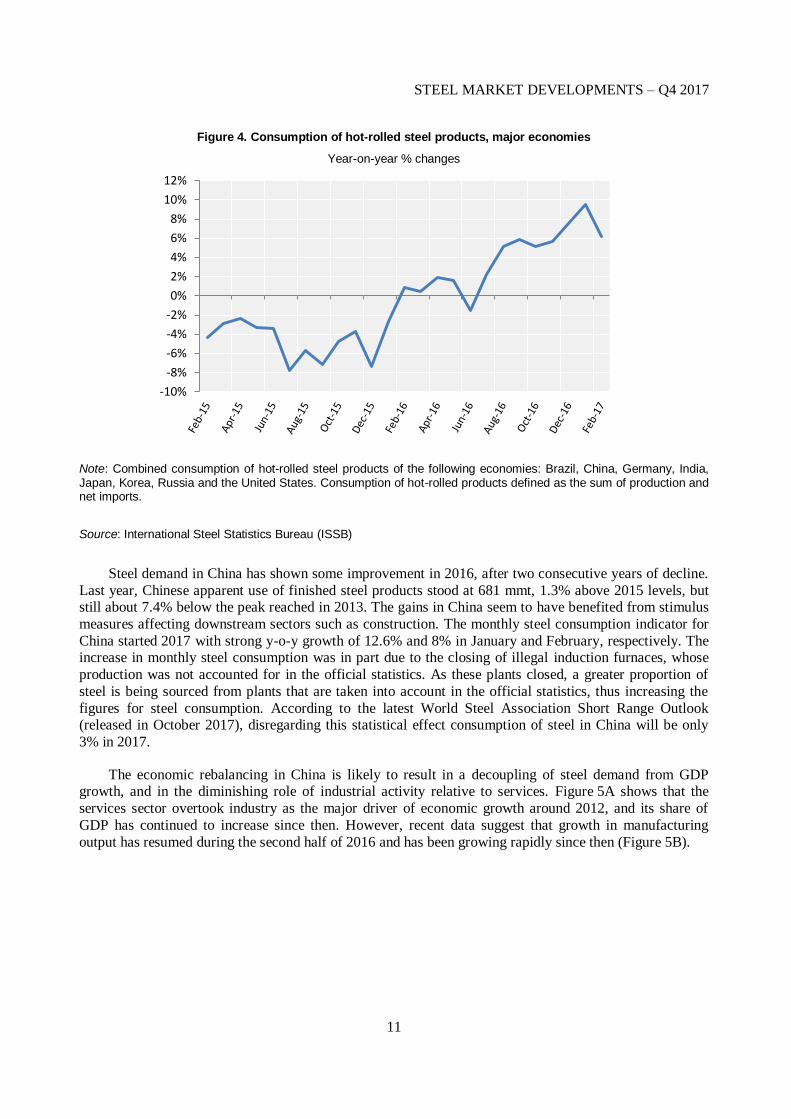
Data for the first two months of 2017 suggest that steel demand continues to recover. Figure 4 presents the year-on-year per cent change in the combined consumption of hot-rolled products for eight of
the world’s largest steel-consuming economies in Asia, the CIS region, Europe, North America, and South
America, which together account for approximately 72% of global steel demand.2 Year-on-year growth
figures have been above 5% since August 2016, mostly driven by the recovery in Chinese demand, which
accounts for 45% of global steel demand. In the first two months of this year, the monthly consumption
indicator for the major steel-consuming economies has been strong, growing at 9.6% in January and 6.2%
in February, when compared to 2016 figures.
0
200
400
600
800
1 000
1 200
1 400
1 600
1 800
ROW
Latin America
Middle East
CIS
NAFTA
EU
Asia (excl. CHN)
China
STEEL MARKET DEVELOPMENTS – Q4 2017
11
Figure 4. Consumption of hot-rolled steel products, major economies
Year-on-year % changes
Note: Combined consumption of hot-rolled steel products of the following economies: Brazil, China, Germany, India, Japan, Korea, Russia and the United States. Consumption of hot-rolled products defined as the sum of production and net imports.
Source: International Steel Statistics Bureau (ISSB)
Steel demand in China has shown some improvement in 2016, after two consecutive years of decline.
Last year, Chinese apparent use of finished steel products stood at 681 mmt, 1.3% above 2015 levels, but still about 7.4% below the peak reached in 2013. The gains in China seem to have benefited from stimulus
measures affecting downstream sectors such as construction. The monthly steel consumption indicator for
China started 2017 with strong y-o-y growth of 12.6% and 8% in January and February, respectively. The increase in monthly steel consumption was in part due to the closing of illegal induction furnaces, whose
production was not accounted for in the official statistics. As these plants closed, a greater proportion of
steel is being sourced from plants that are taken into account in the official statistics, thus increasing the
figures for steel consumption. According to the latest World Steel Association Short Range Outlook (released in October 2017), disregarding this statistical effect consumption of steel in China will be only
3% in 2017.
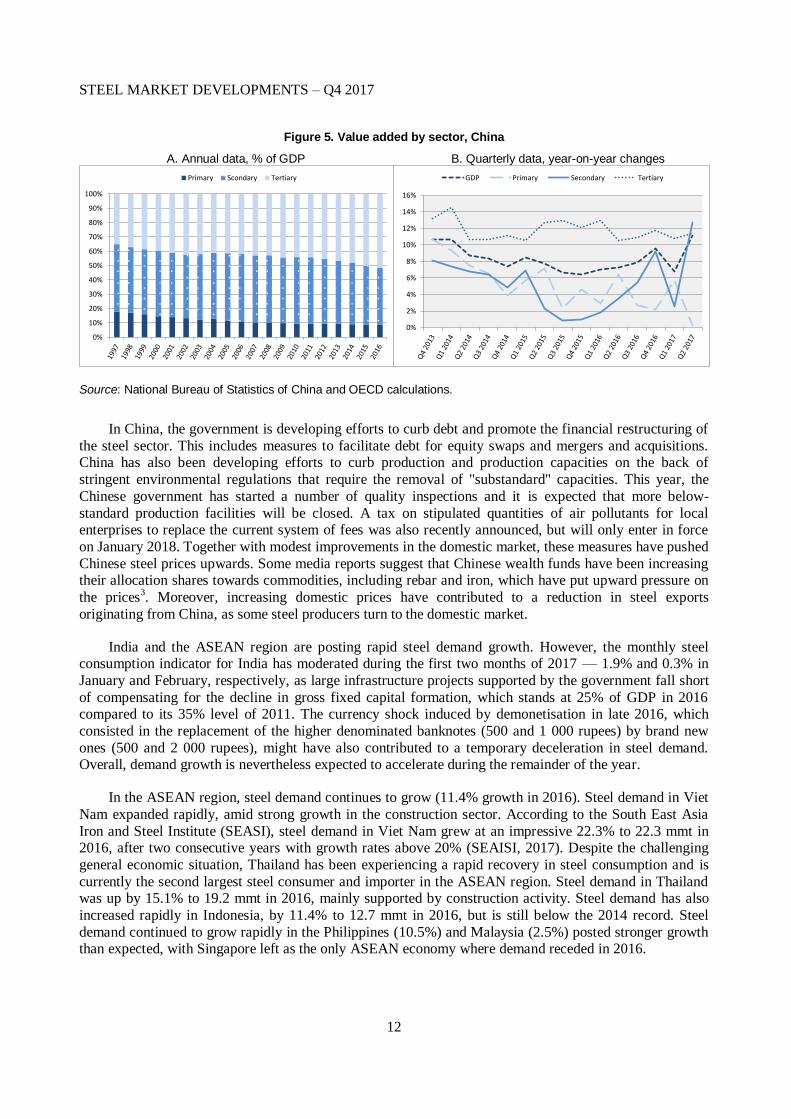
The economic rebalancing in China is likely to result in a decoupling of steel demand from GDP growth, and in the diminishing role of industrial activity relative to services. Figure 5A shows that the
services sector overtook industry as the major driver of economic growth around 2012, and its share of
GDP has continued to increase since then. However, recent data suggest that growth in manufacturing
output has resumed during the second half of 2016 and has been growing rapidly since then (Figure 5B).
-10%
-8%
-6%
-4%
-2%
0%
2%
4%
6%
8%
10%
12%
STEEL MARKET DEVELOPMENTS – Q4 2017
12
Figure 5. Value added by sector, China
A. Annual data, % of GDP B. Quarterly data, year-on-year changes
Source: National Bureau of Statistics of China and OECD calculations.
In China, the government is developing efforts to curb debt and promote the financial restructuring of
the steel sector. This includes measures to facilitate debt for equity swaps and mergers and acquisitions. China has also been developing efforts to curb production and production capacities on the back of
stringent environmental regulations that require the removal of "substandard" capacities. This year, the
Chinese government has started a number of quality inspections and it is expected that more below-
standard production facilities will be closed. A tax on stipulated quantities of air pollutants for local enterprises to replace the current system of fees was also recently announced, but will only enter in force
on January 2018. Together with modest improvements in the domestic market, these measures have pushed
Chinese steel prices upwards. Some media reports suggest that Chinese wealth funds have been increasing their allocation shares towards commodities, including rebar and iron, which have put upward pressure on
the prices3. Moreover, increasing domestic prices have contributed to a reduction in steel exports
originating from China, as some steel producers turn to the domestic market.
India and the ASEAN region are posting rapid steel demand growth. However, the monthly steel consumption indicator for India has moderated during the first two months of 2017 — 1.9% and 0.3% in
January and February, respectively, as large infrastructure projects supported by the government fall short
of compensating for the decline in gross fixed capital formation, which stands at 25% of GDP in 2016 compared to its 35% level of 2011. The currency shock induced by demonetisation in late 2016, which
consisted in the replacement of the higher denominated banknotes (500 and 1 000 rupees) by brand new
ones (500 and 2 000 rupees), might have also contributed to a temporary deceleration in steel demand. Overall, demand growth is nevertheless expected to accelerate during the remainder of the year.
In the ASEAN region, steel demand continues to grow (11.4% growth in 2016). Steel demand in Viet
Nam expanded rapidly, amid strong growth in the construction sector. According to the South East Asia
Iron and Steel Institute (SEASI), steel demand in Viet Nam grew at an impressive 22.3% to 22.3 mmt in 2016, after two consecutive years with growth rates above 20% (SEAISI, 2017). Despite the challenging
general economic situation, Thailand has been experiencing a rapid recovery in steel consumption and is
currently the second largest steel consumer and importer in the ASEAN region. Steel demand in Thailand was up by 15.1% to 19.2 mmt in 2016, mainly supported by construction activity. Steel demand has also
increased rapidly in Indonesia, by 11.4% to 12.7 mmt in 2016, but is still below the 2014 record. Steel
demand continued to grow rapidly in the Philippines (10.5%) and Malaysia (2.5%) posted stronger growth than expected, with Singapore left as the only ASEAN economy where demand receded in 2016.
0%
10%
20%
30%
40%
50%
60%
70%
80%
90%
100%
Primary Scondary Tertiary
0%
2%
4%
6%
8%
10%
12%
14%
16%
GDP Primary Secondary Tertiary
STEEL MARKET DEVELOPMENTS – Q4 2017
13
Steel demand is recovering in Latin America after a very difficult 2016, when steel demand
contracted by 13.6%, driven by a sharp decline in Brazil (14.6%) and Argentina (20.8%). According to
ALACERO, steel consumption in Latin America grew by 7% between January and April 2017 compared to the previous year (ALACERO, 2017). In Brazil, the largest steel-consuming economy in South America,
steel demand recovered during the first quarter of the year (5% y-o-y) according to the Brazilian Steel
Institute (Aço Brasil, 2017). According to data from ALACERO, steel demand also increased in Colombia
(7%) and Chile (3%), having decreased in Peru (7%) during the first four months of the year. Steel consumption in Argentina has continued to decline during the first months of 2017 (11%). Stronger steel
consumption in Latin America this year has resulted in higher imports.
In the Middle East, steel consumption has been affected by low oil prices and instability in the region. Steel demand decreased by 1.3% in the Middle East last year, with Iranian steel demand declining by 3%,
amidst lower demand from the construction sector. The decline in steel demand in the CIS (4.1%) was
driven by Russia (4%) and with Ukraine recovering to 2014 levels (30% growth). In Africa, steel demand also contracted by 2.1%, with demand falling by 5.7% in South Africa, but growing by 7.3% in Egypt. In
Egypt, steel demand has benefited from a stabilisation of the economy, as the economic reform programme
is implemented. In South Africa, the steel sector has been suffering from lower demand from the
construction, mining and utilities sectors, as well as subdued economic activity in general.
Across the OECD, steel demand developments in 2016 were mixed, but the first months of 2017 were
in general more positive, with steel demand growth observed in the largest steel-consuming OECD
economies. In the first half of 2017, the automotive and construction (residential) sectors in the European Union performed above expectations, while a number of pipeline projects contributed to strong growth of
the tube sector. The construction and automotive sectors also contributed positively to apparent steel
consumption, which grew by 3.1% y-o-y during the first quarter of 2017 (EUROFER, 2017).4 Steel
demand in the NAFTA region declined by 1.6% in 2016. Demand growth in Canada (14.3%) and Mexico (2.4%) was not sufficient to compensate for the decline in the United States (4.7%). The monthly steel
consumption indicator for the United States started 2017 strongly and the recovery in steel demand is
expected to continue. The construction sector in the United States performed quite well during the first months of 2017 and domestic steel prices also benefited from restocking by service centres.
Steel demand in Turkey contracted by 0.9% in 2016 (finished steel products), but the first half of 2017
saw rapid growth in the automotive sector. In Japan, apparent steel use (crude steel equivalent) has contracted by 0.2% in 2016, while steel demand based on ordinary carbon steel orders data suggests that
Japan’s steel demand increased slightly in 2016, according to data from the Japan Iron and Steel Federation
(JISF). Japanese steel demand benefited from improvements in the construction sector, where ordinary
carbon steel orders were up by 2.5%, driven by public works in the second half of 2016 (JISF, 2017). An increase in orders from the manufacturing sector, especially for the automotive sector also contributed to
Japanese steel demand growth. Ordinary carbon steel orders from the manufacturing sector continued to
increase firmly during the first six months of 2017, compared to the same period in 2016. Steel consumption of finished steel products in Korea declined by 2.3% and has been affected by a broad-based
contraction in major steel-using sectors in 2016, as political uncertainty, corporate restructuring and a drop
in exports affected the economy.
2.2. Steel production
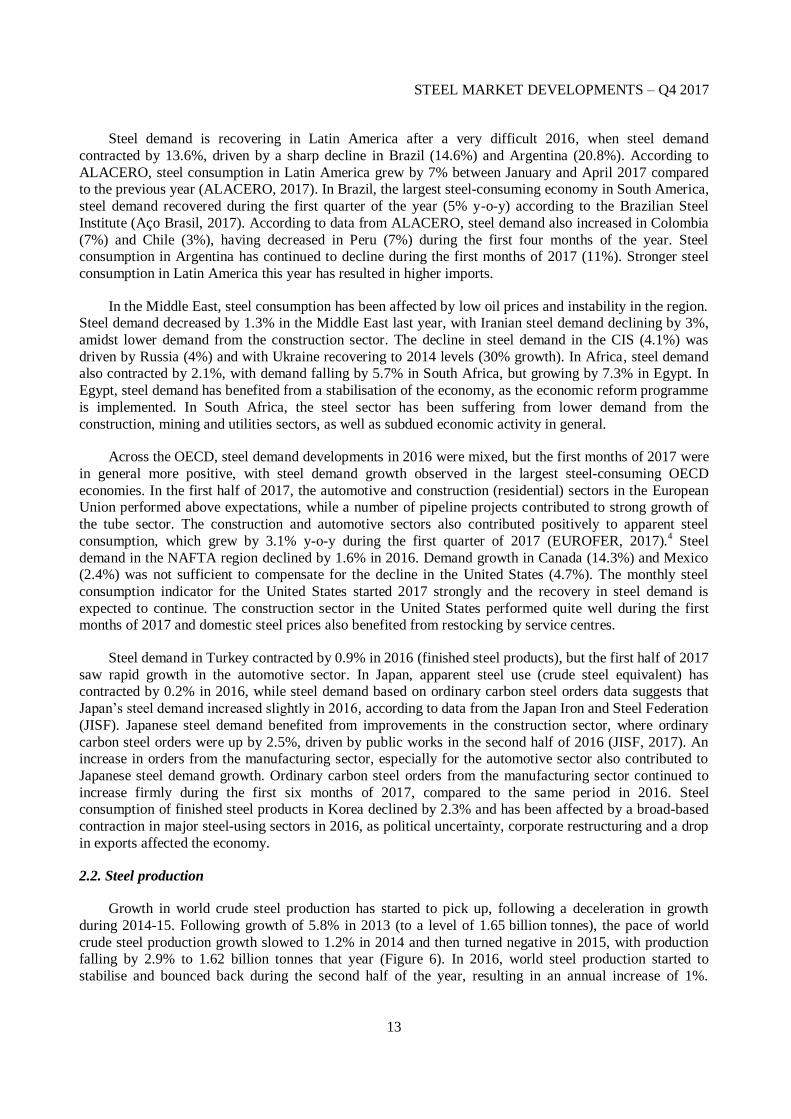
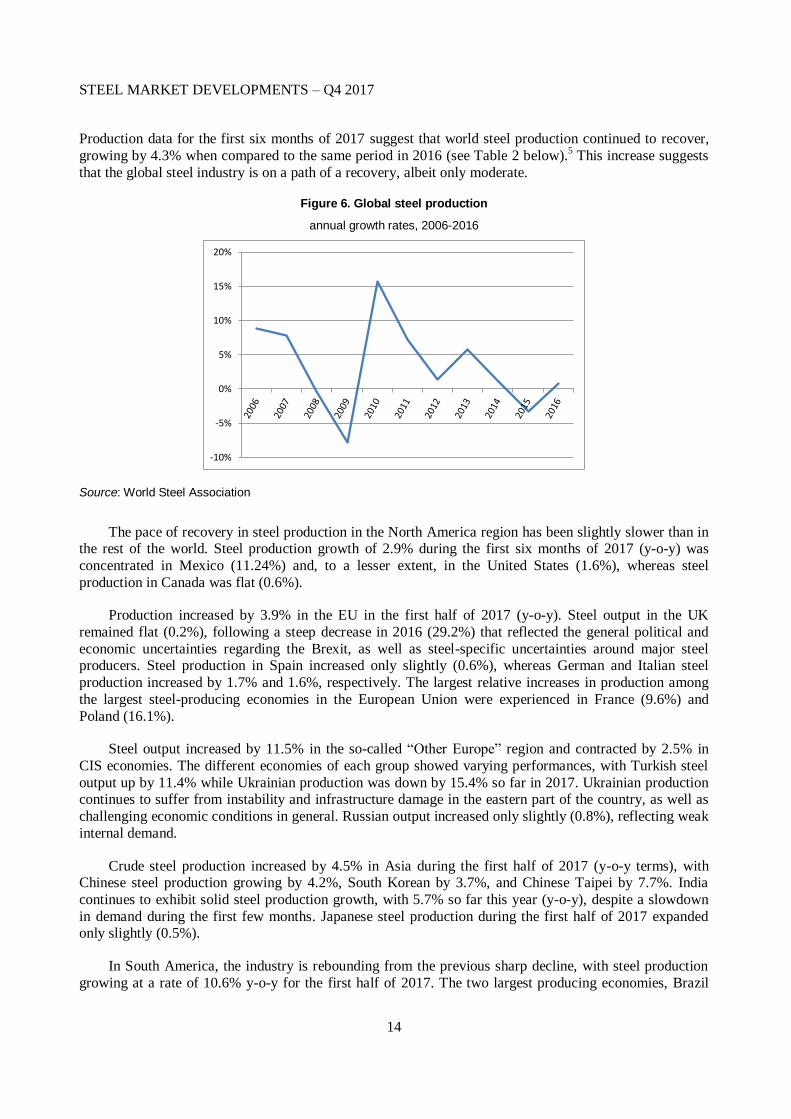
Growth in world crude steel production has started to pick up, following a deceleration in growth
during 2014-15. Following growth of 5.8% in 2013 (to a level of 1.65 billion tonnes), the pace of world
crude steel production growth slowed to 1.2% in 2014 and then turned negative in 2015, with production falling by 2.9% to 1.62 billion tonnes that year (Figure 6). In 2016, world steel production started to
stabilise and bounced back during the second half of the year, resulting in an annual increase of 1%.
STEEL MARKET DEVELOPMENTS – Q4 2017
14
Production data for the first six months of 2017 suggest that world steel production continued to recover,
growing by 4.3% when compared to the same period in 2016 (see Table 2 below).5 This increase suggests
that the global steel industry is on a path of a recovery, albeit only moderate.
Figure 6. Global steel production
annual growth rates, 2006-2016
Source: World Steel Association
The pace of recovery in steel production in the North America region has been slightly slower than in the rest of the world. Steel production growth of 2.9% during the first six months of 2017 (y-o-y) was
concentrated in Mexico (11.24%) and, to a lesser extent, in the United States (1.6%), whereas steel
production in Canada was flat (0.6%).
Production increased by 3.9% in the EU in the first half of 2017 (y-o-y). Steel output in the UK
remained flat (0.2%), following a steep decrease in 2016 (29.2%) that reflected the general political and
economic uncertainties regarding the Brexit, as well as steel-specific uncertainties around major steel producers. Steel production in Spain increased only slightly (0.6%), whereas German and Italian steel
production increased by 1.7% and 1.6%, respectively. The largest relative increases in production among
the largest steel-producing economies in the European Union were experienced in France (9.6%) and
Poland (16.1%).
Steel output increased by 11.5% in the so-called “Other Europe” region and contracted by 2.5% in
CIS economies. The different economies of each group showed varying performances, with Turkish steel
output up by 11.4% while Ukrainian production was down by 15.4% so far in 2017. Ukrainian production continues to suffer from instability and infrastructure damage in the eastern part of the country, as well as
challenging economic conditions in general. Russian output increased only slightly (0.8%), reflecting weak
internal demand.
Crude steel production increased by 4.5% in Asia during the first half of 2017 (y-o-y terms), with Chinese steel production growing by 4.2%, South Korean by 3.7%, and Chinese Taipei by 7.7%. India
continues to exhibit solid steel production growth, with 5.7% so far this year (y-o-y), despite a slowdown
in demand during the first few months. Japanese steel production during the first half of 2017 expanded only slightly (0.5%).
In South America, the industry is rebounding from the previous sharp decline, with steel production
growing at a rate of 10.6% y-o-y for the first half of 2017. The two largest producing economies, Brazil
-10%
-5%
0%
5%
10%
15%
20%
STEEL MARKET DEVELOPMENTS – Q4 2017
15
and Argentina have experienced a marked recovery in steel production by 12.4% and 3.2%, respectively.
In contrast, steel production has declined in Colombia and Chile by 1.8% and 2.3%, respectively.
In the Middle East, production increased by 9.4% during the first six months of 2017. The increase was felt across the board, with the exception of Saudi Arabia whose steel production contracted by 5.3%.
Steel production in Iran continues to grow rapidly, at 13.7% y-o-y. African steel production has increased
by 11% y-o-y in the first half of 2017, driven by a very strong rebound in Egypt (36.9%). In South Africa,
the steel industry continues to experience declining steel production, with output falling by 4.1% y-o-y during the first semester of 2017.
Table 2. World crude steel production developments in 2016 and 2017
% change, year-on-year
June 2017 2016 June 2017 2016 Jan-Jun 2017 / 2016
EU 14 237 162 145 2.8 -2.4 3.9
Other Europe 3 236 35 919 4.4 5.6 11.5
CIS 7 639 102 230 -8.0 0.8 -2.5
North America 9 662 110 624 0.2 -0.3 2.9
South America 3 412 40 220 3.4 -8.4 10.6
Africa 1 051 12 189 5.5 -4.7 11.0
Middle East 2 662 29 025 9.4 7.6 9.4
Asia, of which: 98 892 1110 865 4.7 1.9 4.5
China 73 231 807 612 5.7 1.1 4.2
Oceania 504 5 837 -13.2 2.1 5.0
World 141 294 1609 053 3.4 1.0 4.3
Level, thousand mmt % change, year-on-year
Source: World Steel Association, as of 2 August 2017.
2.3. World steel trade
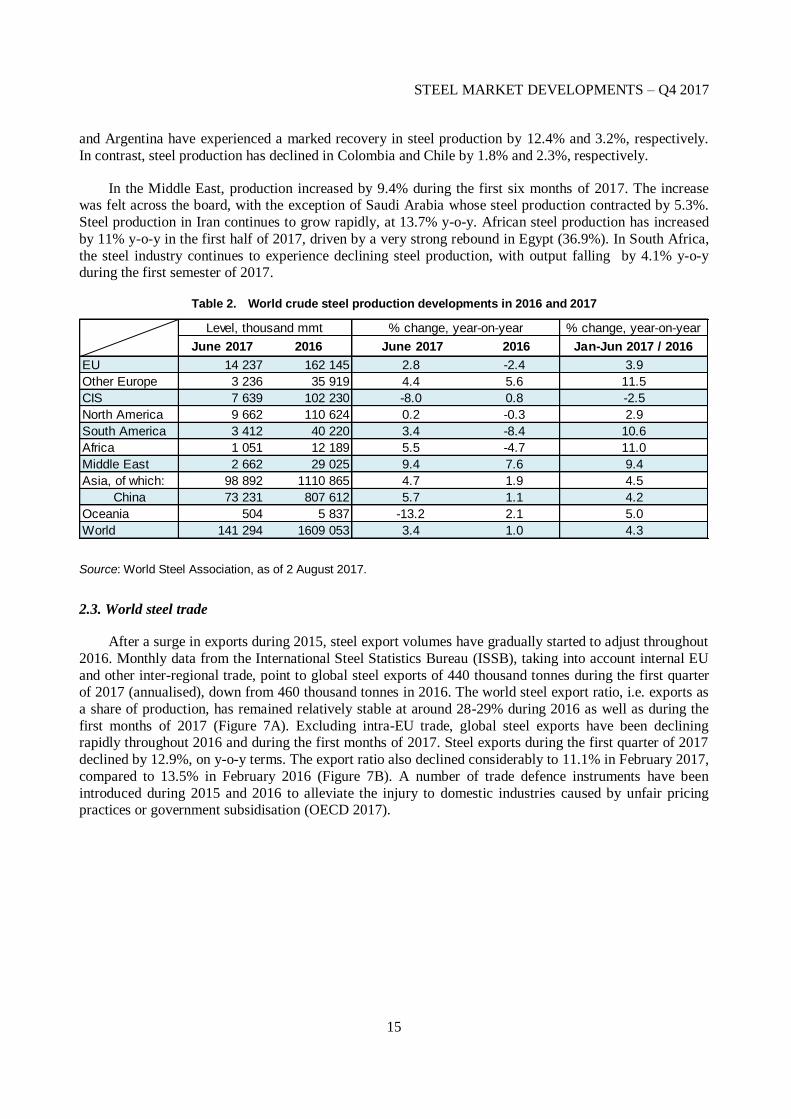
After a surge in exports during 2015, steel export volumes have gradually started to adjust throughout
2016. Monthly data from the International Steel Statistics Bureau (ISSB), taking into account internal EU
and other inter-regional trade, point to global steel exports of 440 thousand tonnes during the first quarter of 2017 (annualised), down from 460 thousand tonnes in 2016. The world steel export ratio, i.e. exports as
a share of production, has remained relatively stable at around 28-29% during 2016 as well as during the
first months of 2017 (Figure 7A). Excluding intra-EU trade, global steel exports have been declining rapidly throughout 2016 and during the first months of 2017. Steel exports during the first quarter of 2017
declined by 12.9%, on y-o-y terms. The export ratio also declined considerably to 11.1% in February 2017,
compared to 13.5% in February 2016 (Figure 7B). A number of trade defence instruments have been
introduced during 2015 and 2016 to alleviate the injury to domestic industries caused by unfair pricing practices or government subsidisation (OECD 2017).
STEEL MARKET DEVELOPMENTS – Q4 2017
16
Figure 7. World exports of steel: monthly volume (mmt) and export ratio (% of production)
(3-month moving averages)
A. Including intra-EU trade B. Excluding intra-EU trade
Source: OECD calculations based on data from ISSB.
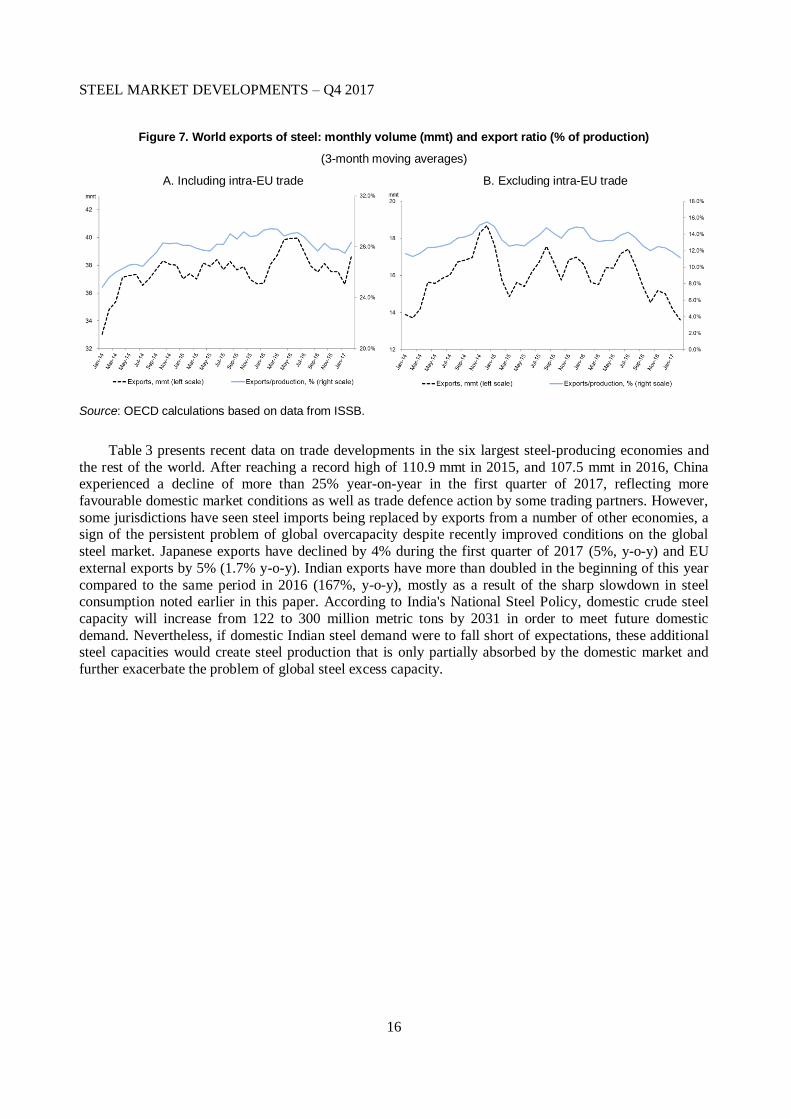
Table 3 presents recent data on trade developments in the six largest steel-producing economies and
the rest of the world. After reaching a record high of 110.9 mmt in 2015, and 107.5 mmt in 2016, China experienced a decline of more than 25% year-on-year in the first quarter of 2017, reflecting more
favourable domestic market conditions as well as trade defence action by some trading partners. However,
some jurisdictions have seen steel imports being replaced by exports from a number of other economies, a sign of the persistent problem of global overcapacity despite recently improved conditions on the global
steel market. Japanese exports have declined by 4% during the first quarter of 2017 (5%, y-o-y) and EU
external exports by 5% (1.7% y-o-y). Indian exports have more than doubled in the beginning of this year
compared to the same period in 2016 (167%, y-o-y), mostly as a result of the sharp slowdown in steel consumption noted earlier in this paper. According to India's National Steel Policy, domestic crude steel
capacity will increase from 122 to 300 million metric tons by 2031 in order to meet future domestic
demand. Nevertheless, if domestic Indian steel demand were to fall short of expectations, these additional steel capacities would create steel production that is only partially absorbed by the domestic market and
further exacerbate the problem of global steel excess capacity.
STEEL MARKET DEVELOPMENTS – Q4 2017
17
Table 3. Steel trade developments across major steel producing economies
Note: The definition of steel used in this table is HS 7 206 to 7 302, 7 304-7 306, and 7 307.21-7 307.99 excluding some forgings (7 326.19), points and switches/crossings (7302.30 and 7302.90), some forged cold finished sections (7 216.69 and 7 216.99), some cold formed sections (7 216.61 and 7 216.91), welded shapes and sections (7 301.20) and steel castings (7 325.99). This definition may differ from the total steel exports figures provided by ISSB in Figure 7 above.
Source: OECD calculations based on data from ISSB.
Data on steel imports during the first quarter of 2017 suggest that imports have increased in some economies when compared to the same period in 2016, despite the decline in global steel imports.
6 In the
United States, imports are increasing again after declining in both 2016 (15.9%) and 2015 (11.7%). Data
for the first quarter of 2017 indicate that total imports in the United States reached 8.1 mmt, an 18.4% increase compared to the same period in 2016. In the European Union, the largest steel importing
economy, imports continued to rise with 2017 data pointing to a 10.8% increase on y-o-y terms.
Interestingly, steel imports increased sharply in the ASEAN region, amid stronger steel demand in 2016.
According to data from the World Steel Association, Viet Nam and Thailand ranked amongst the top five steel importing economies in the world, a list that continues to be led by the European Union and the
United States (Worldsteel, 2017). The volume of imported steel products in Korea in the first quarter of
2017 was practically unchanged compared to the same period in 2016. In Turkey, imports continued to decline this year (26.5%, first quarter on y-o-y terms) after falling by 16.7% in 2016, correcting the sharp
increase experienced in 2015.
2.4. Steel prices
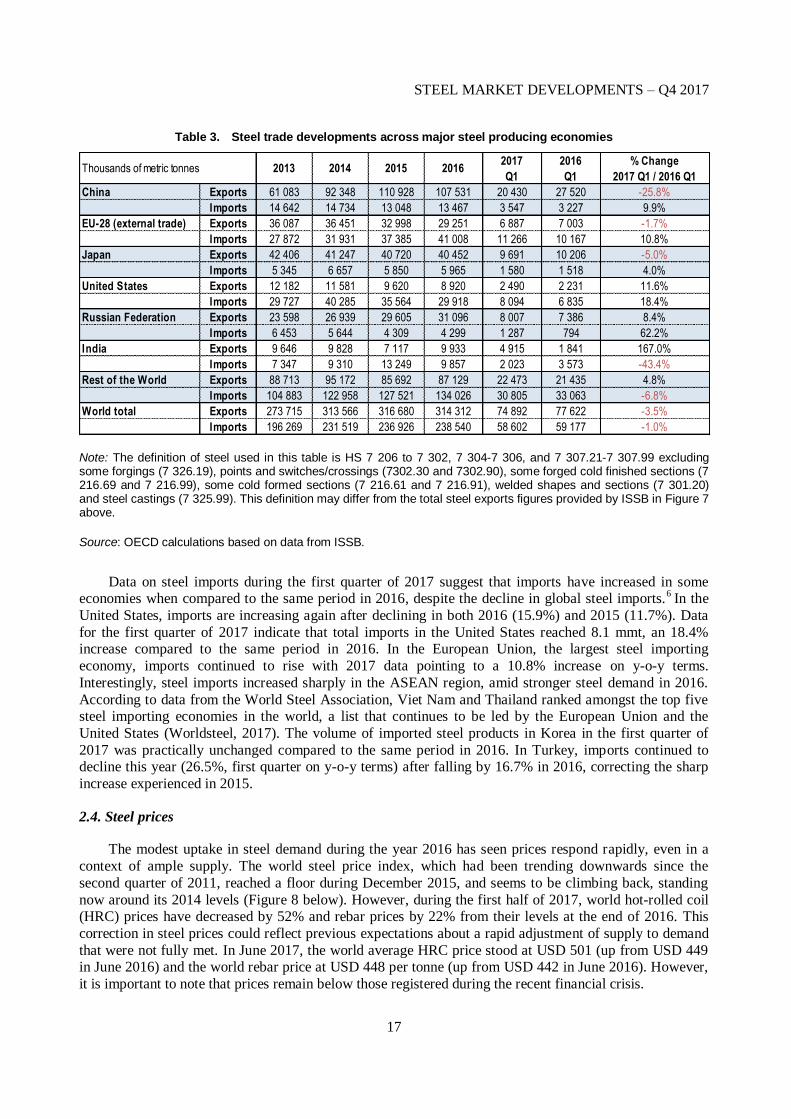
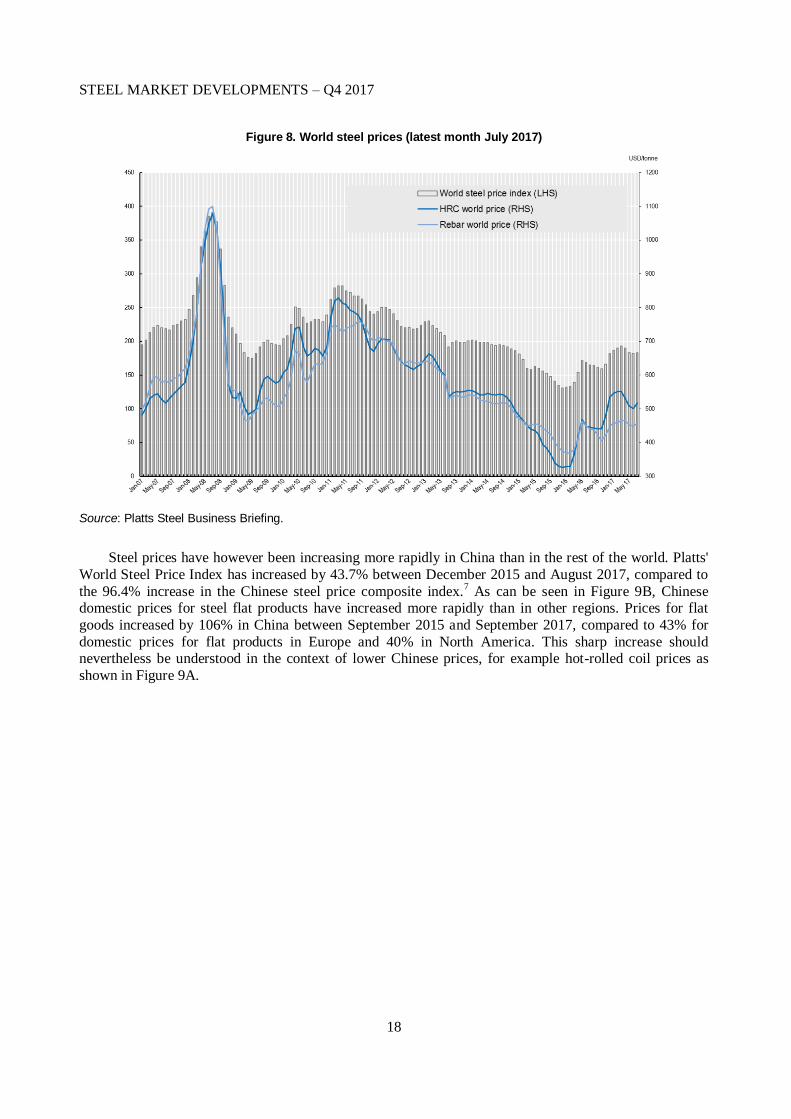
The modest uptake in steel demand during the year 2016 has seen prices respond rapidly, even in a
context of ample supply. The world steel price index, which had been trending downwards since the
second quarter of 2011, reached a floor during December 2015, and seems to be climbing back, standing
now around its 2014 levels (Figure 8 below). However, during the first half of 2017, world hot-rolled coil (HRC) prices have decreased by 52% and rebar prices by 22% from their levels at the end of 2016. This
correction in steel prices could reflect previous expectations about a rapid adjustment of supply to demand
that were not fully met. In June 2017, the world average HRC price stood at USD 501 (up from USD 449 in June 2016) and the world rebar price at USD 448 per tonne (up from USD 442 in June 2016). However,
it is important to note that prices remain below those registered during the recent financial crisis.
Thousands of metric tonnes 2013 2014 2015 20162017
Q1
2016
Q1
% Change
2017 Q1 / 2016 Q1
China Exports 61 083 92 348 110 928 107 531 20 430 27 520 -25.8%
Imports 14 642 14 734 13 048 13 467 3 547 3 227 9.9%
EU-28 (external trade) Exports 36 087 36 451 32 998 29 251 6 887 7 003 -1.7%
Imports 27 872 31 931 37 385 41 008 11 266 10 167 10.8%
Japan Exports 42 406 41 247 40 720 40 452 9 691 10 206 -5.0%
Imports 5 345 6 657 5 850 5 965 1 580 1 518 4.0%
United States Exports 12 182 11 581 9 620 8 920 2 490 2 231 11.6%
Imports 29 727 40 285 35 564 29 918 8 094 6 835 18.4%
Russian Federation Exports 23 598 26 939 29 605 31 096 8 007 7 386 8.4%
Imports 6 453 5 644 4 309 4 299 1 287 794 62.2%
India Exports 9 646 9 828 7 117 9 933 4 915 1 841 167.0%
Imports 7 347 9 310 13 249 9 857 2 023 3 573 -43.4%
Rest of the World Exports 88 713 95 172 85 692 87 129 22 473 21 435 4.8%
Imports 104 883 122 958 127 521 134 026 30 805 33 063 -6.8%
World total Exports 273 715 313 566 316 680 314 312 74 892 77 622 -3.5%
Imports 196 269 231 519 236 926 238 540 58 602 59 177 -1.0%
STEEL MARKET DEVELOPMENTS – Q4 2017
18
Figure 8. World steel prices (latest month July 2017)
Source: Platts Steel Business Briefing.
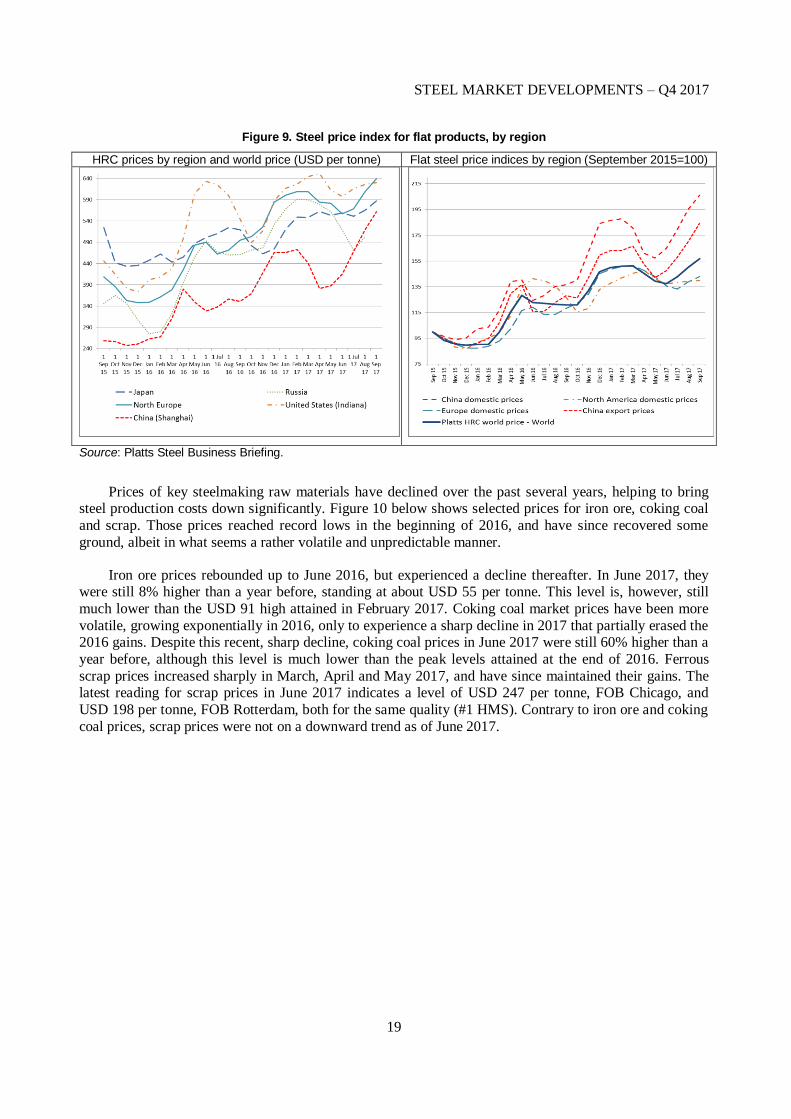
Steel prices have however been increasing more rapidly in China than in the rest of the world. Platts'
World Steel Price Index has increased by 43.7% between December 2015 and August 2017, compared to
the 96.4% increase in the Chinese steel price composite index.7 As can be seen in Figure 9B, Chinese
domestic prices for steel flat products have increased more rapidly than in other regions. Prices for flat
goods increased by 106% in China between September 2015 and September 2017, compared to 43% for
domestic prices for flat products in Europe and 40% in North America. This sharp increase should nevertheless be understood in the context of lower Chinese prices, for example hot-rolled coil prices as
shown in Figure 9A.
STEEL MARKET DEVELOPMENTS – Q4 2017
19
Figure 9. Steel price index for flat products, by region
HRC prices by region and world price (USD per tonne) Flat steel price indices by region (September 2015=100)
Source: Platts Steel Business Briefing.
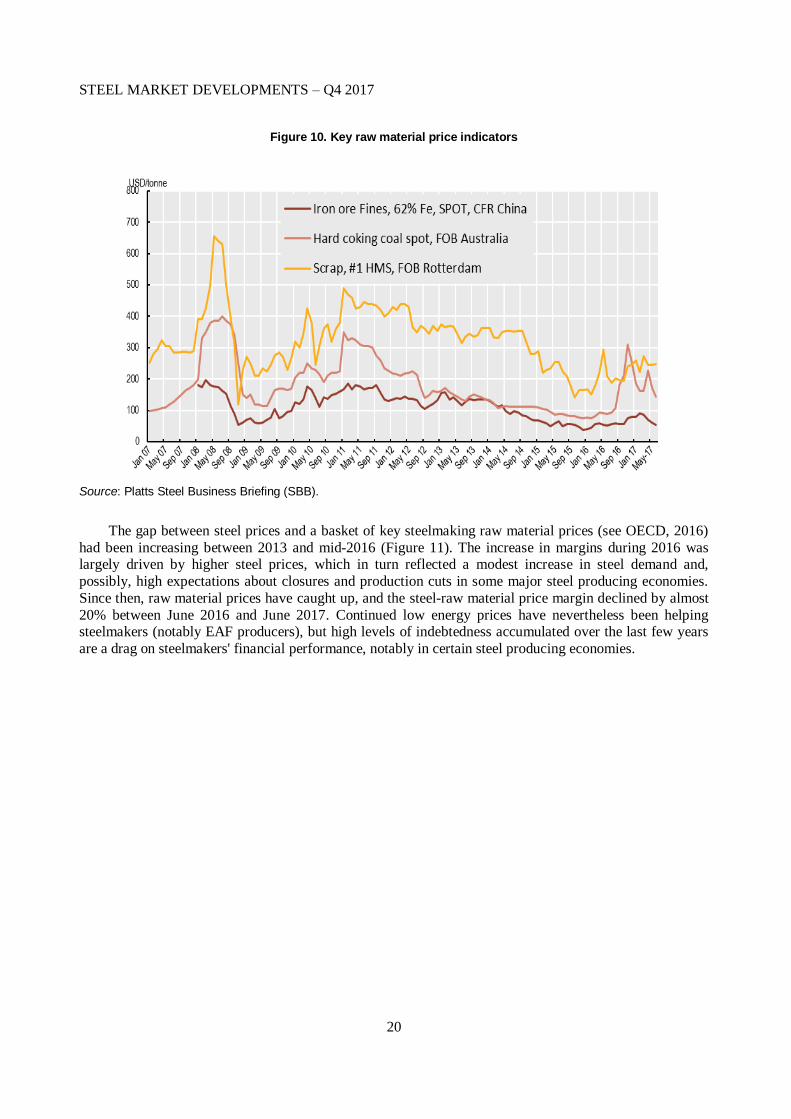
Prices of key steelmaking raw materials have declined over the past several years, helping to bring steel production costs down significantly. Figure 10 below shows selected prices for iron ore, coking coal
and scrap. Those prices reached record lows in the beginning of 2016, and have since recovered some
ground, albeit in what seems a rather volatile and unpredictable manner.
Iron ore prices rebounded up to June 2016, but experienced a decline thereafter. In June 2017, they were still 8% higher than a year before, standing at about USD 55 per tonne. This level is, however, still
much lower than the USD 91 high attained in February 2017. Coking coal market prices have been more
volatile, growing exponentially in 2016, only to experience a sharp decline in 2017 that partially erased the 2016 gains. Despite this recent, sharp decline, coking coal prices in June 2017 were still 60% higher than a
year before, although this level is much lower than the peak levels attained at the end of 2016. Ferrous
scrap prices increased sharply in March, April and May 2017, and have since maintained their gains. The latest reading for scrap prices in June 2017 indicates a level of USD 247 per tonne, FOB Chicago, and
USD 198 per tonne, FOB Rotterdam, both for the same quality (#1 HMS). Contrary to iron ore and coking
coal prices, scrap prices were not on a downward trend as of June 2017.
STEEL MARKET DEVELOPMENTS – Q4 2017
20
Figure 10. Key raw material price indicators
Source: Platts Steel Business Briefing (SBB).
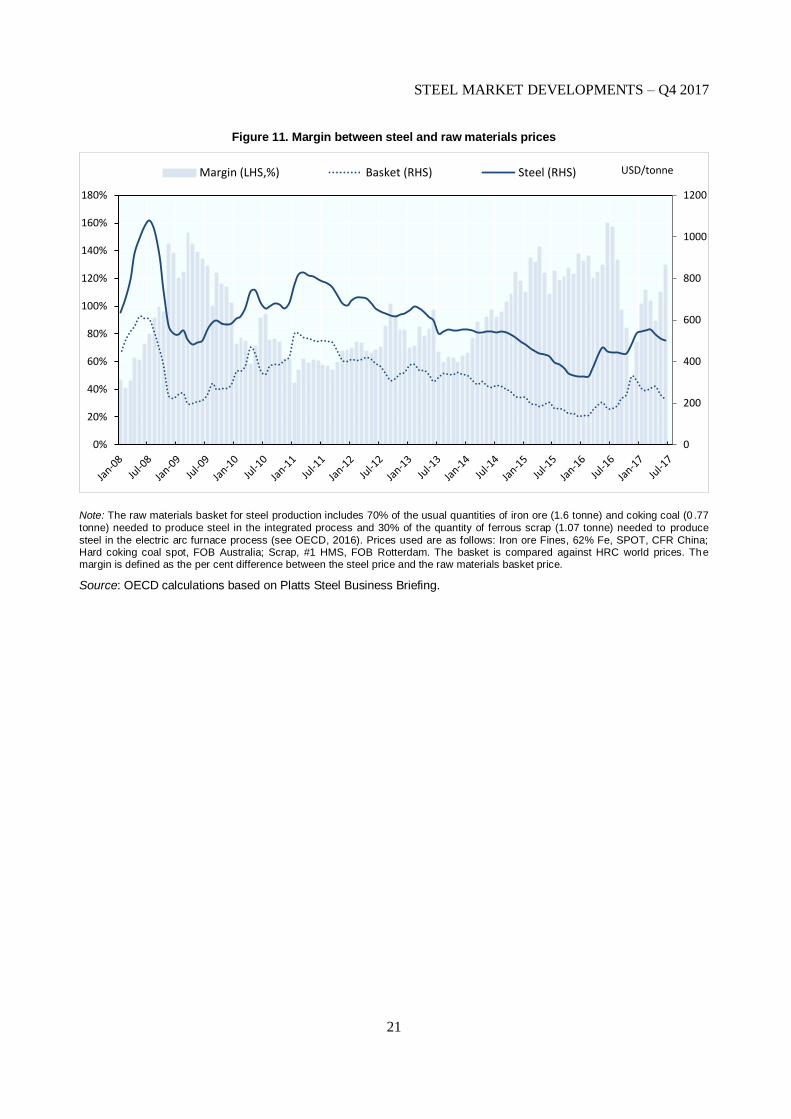
The gap between steel prices and a basket of key steelmaking raw material prices (see OECD, 2016)
had been increasing between 2013 and mid-2016 (Figure 11). The increase in margins during 2016 was largely driven by higher steel prices, which in turn reflected a modest increase in steel demand and,
possibly, high expectations about closures and production cuts in some major steel producing economies.
Since then, raw material prices have caught up, and the steel-raw material price margin declined by almost
20% between June 2016 and June 2017. Continued low energy prices have nevertheless been helping steelmakers (notably EAF producers), but high levels of indebtedness accumulated over the last few years
are a drag on steelmakers' financial performance, notably in certain steel producing economies.
STEEL MARKET DEVELOPMENTS – Q4 2017
21
Figure 11. Margin between steel and raw materials prices
Note: The raw materials basket for steel production includes 70% of the usual quantities of iron ore (1.6 tonne) and coking coal (0 .77
tonne) needed to produce steel in the integrated process and 30% of the quantity of ferrous scrap (1.07 tonne) needed to produce
steel in the electric arc furnace process (see OECD, 2016). Prices used are as follows: Iron ore Fines, 62% Fe, SPOT, CFR China; Hard coking coal spot, FOB Australia; Scrap, #1 HMS, FOB Rotterdam. The basket is compared against HRC world prices. The margin is defined as the per cent difference between the steel price and the raw materials basket price.
Source: OECD calculations based on Platts Steel Business Briefing.
0
200
400
600
800
1000
1200
0%
20%
40%
60%
80%
100%
120%
140%
160%
180%
Margin (LHS,%) Basket (RHS) Steel (RHS) USD/tonne
STEEL MARKET DEVELOPMENTS – Q4 2017
22
3. Financial performance of steel companies
3.1. Profitability
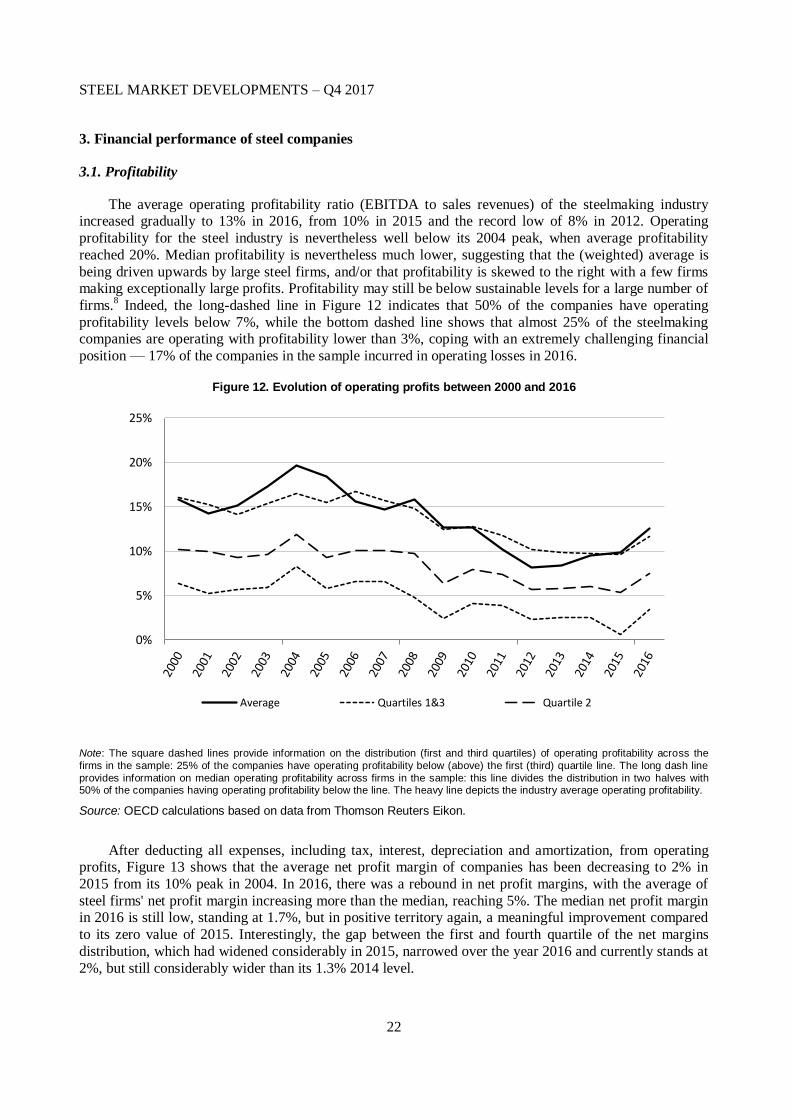
The average operating profitability ratio (EBITDA to sales revenues) of the steelmaking industry increased gradually to 13% in 2016, from 10% in 2015 and the record low of 8% in 2012. Operating
profitability for the steel industry is nevertheless well below its 2004 peak, when average profitability
reached 20%. Median profitability is nevertheless much lower, suggesting that the (weighted) average is
being driven upwards by large steel firms, and/or that profitability is skewed to the right with a few firms making exceptionally large profits. Profitability may still be below sustainable levels for a large number of
firms.8 Indeed, the long-dashed line in Figure 12 indicates that 50% of the companies have operating
profitability levels below 7%, while the bottom dashed line shows that almost 25% of the steelmaking companies are operating with profitability lower than 3%, coping with an extremely challenging financial
position — 17% of the companies in the sample incurred in operating losses in 2016.
Figure 12. Evolution of operating profits between 2000 and 2016
Note: The square dashed lines provide information on the distribution (first and third quartiles) of operating profitability across the
firms in the sample: 25% of the companies have operating profitability below (above) the first (third) quartile line. The long dash line
provides information on median operating profitability across firms in the sample: this line divides the distribution in two halves with 50% of the companies having operating profitability below the line. The heavy line depicts the industry average operating profitability.
Source: OECD calculations based on data from Thomson Reuters Eikon.
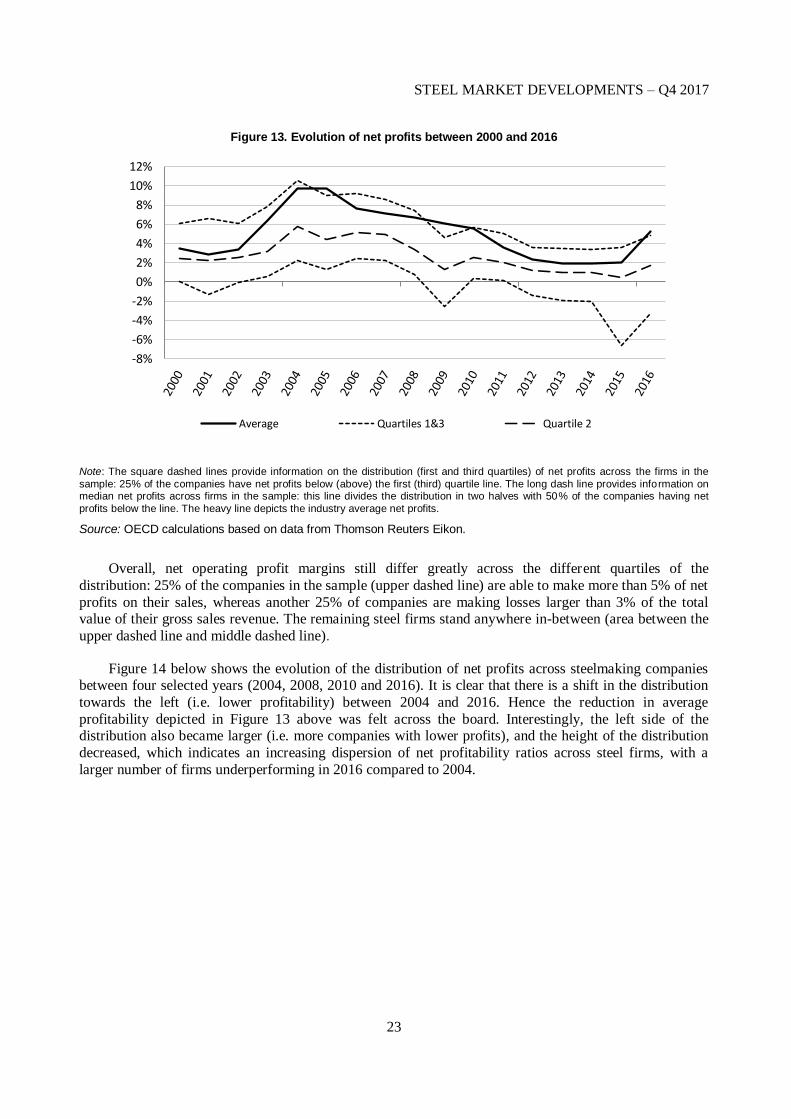
After deducting all expenses, including tax, interest, depreciation and amortization, from operating profits, Figure 13 shows that the average net profit margin of companies has been decreasing to 2% in
2015 from its 10% peak in 2004. In 2016, there was a rebound in net profit margins, with the average of
steel firms' net profit margin increasing more than the median, reaching 5%. The median net profit margin in 2016 is still low, standing at 1.7%, but in positive territory again, a meaningful improvement compared
to its zero value of 2015. Interestingly, the gap between the first and fourth quartile of the net margins
distribution, which had widened considerably in 2015, narrowed over the year 2016 and currently stands at
2%, but still considerably wider than its 1.3% 2014 level.
0%
5%
10%
15%
20%
25%
Average Quartiles 1&3 Quartile 2
STEEL MARKET DEVELOPMENTS – Q4 2017
23
Figure 13. Evolution of net profits between 2000 and 2016
Note: The square dashed lines provide information on the distribution (first and third quartiles) of net profits across the firms in the
sample: 25% of the companies have net profits below (above) the first (third) quartile line. The long dash line provides information on median net profits across firms in the sample: this line divides the distribution in two halves with 50% of the companies having net
profits below the line. The heavy line depicts the industry average net profits.
Source: OECD calculations based on data from Thomson Reuters Eikon.
Overall, net operating profit margins still differ greatly across the different quartiles of the
distribution: 25% of the companies in the sample (upper dashed line) are able to make more than 5% of net
profits on their sales, whereas another 25% of companies are making losses larger than 3% of the total value of their gross sales revenue. The remaining steel firms stand anywhere in-between (area between the
upper dashed line and middle dashed line).
Figure 14 below shows the evolution of the distribution of net profits across steelmaking companies between four selected years (2004, 2008, 2010 and 2016). It is clear that there is a shift in the distribution
towards the left (i.e. lower profitability) between 2004 and 2016. Hence the reduction in average
profitability depicted in Figure 13 above was felt across the board. Interestingly, the left side of the distribution also became larger (i.e. more companies with lower profits), and the height of the distribution
decreased, which indicates an increasing dispersion of net profitability ratios across steel firms, with a
larger number of firms underperforming in 2016 compared to 2004.
-8%
-6%
-4%
-2%
0%
2%
4%
6%
8%
10%
12%
Average Quartiles 1&3 Quartile 2

STEEL MARKET DEVELOPMENTS – Q4 2017
24
Figure 14. Distribution of the logarithm of net profits in selected years
2004, 2008, 2012 and 2016
Note: This figure plots the distributions of net profit margin in different years using kernel density estimates. The kernel dens ity
estimate gives an approximation of the probability density function of a given distribution — up to a given point x in the horizontal axis,
the area under this function provides the percentage of observations that have values that are lower or equal to x. The total area below the curve for each year equals one. For presentation purposes, the x net profit values shown in the chart range between -100% and 100%.
Source: OECD calculations based on data from Thomson Reuters Eikon.
3.2. Indebtedness
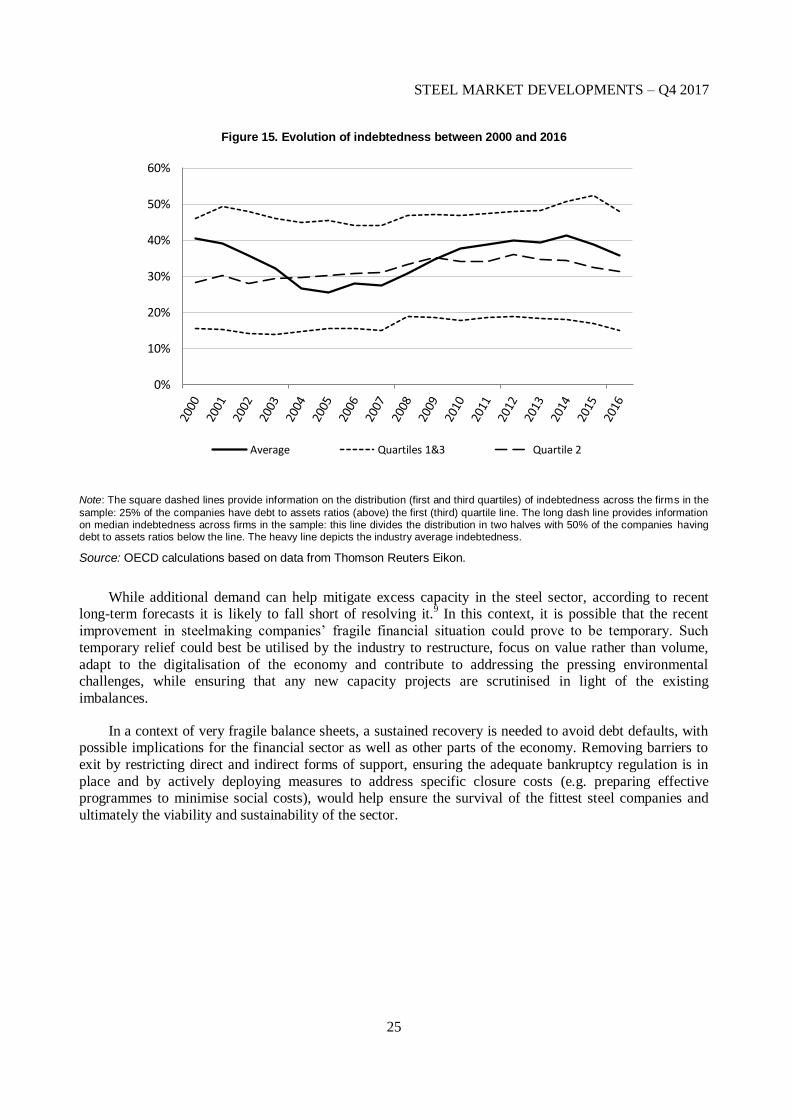
After several years of low profits, steelmaking companies have rapidly been accumulating debt.
However, financial data for 2016 suggest that steel companies might finally be slowly deleveraging (Figure
15). Some companies may have taken advantage of improved net profitability to reduce debt. A more
cautious approach from banks and other financial institutions to steel loans may also explain part of the decrease. Lenders are more reluctant to roll over debt and measures are being taken to address non-
performing loans and curb excessive debt levels in the steel sector, as part of broader deleveraging policy
stance in some economies such as China and India. The average share of debt on total assets has decreased from 41% in 2014 to around 36% in 2016, but is still higher than its 30% pre-2008 levels. The most
indebted companies (upper dashed line) have been catching up with the debt reduction trend, after adding
more debt in 2015, an year in which the less debt-burden companies had already started to deleverage.
0.1
.2.3
.4.5
f(x)
-15 -10 -5 0 5x
2016 2004
2008 2012
Distribution of ln_net_margin in selected years
STEEL MARKET DEVELOPMENTS – Q4 2017
25
Figure 15. Evolution of indebtedness between 2000 and 2016
Note: The square dashed lines provide information on the distribution (first and third quartiles) of indebtedness across the firms in the
sample: 25% of the companies have debt to assets ratios (above) the first (third) quartile line. The long dash line provides information on median indebtedness across firms in the sample: this line divides the distribution in two halves with 50% of the companies having debt to assets ratios below the line. The heavy line depicts the industry average indebtedness.
Source: OECD calculations based on data from Thomson Reuters Eikon.
While additional demand can help mitigate excess capacity in the steel sector, according to recent long-term forecasts it is likely to fall short of resolving it.
9 In this context, it is possible that the recent
improvement in steelmaking companies’ fragile financial situation could prove to be temporary. Such
temporary relief could best be utilised by the industry to restructure, focus on value rather than volume,
adapt to the digitalisation of the economy and contribute to addressing the pressing environmental challenges, while ensuring that any new capacity projects are scrutinised in light of the existing
imbalances.
In a context of very fragile balance sheets, a sustained recovery is needed to avoid debt defaults, with possible implications for the financial sector as well as other parts of the economy. Removing barriers to
exit by restricting direct and indirect forms of support, ensuring the adequate bankruptcy regulation is in
place and by actively deploying measures to address specific closure costs (e.g. preparing effective programmes to minimise social costs), would help ensure the survival of the fittest steel companies and
ultimately the viability and sustainability of the sector.
0%
10%
20%
30%
40%
50%
60%
Average Quartiles 1&3 Quartile 2
STEEL MARKET DEVELOPMENTS – Q4 2017
26
4. The global excess capacity situation: a brief overview
Excess capacity remains a major challenge to the global steel industry, with implications for the
financial and economic sustainability of the sector and international steel trade. The OECD compiles steelmaking capacity data and has recently released data on capacity developments until December 2016
(see Box 2) that showed an increase in global steelmaking capacity to a level of 2 380.7 mmt in 2016
(OECD, 2017b).
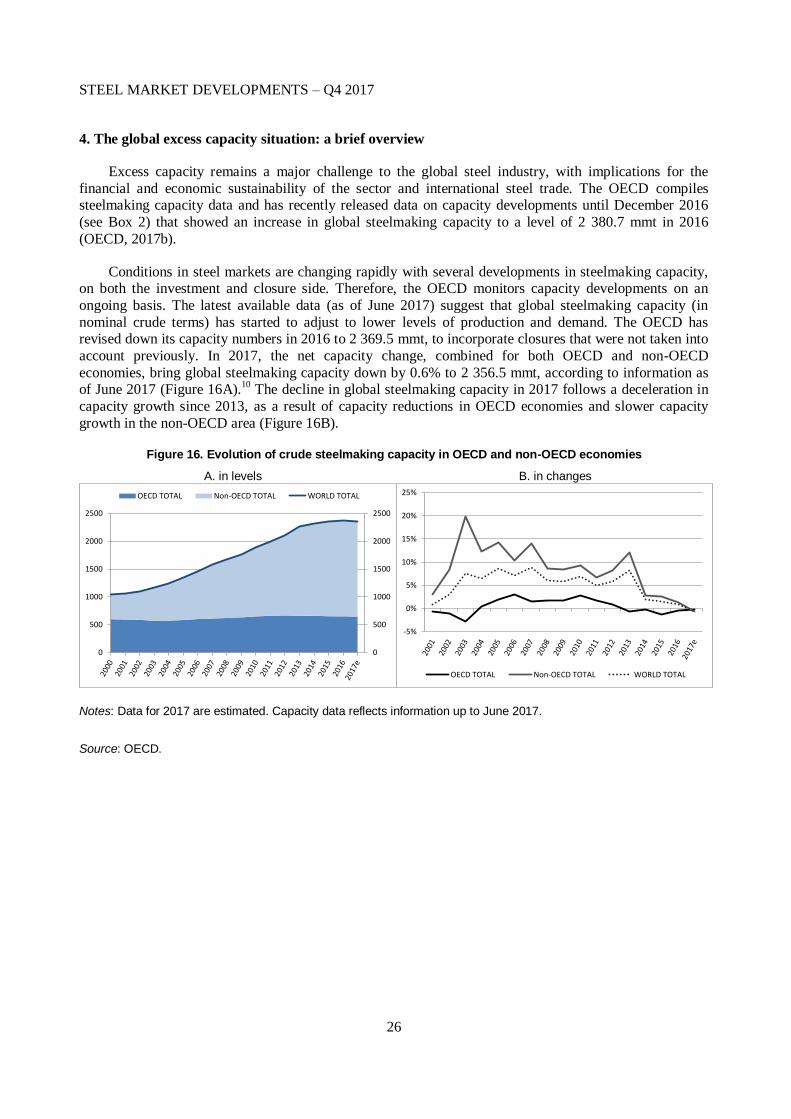
Conditions in steel markets are changing rapidly with several developments in steelmaking capacity, on both the investment and closure side. Therefore, the OECD monitors capacity developments on an
ongoing basis. The latest available data (as of June 2017) suggest that global steelmaking capacity (in
nominal crude terms) has started to adjust to lower levels of production and demand. The OECD has revised down its capacity numbers in 2016 to 2 369.5 mmt, to incorporate closures that were not taken into
account previously. In 2017, the net capacity change, combined for both OECD and non-OECD
economies, bring global steelmaking capacity down by 0.6% to 2 356.5 mmt, according to information as of June 2017 (Figure 16A).
10 The decline in global steelmaking capacity in 2017 follows a deceleration in
capacity growth since 2013, as a result of capacity reductions in OECD economies and slower capacity
growth in the non-OECD area (Figure 16B).
Figure 16. Evolution of crude steelmaking capacity in OECD and non-OECD economies
A. in levels B. in changes
Notes: Data for 2017 are estimated. Capacity data reflects information up to June 2017.
Source: OECD.
0
500
1000
1500
2000
2500
0
500
1000
1500
2000
2500
OECD TOTAL Non-OECD TOTAL WORLD TOTAL
-5%
0%
5%
10%
15%
20%
25%
OECD TOTAL Non-OECD TOTAL WORLD TOTAL
STEEL MARKET DEVELOPMENTS – Q4 2017
27
Box 2. OECD Steelmaking Capacity database
The OECD Steelmaking Capacity database contains data on crude steelmaking capacity by economy and provides researchers and policymakers with an important tool for analysing steel capacity developments. Data were last updated in July 2017 and reflect information on changes in steelmaking capacity up to December 2016.
The OECD Secretariat compiles steelmaking capacity data using a wide range of publicly available and commercial data sources. These data sources include government sources, commercial capacity databases, specialised media reports, and company information. The data are reviewed periodically by the OECD Steel Committee. Capacity figures are in terms of nominal crude steelmaking capacity. The data refer to maximum theoretical equipment capacity. This definition does not take into account yield losses, maintenance and other factors affecting the productivity of installed steelmaking equipment. Therefore, these steelmaking capacity figures provided should neither be regarded as effective capacity nor as production. Annual capacity data figures reflect all existing steelmaking capacity at the end of a calendar year.
The OECD Steelmaking Capacity database as well as recent reports on steelmaking capacity developments are available at the OECD Steelmaking Capacity portal at: oe.cd/steelcapacity
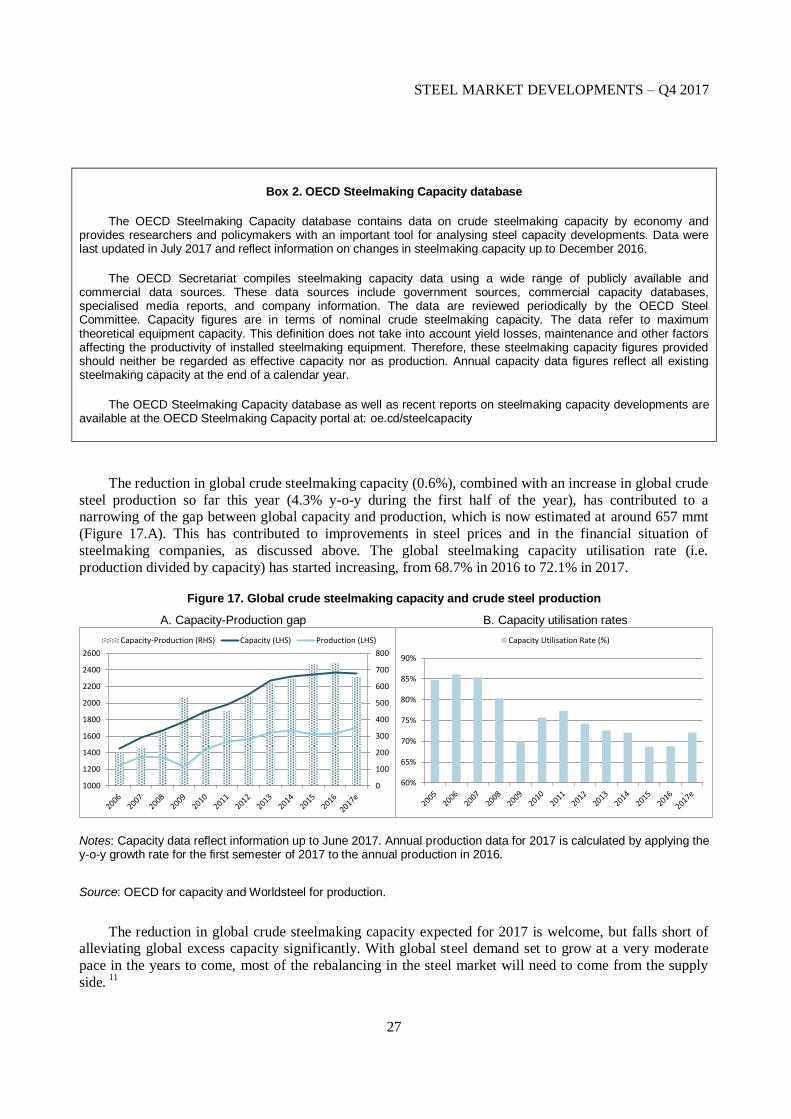
The reduction in global crude steelmaking capacity (0.6%), combined with an increase in global crude
steel production so far this year (4.3% y-o-y during the first half of the year), has contributed to a narrowing of the gap between global capacity and production, which is now estimated at around 657 mmt
(Figure 17.A). This has contributed to improvements in steel prices and in the financial situation of
steelmaking companies, as discussed above. The global steelmaking capacity utilisation rate (i.e.
production divided by capacity) has started increasing, from 68.7% in 2016 to 72.1% in 2017.
Figure 17. Global crude steelmaking capacity and crude steel production
A. Capacity-Production gap B. Capacity utilisation rates
Notes: Capacity data reflect information up to June 2017. Annual production data for 2017 is calculated by applying the y-o-y growth rate for the first semester of 2017 to the annual production in 2016.
Source: OECD for capacity and Worldsteel for production.
The reduction in global crude steelmaking capacity expected for 2017 is welcome, but falls short of alleviating global excess capacity significantly. With global steel demand set to grow at a very moderate
pace in the years to come, most of the rebalancing in the steel market will need to come from the supply
side. 11
0
100
200
300
400
500
600
700
800
1000
1200
1400
1600
1800
2000
2200
2400
2600
Capacity-Production (RHS) Capacity (LHS) Production (LHS)
60%
65%
70%
75%
80%
85%
90%
Capacity Utilisation Rate (%)
STEEL MARKET DEVELOPMENTS – Q4 2017
28
5. The steel market outlook
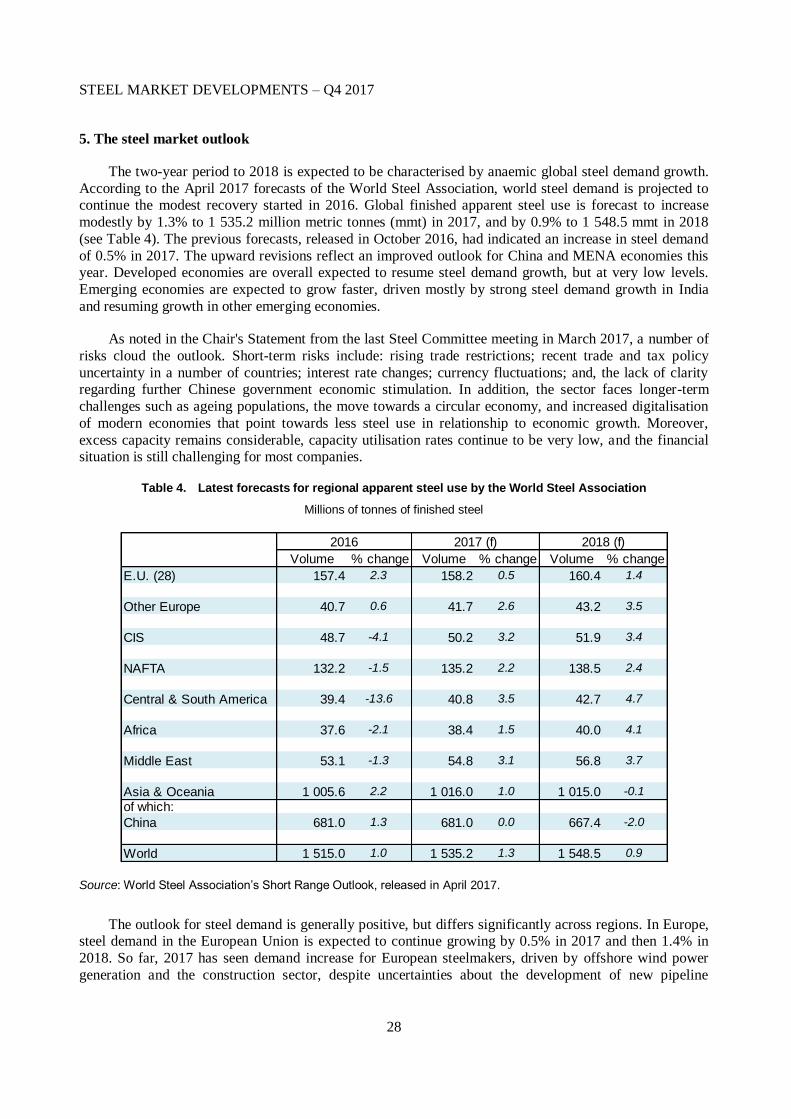
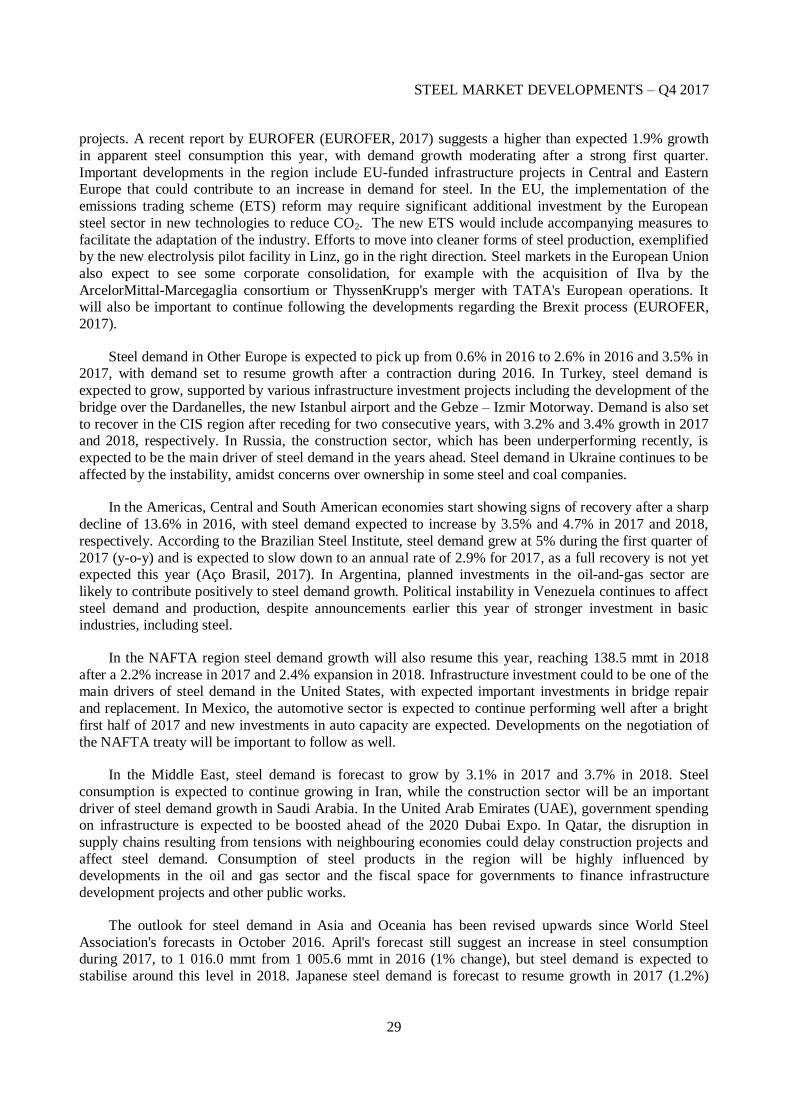
The two-year period to 2018 is expected to be characterised by anaemic global steel demand growth.
According to the April 2017 forecasts of the World Steel Association, world steel demand is projected to continue the modest recovery started in 2016. Global finished apparent steel use is forecast to increase
modestly by 1.3% to 1 535.2 million metric tonnes (mmt) in 2017, and by 0.9% to 1 548.5 mmt in 2018
(see Table 4). The previous forecasts, released in October 2016, had indicated an increase in steel demand
of 0.5% in 2017. The upward revisions reflect an improved outlook for China and MENA economies this year. Developed economies are overall expected to resume steel demand growth, but at very low levels.
Emerging economies are expected to grow faster, driven mostly by strong steel demand growth in India
and resuming growth in other emerging economies.
As noted in the Chair's Statement from the last Steel Committee meeting in March 2017, a number of
risks cloud the outlook. Short-term risks include: rising trade restrictions; recent trade and tax policy
uncertainty in a number of countries; interest rate changes; currency fluctuations; and, the lack of clarity regarding further Chinese government economic stimulation. In addition, the sector faces longer-term
challenges such as ageing populations, the move towards a circular economy, and increased digitalisation
of modern economies that point towards less steel use in relationship to economic growth. Moreover,
excess capacity remains considerable, capacity utilisation rates continue to be very low, and the financial situation is still challenging for most companies.
Table 4. Latest forecasts for regional apparent steel use by the World Steel Association
Millions of tonnes of finished steel
Volume % change Volume % change Volume % change
E.U. (28) 157.4 2.3 158.2 0.5 160.4 1.4
Other Europe 40.7 0.6 41.7 2.6 43.2 3.5
CIS 48.7 -4.1 50.2 3.2 51.9 3.4
NAFTA 132.2 -1.5 135.2 2.2 138.5 2.4
Central & South America 39.4 -13.6 40.8 3.5 42.7 4.7
Africa 37.6 -2.1 38.4 1.5 40.0 4.1
Middle East 53.1 -1.3 54.8 3.1 56.8 3.7
Asia & Oceania 1 005.6 2.2 1 016.0 1.0 1 015.0 -0.1
of which:
China 681.0 1.3 681.0 0.0 667.4 -2.0
World 1 515.0 1.0 1 535.2 1.3 1 548.5 0.9
2016 2017 (f) 2018 (f)
Source: World Steel Association’s Short Range Outlook, released in April 2017.
The outlook for steel demand is generally positive, but differs significantly across regions. In Europe, steel demand in the European Union is expected to continue growing by 0.5% in 2017 and then 1.4% in
2018. So far, 2017 has seen demand increase for European steelmakers, driven by offshore wind power
generation and the construction sector, despite uncertainties about the development of new pipeline
STEEL MARKET DEVELOPMENTS – Q4 2017
29
projects. A recent report by EUROFER (EUROFER, 2017) suggests a higher than expected 1.9% growth
in apparent steel consumption this year, with demand growth moderating after a strong first quarter.
Important developments in the region include EU-funded infrastructure projects in Central and Eastern Europe that could contribute to an increase in demand for steel. In the EU, the implementation of the
emissions trading scheme (ETS) reform may require significant additional investment by the European
steel sector in new technologies to reduce CO2. The new ETS would include accompanying measures to
facilitate the adaptation of the industry. Efforts to move into cleaner forms of steel production, exemplified by the new electrolysis pilot facility in Linz, go in the right direction. Steel markets in the European Union
also expect to see some corporate consolidation, for example with the acquisition of Ilva by the
ArcelorMittal-Marcegaglia consortium or ThyssenKrupp's merger with TATA's European operations. It will also be important to continue following the developments regarding the Brexit process (EUROFER,
2017).
Steel demand in Other Europe is expected to pick up from 0.6% in 2016 to 2.6% in 2016 and 3.5% in 2017, with demand set to resume growth after a contraction during 2016. In Turkey, steel demand is
expected to grow, supported by various infrastructure investment projects including the development of the
bridge over the Dardanelles, the new Istanbul airport and the Gebze – Izmir Motorway. Demand is also set
to recover in the CIS region after receding for two consecutive years, with 3.2% and 3.4% growth in 2017 and 2018, respectively. In Russia, the construction sector, which has been underperforming recently, is
expected to be the main driver of steel demand in the years ahead. Steel demand in Ukraine continues to be
affected by the instability, amidst concerns over ownership in some steel and coal companies.
In the Americas, Central and South American economies start showing signs of recovery after a sharp
decline of 13.6% in 2016, with steel demand expected to increase by 3.5% and 4.7% in 2017 and 2018,
respectively. According to the Brazilian Steel Institute, steel demand grew at 5% during the first quarter of
2017 (y-o-y) and is expected to slow down to an annual rate of 2.9% for 2017, as a full recovery is not yet expected this year (Aço Brasil, 2017). In Argentina, planned investments in the oil-and-gas sector are
likely to contribute positively to steel demand growth. Political instability in Venezuela continues to affect
steel demand and production, despite announcements earlier this year of stronger investment in basic industries, including steel.
In the NAFTA region steel demand growth will also resume this year, reaching 138.5 mmt in 2018
after a 2.2% increase in 2017 and 2.4% expansion in 2018. Infrastructure investment could to be one of the main drivers of steel demand in the United States, with expected important investments in bridge repair
and replacement. In Mexico, the automotive sector is expected to continue performing well after a bright
first half of 2017 and new investments in auto capacity are expected. Developments on the negotiation of
the NAFTA treaty will be important to follow as well.
In the Middle East, steel demand is forecast to grow by 3.1% in 2017 and 3.7% in 2018. Steel
consumption is expected to continue growing in Iran, while the construction sector will be an important
driver of steel demand growth in Saudi Arabia. In the United Arab Emirates (UAE), government spending on infrastructure is expected to be boosted ahead of the 2020 Dubai Expo. In Qatar, the disruption in
supply chains resulting from tensions with neighbouring economies could delay construction projects and
affect steel demand. Consumption of steel products in the region will be highly influenced by developments in the oil and gas sector and the fiscal space for governments to finance infrastructure
development projects and other public works.
The outlook for steel demand in Asia and Oceania has been revised upwards since World Steel
Association's forecasts in October 2016. April's forecast still suggest an increase in steel consumption during 2017, to 1 016.0 mmt from 1 005.6 mmt in 2016 (1% change), but steel demand is expected to
stabilise around this level in 2018. Japanese steel demand is forecast to resume growth in 2017 (1.2%)
STEEL MARKET DEVELOPMENTS – Q4 2017
30
followed by a marginal increase of 0.6% in 2018. The 2020 Tokyo Olympic Games could help support
steel demand from the construction sector. In Korea, steel demand growth is expected to contract by 2.7%
in 2017 and 1.8% in 2018, but improvements in recent order intake in the shipbuilding sector could help steel demand recover.
Steel intensity in China has been argued to have reached or be near its peak (see e.g. Zhong, 2016), as
the economy enters a "New Normal".12
According to the Worldsteel's April forecast, steel demand is
expected to remain around a level of 681 mmt in 2017 to then contract by 2% to 667.4 mmt in 2018. Additional stimulus measures to the real estate market are not expected for 2017 and the Chinese
government has been tightening regulations on house purchases and other commercial real estate (Xinhua,
2017a). Moreover, demand from the automotive industry will reflect any further changes to the break on sales of certain types of cars. Nevertheless, the reduction in steel demand resulting from the rebalancing
from manufacturing to services, could partially be offset by some infrastructure investment. Steel demand
growth will likely be supported government-led large infrastructure investment projects, such as high-speed rail and the construction of a new huge city and economic zone between Beijing and Tianjin (ME,
2017). There are however some concerns regarding a slowdown of infrastructure investment in China, if
fundraising of provincial governments is tightened.13
On the contrary, infrastructure investments supported
by China under the "Belt and Road" initiative could generate significant amounts of additional steel demand in other Asian economies.
In India, steel consumption growth has decelerated in 2016. According to Worldsteel's April forecast,
steel demand growth in India will accelerate to 6.1% in 2017 and 7.1% in 2018, with steel use in this economy is expected to reach 94.5 mmt by 2018. Investment in infrastructure foreseen under India’s
National Steel Policy (NPS) will continue to support steel demand. The NPS notes that steel demand is
likely to remain robust and will benefit from "accelerated spend in infrastructure sector, expansion of
railways network, development of domestic shipbuilding industry, opening up of defence sector for private participation, anticipated growth in automobile and capital goods industry and the construction in urban
and rural areas" (Ministry of Steel, 2017). According to the NPS, at the current rate of economic growth,
steel demand in India is expected to reach 230 mmt by 2030-31.
The ASEAN region is forecast to continue as one of the brightest spots, exhibiting solid steel demand
growth throughout 2017-18. Steel demand growth in Viet Nam is likely to be sustained by new
construction and infrastructure investment. The Vietnamese government has successfully been developing efforts to attract more foreign investment to prioritised areas such as infrastructure development. Steel
demand in Indonesia is expected to continue rising fast, amid a number of government-led infrastructure
development projects. In Malaysia, steel demand is likely to continue growing, pushed by a number of
large infrastructure investment projects, in oil refineries as well as new railways and highways. In the Philippines, there are plans to boost infrastructure spending and, steel demand in Thailand is also expected
to benefit from railway projects and other infrastructure investment in the near term, as well as announced
car production capacity expansions, amid incentives for electrical vehicle production. In Cambodia there are plans to develop the automotive industry.
The outlook for steel demand in African economies seems positive, with the region's demand forecast
to increase by 1.5% and 4.1% in 2017 and 2018, respectively. Steel demand growth prospects in South Africa are likely to improve on the back of stimulus measures for the downstream industry, namely the
recently established "Downstream Steel Industry Competitiveness Fund”.14
This is part of a broader set of
measures to support the steel sector in South Africa, including the review of import tariffs for some steel as
well as downstream products and a new public procurement policy.
STEEL MARKET DEVELOPMENTS – Q4 2017
31
6. Brief overview of selected downstream sectors
Steel is one of society’s most widely used materials. It plays an essential role from infrastructure to
transport, and is an indispensable intermediate input used by the construction and manufacturing sectors. More than 50% of the steel produced worldwide is used in the construction sector, around 16% is used by
the automotive sector, and much is used to manufacture machinery and metal products, and in the oil and
gas industry. An overview of selected sectors that are important components of steel demand can provide
some insights into the evolution of demand for steel products. Data presented in this section suggests that no substantial gains in terms of steel demand are expected to come from the construction, automotive, oil
and gas and shipbuilding sectors in the short- and medium-term.
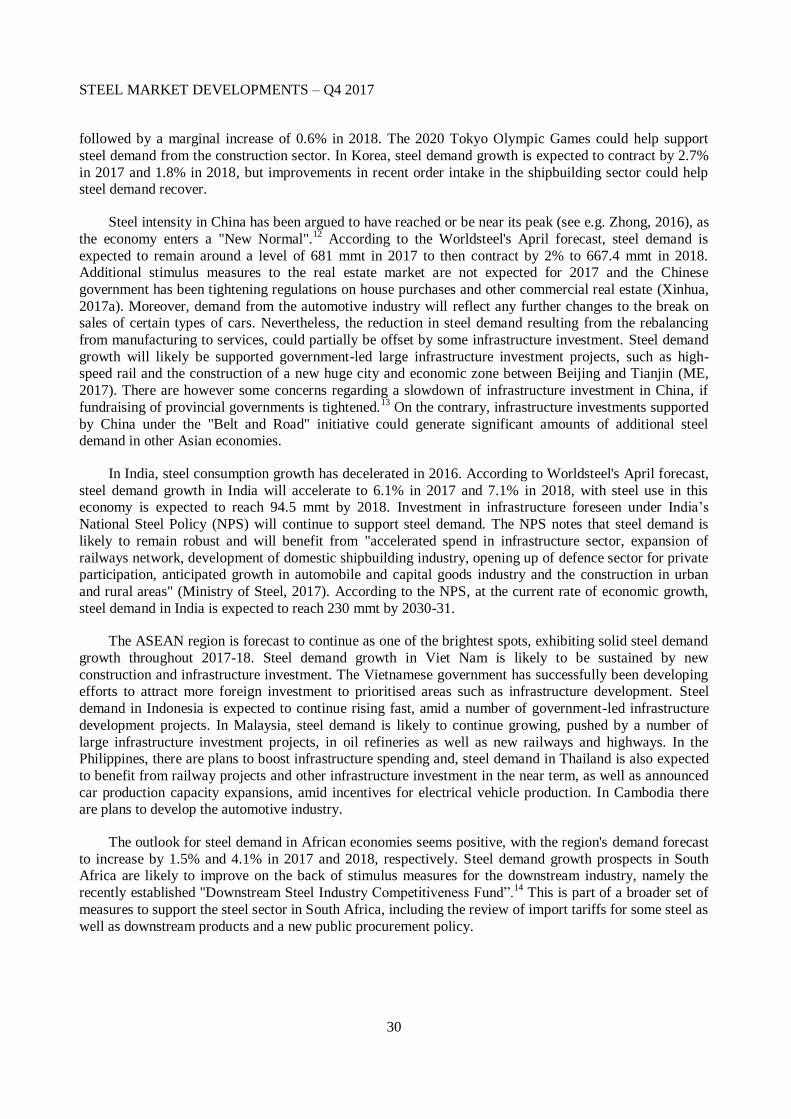
6.1. Construction
The construction sector has been performing differently across developed and emerging economies.
Construction has been an important driver for steel demand growth in developing countries because of
increasing urbanisation, but activity in the developed economies since the 2008 financial crisis has been more subdued. Investments towards real estate projects accelerated in China reverted to its downward trend
— in 2015, the percentage increase in land acquisition investments and in real restate excluding land
acquisitions came as low as 1.2%. The rebound maintained its momentum up to the end of 2016 and
investment growth rates have since stabilised, with planned investment in real estate standing at around 11% as of July 2017 (Figure 18A). Changes in land costs, which may be more speculative in nature, have
decelerated from their April 2017 figures of 21% towards the 16% level by July 2017 Investment in real
estate, excluding land, has also decreased, but only slightly. Investment flows directed towards real estate in India seem to be picking up after slowing down during the second half of 2016, but the quarterly flows
have been very volatile, oscillating around the same levels since end of 2012 (Figure 18B).
Figure 18. Chinese and Indian investment into real estate
A. Investment flows to Chinese real estate, Year-on-year growth rate (%)
B. Indian investment flows to new housing, 2-quarter year moving average (in million rupees)
Source: China National Bureau of Statistics (NBS) and Thomson Reuters Datastream.
In developed economies, developments in construction seem relatively more subdued. For example,
Figure 19 below indicates that building activity has decreased in Germany and Japan, and, to a lesser extent, in the United States, compared to the end of 2016.
-10%
0%
10%
20%
30%
Total Investment Planned for Real Estate Development
Investment of Real Estate, Land Acquisition Costs
Investment of Real Estate, excluding land acquisitions
0
100000
200000
300000
400000
500000
600000
700000
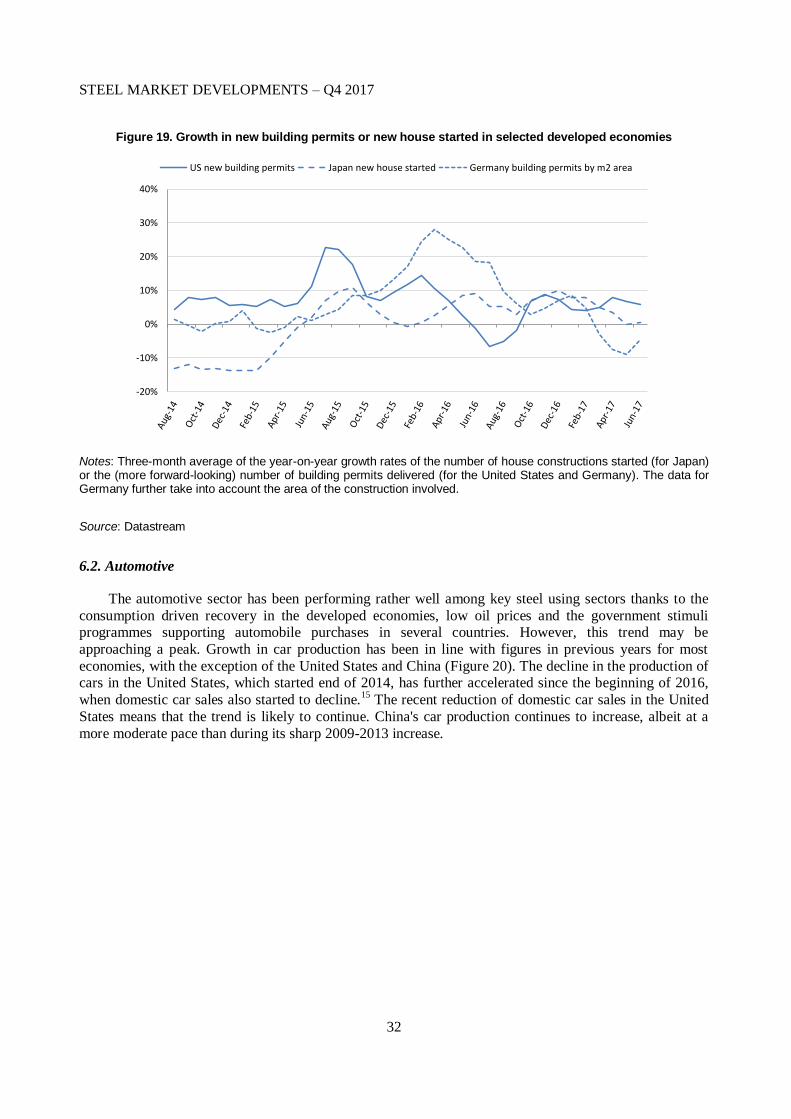
STEEL MARKET DEVELOPMENTS – Q4 2017
32
Figure 19. Growth in new building permits or new house started in selected developed economies
Notes: Three-month average of the year-on-year growth rates of the number of house constructions started (for Japan) or the (more forward-looking) number of building permits delivered (for the United States and Germany). The data for Germany further take into account the area of the construction involved.
Source: Datastream
6.2. Automotive
The automotive sector has been performing rather well among key steel using sectors thanks to the
consumption driven recovery in the developed economies, low oil prices and the government stimuli programmes supporting automobile purchases in several countries. However, this trend may be
approaching a peak. Growth in car production has been in line with figures in previous years for most
economies, with the exception of the United States and China (Figure 20). The decline in the production of cars in the United States, which started end of 2014, has further accelerated since the beginning of 2016,
when domestic car sales also started to decline.15
The recent reduction of domestic car sales in the United
States means that the trend is likely to continue. China's car production continues to increase, albeit at a
more moderate pace than during its sharp 2009-2013 increase.
-20%
-10%
0%
10%
20%
30%
40%
US new building permits Japan new house started Germany building permits by m2 area
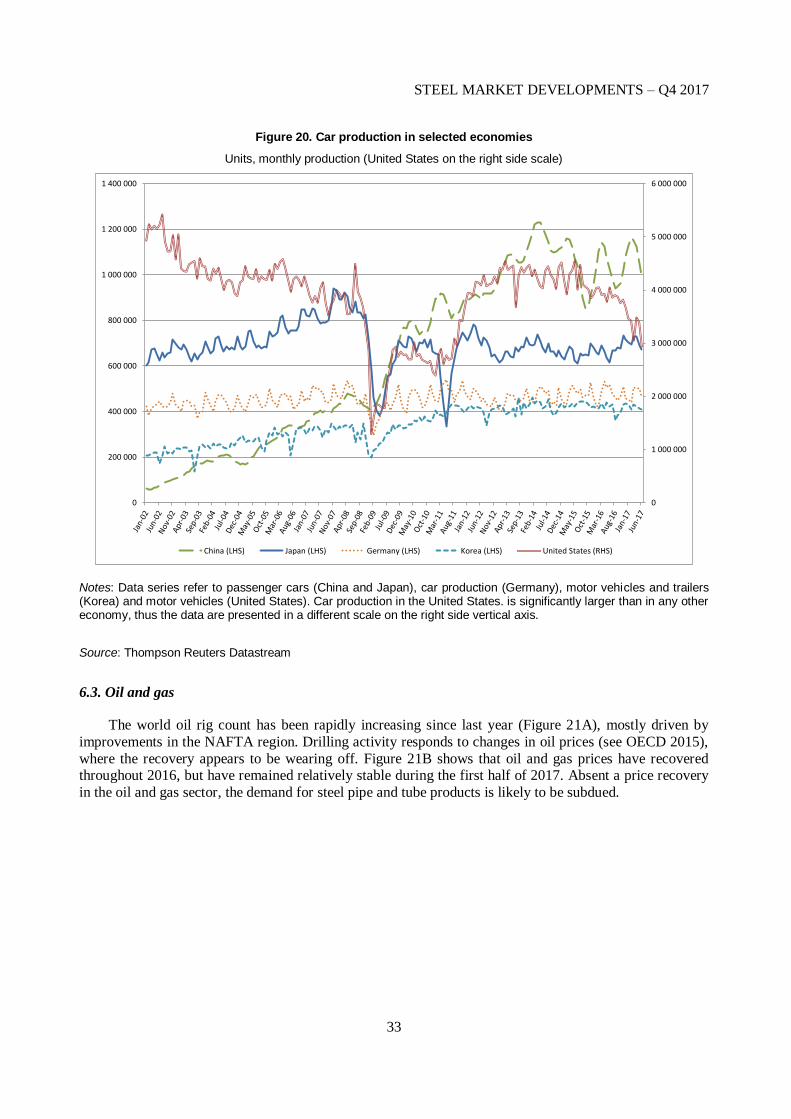
STEEL MARKET DEVELOPMENTS – Q4 2017
33
Figure 20. Car production in selected economies
Units, monthly production (United States on the right side scale)
Notes: Data series refer to passenger cars (China and Japan), car production (Germany), motor vehicles and trailers (Korea) and motor vehicles (United States). Car production in the United States. is significantly larger than in any other economy, thus the data are presented in a different scale on the right side vertical axis.
Source: Thompson Reuters Datastream
6.3. Oil and gas
The world oil rig count has been rapidly increasing since last year (Figure 21A), mostly driven by
improvements in the NAFTA region. Drilling activity responds to changes in oil prices (see OECD 2015),
where the recovery appears to be wearing off. Figure 21B shows that oil and gas prices have recovered throughout 2016, but have remained relatively stable during the first half of 2017. Absent a price recovery
in the oil and gas sector, the demand for steel pipe and tube products is likely to be subdued.
0
1 000 000
2 000 000
3 000 000
4 000 000
5 000 000
6 000 000
0
200 000
400 000
600 000
800 000
1 000 000
1 200 000
1 400 000
China (LHS) Japan (LHS) Germany (LHS) Korea (LHS) United States (RHS)
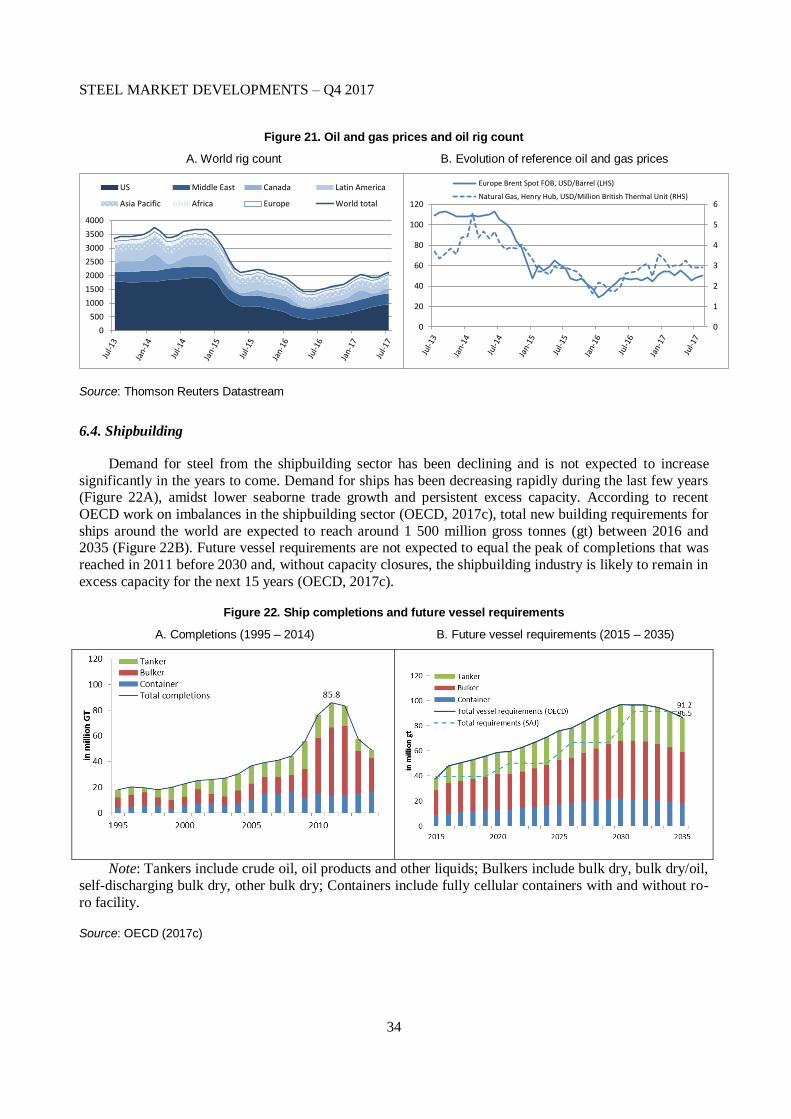
STEEL MARKET DEVELOPMENTS – Q4 2017
34
Figure 21. Oil and gas prices and oil rig count
A. World rig count B. Evolution of reference oil and gas prices
Source: Thomson Reuters Datastream
6.4. Shipbuilding
Demand for steel from the shipbuilding sector has been declining and is not expected to increase
significantly in the years to come. Demand for ships has been decreasing rapidly during the last few years (Figure 22A), amidst lower seaborne trade growth and persistent excess capacity. According to recent
OECD work on imbalances in the shipbuilding sector (OECD, 2017c), total new building requirements for
ships around the world are expected to reach around 1 500 million gross tonnes (gt) between 2016 and 2035 (Figure 22B). Future vessel requirements are not expected to equal the peak of completions that was
reached in 2011 before 2030 and, without capacity closures, the shipbuilding industry is likely to remain in
excess capacity for the next 15 years (OECD, 2017c).
Figure 22. Ship completions and future vessel requirements
A. Completions (1995 – 2014) B. Future vessel requirements (2015 – 2035)
Note: Tankers include crude oil, oil products and other liquids; Bulkers include bulk dry, bulk dry/oil,
self-discharging bulk dry, other bulk dry; Containers include fully cellular containers with and without ro-
ro facility.
Source: OECD (2017c)
0
1
2
3
4
5
6
0
20
40
60
80
100
120
Europe Brent Spot FOB, USD/Barrel (LHS)
Natural Gas, Henry Hub, USD/Million British Thermal Unit (RHS)
0
500
1000
1500
2000
2500
3000
3500
4000
US Middle East Canada Latin America
Asia Pacific Africa Europe World total
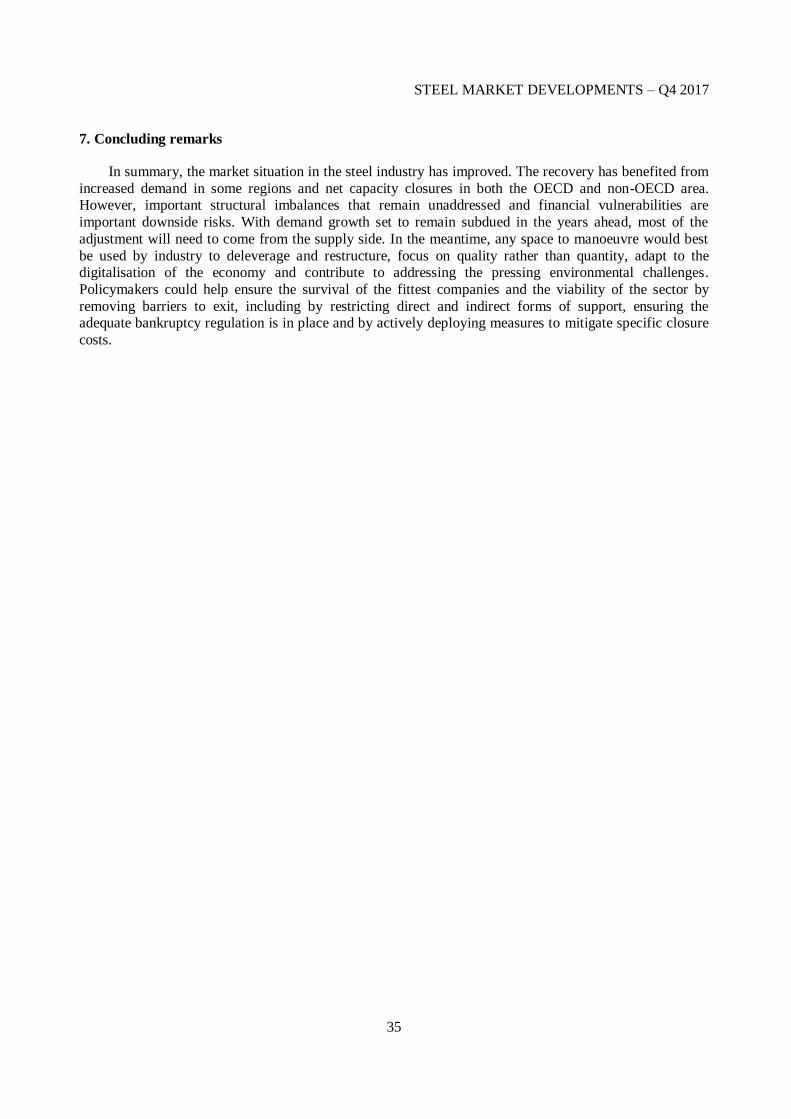
STEEL MARKET DEVELOPMENTS – Q4 2017
35
7. Concluding remarks
In summary, the market situation in the steel industry has improved. The recovery has benefited from
increased demand in some regions and net capacity closures in both the OECD and non-OECD area. However, important structural imbalances that remain unaddressed and financial vulnerabilities are
important downside risks. With demand growth set to remain subdued in the years ahead, most of the
adjustment will need to come from the supply side. In the meantime, any space to manoeuvre would best
be used by industry to deleverage and restructure, focus on quality rather than quantity, adapt to the digitalisation of the economy and contribute to addressing the pressing environmental challenges.
Policymakers could help ensure the survival of the fittest companies and the viability of the sector by
removing barriers to exit, including by restricting direct and indirect forms of support, ensuring the adequate bankruptcy regulation is in place and by actively deploying measures to mitigate specific closure
costs.
STEEL MARKET DEVELOPMENTS – Q4 2017
36
References
Aço Brasil (2017) "Brazil Steel News, 36th edition", Brazil Steel Institute, May, 2017. Available at:
http://www.acobrasil.org.br/siderurgiaemfoco/Aco_Brasil_Informa_Mai_17_ingles.pdf
ALACERO (2017), "Revista de acero Latinoamericano: Mayo-Junio 2017", Asociación
Latinoamericana del Acero (ALACERO), June 2017, Available at:
https://www.alacero.org/es/page/revista/edicion/acero-latinoamericano-mayo-junio-2017
CISA (2015), “Annual General Meeting”, 14 January 2015, China Iron and Steel Association, available at:
http://www.chinaisa.org.cn/gxportal/DispatchAction.do?efFormEname=ECTM40&key=B2QAPwtgUTAD
YgYxVzADYgVhBmYEYAA2V2cCNwVgVWAFFl0SDxQCMlBBBUJTRAZk
EUROFER (2017), "Economic and Steel Market Outlook 2017-2018", European Confederation of
Iron and Steel Industries (EUROFER), Brussels 10 July 2017. Available at:
http://www.eurofer.org/Issues%26Positions/Economic%20Development%20%26%20Steel%20Market/Market%20Report-2017-Q3_final.pdf
Lichtenstein, J. (2017), "Steeling for disruption: Global steel producers must reinvent themselves as
demand growth disappears", Accenture, https://www.accenture.com/_acnmedia/PDF-40/Accenture-WEF-
Steeling-For-Disruption"
ME (2017), "China's plans to build new huge city unexpectedly support steel market" Metal Expert, 5
April 2017.
MIIT (2015), “Annual report”, Ministry of Industry and Information Technology of China, available at: http://ycls.miit.gov.cn/n11293472/n11295125/n11299515/16444885.html.
MIIT (2016), 13th FYP Steel Sector Development Plan. Ministry of Industry and Information
Technology of China, available at:
http://www.miit.gov.cn/n1146295/n1652858/n1652930/n3757016/c5353943/content.html
Ministry of Steel (2017), "National Steel Policy", Ministry of Steel, India, May 2017. Available at:
http://steel.gov.in/national-steel-policy-nsp-2017.
OECD (2017a), "Recent developments in steel trade and trade policy measures", internal working document, Directorate for Science, Technology and Industry. DSTI/SC(2017)3
OECD (2017b), " Capacity Developments in the World Steel Industry", OECD Publishing, Paris, July
2017. Available at: http://www.oecd.org/industry/ind/CapacityDevelopmentsWorldSteelIndustry_FINAL.pdf
OECD (2017c), "Imbalances in the shipbuilding industry and assessment of policy responses", OECD
Publishing, Paris. Available at: http://www.oecd.org/industry/ind/Imbalances_Shipbuilding_Industry.pdf
OECD (2016), "Steel Market Developments -Q4 2016", OECD Publishing, Paris. Available at: http://www.oecd.org/sti/ind/steel-market-developments-2016Q4.pdf
OECD (2015) "Steel Market Developments -Q2 2015". OECD Publishing, Paris. Available at:
http://www.oecd.org/sti/ind/1-Steel-market-developments-2015Q2.pdf
STEEL MARKET DEVELOPMENTS – Q4 2017
37
SEAISI (2017), "2017 SEAISI Statistical Yearbook", South East Asia Iron and Steel Institute, July
2017. Available at: http://www.seaisi.org
Silva, F. and A. de Carvalho (2016), "Evaluating the financial health of the steel industry", OECD Publishing, Paris. Available at: www.oecd.org/sti/ind/Evaluating-Financial-Health-Steel-Industry.pdf
Xinhua (2017a), "Beijing tightens individual purchase of commercial building", Xinhua, Beijing, 26
March 2017. Available at: http://news.xinhuanet.com/english/2017-03/26/c_136159340.htm
Xinhua (2017b), "China moves to correct irregular local govt financing", Xinhua, Beijing, 4 May 2017. Available at:
http://english.gov.cn/state_council/ministries/2017/05/04/content_281475644960978.htm
Worldsteel (2017), "World Steel in Figures 2017" World Steel Association, Brussels, June 2017. Available at: https://www.worldsteel.org/publications/bookshop/product-details.~World-Steel-in-Figures-
2017~PRODUCT~World-Steel-in-Figures-2017~.html
Zhong, F. (2016). Restructuring of the Chinese Steel Industry : Retrospects and Prospects. Asian Steel Watch, 2, 78–87.
STEEL MARKET DEVELOPMENTS – Q4 2017
38
ANNEX 1: FINANCIAL DATA
The firm-level dataset of steel companies' financials used in this paper is constructed from both active
and inactive listed steelmaking companies that are included in both NAICS classification (codes 3311 and 3312) and Thomson Reuters Activity classification (5120102010 and 5120102013-6) between 2000 and
2016. Financials were retrieved from Thomson Reuters Eikon and were used as given. For the purpose of
the analysis in this paper and to ensure a high representativeness of companies covered, the analysis
focuses on data from 2000 to 2016, with valid sample size varying from 230 to 516. Changes in sample size are a result of the combined effect of data availability and market entry and exit.
Three key indicators are used to analyse the profitability and indebtedness of steelmaking companies
between 2000 and 2016. These include EBITDA to sales ratio, net profit margin and the share of total debt on total asset. In order to shed some light on the distributional properties of each indicator, different
statistical measures are calculated: i) the weighted industry average, ii) the industry median and iii) the first
and third quartiles of the distribution. The industry average is calculated using each company's market share in terms of total sales revenues as weights, while the first, second (median) and third quartile of the
distribution are directly obtained from the firm-level observation. All computations are performed using
STATA.
EBITDA is calculated by deducting all expenses from revenue except interest, tax, depreciation and amortization. It serves as a good core profitability measure across companies, regardless of their cost
structure and operating leverage. EBITDA to sales ratio shows the share of the sales of a company that can
be translated to EBITDA.
Unlike EBITDA, net profit takes into account all expenses, including tax, interest, depreciation and
amortization. Net profit margin measures the overall profitability of a company. It shows how much of
each dollar collected by a company as revenue translates into profit.
The share of debt on total asset is a measure of indebtedness. This indicator shows the percentage of a company’s assets that have been financed through debt. Accordingly, it measures the degree of leverage of
a firm, including both short- and long-term debt.
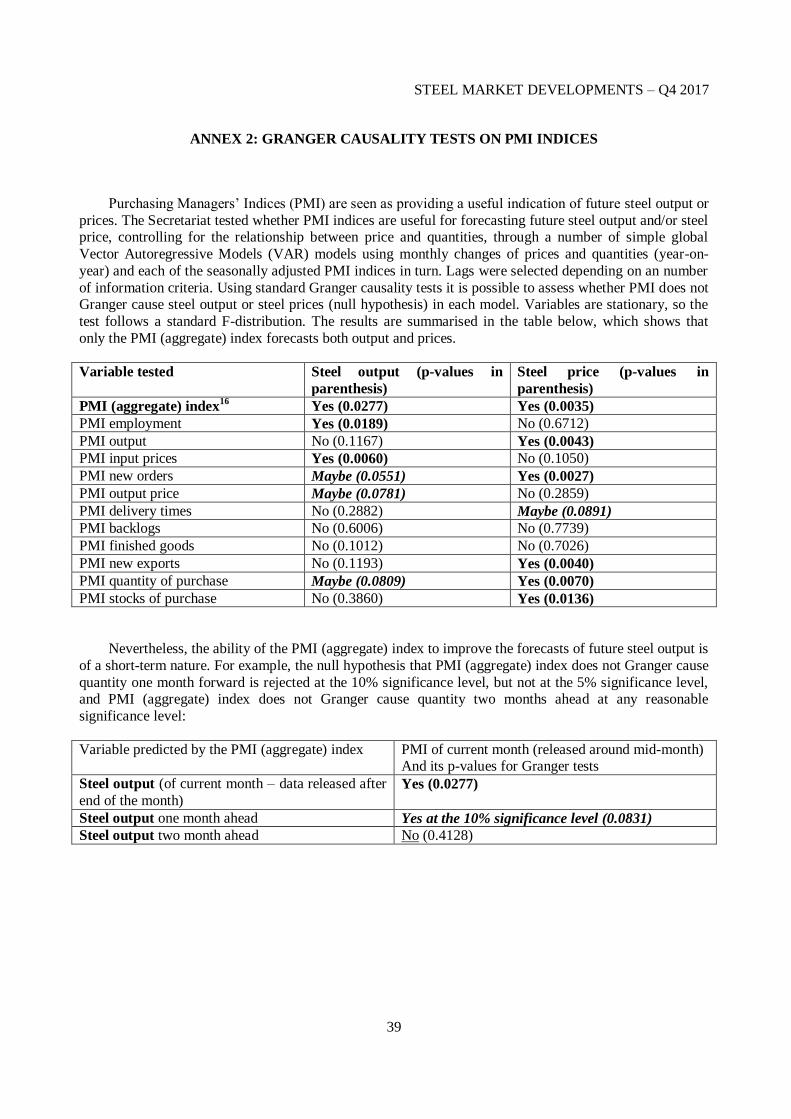
STEEL MARKET DEVELOPMENTS – Q4 2017
39
ANNEX 2: GRANGER CAUSALITY TESTS ON PMI INDICES
Purchasing Managers’ Indices (PMI) are seen as providing a useful indication of future steel output or
prices. The Secretariat tested whether PMI indices are useful for forecasting future steel output and/or steel price, controlling for the relationship between price and quantities, through a number of simple global
Vector Autoregressive Models (VAR) models using monthly changes of prices and quantities (year-on-
year) and each of the seasonally adjusted PMI indices in turn. Lags were selected depending on an number
of information criteria. Using standard Granger causality tests it is possible to assess whether PMI does not Granger cause steel output or steel prices (null hypothesis) in each model. Variables are stationary, so the
test follows a standard F-distribution. The results are summarised in the table below, which shows that
only the PMI (aggregate) index forecasts both output and prices.
Variable tested Steel output (p-values in
parenthesis)
Steel price (p-values in
parenthesis)
PMI (aggregate) index16
Yes (0.0277) Yes (0.0035)
PMI employment Yes (0.0189) No (0.6712)
PMI output No (0.1167) Yes (0.0043)
PMI input prices Yes (0.0060) No (0.1050)
PMI new orders Maybe (0.0551) Yes (0.0027)
PMI output price Maybe (0.0781) No (0.2859)
PMI delivery times No (0.2882) Maybe (0.0891)
PMI backlogs No (0.6006) No (0.7739)
PMI finished goods No (0.1012) No (0.7026)
PMI new exports No (0.1193) Yes (0.0040)
PMI quantity of purchase Maybe (0.0809) Yes (0.0070)
PMI stocks of purchase No (0.3860) Yes (0.0136)
Nevertheless, the ability of the PMI (aggregate) index to improve the forecasts of future steel output is
of a short-term nature. For example, the null hypothesis that PMI (aggregate) index does not Granger cause
quantity one month forward is rejected at the 10% significance level, but not at the 5% significance level, and PMI (aggregate) index does not Granger cause quantity two months ahead at any reasonable
significance level:
Variable predicted by the PMI (aggregate) index PMI of current month (released around mid-month) And its p-values for Granger tests
Steel output (of current month – data released after
end of the month) Yes (0.0277)
Steel output one month ahead Yes at the 10% significance level (0.0831)
Steel output two month ahead No (0.4128)
STEEL MARKET DEVELOPMENTS – Q4 2017
40
NOTES
1 For example, according to the US Bureau of Labour Statistics, real (adjusted for consumer inflation)
average hourly earnings increased by only 0.7 percent, seasonally adjusted, from July 2016 to July 2017
(https://www.bls.gov/news.release/pdf/realer.pdf).
2 The economies are Brazil, China, Germany, India, Japan, Korea, Russia and the United States.
3 See for example “China steel association blasts price speculation - Reuters News”, 10 August 2017.
4 Real steel consumption grew at 4.1%.
5 All monthly crude steel production data in this section are from the World Steel Association. Data
corresponding y-o-y percent changes refer to the period January-June 2017, compared to the same exact
period in 2016. Data for the most recent months might be subject to significant revisions going forward.
6 The differences between exports and imports in ISSB data result from database coverage. Data are
available for more of the exporting countries than the importing countries on ISSB database.
7 The composite domestic steel price index for China is available at http://www.custeel.com/en/price.jsp
8 See Silva and de Carvalho, 2016 for a discussion about financial sustainability in the steel sector.
9 Recent research by Accenture forecast global steel demand to grow at only 1.1% per year until 2035,
reaching 1.87 billion metric tonnes, in a business as usual scenario (Lichtenstein, 2017).
10 The revised capacity data take into account all the information collected by the OECD, until June 2017,
regarding capacity additions and closures at the plant level.
11 As an illustration, the forecast of Accenture under business as usual puts steel demand at 1.87 billion
metric tonnes in 2035, in a business as usual scenario (Lichtenstein, 2017), which would still be 0.49
billion metric tonnes short the latest capacity figures for 2017.
12 China’s Ministry of Industry and Information Technology has suggested that China’s steel consumption
has already reached its peak and has stabilised, the so-called “New Normal’’ (MIIT, 2015), a view also
shared by the China Iron and Steel Association (CISA, 2015). More recently, the 13th Five-Year Plan
released in November 2016 estimates that during the next five years, steel production and consumption
would peak and then fall, with crude steel consumption dropping to 650-700 million tonnes and production
to 750-800 million tonnes by 2020 (MIIT, 2016).
13 The Chinese Ministry of Finance promised to tighten control over fundraising indicating that debt
financing of infrastructure would not be allowed for local governments anymore (Xinhua, 2017b).
14 Further information on this measure is available at
https://www.idc.co.za/images/Downstream_Steel_IndustryDevelopment_Fund_Budget_Vote_2017_004_I
DC_input.pdf
15 See for example https://tradingeconomics.com/united-states/total-vehicle-sales.
16 The PMI (aggregate) index is a weighted average of its sub-indices listed in the subsequent lines of the
table: new orders (30%), output (25%), employment (20%), supplier’s delivery times (15%) and stock of
purchase (10%). Markit does not disclose how it decided of those weights, which are possibly Taylor-made to ensure a predictive power both on the price and on the quantity side.

STEEL MARKET DEVELOPMENTS
June
Stay informed by subscribing to our newsletter
OECD News and Innovation, Science Technology and Industry: http://oe.cd/stinews
http://www.oecd.org/sti/ind/steel.htm @ Front cover image courtesy of JFE Steel Corporation
2015
@OECDInnovation
Steel Market Developments provide up-to-date information on global and regional steel markets. Reviewed and approved by the OECD Steel Committee, they are disseminated approximately twice a year to allow policymakers, industry, media and academia to keep abreast of the main trends and recent developments taking place in steel markets.
The reports provide an overview of recent supply and demand developments and, when available, forecasts from publicly available sources. Topics of special interest are occasionally covered, such as developments in steel-related raw material markets, steelmaking capacity trends or updates on specific regions that are important for the global steel market.