Statistics. Some Stats Quotes There are three kinds of lies: lies, damned lies, and statistics....
31
Statistics
-
Upload
alberta-george -
Category
Documents
-
view
228 -
download
0
Transcript of Statistics. Some Stats Quotes There are three kinds of lies: lies, damned lies, and statistics....

Statistics
Some Stats Quotes
• There are three kinds of lies: lies, damned lies, and statistics. Benjamin Disraeli
• The statistics on sanity are that one out of every four Americans is suffering from some form of mental illness. Think of your three best friends. If they're okay, then it's you.
Rita Mae Brown• Statistics are like a bikini. What they reveal is suggestive, but
what they conceal is vital. Aaron Levenstein

What is Statistics
• What is statistics?– It is the science of learning from data.
• Why it is important?– It is everywhere! – It can be used widely in different areas such as
medicine, psychology, politics, business , etc.
Definition
• Data: Information in raw or unorganized form (such as alphabets, numbers, or symbols) that refer to, or represent, conditions, ideas, or objects.
• Population: a population is a complete set of items that share at least one property in common that is the subject of a statistical analysis.
• Sample: A subset of the population

How can we learn from data?
• Collecting data– Survey, interview, census, experiments– Primary data (you collect the data yourself) or
Secondary data( you collect the data from other sources)
– Unbiased and random• Analyzing data• Drawing conclusion from data
Types of Data
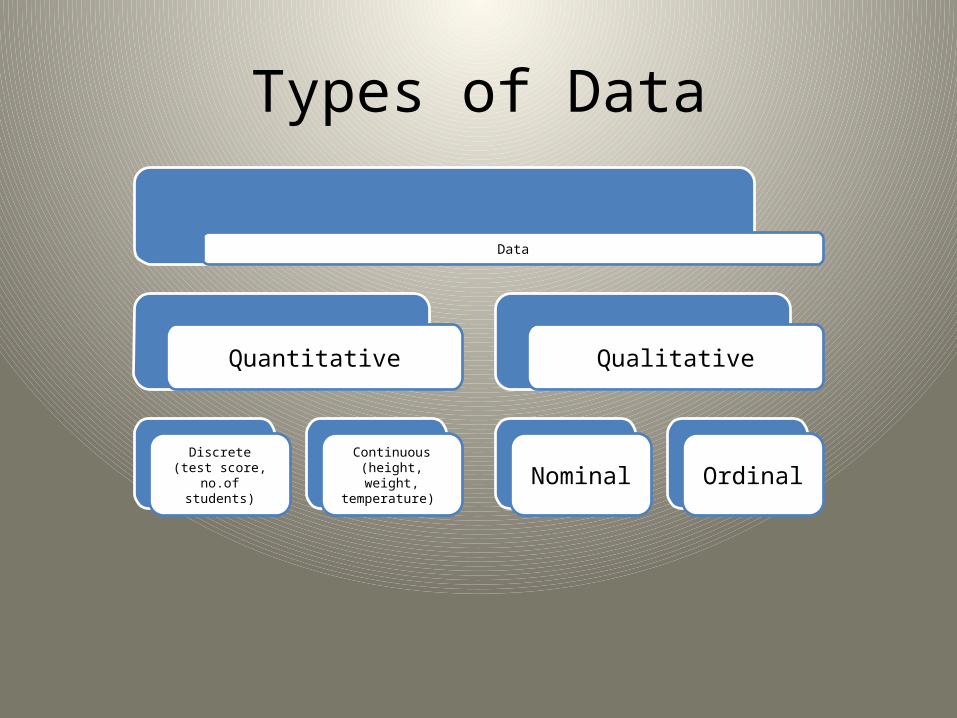
Data
Quantitative
Discrete(test score,
no.of students)
Continuous(height, weight, temperature)
Qualitative
Nominal Ordinal

Types of dataNominal Variable: A qualitative variable that categorizes (or describes, or names) an element of a population.
Ordinal Variable: A qualitative variable that incorporates an ordered position, or ranking.
Discrete Variable: A quantitative variable that can assume a countable number of values. Intuitively, a discrete variable can assume values corresponding to isolated points along a line interval. That is, there is a gap between any two values.
Continuous Variable: A quantitative variable that can assume an uncountable number of values. Intuitively, a continuous variable can assume any value along a line interval, including every possible value between any two values.
Exercise
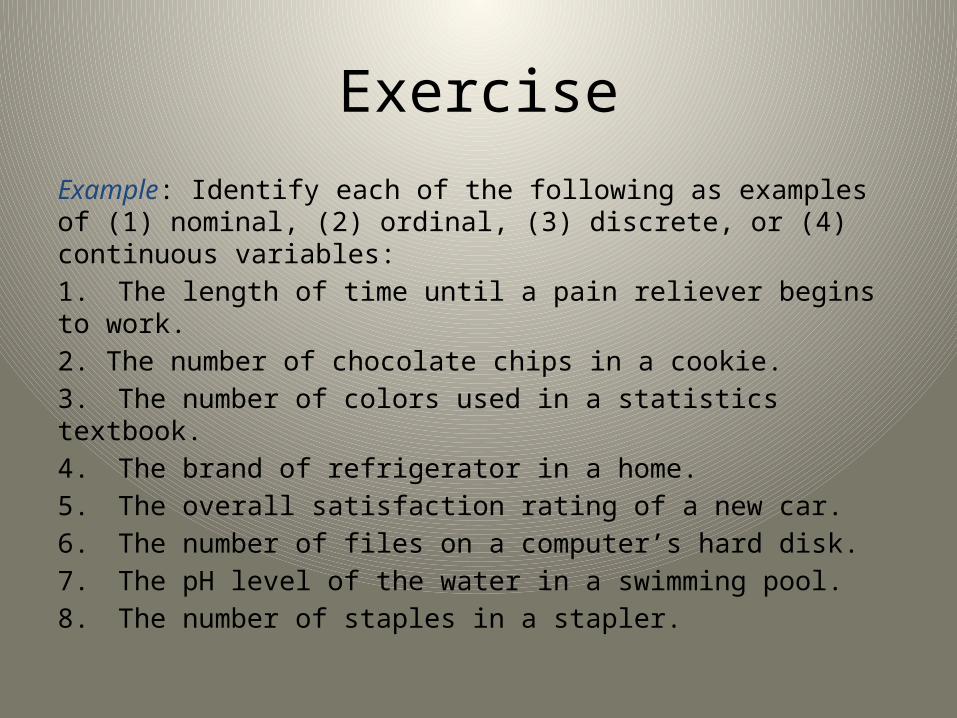
Example: Identify each of the following as examples of (1) nominal, (2) ordinal, (3) discrete, or (4) continuous variables:1. The length of time until a pain reliever begins to work.2. The number of chocolate chips in a cookie.3. The number of colors used in a statistics textbook.4. The brand of refrigerator in a home.5. The overall satisfaction rating of a new car.6. The number of files on a computer’s hard disk.7. The pH level of the water in a swimming pool.8. The number of staples in a stapler.
Data
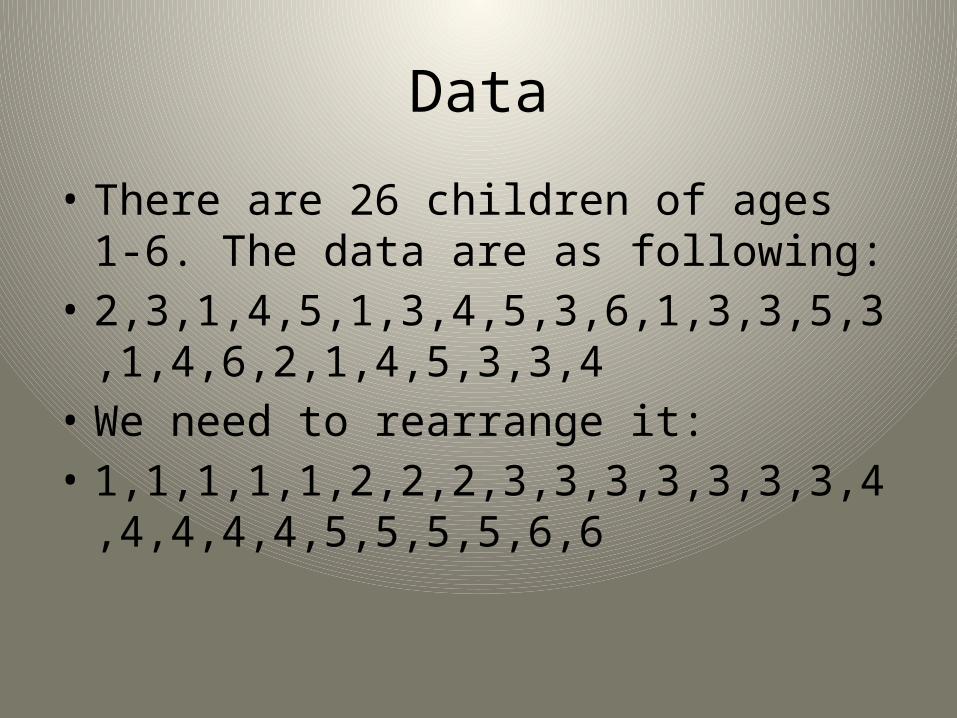
• There are 26 children of ages 1-6. The data are as following:
• 2,3,1,4,5,1,3,4,5,3,6,1,3,3,5,3,1,4,6,2,1,4,5,3,3,4
• We need to rearrange it:• 1,1,1,1,1,2,2,2,3,3,3,3,3,3,3,4,4,4,4,4,5,5,5,5,6,
6

Frequency Distribution
• Frequency: how many times a number occurs• The frequency distribution of variable ‘age’
can be tabulated as follows: •
Age 1 2 3 4 5 6
Frequency 5 3 7 5 4 2
Frequency Distribution of Age
Grouped Frequency Distribution of Age:Age Group 1-2 3-4 5-6
Frequency 8 12 6

Cumulative Frequency
• The total of a frequency and all frequencies so far in a frequency distribution.
•
Age Group 1-2 3-4 5-6
Frequency 8 12 6
Cumulative Frequency 8 20 26
Age 1 2 3 4 5 6
Frequency 5 3 7 5 4 2
Cumulative Frequency 5 8 15 20 24 26
Cumulative frequency of data in previous page

Data Presentation
• Two types of statistical presentation of data - graphical and numerical.
• Graphical Presentation: We look for the overall pattern and for striking deviations from that pattern. Over all pattern usually described by shape, center, and spread of the data.
• Bar diagram and Pie charts are used for categorical variables.
• Histogram, stem and leaf and Box-plot are used for numerical variable.

Data Presentation –Categorical Variable
• Bar Diagram: Lists the categories and presents the percent or count of individuals who fall in each category.
TreatmentGroup
Frequency Proportion Percent(%)
1 15 (15/60)=0.25 25.0
2 25 (25/60)=0.333 41.7
3 20 (20/60)=0.417 33.3
Total 60 1.00 100
Figure 1: Bar Chart of Subjects in Treatment Groups
0
5
10
15
20
25
30
1 2 3
Treatment Group
Nu
mb
er
of
Su
bje
cts
Data Presentation –Categorical Variable
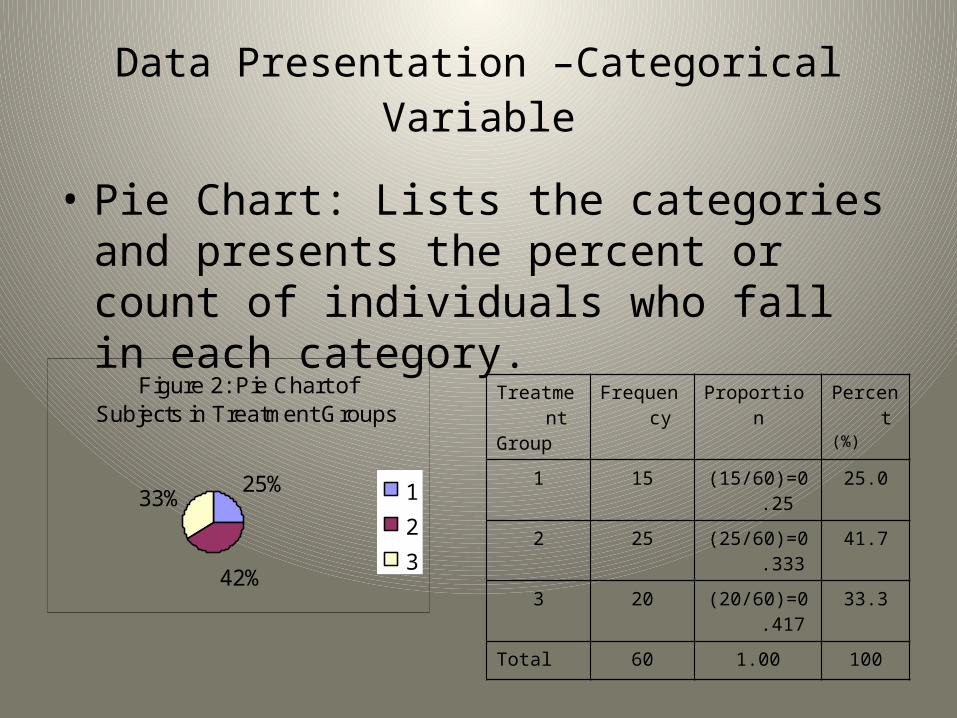
• Pie Chart: Lists the categories and presents the percent or count of individuals who fall in each category.
Figure 2: Pie Chart of Subjects in Treatment Groups
25%
42%
33% 1
2
3
TreatmentGroup
Frequency Proportion Percent(%)
1 15 (15/60)=0.25 25.0
2 25 (25/60)=0.333 41.7
3 20 (20/60)=0.417 33.3
Total 60 1.00 100

Graphical Presentation –Numerical Variable
• Histogram: Overall pattern can be described by its shape, center, and spread. The following age distribution is right skewed. The center lies between 80 to 100.
Figure 3: Age Distribution
0
2
4
6
8
10
12
14
16
40 60 80 100 120 140 More
Age in Month
Nu
mb
er o
f S
ub
ject
s
Mean 90.41666667
Standard Error 3.902649518
Median 84
Mode 84
Standard Deviation 30.22979318
Sample Variance 913.8403955
Kurtosis -1.183899591
Skewness 0.389872725
Range 95
Minimum 48
Maximum 143
Sum 5425
Count 60
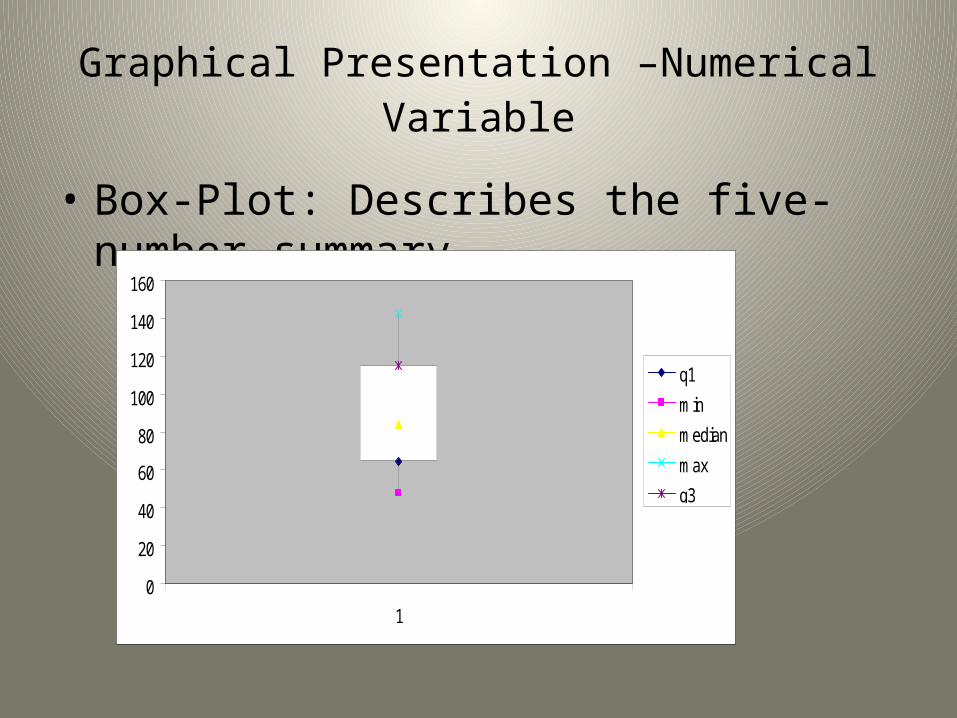
Graphical Presentation –Numerical Variable
• Box-Plot: Describes the five-number summary
0
20
40
60
80
100
120
140
160
1
q1
min
median
max
q3

Numerical Presentation
• Find the center value of the whole set of observations: Measures for center measurement:– Mean– Median– Mode
• Find the dispersion (e.g., average distance from the mean) to indicate how well the central value characterizes the data as a whole: Methods of Variability Measurement– Variance– Standard deviation– Range
Definition
• Mean: The average of the data• Median: The middle number of an ordered set• Mode: The number which appears most often in a set
of numbers.• Variance: measures how far a set of numbers is
spread out.• Standard deviation: A measure of the dispersion of a
set of data from its mean. • Range: the difference between the largest and
smallest value in a set.

Mean
• Mean is the average of the data• To calculate mean, just add up all the numbers
and then divide by how many numbers there are
• E.g. Find the mean for 2,3,5,7,8• (2+3+5+7+8)/5=5
Median
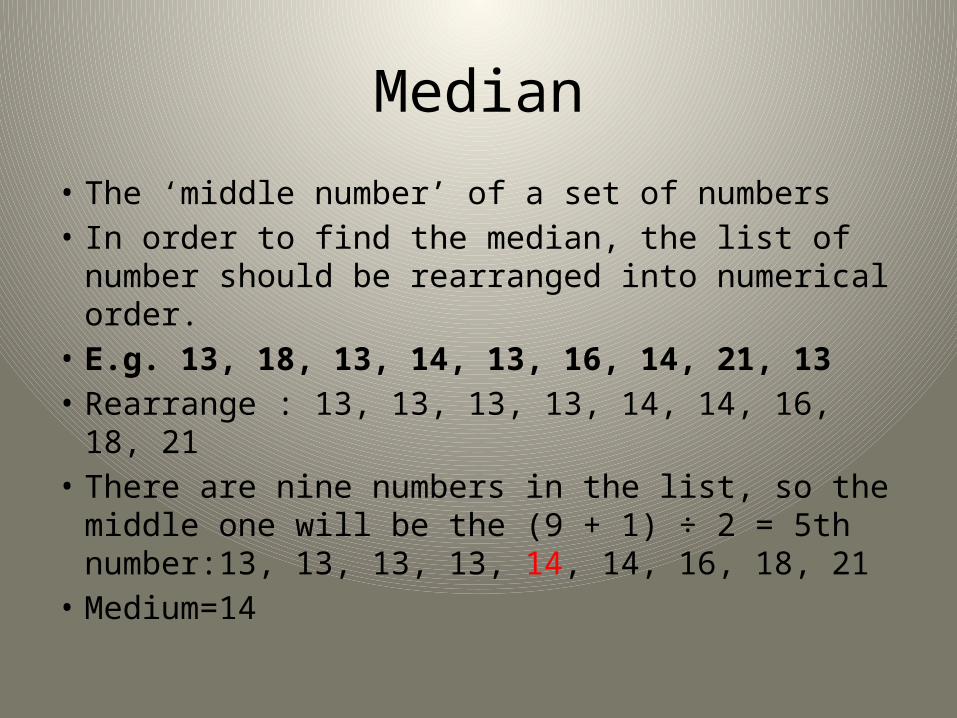
• The ‘middle number’ of a set of numbers• In order to find the median, the list of number
should be rearranged into numerical order.• E.g. 13, 18, 13, 14, 13, 16, 14, 21, 13• Rearrange : 13, 13, 13, 13, 14, 14, 16, 18, 21• There are nine numbers in the list, so the
middle one will be the (9 + 1) ÷ 2 = 5th number:13, 13, 13, 13, 14, 14, 16, 18, 21
• Medium=14
Median
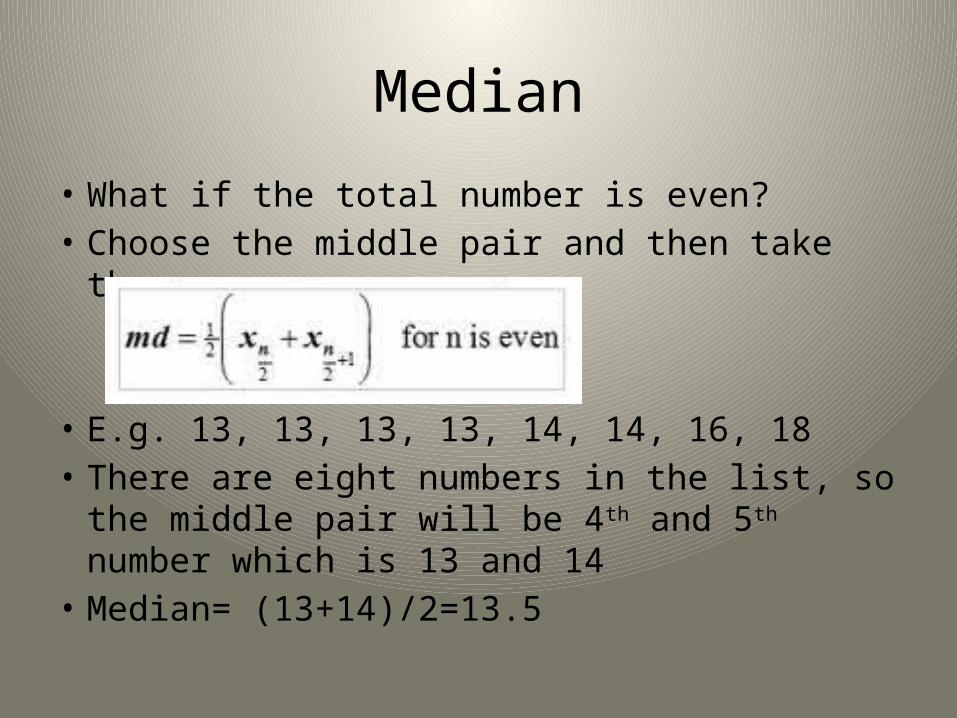
• What if the total number is even? • Choose the middle pair and then take the average
• E.g. 13, 13, 13, 13, 14, 14, 16, 18• There are eight numbers in the list, so the middle
pair will be 4th and 5th number which is 13 and 14• Median= (13+14)/2=13.5

Mean or Median?
• Outlier: The very extreme number in a set• The median is less sensitive to outliers (extreme scores)
than the mean and thus a better measure than the mean for highly skewed distributions, e.g. family income. For example mean of 20, 30, 40, and 990 is (20+30+40+990)/4 =270. The median of these four observations is (30+40)/2 =35. Here 3 observations out of 4 lie between 20-40. So, the mean 270 really fails to give a realistic picture of the major part of the data. It is influenced by extreme value 990.
Exercise1
• A student has gotten the following grades on his tests: 87, 95, 76, and 88. He wants an 85 or better overall. What is the minimum grade he must get on the last test in order to achieve that average?
Solution
• The unknown score is "x". Then the desired average is:
• (87 + 95 + 76 + 88 + x) ÷ 5 = 85• Multiplying through by 5 and simplifying, we
get: • 87 + 95 + 76 + 88 + x = 425
346 + x = 425 x = 79
• He needs to get at least a 79 on the last test.

Variance
• The average of the squared differences from the Mean.• Work out the Mean (the simple average of the numbers)• Then for each number: subtract the Mean and square
the result (the squared difference).• Then work out the average of those squared differences.
(Why Square?)• E.g. Find the variance for 2,3,5,7,8• Mean= (2+3+5+7+8)/5=5• Variance= ((-3)2+(-2)2+02+22+32)/5=5.2

Standard deviation & Range
• Standard deviation is calculated as the square root of variance.
• The more spread apart the data, the higher the deviation.
• Range is a crude measure of variability.
Exercise 2
• Find the mean, median, mode, variance, standard deviation and range for the following sets of numbers.
• 11,8,10,5,12,11,10,11,13,9

Five Number Summary
• Five Number Summary: The five number summary of a distribution consists of the smallest (Minimum) observation, the first quartile (Q1),The median(Q2), the third quartile, and the largest (Maximum) observation written in order from smallest to largest.

The Box Plot
• Box Plot: A box plot is a graph of the five number summary. The central box spans the quartiles. A line within the box marks the median. Lines extending above and below the box mark the smallest and the largest observations (i.e., the range). Outlying samples may be additionally plotted outside the range.
60 80 100 120 140
Boxplot of Age in Month
Age(month)
Choosing a Summary
• The five number summary is usually better than the mean and standard deviation for describing a skewed distribution or a distribution with extreme outliers. The mean and standard deviation are reasonable for symmetric distributions that are free of outliers.

Skewness
• Measures asymmetry of data – Positive or right skewed: Longer right tail
– Negative or left skewed: Longer left tail