Statistics on Race and the Criminal Justice System 2014 · · 2015-11-26from prison, who were...
105
/ Published 26 November 2015 Statistics on Race and the Criminal Justice System 2014 A Ministry of Justice publication under Section 95 of the Criminal Justice Act 1991
Transcript of Statistics on Race and the Criminal Justice System 2014 · · 2015-11-26from prison, who were...

/
Published 26 November 2015
Statistics on Race and the Criminal
Justice System 2014
A Ministry of Justice publication under Section 95
of the Criminal Justice Act 1991

2
Contents
Contents ......................................................................................................... 2
Table of figures and tables ........................................................................... 3
Chapter 1: Executive Summary .................................................................... 7
Chapter 2: Introduction ............................................................................... 10
Chapter 3: Victims ....................................................................................... 13
Risks of victimisation .............................................................................. 13
Perceptions of crime and victimisation ................................................... 15
Incidents and offences with a racial motivation or aggravation .............. 18
Homicide ................................................................................................ 22
Chapter 4: Police Activity ............................................................................ 27
Stops and Searches............................................................................... 27
Arrests ................................................................................................... 35
Penalty Notices for Disorder .................................................................. 40
Cautions ................................................................................................. 41
Chapter 5: Defendants ................................................................................. 44
Prosecutions .......................................................................................... 45
Convictions ............................................................................................ 48
Remands ............................................................................................... 49
Pre-Sentence Reports ........................................................................... 51
Sentencing ............................................................................................. 52
Chapter 6: Offender Characteristics .......................................................... 60
Employment, income and benefits ......................................................... 60
Offending Histories ................................................................................ 64
Chapter 7: Offenders: under supervision or in custody ........................... 68
Prison Population ................................................................................... 68
Safety in custody ................................................................................... 73
Probation ............................................................................................... 75
Home Detention Curfew ......................................................................... 78
Proven Re-offending .............................................................................. 79
Chapter 8: Offence Analysis ....................................................................... 81
Theft Offences – Shoplifting ................................................................... 82
Selected violence against the person offences ...................................... 85
Common assault .................................................................................... 88
Drug Offences ........................................................................................ 89
Chapter 9: Practitioners .............................................................................. 93
Appendix I: Ethnicity Classifications ......................................................... 96
Appendix II: Selection of ethnicity measures ............................................ 98
Appendix III: Population Comparisons .................................................... 102
Revisions Policy ........................................................................................ 104
Contacts ..................................................................................................... 105

3
Table of figures and tables
Figure 1.01: Ethnicity proportions throughout the CJS, 2014
Figure 1.02: Rates per 10,000 population throughout the CJS, by ethnicity, 2014
Figure 3.01: Percentage of persons who were victims once or more of a CSEW personal crime in the previous 12 months, by ethnicity, 2014/15
Figure 3.02: Perception of the effectiveness of the Criminal Justice System, 2014/15
Figure 3.03: Perception of the fairness of the Criminal Justice System, 2014/15
Figure 3.04: Reported being a victim of personal crime and perceived likelihood of being a victim of crime, 2014/15
Figure 3.05: Number of racist incidents recorded by the police, 2010/11 to 2014/15
Figure 3.06 Number of police recorded racially or religiously aggravated offences 2010/11 to 2014/15
Figure 3.07 Number of prosecutions for racially or religiously aggravated offences, 2010 to 2014
Figure 3.08: Apparent method of killing among homicide victims, combined data for 2011/12 to 2013/14
Figure 3.09: Ethnic appearance of homicide victims, by ethnicity of principal suspect, England and Wales, combined data for 2011/12 to 2013/14
Figure 3.11: Homicides currently recorded by location of homicide and ethnic appearance of victim, England and Wales, combined data for 2011/12 to 2013/14
Figure 4.01: Numbers of stops and searches by ethnicity, 2009/10 to 2013/14
Figure 4.02: Percentage distribution of population (persons aged 10 and above) and total stops and searches in England and Wales, by ethnicity, 2013/14.
Figure 4.03: Stops and searches per 1,000 members of the population, 2013/14
Figure 4.04: Stops and searches per 1,000 members of the population in London and the rest of England and Wales, 2013/14
Figure 4.05: Percentage distribution of reasons for stops and searches, by ethnicity, 2013/14
Figure 4.06: Arrest rate following stops and searches, by ethnicity, 2009/10 to 2013/14
Figure 4.07: Percentage distribution of reason for arrest resultant from stop and search, by ethnicity, 2013/14
Figure 4.08: Arrests by self-identified ethnicity, 2009/10 to 2013/14
Figure 4.09: Proportion of arrests within each offence group, by ethnicity, 2013/14

4
Figure 4.10: Arrests by ethnicity and age group, 2009/10 to 2013/14
Figure 4.11: Arrests by self-identified ethnicity, for London and combined remaining forces, 2013/14
Figure 4.12: Arrest rates per 1,000 members of the population by self identified ethnicity, 2013/14.
Figure 4.13: Penalty Notices for Disorder for most common offences, by ethnicity, 2014
Figure 4.14: Offenders cautioned for notifiable offences, per 1000 people, by ethnic group
Figure 4.15: Proportion of cautions issued for each offence group, by ethnicity, 2014
Figure 5.01: Proportions of ethnic groups throughout the Criminal Justice System, 2014
Figure 5.02: Rates per 1,000 members of the population for prosecutions for indictable offences at magistrates’ courts, by ethnicity, in England and Wales, 2014
Figure 5.03: Distribution of prosecutions for indictable offences at magistrates’ courts by offence group, by ethnicity, 2014
Figure 5.04: Percentage distribution of juvenile and adult defendants prosecuted at magistrates’ courts for indictable offences, by ethnicity, in England and Wales, 2014
Figure 5.05: Conviction ratios for indictable offences at all courts by offence group, by ethnicity, 2014
Figure 5.06: Number of defendants remanded in custody at the Crown Court in 2014 per 1,000 members of the population, by ethnicity
Figure 5.07: Proportion of individuals remanded in custody, tried at the Crown Court and in the population, by self-identified ethnicity, 2014
Figure 5.08: Court outcomes of individuals remanded in custody at the Crown Court, by ethnicity, 2014
Figure 5.09 Number sentenced per 1,000 members of the population, for indictable offences at all courts by ethnicity, 2014
Figure 5.10: Percentage of sentencing outcomes, for indictable offences at all courts, by ethnicity, 2010 and 2014
Figure 5.11: Percentage of sentencing outcomes, for all offenders sentenced for indictable offences at all courts by age group and ethnicity, 2014
Figure 5.12: Percentage of sentencing outcomes, for all offenders sentenced for indictable offences at all courts by gender and ethnicity, 2014
Figure 5.13: Distribution of sentences for indictable offences by offence group and ethnicity, 2014

5
Figure 5.14: Custody rate for offenders for indictable offences, by ethnicity, 2010 to 2014
Figure 5.15: The average custodial sentence length (ACSL) for offenders sentenced to immediate custody for indictable offences at all courts, by ethnicity, 2010 to 2014
Figure 6.01: Proportion of working age offenders convicted/cautioned or released from prison, who were claiming benefits one month, one year and two years either side of their conviction/caution or prison sentence, by ethnicity
Figure 6.02: Proportion of working age offenders convicted/cautioned or released from prison, in P45 employment one month, one year and two years either side of their conviction/caution or prison sentence, by ethnicity
Figure 6.03: Median adjusted P14 income (to take into account earnings inflation) of offenders released from prison or convicted/cautioned in 2003/04, by ethnicity, 2004/05 – 2012/13
Figure 6.04: First time offenders sentenced for an indictable offence, by type of sentence and ethnicity, 2014
Figure 6.05: Offenders sentenced for an indictable offence who have 15 or more previous sanctions against them, by type of sentence and ethnicity, 2014
Figure 7.01: British nationals in the prison population by ethnicity per 10,000 people aged 15 years old or more, 2014
Figure 7.02: Foreign national prison population by ethnicity, 2005- 2014
Figure 7.03: Rates of proven adjudications per 100 prisoners, by ethnicity, 2010-2014
Figure 7.04: Prisoners, by whether or not serving an indeterminate sentence and ethnicity, 2014
Figure 7.05: Acts of self-harm per prisoner, by gender and ethnicity, 2014
Figure 7.06: Rates of assaults in prison, by type of participant and ethnicity, 2014
Figure 7.07: Adult offenders supervised by the Probation Service on a Community Order or Suspended Sentence Order by ethnicity per 10,000 people, December 2014
Figure 7.08: Offenders under pre-release and post-release supervision by the Probation Service, by ethnicity, 2014
Figure 7.09: Proportion of eligible prisoners released under Home Detention Curfew by ethnicity, 2011-2014
Figure 7.10: Proven re-offending rates by ethnicity, 2003-2013
Figure 7.11: Re-offences per re-offender by ethnicity, 2003-2013 Figure 8.01: Proportion of offenders given a PND, caution or conviction for shoplifting, by ethnicity, 2014
Figure 8.02: Proportion of offenders convicted of all indictable offences who were convicted for shoplifting, by ethnicity and sex, 2014

6
Figure 8.03: Sentencing outcomes for shoplifting, by ethnicity, 2014
Figure 8.04: Convictions for the selected VATP offences, by ethnicity, 2014 Figure 8.05: Average custodial sentence for all VATP offences and selected offences, by ethnicity, 2014
Figure 8.06: Proportion of offenders given a caution or conviction for drug offences that were given a conviction, by ethnicity, 2010 and 2014.
Figure 8.07: Number of offenders sentenced, offenders sentenced to custody and custody rate for drug offences, by ethnicity, 2014
Figure 8.08: Sentencing outcomes for production, supply and intent to supply a controlled Class A and Class B drug, by ethnicity, 2014
Figure 9.01: Ethnic makeup of organisations involved in the CJS, most recent year available
Figure 9.02: Ethnic makeup of senior staff in organisations involved in the CJS, most recent year available
Table I.01: Mapping of the 4 point classification to the Phoenix Classification
Table I.02: Mapping of different ethnicity categorisations
Table II.01: Proportion of missing data for self-identified ethnicity across key data sources, 2010 to 2015
Table II.02: Concordance between ethnicity figures for White, Black and Asian, combined data for 2010 to 2014, MoJ Court Proceedings Database
Table II.03: Concordance between ethnicity figures for White, Black and Asian suspects for homicides, combined data for 2011/12 to 2013/14
Table II.04: List of data sources and ethnicity classification used
Figure III.01: Ethnic group representation in the population, 2011 Census

7
Chapter 1: Executive Summary
This publication compiles statistics from data sources across the Criminal Justice
System (CJS), to provide a combined perspective on the typical experiences of
different ethnic groups. No causative links can be drawn from these summary
statistics, and no controls have been applied to account for differences in
circumstances between groups (e.g. average income or age); differences observed
may indicate areas worth further investigation, but should not be taken as evidence
of bias or as direct effects of ethnicity.
In general, Black, Asian and Minority Ethnic (BAME) groups appear to be over-
represented at most stages throughout the CJS, compared with the White ethnic
group, though this is not universal and does not appear to increase as they progress
through the CJS. Among BAME groups, Black and Mixed individuals were often the
most over-represented. Trends over time for each ethnic group have tended to mirror
overall trends, with little change in relative positions between ethnic groups.
Victimisation
The risk of being a victim of crime was significantly higher for BAME groups,
compared with the White ethnic group. Consistently, a higher proportion of the Mixed
ethnic group reported being victims of a personal crime, though this is not reflected in
the number of people in the Mixed ethnic group who believed it was likely that they
would be a victim of crime in the next year. Homicide rates were higher for Black
victims, compared with White and Asian victims, with members of each ethnic group
being most frequently killed by someone of the same group. Police records show
increases in the levels of racially or religiously aggravated crimes, whereas surveys
of personal victimisation show a fall in the numbers of racist incidents being
experienced. (A possible explanation for this disparity could be improved recording or
detection practices by the police.)
Police Activity
In 2013/14, compared with the White ethnic group, stops and searches were more
likely to be carried out on the Black (four and a half times more likely), Mixed (twice
as likely) and Asian (one and a half as likely) ethnic groups. Proportions of stops and
searches resulting in arrests were also higher for the Black and Mixed groups. More
generally, the Black and Mixed ethnic groups’ arrest rates per 1,000 people were
almost three and two times higher respectively, compared with other ethnic groups.
Of all offence groups, robbery had the largest proportion of BAME arrests (37%) and
burglary the lowest (12%). No clear trend was seen in the issuing of penalty notices
for disorder to BAME versus White individuals, but the Black ethnic group received
cautions at three times the rate of other groups.

8
Defendants
Relative to the population, the rates of prosecution and sentencing for the Black
ethnic group were three times higher than for the White group, while for the Mixed
group they were twice as high, mirroring arrests. (A similar pattern could be seen for
custodial remand during Crown Court trials.) In contrast, White and Chinese and
Other offenders had the highest conviction ratios, consistently for the past 5 years.
There is variation in custody rates across ethnic groups and offence groups;
differences in patterns of offending may well explain these. Since 2010, average
custodial sentence lengths have risen for all ethnic groups, but remained consistently
highest for Asian and Black offenders, and higher for all BAME groups compared
with White offenders.
Figure 1.01: Ethnicity proportions throughout the CJS, 20141
Offender Characteristics
White - North European and Black offenders were the most likely to claim out-of-work
benefits one month after conviction/caution/release from prison. White - North
European offenders consistently had the highest median income from employment in
the years following conviction/caution/release. The proportion of first-time offenders
that are White is lower than the proportion of White adults in the population, while the
proportion of prolific offenders that are White is higher.
Offenders under supervision or in custody
Relative numbers in the prison population varied greatly between ethnic groups:
there were around 15 prisoners for every 10,000 people in England and Wales,
similar to the White and Asian rates, but this includes only 6 prisoners for each
10,000 Chinese and Other population members, and 44 and 55 prisoners for each
10,000 Mixed and Black population members respectively. This seems to be driven
1 Arrests data from 2013/14. Population data from 2011 Census. Prison population at June 2014.
0 20 40 60 80 100
Population
Arrests
Prosecutions
Convictions
Prison population
Percentage
Ethnicity throughout the Criminal Justice System in England and Wales
White Black Asian Mixed Chinese and Other

9
by differences in prosecutions, remand and sentencing – no differences were seen in
the proportion of custodial sentences served in prison – and these groups also had
higher rates of probation service supervision. Mixed and Black prisoners were most
likely to fight other prisoners and had the highest rates of prison discipline, while
White prisoners generally were more likely to self-harm. Although there was no
difference in rates of recall between ethnic groups, Black and White individuals
convicted or cautioned were more likely to subsequently reoffend than Asian or Other
individuals, with White re-offenders having the largest number of re-offences.
Figure 1.02: Rates per 1,000 population throughout the CJS, by ethnicity, 20142
Offence analysis
Differences between ethnic groups could be seen when specific offences were
examined, but the differences varied by offence; typical behaviours and sentencing
patterns vary between ethnic groups at an offence level (although the small numbers
involved limit the ability to make fair comparisons). For example, Black and Asian
offenders convicted of supplying drugs or related offences are more likely to be for
Class A drugs than for Class B, whereas the opposite is true for all other ethnic
groups.
Practitioners
BAME groups were underrepresented relative to the population among the police,
National Offender Management Service, judiciary and magistracy, with proportions
increasing slowly or remaining broadly the same over the last 5 years. They appear
to be particularly underrepresented among senior staff throughout the CJS,
consistently for the last 5 years.
2 Arrests data from 2013/14. Prison population at June 2014.
0
10
20
30
40
50
60
Rate
per
1,0
00 p
op
ula
tio
n
Rates throughout the Criminal Justice System by ethnicity, in England and Wales
White Black Asian Mixed Chinese and Other
Arrests Prosecutions Convictions Prisonpopulation

10
Chapter 2: Introduction
Section 95 of the Criminal Justice Act 1991 states that: ‘The Secretary of State shall in each year publish such information as he considers expedient for the purpose... of facilitating the performance of those engaged in the administration of justice to avoid discriminating against any persons on the ground of race or sex or any other improper ground...’ Documents fulfilling this requirement have been published since 1992, in the form of statistical information. This report, as with previous editions, brings together information on the representation of ethnic groups among victims, suspects, defendants and offenders within the Criminal Justice System. It also provides details of practitioners within the Criminal Justice System (CJS). The publication aims to help practitioners, policy makers, academics and members of the public understand trends in the CJS in England and Wales, and how these vary between ethnic groups, and over time. The identification of differences should not be equated with discrimination, however, as there are many reasons why apparent disparities may exist which would require further investigation. This is the latest biennial compendium of Statistics on Race and the Criminal Justice System and will be followed next year by its sister publication Statistics on Women and the Criminal Justice System. Other government papers containing information on ethnic groups in the justice system have also been published recently, including the National Offender Management Service (NOMS) Equalities report, Home Office statistics on police powers and procedures and several Ministry of Justice research reports outlining a range of findings from a survey of prisoners (undertaken as part of a survey of adult prisoners sentenced to between one month and four years in prison in England and Wales in 2005 and 2006). Limitations on conclusions Although we explore differences between ethnic groups, it is important that inferences are not made about individuals from group-level data – since we consider averaged outcomes that do not take into consideration the unique sub-set of circumstances that are pertinent to each case. If we take, for example, defendants – there can be a number of points of contact with the CJS, which range from an out of court disposal to standing trial in front of a jury. The sentencing outcome that a person receives depends upon the crime committed, their offending history and a series of mitigating and aggravating factors unique to the person or crime. Because of this, the statistics presented in this report cannot present the typical experience of a person of a particular ethnic group through the Criminal Justice System, but it can highlight areas where further investigation or research may be warranted.
It is important to note that no controls have been applied for other characteristics of ethnic groups, such as average income or age, so it is not possible to determine what proportion of any differences identified in this report are directly attributable to ethnicity. It is also not possible to make any causal links between ethnicity and CJS outcomes.

11
Ethnicity Ethnicity is recorded by either self-reporting or as identified by a police officer. When ethnicity is self reported, it is based on the 2011 and 2001 Census Categorisation, with five broad categories: White, Black, Asian, Mixed and Chinese or Other. When ethnicity is officer identified3, it has four broad ethnicity categories: White, Black, Asian and Other. See Appendix I for further details of how detailed ethnicity categorisations are aggregated. Generally we discuss the broad categories individually, to reflect their different experiences, but given the much greater numbers of White individuals in the population it is sometimes necessary or appropriate to consider the other groups together. In these circumstances the combined group is referred to as BAME, Black, Asian and Minority Ethnic. In acknowledgement of the subjective, multifaceted and changing nature of ethnic identification, we use self identified ethnicity where this data is available. Nevertheless, there tends to be a high degree of consistency between self-reported and officer-identified ethnicity; see Appendix II for further discussion on this point and analysis of concordance in ethnicity reporting between these sources. The form of ethnicity classification being used is reported throughout. Individuals with an unknown or not stated ethnicity are not included in the analysis, because it is impossible to tell where they should be counted. High levels of missing ethnicity data would be of concern, both in terms of sample sizes and the risk of systematic bias. To allow users to assess the confidence they have in the data we are using, levels of missing or unreported ethnicity are reported throughout. For comparisons to the population, we have used 2011 Census data, as the most recent well-validated source of information about the ethnic composition of England and Wales; see Appendix III for further details. Data Every effort is made to ensure that the figures presented are accurate and complete. However, these data have been extracted from large administrative data systems generated by the courts, police forces and other agencies. As a consequence, care should be taken to ensure the limitations of these data are taken into account. All results relate to England and Wales unless explicitly stated otherwise. Large figures are generally presented rounded to the nearest thousand, and percentages to the nearest percentage point in the text, although all calculations have been conducted on unrounded figures (so totals may not sum). Unrounded figures are shown in the accompanying tables, with the exception of the practitioners chapter, for which small numbers have been suppressed and all others rounded to protect individuals’ privacy. Differences between groups in survey data have only been discussed where they are statistically significant, unless stated otherwise.
Data are presented in terms of calendar and financial years, reflecting the reporting cycles and data collection of the agencies contributing information for this publication. For example, data on arrests are presented in financial years, while data from courts, prison and probation are presented in calendar years. Five year trends have been presented wherever possible, and where changes to data systems or data quality issues do not allow for this trends have been presented for the longest periods
3 Officer identified ethnicity can refer to ethnicity recorded by any third party, such as a police officer, clerk or a member of the data entry team.

12
possible. The most recent data available during the compilation of this report has been included, though it is important to note that more recent data may have since been published – for example, updated figures on stops and searches and arrests. Information provided Supplementary Excel tables accompany the chapters, providing additional data where the figures have not previously been published (or not published in that form). Where figures have been published, links are provided as part of the text and tables. Additionally, a research paper using logistic regression to examine the impact of different factors and characteristics, including ethnicity, on the likelihood of receiving a custodial sentence, has been released simultaneously. A technical document titled A Guide to Statistics on Race and the Criminal Justice System is available alongside this report, which provides users with information on the concepts and terminology used within the report, as well as information about data sources, data quality and references. This report is also accompanied by two CSV files, showing self-reported and officer-identified ethnicity from the Court Proceedings database, for the purposes of assessing concurrence between these classifications; and by an infographic summarising key findings. Those familiar with previous editions of this publication will find several additions and
changes in this most recent report. The additions are intended to reflect the needs of
users of the report, including suggestions from members of the expert advisory group
for this publication. New sections include:
analysis of the income, employment and benefit status of offenders before
and after conviction/caution or release from prison
adjudications in prisons
example analysis of specific offences
The overall style and composition of the report have also been changed: the inclusion of more charts and condensing of commentary is intended to make it easier for readers to interpret the relative experiences of ethnic groups throughout the CJS. The Ministry of Justice would welcome any feedback on the content, presentation or on any other aspect of this bulletin – we can be contacted through: [email protected]

13
Chapter 3: Victims
This chapter explores the nature, extent and risks of victimisation, as reported in the
2014/15 Crime Survey for England and Wales (CSEW), based on ethnicity. It also
includes: police recorded crime statistics on racist incidents and racially or religiously
aggravated crimes from Hate crime, England and Wales, 2014/15; analysis of the
MoJ Court Proceedings database; and statistics on homicide (murder, manslaughter
or infanticide) by the ethnic appearance of the victim from the ONS publication,
Focus on: Violent Crime and Sexual Offences 2013/14.
Risks of victimisation
Since not all crimes are reported to the police, the main source of information on the
incidence and likelihood of victimisation for different ethnic groups4 is the Crime
Survey for England and Wales (CSEW). The CSEW is a large nationally
representative survey that asks people about their experience of victimisation
(including crimes not reported to the police) in the previous 12 months. The section
below provides a summary of the key findings relating to ethnicity from the survey, for
adults only. Further data are available in the Crime in England and Wales, Year
Ending March 2015 release, published by the Office for National Statistics5.
As a survey that asks people whether they have experienced victimisation, only
certain offences are covered: violence (though murder cannot be included), robbery,
theft (personal, burglary, vehicle, bicycle, other household) and criminal damage. The
survey does not cover crimes where there is no direct victim, such as possession of
drugs or motoring offences. Significance tests were carried out between the latest
year compared with previous years and between the White ethnic group compared
with each other ethnic group.
4Self-identified ethnicity, coded using the standard 5 point scale – see appendix I 5 Source: The Crime Survey for England and Wales 2014/15, published by the Office for National Statistics, available here for more information: www.ons.gov.uk/ons/publications/re-reference-tables.html?edition=tcm%3A77-373428

14
Figure 3.01: Percentage of persons who were victims once or more of a CSEW personal crime6 in the previous 12 months, by ethnicity7, 2014/15
The risk of being a victim of personal crime was significantly higher for adults from
the Mixed, Black or Black British and Chinese or Other (C&O) ethnic groups than for
adults from the White ethnic group. The proportion of the Mixed ethnic group who
were victims once or more of a CSEW personal crime is over twice that seen for the
White ethnic group and consistently higher in each of the previous six years.
However, it should be noted that the unweighted bases for the Mixed and C&O
groups are much lower than for other groups for each year, so figures should be
interpreted with caution8.
Across all ethnic groups, the 2014/15 CSEW showed a statistically significant
decrease in the proportion of people who had been victims of personal crime
compared with the 2013/14 survey and compared with the 2008/09 survey.
6 Personal crimes are those against the individual and only relate to the respondent’s own personal experience (not that of other people in the household). 7 Ethnic groups reported under the same names as used by the parent publication, but represent the standard 5 point classification as described in Appendix I. 8 Unweighted bases for the 'Mixed' and 'Chinese or Other' groups are much lower than other groups for
each year. In the year ending March 2015 the unweighted bases for these groups were 136 and 180
respectively. Low unweighted bases will increase the size of confidence intervals around the estimates
presented and these figures should therefore be interpreted with caution. The Mixed and C&O groups
also show greater volatility in their time series than the other groups.
0%
2%
4%
6%
8%
10%
12%
14%
16%
18%
20%
White Black or Black British
Asian or Asian British
Mixed Chinese or Other
Perc
enta
ge o
f ad
ults w
ho
were
vic
tim
s o
nce
or m
ore
of
a C
SE
W p
ers
onal crim
e

15
Perceptions of crime and victimisation
Confidence in the Criminal Justice System
Overall confidence in the effectiveness of the Criminal Justice System has increased
across all ethnic groups since 2010/11; a statistically significant increase in all groups
except for the C&O ethnic group. A lower proportion of the White ethnic group had
confidence that the Criminal Justice System (CJS) is effective than BAME groups.
This difference was statistically significant between the White ethnic group and the
Asian or Asian British, Black or Black British and C&O ethnic groups.
Figure 3.02: Perception of the effectiveness of the Criminal Justice System,
2014/15
0%
10%
20%
30%
40%
50%
60%
70%
80%
90%
100%
White Black or Black British
Asian or Asian British
Mixed Chinese or Other
Perc
enta
ge o
f ad
ults w
ho
are
co
nfi
dent th
at
the C
JS
is e
ffective

16
Confidence in the fairness of the CJS overall has also seen a statistically significant
increase since 2010/11, with Asian or Asian British and Chinese or Other ethnic
groups showing a higher confidence than the White ethnic group in 2014/15.
Figure 3.03: Perception of the fairness of the Criminal Justice System, 2014/15
0%
10%
20%
30%
40%
50%
60%
70%
80%
90%
100%
White Black or Black British
Asian or Asian British
Mixed Chinese or Other
Perc
enta
ge o
f ad
ults w
ho
are
co
nfi
dent th
e
CJS
is f
air

17
Perceived likelihood of being a victim of crime
The proportion of people who think it is ‘very’ or ‘fairly’ likely that they will be a victim
of crime in the next year, has decreased across all ethnic groups over the past five
years. Consistently, a higher proportion of the Mixed ethnic group report being
victims of a personal crime, however this is not reflected in the number of people in
the Mixed ethnic group who believe it is ‘very’ or ‘fairly’ likely that they would be a
victim of crime in the next year. The Asian or Asian British ethnic group are most
likely to believe it is ‘very’ or ‘fairly’ likely that they will be a victim of crime9.
Figure 3.04: Reported being a victim of personal crime and perceived
likelihood of being a victim of crime, 2014/15
9 Unweighted bases for the 'Mixed' and 'Chinese or Other' groups are much lower than other groups for
each year. Low unweighted bases will increase the size of confidence intervals around the estimates
presented and these figures should therefore be interpreted with caution.
0% 10% 20% 30% 40% 50%
Chinese or Other
Mixed
Asian or Asian British
Black or Black British
White
Percentage of adults
Believe it is 'very' or 'fairly' likely they would be a victim of crime in the next year
Victim of one or more personal crime in past year

18
Incidents and offences with a racial (or religious) motivation or aggravation
The Home Office publish statistics on hate crimes, racist incidents and racially or religiously aggravated offences in Hate Crime, England and Wales 2014/15. Hate crime is defined as ‘any criminal offence which is perceived, by the victim or any other person, to be motivated by hostility or prejudice towards someone based on a personal characteristic’, such as race or religion. Overall there were around 43,000
race hate crimes and 3,000 religious hate crimes recorded by the police in 2014/1510. Racist incidents recorded by the police refer to any incident, including any crime, which is perceived to be racist by the victim or any other person. Racist incident numbers include incidents which were not subsequently recorded as a crime and ‘cancelled or transferred records’ (formerly referred to as ‘no crimes’)11.
Racially or religiously aggravated offences recorded by the police are particular types of offence aggravated by motivations related to race or religion and allow more severe sentencing for these specific categories of crime. Data on court outcomes for racially or religiously aggravated offences from the Court Proceedings database12 are presented separately. In contrast to police recorded crimes, which are on a victim basis, court outcomes are on an offender basis. For this reason and others, police recorded crime and court outcomes should not be directly compared (please refer to the technical guide for more details). Finally, racially motivated incidents from the CSEW have been provided for further context. Again, direct comparisons should not be made to the other sources due to differences in coverage, including the types of offences captured.
10 Source: Hate Crime, England and Wales 2014/15, available here: www.gov.uk/government/statistics/hate-crime-england-and-wales-2014-to-2015 11 A cancelled or transferred record occurs when the police have originally recorded an offence, but have subsequently determined that the crime did not take place, or was recorded in error. For more information refer to Crime outcomes in England and Wales, 2014/15, available here: www.gov.uk/government/statistics/crime-outcomes-in-england-and-wales-2014-to-2015 12 Source: Criminal Justice Statistics, 2014, available here:
www.gov.uk/government/collections/criminal-justice-statistics

19
Racist incidents recorded by the police Figure 3.05: Number of racist incidents recorded by the police, 2010/11 to 2014/15
In 2014/15, just under 54,000 racist incidents were recorded by the police; equivalent to around 1 racist incident per 1,000 population. Racist incidents recorded by the police fell between 2010/11 and 2011/12 and remained relatively stable in the period 2011/12 to 2013/14 but rose by 10% in the latest year. It is likely that improved recording and identification of racist incidents is a factor behind this increase.
The largest number of racist incidents was recorded by the police in London13, which serves the most ethnically diverse and largest population in England and Wales14. London accounted for 14% of the population in England and Wales and 21% of all racist incidents. While incidents are recorded under the National Standard for Incident Recording in accordance with the same ‘victim focused’ approach that applies for recorded crime, it is known that there are substantial differences between police forces and over time in how they record racist incidents, which may account for much of the variation seen between forces.
13 Includes Metropolitan and City of London police forces 14 Source: Census 2011 data: 10%, 58% and 37% of all individuals from the White, Black and Asian ethnic groups in England and Wales respectively reside in London; London has a total population of 7.1 million - see Appendix III.
0
10,000
20,000
30,000
40,000
50,000
60,000
2010/11 2011/12 2012/13 2013/14 2014/15
Num
ber
of
racis
t in
cid
ents
reco
rded
by the
po
lice
Year ending March

20
Racially or religiously aggravated offences recorded by the police Figure 3.06 Number of police recorded racially or religiously aggravated offences 2010/11 to 2014/15
There were around 38,000 racially or religiously aggravated offences recorded by the police in 2014/15, a 15% increase from 2010/11. Racially or religiously aggravated offences recorded by the police account for 83% of the overall race and religious hate crime numbers mentioned above. Racially or religiously aggravated crimes consist of assault (with and without injury), harassment/causing public fear, alarm or distress and criminal damage15. Racially or religiously aggravated harassment/causing public fear, alarm or distress accounted for three quarters of these aggravated offences in 2014/15. In the same year, of all harassment/causing public fear, alarm or distress offences recorded by the police, around 16% were racially or religiously aggravated while the proportion of assault with/without injury and criminal damage offences that were racially or religiously aggravated was much smaller, below 2%. The Home Office also collects information on the outcomes of police recorded offences16. Racially or religiously aggravated offences were more likely to be dealt with by a charge/summons17 than their non-aggravated counterparts. Charge/summons rates for racially or religiously aggravated criminal damage (21%) and assault without injury (33%) were more than twice those of their non-racially or religiously aggravated counterparts while charge/summons rates for racially or religiously aggravated assault with injury (36%) and harassment/ public fear, alarms
15 Since any offence can be recorded as a hate crime, the number of race or religious hate crimes is greater than the total number of police recorded racially or religiously aggravated offences. 16 For more information on outcomes see Crime Outcomes in England and Wales 2014/15, available here: www.gov.uk/government/uploads/system/uploads/attachment_data/file/445753/hosb0115.pdf 17 The Charge/Summons rate is the proportion of offences which resulted in one or more offender(s) being charged or summonsed.
0
10,000
20,000
30,000
40,000
50,000
60,000
2010/11 2011/12 2012/13 2013/14 2014/15
Num
ber
of
po
lice reco
rded
racia
lly o
r re
ligio
usly
ag
gra
vate
d o
ffences
Year ending March

21
or distress (30%) were also higher. The charge/summons rate for racially or religiously aggravated offences is also higher than for all recorded crime (16% across all recorded crime in 2014/15)18. Figure 3.07 Number of prosecutions for racially or religiously aggravated
offences, 2010 to 2014
Court outcomes for racially or religiously aggravated offences
Prosecutions, convictions and sentencing for religiously or racially aggravated
offences are recorded in the Ministry of Justice Court Proceedings database (see
technical guide for further details). In 201419, just over 8,50020 defendants were
proceeded against for racially or religiously aggravated offences; with
harassment/causing public fear, alarm or distress offences being the most
common21. The number of racially or religiously aggravated crimes proceeded
against at magistrates’ courts fell by 20% over the last 5 year period while the overall
number of crimes proceeded against at magistrates’ courts fell by 11%22.
Of the defendants proceeded against at magistrates’ courts for racially or religiously
aggravated offences23 83% were White, 7% Black, 6% Asian, 3% Mixed and 1%
Chinese and Other, a distribution broadly similar to all defendants proceeded against
18 Source: Crime Outcomes in England and Wales, 2014-2015, available here: www.gov.uk/government/statistics/crime-outcomes-in-england-and-wales-2014-to-2015 19 Uses calendar instead of fiscal year. 20 All defendants have been reported here, including unknowns, for comparison to police figures. Racially or religiously aggravated offences are selected summary non-motoring and triable either way offences. Ethnicity coverage for these selected religiously or racially aggravated offences was 84% in 2014. The ethnicity classification was 5+1 (see Appendix I). 21 Offence types from the Court Proceedings database cannot be directly be compared with the police recorded offence types due to changes in offence classifications – see technical document for further explanation. 22 Source: Criminal justice system statistics: December 2014, available here: www.gov.uk/government/statistics/criminal-justice-system-statistics-quarterly-december-2014 23 Where ethnicity is known
0
2,000
4,000
6,000
8,000
10,000
12,000
2010 2011 2012 2013 2014
Num
ber
of
pro
ceed
ing
s f
or ra
cia
lly o
r re
ligio
usly
ag
gra
vate
d o
ffences
Year

22
at the courts (see chapter 5 – defendants). In the same year around 6,000
defendants were found guilty and sentenced for racially or religiously aggravated
offences. Of these 800 received immediate custody with an average custodial
sentence length of 4-5 months, which was broadly similar for all ethnicities.
Racially motivated incidents The Crime Survey for England and Wales (CSEW) reported a statistically significant decline24 in racially motivated incidents from 154,000 in 2008/09 to 89,000 in 2014/15; and does not parallel the trends in racist incidents and racially and religiously aggravated offences recorded by the police. This supports the idea that improved police recording and identification of racist crimes may be a factor behind the increases seen in the last year25.
Homicide
In the three year period 2011/12 to 2013/1426,27, there were 1,600 homicides
recorded in the Home Office Homicide Index28. The White ethnic group29 accounted
for around three quarters of the total number of homicide victims in the last three
years – although the total number of homicides has decreased over this period.
However, the rate of homicide (the number of victims per million people) was 4 times
higher for Black victims compared with White victims, and 1.5 times higher for Asian
victims. These rates were broadly similar when comparing London (which is more
ethnically diverse30) to the rest of England & Wales.
For all ethnic groups the rates of homicide were highest for males and for those aged
18 and over31; but were about four times higher for Black males compared with White
and Asian males in this age range. In contrast, rates for homicide for juvenile Black
females (aged 18 and under) were twice as high as for juvenile homicides generally;
the relative homicide rates of different ethnic groups vary by gender and age,
although the small numbers involved mean these differences should be interpreted
with caution.
24 Statistical significance testing was completed for all household racially motivated crime and all
personal racially motivated crime separately and both showed a statistically significant decline since
2008/09. Statistical significance for total racially motivated crime was assumed based on these findings. 25 These figures will differ from those published in the Home Office’s publication Hate crime, England and Wales, 2014 to 2015 which were based on averages derived from combined years of CSEW data, rather than individual year datasets 26 Source: Crime Statistics, Focus on Violent Crime and Sexual Offences, 2013/14, available here: www.ons.gov.uk/ons/rel/crime-stats/crime-statistics/focus-on-violent-crime-and-sexual-offences--2013-14/rpt-chapter-2.html#tab-Offences-recorded-as-homicide 27 This section reports on three years of combined data, from 2011/12 until 2013/14. 28 As at 5th November 2014 (rounded), figures are subject to revision as cases are dealt with by the police and by the courts, or as further information becomes available. 29 Homicides are measured using officer-identified ethnic appearance from the 4+1 categorisation (see Appendix I) and coverage of ethnicity between 2005/06 to 2013/14 ranged from 96 to 99%. 30 For further information, see Appendix III, which summarises relevant trends from the 2011 census. 31 The rates quoted are based on calculations made from Home Office data provided in aggregate format. As such, further age breakdowns for each age group are not available for this report and we are unable to replicate the detail of Home Office analysis, which consistently shows that children under the age of one have the highest homicide rates per million population: www.ons.gov.uk/ons/rel/crime-stats/crime-statistics/focus-on-violent-crime-and-sexual-offences--2013-14/rpt-chapter-2.html?format=print

23
Method of Killing
For all ethnic groups, the most common method of being killed was by sharp
instrument. However, there are differences between ethnic groups for other typical
methods of being killed. The proportion of victims killed by shooting was the highest
for the Black ethnic group, compared with the other groups. In contrast, a higher
proportion of victims from the White ethnic group were killed by hitting and kicking.
These findings are broadly consistent across the previous two three-year periods.
Figure 3.08: Apparent method of killing among homicide victims, combined
data for 2011/12 to 2013/14
0
10
20
30
40
50
60
70
80
90
100
White Black Asian Other
Perc
enta
ge k
illed
Ethnicity
Sharp instrument Blunt instrument Hitting, kicking etc
Strangulation Shooting Other

24
Ethnicity of Principal Suspect32
Of the 1,600 homicides recorded in 2011/12 to 2013/14, 88% had a principal suspect
identified, and of these principal suspects, 98% had a known ethnicity.
For most ethnic groups, in the majority of homicide cases, suspects killed victims
from the same ethnic group: 94% of White suspects killed someone from the same
ethnic group, compared with 53% of Black and 60% of Asian suspects.
Figure 3.09: Ethnic appearance of homicide victims, by ethnicity of principal suspect, England and Wales, combined data for 2011/12 to 2013/14
32 There is only ever one principal suspect per homicide victim. Where there are multiple suspects if any
conviction information is available the suspect with the longest sentence or conviction for the most
serious offence is determined to be the principal suspect. In the absence of any court outcome, the
principal suspect is either the person considered by the police to be the most involved in the homicide or
the person with the closest relationship to the victim.
0%
10%
20%
30%
40%
50%
60%
70%
80%
90%
100%
Suspect - White Suspect - Black Suspect - Asian Suspect - Other
Perc
anta
ge k
illed
Victim - White Victim - Black Victim - Asian Victim - Other

25
Relationship of Principal Suspect
The majority of homicide victims are killed by someone known to them, with victims aged under 16 particularly likely to be killed by a family member. 70% of White ethnic group homicide victims aged 16 and over were killed by a family member or other known person. Asian ethnic group homicide victims aged 16 and over (40%) were more likely to be killed by a family member than victims from other ethnic groups. Figure 3.10: Relationship of homicide victims aged over 16 to principal suspect, by ethnic appearance of victim, England and Wales, combined data for 2011/12 to 2013/14
0%
10%
20%
30%
40%
50%
60%
70%
80%
90%
100%
White Black Asian Other
Perc
enta
ge k
illed
Family Other known Stranger

26
Location and circumstances of Homicide
Combined data for 2011/12 through 2013/14 showed that around three in five (62%)
homicides occurred in and around a residential dwelling and one in five (18%) on a
street, alleyway or footpath. This is broadly mirrored for the White, Asian and Other
ethnic groups. In contrast, homicide victims from the Black ethnic group were just as
likely to be killed in on a street, alleyway or footpath as in and around a dwelling; with
two out of five victims killed in each location.
Figure 3.11: Homicides currently recorded by location of homicide and ethnic
appearance of victim, England and Wales, combined data for 2011/12 to
2013/14
No clear ethnicity trends could be seen in the circumstances surrounding the
homicides.
0%
10%
20%
30%
40%
50%
60%
70%
80%
90%
100%
White Black Asian Other
Perc
enta
ge k
illed
House, dwelling Residential homes Licensed premises
Street, footpath, alleyway Open outdoor area Other

27
Chapter 4: Police Activity
This chapter examines individuals who come into contact with the police, either
through being stopped and searched, arrested, receiving a penalty notice for disorder
(PND) or a caution. Headline stops and searches and arrests data have previously
been published by the Home Office33, and are now presented here with an ethnicity
breakdown34. At the time of release of this publication the Home Office has released
new data on stops and searches and arrests for 2014/15 as well as revisions to the
2013/14 data used in the analysis below. Unfortunately this became available after
the cut-off point for inclusion in this release (May 2015); please refer to the Home
Office publication for the newest figures35. Figures for PNDs and cautions have been
taken from the Ministry of Justice publication Criminal Justice Statistics 201436.
Stops and Searches
Police officers have the power to stop and search individuals under different pieces
of legislation. For simplicity, those conducted under section 1 of the Police and
Criminal Evidence Act (PACE) (s1) and section 60 of the Criminal Justice and Public
Order Act 1994 (s60) have been combined37 – further details are provided in the
accompanying technical documentation.
33 Available here: www.gov.uk/government/statistics/police-powers-and-procedures-england-and-wales-year-ending-31-march-2015 34 Uses self identified ethnicity. See appendix I for information on how ethnicity is recorded by police for stops and searches and arrests. 35 Available here: www.gov.uk/government/collections/police-powers-and-procedures-england-and-wales 36 Available here: www.gov.uk/government/statistics/criminal-justice-system-statistics-quarterly-december-2014 37 Stops and searches under s60 have greatly reduced over the past 5 years. In the most recent year stops and searches under s60 accounted for less than 1% of all stops and searches (s1 and s60), a 9 percentage point decrease since 2009/10. s1 encompasses a range of powers and more than 99% of stops and searches in 2014; for information on the legislation and categorisation around stop and search please refer to the technical guide.

28
In 2013/14, there were 837,000 stops and searches38, a 12% reduction from the
previous year. White suspects accounted for 75% of all stops and searches, despite
accounting for 87% of the population.
Since 2010/11 the total number of stops and searches on suspects has declined year
on year. Over the past 5 years stops and searches have reduced by 30%. The
proportion of stops and searches that were conducted on White suspects has
increased by 7 percentage points, from 68% to 75% over the past 5 five years.
Conversely, the percentage of stops and searches on Black suspects has reduced
over the same period by 5 percentage points, from 17% to 12%.
Figure 4.01: Numbers of stops and searches by ethnicity39, 2009/10 to 2013/14
38 Conducted on suspects with known self-identified ethnicity. Since 2009/10, known self-identified ethnicity has remained relatively stable around 95%-96% of all stops and searches. 39 C&O = Chinese and Other
0%
10%
20%
30%
40%
50%
60%
70%
80%
90%
100%
0
130,000
260,000
390,000
520,000
650,000
780,000
910,000
1,040,000
1,170,000
1,300,000
2009/10 2010/11 2011/12 2012/13 2013/14
Perc
enta
ge d
istr
ibutio
n (eth
nic
ity)
Num
ber
of
susp
ects
sto
pp
ed
and
searc
hed
(T
ota
l kn
ow
n)
Year
White Black Asian Mixed C&O Total known

29
Comparisons between London and the rest of England and Wales
The overall ethnicity trends for stops and searches were heavily influenced by stops
and searches conducted in London, due to London’s ethnic composition compared
with the rest of England and Wales40. According to the 2011 census, over half of the
Black ethnic population in England and Wales reside in London, compared with only
a tenth of the White population. Also, in 2013/14 London accounted for a third of all
stops and searches conducted in England and Wales, despite having only 14% of the
population.
The higher proportion of stops and searches in London is also apparent for each
individual ethnic group. For each, the proportion of stops and searches carried out in
London was higher than the proportion of the group resident in London.
Figure 4.02: Percentage distribution of population (persons aged 10 and above)
and total stops and searches in England and Wales, by ethnicity, 2013/14.
40 London includes both the Metropolitan and City of London police force areas
0%
10%
20%
30%
40%
50%
60%
70%
80%
90%
100%
White Black Asian Mixed C&O Total known
Perc
enta
ge d
istr
ibutio
n
Self -identif ied ethnicity
Population: rest of England and Wales Stops and searches: rest of England and Wales
Population: London Stops and searches: London
0%
10%
20%
30%
40%
50%
60%
70%
80%
90%
100%
White Asian Chinese/Other
Perc
enta
ge d
istr
ibutio
n
Self -identif ied ethnicity
Population: London Stops and searches: London
Population: rest of England and Wales Stops and searches: rest of England and Wales

30
If the stop and search data is combined with population data to account for the
differences in ethnic populations across England and Wales41, it shows that there
was a higher probability of being stopped and searched for the Black ethnic group
relative to all others. The Black stop and search rate was four and a half times higher
relative to the White ethnic group. The Mixed ethnic group were twice as likely to be
stopped and searched relative to the White ethnic group, while the Asian group were
one and a half times more likely. The Chinese and Other (C&O) ethnic group were
just as likely to be stopped and searched as the White group.
Figure 4.03: Stops and searches per 1,000 members of the population, 2013/14
41 Appendix III contains details on how rates per 1,000 are calculated.
0
10
20
30
40
50
60
70
White Black Asian Mixed C&O
Sto
p a
nd
searc
h r
ate
per
1,0
00 p
op
ula
tio
n
Self -identif ied ethnicity

31
London had a higher stop and search rate than the rest of England and Wales for all
ethnicities (38 stops per 1,000 compared with 17 stops per 1,000 in the rest of
England and Wales). The White and Black ethnic groups were around two and a half
times more likely to be stopped and searched in London relative to the rest of the
England and Wales, while the Mixed, Asian and C&O groups were around twice as
likely.
Although the probability of being stopped and searched was higher in London relative
to the rest of England and Wales for all ethnicities, the probability of being stopped
and searched as a BAME individual relative to a White individual was fairly similar
between the two areas. Black individuals have a stop and search rate around three
times higher than White individuals in London and around two and a half times higher
in the rest of England and Wales. (This increases to four and a half higher when
considering rates for the whole of England and Wales. This is due to the differences
in the number of stops and searches and population size for these ethnic groups
between London and the rest of England and Wales.)
Figure 4.04: Stops and searches per 1,000 members of the population in
London and the rest of England and Wales, 2013/14
Reasons for Stop and Search
When conducting a stop and search, police record the reason for the search as well
as the ethnicity of the suspect42. There are a number of reasons why the police may
carry out a stop and search: for example, they may suspect an individual is carrying
drugs, or a weapon.
Suspicion of drugs and stolen property were the two most common reasons for all
ethnicities. Asian suspects had a higher proportion of stops and searches that were
42 This applies to s1 of PACE and other legislation. When a suspect is stopped and searched under s60 the police can search the suspect for offensive weapons or dangerous instruments, for this reason stops and searches under s60 have been added to the offensive weapons category of s1.
0
10
20
30
40
50
60
70
80
90
100
White Black Asian Mixed C&O
Sto
p a
nd
searc
h r
ate
per
1,0
00 p
op
ula
tio
n
Self -identif ied ethnicity
London Rest of England and Wales

32
for drugs than any other ethnicity (70%). Conversely, Asian suspects had the
smallest proportion of stops and searches for stolen property. Black suspects had the
highest proportion of stops and searches for offensive weapons.
Figure 4.05: Percentage distribution of reasons for stops and searches, by
ethnicity, 2013/1443
Arrests resulting from Stop and Search
Stop and search is an important detection tool for the police – it allows officers to
search individuals without an arrest taking place. The proportions of stops and
searches that do not result in an arrest should not be immediately regarded as a
misuse of the power.
Any subsequent arrests resulting from a stop and search may not be related to the
initial reason for the stop and search. For example, an officer may suspect that an
individual is carrying drugs, but actually find them to be carrying a weapon. As a
result, arrest rates give an overall picture of the number of stops and searches
leading to arrests, but do not give insight into arrest rates for specific offence
categories.
43 South Wales were unable to categorise the reason for 817 stops and searches conducted on suspects of known ethnicity. These have been excluded from this figure.
0%
10%
20%
30%
40%
50%
60%
70%
80%
90%
100%
White Black Asian Mixed C&O
Perc
enta
ge o
f re
aso
ns
Self -identif ied ethnicity
Drugs Stolen property
Going equipped Offensive weapons (inc. f irearms and s60)
Other (inc. criminal damage)

33
Over the past 5 years, despite the 30% decrease in stops and searches, the number
of arrests resultant from stops and searches had remained relatively steady,
decreasing by 2% over this period. As a consequence, rates of arrest resulting from
stops and searches had increased. Over this 5 year period the number of resultant
arrests for White suspects had reduced by 6% while BAME ethnic groups had seen
an increase in arrests of between 8% and 16%. For this reason, as well as the
changes in proportions of stops and searches for different ethnicities, BAME
suspects had seen larger increases in arrest rate than White suspects. In the most
recent year, Asian suspects had a resultant arrest rate similar to White suspects
while Black, Mixed and C&O suspects had a substantially higher resultant arrest rate.
Figure 4.06: Arrest rate following stops and searches, by ethnicity, 2009/10 to
2013/14
0%
2%
4%
6%
8%
10%
12%
14%
16%
18%
2009/10 2010/11 2011/12 2012/13 2013/14
Resultant
arr
est
rate
Year
White Black Asian Mixed C&O

34
Reasons for arrests resulting from stops and searches44
For all ethnicities, except C&O, drugs and stolen property were the first and second
most common reason for arrests resulting from stops and searches respectively (for
C&O suspects, drugs and stolen property had the same percentage distribution).
Although it is impossible to fairly compare the reasons for arrest and for being
stopped directly (because the two records cannot be directly linked), it is interesting
to note the similarities in the distributions observed in figures 4.05 and 4.07. For
example, for Asian suspects, drugs represent the highest proportion of reasons for
stops and searches and resultant arrests.
Figure 4.07: Percentage distribution of reason for arrest resultant from stop
and search, by ethnicity, 2013/1445
44 When a suspect is stopped and searched under s60 it is so the police can search the suspect for offensive weapons or dangerous instruments; to account for this resultant arrests from stops and searches under s60 have been added to the offensive weapons category of under s1 for the purposes of analysis. 45 South Wales were unable to categorise the reason for 99 arrests resulting from a stop and search on suspects of known ethnicity. These have been excluded from this figure.
0%
10%
20%
30%
40%
50%
60%
70%
80%
90%
100%
White Black Asian Mixed C&O
Perc
enta
ge o
f re
aso
ns
Self -identif ied ethnicity
Drugs Stolen property
Going equipped Offensive weapons (inc. f irearms and s60)
Other (inc. criminal damage)

35
Arrests
The data in this section refers to arrests for crimes serious enough to be recorded by
the police. The total number of arrests decreased by around a quarter between
2009/10 and 2013/14 (from 1.35 million to 1.02 million)46 while the ethnic breakdown
of those arrested has been relatively stable. Suspects from the White ethnic group
accounted for the majority of arrests (around 8 in 10 of all arrests in this period),
followed by Black (around 1 in 10), Asian, Mixed and C&O groups (fewer than 1 in
10).
Figure 4.08: Arrests by self-identified ethnicity, 2009/10 to 2013/14.
46 Where ethnicity is known. The ethnicity coverage for arrests between 2009/10 and 2013/14 was around 98%. Source: www.gov.uk/government/publications/police-powers-and-procedures-england-and-wales-year-ending-31-march-2015/police-powers-and-procedures-england-and-wales-year-ending-31-march-2015
0
200,000
400,000
600,000
800,000
1,000,000
1,200,000
1,400,000
1,600,000
2009/10 2010/11 2011/12 2012/13 2013/14
Num
ber
of
arr
ests
White Black Asian Mixed Chinese or Other

36
Offence groups47
The number of arrests decreased for all offence groups over the last five years,
however, arrests for sexual offences reduced the least (8%). Within the different
offence groups the changes by ethnicity vary. For example, all ethnicities showed
similar reductions in the numbers of arrests for fraud and forgery and for theft and
handling. By contrast, the number of arrests for sexual offences fell most steeply for
Black suspects in this period (17%) but remained broadly stable for the Asian and
Mixed ethnic groups.
In 2013/14, robbery had the largest proportion of BAME arrests of all offence groups
(37%) and burglary the lowest (12%).
Figure 4.09: Proportion of arrests within each offence group, by ethnicity,
2013/14
47 Offence groups from this chapter are not directly comparable to offence groups from the MoJ Court Proceedings database – see technical guide for further details
0%
10%
20%
30%
40%
50%
60%
70%
80%
90%
100%
Violence against
the
person
Sexual of fences
Robbery Burglary Thef t & handling
Criminal damage
Drug of fences
Fraud & forgery
Other of fences
Pro
po
rtio
n o
f arr
ests
White Black Asian Mixed Chinese or Other

37
Age Groups
Whilst the overall number of arrests for adults and juveniles has decreased, the
proportion of adult BAME offenders (18-19%) arrested has been broadly stable for
the last five years. In contrast, the proportion of juvenile offenders from BAME groups
increased slightly, by 3 percentage points in the same time period.
Figure 4.10: Arrests by ethnicity and age group, 2009/10 to 2013/14
0
200,000
400,000
600,000
800,000
1,000,000
1,200,000
Adults Juveniles Adults Juveniles
2009/10 2013/14
Num
ber
of
arr
ests
White Black Asian Mixed Chinese or Other

38
Arrests by Police Force Area
In 2013/14, the police in London48 made around 20% of all arrests49 while serving
14% of the total population of England and Wales. The proportion of arrests that
were of White suspects is considerably smaller and the proportion of arrests that
were of suspects from BAME groups is larger in London, compared with the rest of
England and Wales.
Of all arrests in England and Wales, the police in London arrested 12% of White
suspects, 60% of Black suspects and 40% of Asian suspects. This matches the
London population aged 10 or older reasonably well, as London accounts for 10% of
White, 58% of Black and 37% of Asian individuals in all of England and Wales50. This
also agrees with earlier findings for stops and searches in the London area, where
the majority of Black suspects were stopped and searched.
Figure 4.11: Arrests by self-identified ethnicity, for London and combined
remaining forces, 2013/14
48 Includes City of London and Metropolitan Police forces. 49 Where ethnicity is known. 50 Adapted from data from the Office for National Statistics licensed under the Open Government Licence v.3.0– see appendix III. Population data from the 2011 census is available here: www.ons.gov.uk/ons/guide-method/census/2011/index.html
0%
10%
20%
30%
40%
50%
60%
70%
80%
90%
100%
Police in London Other forces England and Wales
Pro
rtio
n o
f arr
ests
White Black Asian Mixed Chinese or Other

39
Arrest rates per 1000 Population
The arrest rate by ethnic group is the ratio of the number of arrests and the number
of persons of an ethnic group in an area. Rates of arrests per 1,000 members of the
population51 by self identified ethnicity are shown in Figure 4.12, for 2013/14. In
relative terms, the Black ethnic group were nearly three times more likely, and the
Mixed ethnic group twice as likely, to be arrested compared with the White, Asian or
C&O groups. This shows the same trend as the earlier findings from stop and search
data, where the Black and Mixed groups were found to be more likely to be stopped
and searched as well as arrested following stop and search than the White group.
At police force level there is a wide variation in arrest rates by ethnicity. In agreement
with the overall trend in England and Wales, the majority of police forces made fewer
arrests in 2013/14 than in 2012/13.
Figure 4.12: Arrest rates per 1,000 members of the population by self identified
ethnicity, 2013/14
51 Further detail on the calculation can be found in Appendix III. Data from the Metropolitan Police and City of London police force were combined to produce a London total.
0
10
20
30
40
50
60
White Black Asian Mixed Chinese or Other
Overall
Arr
est ra
te p
er
1,0
00 p
op
ula
tio
n

40
Penalty Notices for Disorder
Penalty Notices for Disorder (PNDs) 52 are commonly known as ‘on the spot fines’ - a
fixed penalty of £60 for lower tier offence or £90 for higher tier offence (raised from £50 and £80 respectively from 1 July 2013 onwards)53. The overall number of PNDs issued in 2014 was just under half of those issued in
2010. In 2014, of the 61,000 PNDs issued54, 85% were issued to White individuals
and 15% to BAME individuals; a proportion that has been broadly consistent in the
past five years and broadly aligns with the proportions in the population. For the
White and Asian ethnic groups, the proportion has remained broadly consistent over
the last five years. In contrast, the Black ethnic group has seen their proportion of the
PNDs issued in 2012 (2.6%) double by 2014 (5.2%), and the C&O ethnic group has
seen their proportion of PNDs decrease by two-thirds between these years.
Furthermore, the proportion of PNDs received by the Mixed ethnic group more than
doubled between 2012 and 2014. Caution is advised for interpreting these apparent
trends, however, as the trend shift between 2012 and 2013 followed the introduction
of a new database (PentiP) in 2012. We cannot know for certain whether these
findings are because of a more complete and accurate recording of ethnicity, rather
than true changes in PND trends by ethnic group.
Offences
Higher tier offences cover generally more serious activities, for example, theft or being drunk and disorderly, than lower tier offences, such as trespassing on a railway or consumption of alcohol in a designated public place. In 2014, the majority of PNDs issued were for higher tier offences (around 93% to 97% for all ethnic groups), which has been broadly stable over the last five years55. Drunk and disorderly was the most common offence for which a PND was issued to
the White ethnic group (45%) in 2014 – a proportion that has seen a steady increase
since 2010, when it comprised 32% of the total PNDs issued to the White ethnic
group. For the C&O and Mixed ethnic groups, drunk and disorderly and ‘retail theft
under £100’ were the most common offences, for which similar proportions of PNDs
were issued. This has fluctuated over the past five years but this should be
interpreted with caution, both because of the small number of people involved and
potential impacts from changes in recording of ethnicity.
The number of PNDs for causing harassment, alarm or distress saw a steady fall for
all ethnic groups between 2010 to 2014, decreasing by 72% across all ethnic groups.
52 Ethnicity data is not available for Cannabis or Khat warnings. Their introduction could affect the
number of PNDs given for Cannabis and consequently trends in the overall PND numbers 53 Whilst self-identified ethnicity fields (5+1) are used for PNDs, different police force areas have varying
guidance notes on how to record ethnicity using either perceived (officer identified) or self-identified
ethnic origin. As a result, ethnicity data presented for PNDs contains both officer identified and self-
identified ethnicity. 54 Where ethnicity is known. There have been improvements in ethnicity coverage of PND’s from 2012 (81%), to 2014 (94%). 55The data on the higher tier offence, Possession of Cannabis is excluded from analysis considering individual offences, despite its presence as a high volume PND because of particular apparent volatility in recording associated with the introduction of PentiP and the impact of Cannabis warnings (see footnote above).

41
In 2010, this was the second most common offence for which BAME ethnic groups
were issued a PND, but by 2014 this was the third most common offence. For the
White ethnic group, it has consistently been the third most common offence.
Figure 4.13: Penalty Notices for Disorder for most common offences, by
ethnicity, 2014
Cautions
A caution can be given when there is sufficient evidence to prosecute an offender for
an offence for which they admit guilt, but where it is decided that a caution would be
a more appropriate solution. This could either be because it is not in the public
interest to prosecute the offender (leading to a simple caution) or where it would be in
the public interest to prosecute, but the offending behaviour would be better dealt
with through compliance with a conditional caution.
In 2014, the number of offenders issued cautions56 was 136,000 and the overall total
has decreased by 39% since 2010. This is broadly similar to the decline across the
White and Other ethnic groups, and slightly greater than the decreases in the Black
ethnic group, to whom 31% fewer cautions were issued, and the Asian ethnic group
(36%). 85% of offenders issued cautions were from the White ethnic group, and this
proportion has been broadly similar since 2010. The Black ethnic group were three
times more likely to be given a caution, compared with the White, Asian and Other
ethnic groups.
The decline in the use of cautions observed across all ethnic groups, coincided with
the replacement in April 2008 of a target to increase offences brought to justice with
one placing more emphasis on bringing serious crime to justice. The latter target was
subsequently removed in May 2010.
56 Analysis is only conducted on those with known ethnicity – ethnicity coverage ranges from 96%-98% between 2010 and 2014. Ethnicity is measured using officer identified ethnicity (see Appendix I and II for further details).
0%
10%
20%
30%
40%
50%
60%
70%
80%
90%
100%
White Black Asian Mixed Chinese or Other
Perc
enta
ge o
f P
ND
s f
or m
ost co
mm
on
off
ences
Drunk and disorderly Thef t (retail under £100)
Causing harassment, alarm or distress All others
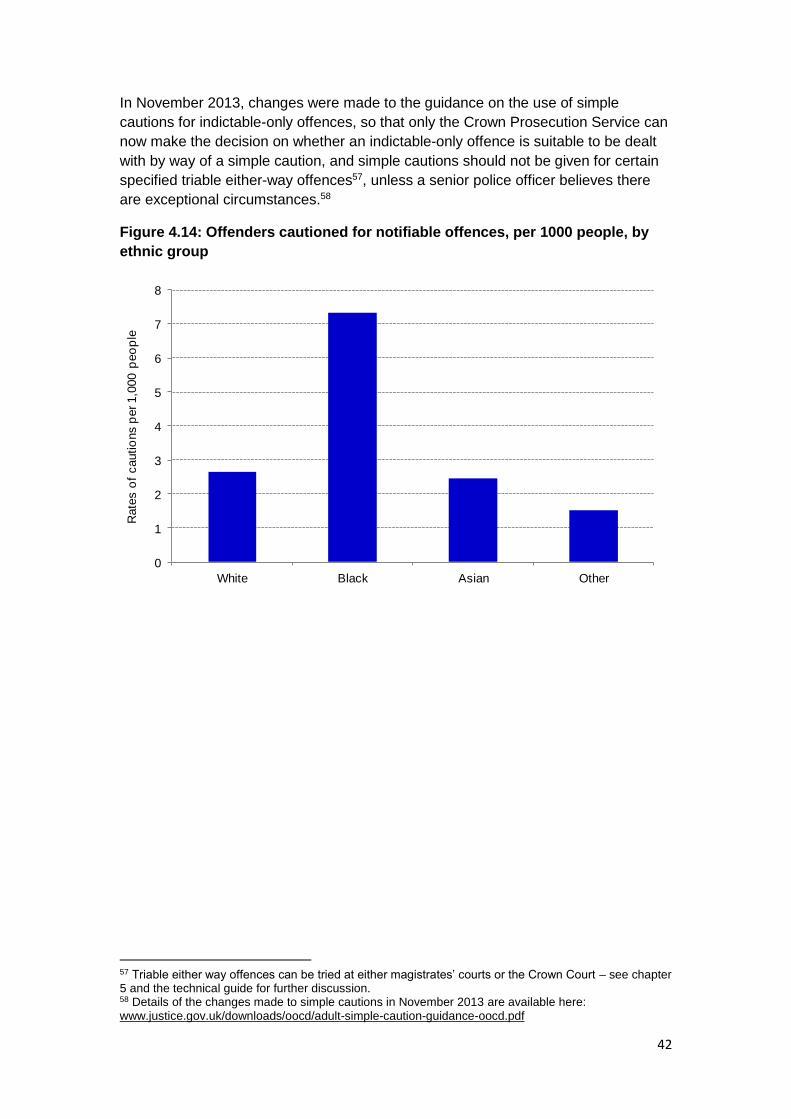
42
In November 2013, changes were made to the guidance on the use of simple
cautions for indictable-only offences, so that only the Crown Prosecution Service can
now make the decision on whether an indictable-only offence is suitable to be dealt
with by way of a simple caution, and simple cautions should not be given for certain
specified triable either-way offences57, unless a senior police officer believes there
are exceptional circumstances.58
Figure 4.14: Offenders cautioned for notifiable offences, per 1000 people, by
ethnic group
57 Triable either way offences can be tried at either magistrates’ courts or the Crown Court – see chapter 5 and the technical guide for further discussion. 58 Details of the changes made to simple cautions in November 2013 are available here: www.justice.gov.uk/downloads/oocd/adult-simple-caution-guidance-oocd.pdf
0
1
2
3
4
5
6
7
8
White Black Asian Other
Rate
s o
f cautio
ns p
er 1,0
00 p
eo
ple

43
Offence Group
The most common offences for which offenders were cautioned were issued were for
theft offences, drug offences and summary non motoring offences59, similarly for both
adults and juveniles. For each of these offence groups, around 86% of offenders
cautioned were from the White ethnic group, 7% from the Black ethnic group and
around 5% from the Asian ethnic group; which was broadly similar to the general
trends for cautions issued. Since 2010, there has been a decline in the number of
offenders cautioned for almost all offence groups, across all ethnicities, with the
greatest decline for theft offences. In general, the decline was greater for juveniles
than adults. The proportion of cautions issued for drug offences in this 5 year period
fell the least for the Black and Other ethnic groups, compared with the White and
Asian ethnic groups.
Figure 4.15: Proportion of offenders cautioned for each offence group, by
ethnicity, 2014
59 For further analysis by offence groups, please see Chapter 5 on defendants. Summary offences are less serious, usually tried at magistrates’ courts and tend to have much lower levels of ethnicity reporting.
0% 10% 20% 30% 40% 50% 60% 70% 80% 90% 100%
Violence against the person
Sexual of fences
Robbery
Theft Of fences
Criminal damage and arson
Drug of fences
Possession of weapons
Public order of fences
Miscellaneous crimes against society
Fraud Offences
Summary Non-Motoring
Percentage of cautions issued for each of fence group
White Black Asian Other

44
Chapter 5: Defendants
This chapter explores outcomes for defendants in the Criminal Justice System (CJS)
predominantly drawing on data from the MoJ publication Criminal Justice Statistics
2014. If there is sufficient evidence against the defendant and none of the out of
court disposals are appropriate and it is in the public interest to prosecute, the police
will formally charge the suspect. The law then requires the defendant to be brought
before a magistrates’ court as soon as possible. The defendant can be summoned to
appear in court or remanded on bail or custody.
Figure 5.01: Proportions of ethnic groups throughout the Criminal Justice
System, 2014
Self identified ethnicity Officer identified ethnicity
White 85% White 84%
Black 5% Black 8%
Asian 7% Asian 6%
Mixed 2% Other 2%
C&O 2%
White 81% White 82% White 82%
Black 9% Black 8% Black 8%
Asian 6% Asian 5% Asian 5%
Mixed 3% Mixed 3% Mixed 3%
C&O 1% C&O 1% C&O 1%
Sentence
Outcome
Custody
(67,000)
Suspended
sentence
(34,000)
Community
sentence
(51,000)
Fine
(45,000)
Other
(44,000)
White 81% 83% 82% 79% 87%
Black 9% 7% 9% 11% 6%
Asian 6% 6% 5% 6% 3%
Mixed 3% 3% 3% 3% 2%
C&O 2% 1% 1% 1% 1%
White Black Asian Mixed C&O
27% 30% 32% 28% 36%
White Black Asian Mixed C&O
17.0 24.7 24.9 19.8 19.2
White 79% White 89%
Black 10% Black 8%
Asian 9% Asian 3%
Other 3% Other 0%
Custody rate
Average custodial
sentence length (months)
PREVIOUS CRIMINAL HISTORIES
First time offenders
(64,000)
15 or more previous
convictions / cautions
(106,000)
OUT OF COURT DISPOSALS
PNDS (61,000) Cautions (136,000)
Proceedings (304,000) Convictions (245,000) Sentencing (243,000)
COURT PROCEEDINGS AND SENTENCING FOR INDICTABLE OFFENCES

45
Ethnicity coverage60 is more complete for more serious offences, i.e. the offence
types ‘triable either way’ (TEW), which can be tried at either magistrates’ courts or
the Crown Court depending on the seriousness of the crime, and ‘indictable only’,
which can only be tried at the Crown Court. Analysis in this section is limited to these
two offence types, which we refer to as indictable offences, and to defendants aged
10 or over.
Prosecutions
Prosecutions for all ethnic groups have declined by a fifth over the past 5 years.
There were 354,000 prosecutions61 in 2014. White defendants accounted for 81% of
all magistrates’ prosecutions, while Black, Asian, Mixed and Chinese and Other
(C&O) defendants accounted for 9%, 6%, 3% and 1% respectively. (Although these
proportions have remained stable over the previous 5 years, the total number of
defendants that are of unknown or not stated ethnicity has increased by 4 percentage
points over the same period.)
Relative to the population, the Black ethnic group had the highest rate of
prosecutions. The rate of prosecutions for the Black ethnic group was 3 times higher
than for the White group. The Mixed group had the second highest rate, which was 2
times higher than the White group, while C&O had the lowest rate of prosecutions.
Figure 5.02: Rates per 1,00062 members of the population of prosecutions for
indictable offences at magistrates’ courts, by ethnicity, in England and Wales,
2014
60 This chapter uses self-identified ethnicity – see Appendix I. 61 Where ethnicity was known. Defendants with unknown or not stated ethnicity accounted for 14% of all indictable prosecutions in 2014. 62 Rates per 1,000 population per ethnic group were calculated by dividing the number of prosecutions for an ethnic group by the estimated population for that ethnic group in the same region and multiplying by 1,000.
0
2
4
6
8
10
12
14
16
18
20
White Black Asian Mixed C&O
Num
ber
of
pro
secutio
ns p
er 1,0
00 m
em
bers
o
f th
e p
op
ula
tio
n
Self -identif ied ethnicity

46
Offence type
In 2014 drug offences were the most common indictable offence proceeded against
for Black and Asian defendants, while theft offences were the most common for
White, Mixed and C&O defendants. Theft offences accounted for a relatively higher
proportion of prosecutions for White defendants. Conversely, prosecutions for drug
offences as a proportion of all prosecutions was lowest for White defendants.
Figure 5.03: Distribution of prosecutions for indictable offences at magistrates’
courts by offence group, by ethnicity, 2014
0%
10%
20%
30%
40%
50%
60%
70%
80%
90%
100%
White Black Asian Mixed C&O Total known
Perc
enta
ge o
f p
rosecutio
ns
Self -identif ied ethnicity
Violence against the person Sexual of fences Robbery
Thef t of fences Drug of fences Other of fence groups

47
Juvenile prosecutions
Juvenile defendants accounted for a higher proportion of prosecutions for the Mixed
ethnic group than any other ethnicity. A likely driver for this is the demographic
differences between ethnic groups: a quarter of the Mixed population63 were aged
between 10 and 17 years of age, a larger proportion than any other ethnic group.
This is also reflected in the 2014 prosecutions where the average age for a Mixed
defendant was 27, 3 to 5 years younger than for defendants of other ethnicities.
Although juvenile defendants accounted for a higher proportion of Mixed
prosecutions relative to Black prosecutions, as discussed above, Mixed juveniles
have a lower prosecution rate per 1,000 members of the population than Black
juveniles. Prosecution rates for juvenile defendants follow similar trends between
ethnicities to those seen in figure 5.02.
Figure 5.04: Percentage distribution of juvenile and adult defendants
prosecuted at magistrates’ courts64 for indictable offences, by ethnicity, in
England and Wales, 2014
63 2011 census data persons aged 10 and above – see Appendix III. 64 Including youth courts (throughout)
0%
10%
20%
30%
40%
50%
60%
70%
80%
90%
100%
White Black Asian Mixed C&O Total known
Perc
enta
ge o
f p
rosecutio
ns
Self -identif ied ethnicity
Juveniles Adults

48
Convictions Over the most recent 5 years, the total number of convictions has followed similar
trends to prosecutions. Convictions have reduced by just under a quarter for all
ethnicities except C&O offenders, who saw a reduction of a third over this period.
White and C&O offenders have had the highest conviction ratios65 of all ethnicities, a
trend that has been consistent for the past 5 years. For example, the conviction ratio
for violence against the person offences for White offenders has been 5 to 18
percentage points higher than any other ethnicity over this period.
The differences in conviction ratios may be partly due to the differences in the
distribution of offences between ethnic groups. For example, in 2014, for all
ethnicities, breach of a restraining order was one of the most common violence
against the person offences, but was more prevalent among White offenders66. This
offence has a high conviction ratio for all ethnicities. However, there is also a
difference in conviction ratio for this offence between White and BAME offenders,
which also contributed to the difference in conviction ratio for violence against the
person offences more generally: White offenders had a conviction ratio that was 8
percentage points higher than BAME offenders.67
Figure 5.05: Conviction ratios for indictable offences at all courts by offence
group, by ethnicity, 201468
65 The conviction ratio is calculated by dividing the total number of defendants convicted by the total number of defendants prosecuted in the same period. 66 Breach of restraining order accounted for 30% of all violence against the person convictions for White offenders, 6 - 15 percentage points higher than BAME offenders. 67 Analysis of this offence is covered in more detail in the offence analysis chapter. 68 In 2014 C&O Offenders had a conviction ratio for fraud offences over 100%. There were few proceedings and convictions for fraud for C&O offenders so any variation in convictions or prosecutions can substantially alter the conviction ratio. There were more prosecutions the previous year, which may have not concluded until 2014, potentially giving C&O offenders a larger conviction ratio for the Other offence groups category.
0 20 40 60 80 100
Violence against the person
Sexual of fences
Robbery
Thef t of fences
Drug of fences
Other of fence groups
All Indictable
Conviction Ratio (%)
Off
ence g
roup
White Black Asian Mixed Chinese or Other

49
Remands
Remands data in this section are based on the Crown Court’s decision on whether a defendant prosecuted for a criminal offence, should – during the court proceeding – go on to be placed in custody or released on bail69. Figures are compiled70
on a combination of the defendant’s remand status during their trial and whilst awaiting a sentence (or in other words, a decision of the trial) at the Crown Court. Between 2010 and 2013, the proportion of all defendants who were remanded in custody at the Crown Court has remained relatively constant at around 35%, however, in 2014 it increased by 2 percentage points, to 37%71. Of the 34,000 persons remanded in custody at the Crown Court for indictable offences72 in 2014: 74% were White, 13% were Black 7% were Asian, 4% were Mixed and 2% were Chinese or Other. These were broadly similar to the ethnic composition of persons remanded in custody in 2013. Defendants from BAME groups were more frequently remanded in custody compared with White defendants relative to their distribution in the population, and for the Black and Mixed groups to a greater extent than they were proportionally more likely to be prosecuted. For example, Black individuals accounted for 3% of the total population of England and Wales, 10% of defendants tried at the Crown Court and 13% of defendants remanded in custody at the Crown Court. Figure 5.06: Number of defendants remanded in custody at the Crown Court in 2014 per 1,000 members of the population, by ethnicity
69 The data in this section relates to persons remanded in each completed court case rather than to the number of remand decisions (a person may be remanded several times during a case). Data on remands include failure to appear (FTA) cases, which are excluded from the data presented in other chapters in this publication 70 Cases are recorded in the year that a final court decision is made and are not necessarily the same year in which the person was remanded. For further details, see the section titled “Remands” in A Guide to Criminal Justice System Statistics. Unlike other sections in this chapter – this analysis is restricted to cases tried at the Crown Court. 71 For further details, refer to Criminal Justice System Statistics Annual 2014. 72 The figure refers only to those with known ethnicity; for this group, ethnicity coverage between 2010 and 2014 has varied between 91% and 88%.
0
0.5
1
1.5
2
2.5
3
3.5
4
4.5
5
White Black Asian Mixed C&O
Num
ber
rem
and
ed
per
1,0
00 p
op
ula
tio
n
50
Figure 5.07: Proportion of individuals remanded in custody, tried at the Crown Court and in the population, by self-identified ethnicity, 2014
Among those remanded in custody, all ethnic groups were most likely to have later received a custodial sentence. However, White and C&O defendants remanded in custody at the Crown Court were more likely (72%-75%) to have later received a custodial sentence than Black, Asian and Mixed defendants (66%-69%). Defendants from BAME groups remanded in custody were more likely to be acquitted or not tried later (14%-17%) than White defendants (11%). Figure 5.08: Court outcomes of individuals remanded in custody at the Crown Court, by ethnicity, 2014
0%
10%
20%
30%
40%
50%
60%
70%
80%
90%
100%
White Black Asian Mixed C&O
Perc
enta
ge o
f in
div
iduals
Remanded in custody Tried at Crown Court Population
0%
10%
20%
30%
40%
50%
60%
70%
80%
90%
100%
White Black Asian Mixed C&O
Co
urt
outc
om
es o
f d
efe
nd
ants
rem
and
ed
in
custo
dy
Acquitted/not tried Community sentence Suspended sentence
Immediate custody Other/failed to appear

51
Pre-Sentence Reports
Pre-sentence reports (PSRs)73 are typically prepared by the Probation Service to
provide information to the court about the offender and any circumstances
surrounding the offence, to help decide on a suitable sentence. This section looks at
the PSRs received and the agreement (concordance) between recommendations
made in PSRs and sentences issued at court, and whether they differ between ethnic
groups.
The number of pre-sentence reports decreased by half since 2010 for all ethnic
groups. Since the number of PSRs was lowest for Chinese and Other (C&O) and
Mixed offenders, trends for these ethnic groups are more sensitive to fluctuations.
The profile of PSR recommendations differs for offenders from the White ethnic
group and BAME groups. In 2014 offenders from the White ethnic group had a lower
proportion of PSRs recommending a suspended sentence (18%) compared with
offenders from BAME groups (21%-22%), and a higher proportion of PSRs
recommending community sentences (73%) compared with offenders from BAME
groups (67%-69%). The proportion of recommendations of immediate custody,
however, was similar for all ethnic groups, at 8%-9%. This is different from 2010,
when the proportion of recommendations of immediate custody for White offenders
was lower (8%) than for offenders from BAME groups (10%-13%).
In 2014, concordance levels were highest for immediate custody, with between 88%
and 92% of those whose PSR recommended a custodial sentence receiving one, for
all ethnicities. There has been little change in this over the last five year period. For
proposed suspended sentences in 2014, the concordance rate was similar for
offenders from all ethnicities (58%-60%), except for Asian offenders (53%). The
overall concordance level for suspended sentences has increased over the last five
years, from 55% to 59%. When the PSR recommended a community sentence, the
concordance rate was again similar for offenders from all ethnicities (67%-70%),
except for Asian offenders (62%). The overall concordance level for community
sentences was stable over the period 2010-2014.
73 Source: Offender Management Statistics 2014, available here: www.gov.uk/government/collections/offender-management-statistics-quarterly. In 2014, ethnicity coverage was around 87%. Data on PSRs relates to those aged 18 or older and all offence types.

52
Sentencing
Overall, in 2014, 243,000 offenders were sentenced74 – a 22% decline since 2010.
The proportion of ethnic groups sentenced has been broadly stable; mirroring the
trend seen in prosecutions.
Figure 5.09: Number sentenced per 1,000 members of the population, for
indictable offences at all courts by ethnicity, 2014
Relative to the population, rates of sentencing for Black offenders were 3 times
higher, and 2 times higher for Mixed offenders, relative to offenders from the White
ethnic group; a trend mirrored in prosecutions.
74 Where ethnicity is known. Ethnicity coverage for sentencing of indictable offences at all courts was 87%-90% over the latest 5 year period. Source: Criminal Justice Statistics 2014, available here: www.gov.uk/government/collections/criminal-justice-statistics.
0
2
4
6
8
10
12
14
16
18
20
White Black Asian Mixed Chinese or other
Num
ber
sente
nced
per
1,0
00 p
op
ula
tio
n

53
Figure 5.10: Percentage of sentencing outcomes, for indictable offences at all
courts, by ethnicity, 2010 and 2014
In 2014, the most common sentencing outcome for indictable offences for all
ethnicities was immediate custody; compared with 2010 when community sentences
were most common for Mixed and White offenders. (For a logistic regression analysis
of the likelihood of being sentenced to prison, see the accompanying report
‘Associations between police-recorded ethnic background and being sentenced to
prison in England and Wales’.)
In the latest year Asian offenders were proportionately the most likely to receive a
suspended sentence (15%). Black offenders were the most likely to receive a fine
(23%). C&O offenders were the most likely to receive immediate custody (36%) and
the least likely to receive a community sentence (17%).
0%
5%
10%
15%
20%
25%
30%
35%
40%
45%
50%
2010 2014
White
Perc
enta
ge o
f d
efe
nd
ants
Immediate custody Suspended sentence Community sentence
Fine Other
2010 2014
Black
2010 2014
Asian
2010 2014
Mixed
2010 2014
C&O

54
Figure 5.11: Percentage of sentencing outcomes, for all offenders sentenced
for indictable offences at all courts by age group and ethnicity, 2014
There is variation in sentencing trends between adults and juveniles, with the most
common sentencing outcome for juveniles being a community sentence and
immediate custody for adults. However, a greater proportion of juvenile offenders
from BAME groups received custodial sentences (11%) and a smaller proportion
received community sentences (71%) compared with juvenile White offenders (8%
and 74% respectively). This mirrors the broader trend in custodial sentencing by
ethnicity.
0%
10%
20%
30%
40%
50%
60%
70%
80%
90%
100%
White Black Asian Mixed Chinese or other
Total (known)
Perc
enta
ge o
f o
ffend
ers
Juveniles
Immediate Custody Suspended sentence Community Sentence Fine Other
0%
10%
20%
30%
40%
50%
60%
70%
80%
90%
100%
White Black Asian Mixed Chinese or other
Total (known)
Perc
enta
ge o
f o
ffend
ers
Adults
Immediate Custody Suspended sentence Community Sentence Fine Other

55
When looking at further age breakdowns, the proportion of offenders receiving
immediate custody who were White is largest among offenders aged 60 or over
(90%), while the proportions of offenders who were Black (4%) or Mixed (1%) are
considerably smaller in this age group. This is in broad agreement with the prison
population, as discussed in chapter 7, where White offenders made up 54% of
prisoners who are 15-17 but 92% of prisoners over 60 years old75; and roughly
mirrors the ethnic distribution by age in the population of England and Wales76.
75 Care should be taken when making comparisons between ethnicity trends of those sentenced to custody and the prison population because of differences in the data: the sentencing data excludes those sentenced for summary offences whereas the prison population includes those offenders and levels of missing ethnicity data are very different for the two data sources. Moreover, the prison population reflects people who were sentenced to custody and also how long they were sentenced for. 76 Source: Census 2011 data, available here: http://www.ons.gov.uk/ons/guide-method/census/2011/index.html – see Appendix III. There are proportionally more White individuals in the age range over 60, and proportionally more Black, Asian and Mixed individuals in the juvenile (10-17 years old) are range.

56
In 2014, the most common outcome for male offenders was a custodial sentence,
whereas sentencing outcomes were typically more varied for females, across all
ethnic groups. The different proportions of custodial sentences for male and female
offenders are likely to be attributable to a range of factors including differences in the
offence types they commit 77.
Figure 5.12: Percentage of sentencing outcomes, for all offenders sentenced
for indictable offences at all courts by gender and ethnicity, 2014
77 See www.gov.uk/government/statistics/women-and-the-criminal-justice-system--2 for a detailed
analysis
0%
10%
20%
30%
40%
50%
60%
70%
80%
90%
100%
White Black Asian Mixed Chinese or other
Total (known)
Perc
enta
ge o
f o
ffend
ers
Males
Immediate custody Suspended sentence Community sentence Fine Other
0%
10%
20%
30%
40%
50%
60%
70%
80%
90%
100%
White Black Asian Mixed Chinese or other
Total (known)
Perc
enta
ge o
f o
ffend
ers
Females
Immediate custody Suspended sentence Community sentence Fine Other

57
Offence Groups The differences in sentencing outcomes for ethnic groups may in part be attributed to
the types of offences most commonly committed by individuals from each group.
Theft and drug offences were the two most common indictable offences, with theft
the most common for White (46% of White offenders were sentenced for theft),
Mixed (35%) and C&O (33%) offenders, and drug offences the most common for
Black (33%) and Asian (29%) offenders.
Figure 5.13: Distribution of sentences for indictable offences by offence group
and ethnicity, 2014
Asian offenders were proportionately the most likely ethnic group to be sentenced for
sexual offences (at 4% of Asian offenders sentenced). Robbery (5%) was
proportionately most prevalent among Black offenders, as were drug offences (33%)
and possession of weapons (6%), all of which were proportionately least prevalent
among white offenders (2%, 17% and 3%).
0%
10%
20%
30%
40%
50%
60%
70%
80%
90%
100%
White Black Asian Mixed Chinese or other
Total (known)
Perc
enta
ge o
f o
ffend
ers
sente
nced
Violence against the person Sexual of fences Robbery
Thef t Of fences Drug of fences Other of fences

58
Custody Rate
The custody rate is the proportion of all offenders sentenced to immediate custody, out of all sentencing outcomes. While there has been a steady decrease in the total number of persons sentenced for indictable offences at all courts since 2011, the custody rate varied for all ethnic groups throughout the last five years and has increased over this period for all groups apart from C&O offenders.
Black and Asian offenders typically had custody rates 3 and 5 percentage points
higher than White and Mixed offenders. The C&O ethnic group had considerably
higher overall custody rates than other ethnicities during the last five years. In
contrast to all other ethnic groups, however, the custody rate for C&O offenders fell
during this time. Robust analysis is difficult as the number of C&O offenders is low,
so it is difficult to make fair comparisons. Nevertheless, during the last five years the
C&O ethnic group constantly had a below average overall custody rate for indictable
only offences but a higher than average overall custody rate for triable either way
offences, most noticeably drug offences, public order offences, miscellaneous crimes
against society and fraud offences.
Figure 5.14: Custody rate for offenders for indictable offences, by ethnicity,
2010 to 2014
There is variation in custody rates across ethnic groups and offence groups. The
most common indictable offence group for a person to have received immediate
custody for in 2014 was theft offences, apart from for Asian offenders, for whom
immediate custody for drug offences was most common. This trend that has been
broadly stable for the past five years.
White offenders had the highest custody rate for robbery (72%) while Black offenders
had the highest custody rate for sexual offences (63%) and violence against the
person (51%) of all ethnic groups. Asian offenders had the highest custody rate for
possession of weapons (30%). Different offence group profiles may help explain the
differences in custody rate for the different ethnicities.
0%
5%
10%
15%
20%
25%
30%
35%
40%
45%
2010 2011 2012 2013 2014
Custo
dy rate
Year
White Black Asian Mixed Chinese or other Total (known)

59
Average custodial sentence length (ACSL) Since 2010, the ACSL has risen for all ethnic groups78 but remained consistently
highest for Asian and Black offenders, and higher for all BAME groups compared
with White offenders.
The ACSL varied across ethnic groups by offence type. As each offence group
consists of a range of offences with varying levels of seriousness, it is highly likely
that some of the differences in custody rate and ACSL are due to differences in the
specific offences for which different ethnic groups are typically sentenced: see
chapter 8 for an analysis of specific offences.
Figure 5.15: The average custodial sentence length (ACSL) for offenders
sentenced to immediate custody for indictable offences at all courts, by
ethnicity, 2010 to 2014
78 The overall increase in ACSL may be connected to changes in sentencing guidelines – see
accompanying technical guide for further details
0
5
10
15
20
25
30
2010 2011 2012 2013 2014
AC
SL (
mo
nth
s)
Year
White Black Asian Mixed Chinese or other Total (known)

60
Chapter 6: Offender Characteristics
This chapter explores different characteristics of offenders in terms of offending histories and differences in their levels of employment, income and benefits. Analysis of the differences in the levels of employment, income and benefits of offenders before and after conviction /caution /release from prison was taken from Experimental statistics from the 2013 MoJ /DWP /HMRC data share79and data on the offending histories of offenders cautioned or convicted in England and Wales over the last ten years are taken from the Ministry of Justice publication Criminal Justice Statistics 201480.
Employment, income and benefits before and after involvement with the Criminal
Justice System
An administrative data share between the Ministry of Justice (MoJ), the Department
for Work and Pensions (DWP) and Her Majesty’s Revenue and Customs (HMRC)
took place in 2013, building on an initial data share between these departments in
2011. It links offender data to P4581 employment data and benefit data, for 4.3
million offenders82 who received at least one caution or conviction for a recordable
offence in England and Wales between January 2000 and February 2013.
The data for ethnicity presented in this section uses a more detailed breakdown of
officer identified ethnicity based on 6 categories, as detailed in Appendix I83.
A large proportion of the matched data84,85 comprises offenders from a ‘White - North
European’ ethnic background (81%), with 8% in the Black ethnic group. The smallest
ethnic group was the ‘Chinese, Japanese or South East Asian’ group, comprising
less than 1% of the total population.
79 Source: Experimental statistics from the 2013 MoJ /DWP /HMRC data share, available here: www.gov.uk/government/statistics/experimental-statistics-from-the-2013-moj-dwp-hmrc-data-share. 80 Source: Criminal Justice Statistics 2014, available here: www.gov.uk/government/statistics/criminal-justice-system-statistics-quarterly-december-2014. 81 P45 employment excludes self employment, cash-in-hand work and some lower paid jobs. 82 The figures quoted in this section are based on PNC matched offenders data, which achieved an 81% match rate of 4.3 million unique offenders. 83 Most sections in this report follow the 4+1 for officer identified ethnicity, but this chapter uses the more detailed 6+1 categorisation. 84 The proportion of working age offenders with an unknown or not stated ethnicity, who were convicted/cautioned or released from prison in 2010/2011 and who were claiming benefits or in P45 employment was 2%. These offenders have been excluded from all analysis. 85 The matched data contained a higher proportion of “White – North European” offenders than other ethnicities. This is likely to be due to the variables used to match in the data. Western names are more likely to be consistently recorded and therefore matched across datasets.

61
Out-of-work benefits
In the working age population86, White - North European and Black offenders were
the most likely to be claiming out-of-work benefits, with 45% claiming benefits one
month after conviction/caution or release from prison87, whilst Chinese, Japanese or
South East Asian offenders were the least likely to be on these benefits (17%). The
proportion of offenders claiming out-of-work benefits increased across all ethnicities
during the two years before conviction/caution or release from prison, and continued
to increase for the one month immediately afterwards. The trend over the two years
following was for the proportion to decrease slightly then stabilise for all ethnicities,
but at levels higher than in the two years before conviction/caution or release from
prison.
Figure 6.01: Proportion of working age offenders convicted/cautioned or
released from prison, who were claiming benefits one month88, one year and
two years either side of their conviction/caution or prison sentence, by
ethnicity
86 The analysis is based on all offenders who were convicted/cautioned or released from prison in the
2010/2011 tax year and aged between 18 and 62 at the time of conviction/caution or release from
prison. 87 Information on those released from prison only is available from the experimental statistics. 88 The black diamonds denote the point of the offender’s caution/conviction or release from prison. Please note that the spacing of the time periods displayed in the graph does not align with the actual time scales – the time period covered between conviction/caution of release and 1 month is much shorter than between 1 month and 1 year following, for example.
0
5
10
15
20
25
30
35
40
45
50
2 years 1 year 1 month 1 month 1 year 2 years
Before conviction/caution or prison At conviction/
caution
or release f rom prison
After conviction/caution or prison
Per cent
White - North European White - South EuropeanBlack AsianChinese, Japanese, SE Asian Middle Eastern

62
P45 employment
Rates of P45 employment two years after conviction/caution or release from prison89
were higher across all ethnicities than rates two years before. The most marked
increase was from the Chinese, Japanese or South East Asian ethnic groups, whose
P45 employment levels increased by 8 percentage points during that four year period
(42% two years after conviction/caution or release from prison, compared with 34%
two years before), although this may be influenced by the small cohort sizes
involved. Offenders in the Asian ethnic group had very similar rises in levels of P45
employment, with 41% employed in the two years after, compared with 34% two
years before; an increase of 7 percentage points. The proportions in P45
employment were not as different for the White – North European group, with 38% in
employment two years after compared with 35% two years before caution/conviction
or release from prison.
Figure 6.02: Proportion of working age offenders convicted/cautioned or
released from prison, in P45 employment one month90, one year and two years
either side of their conviction/caution or prison sentence, by ethnicity
89 Information on those released from prison only is available from the experimental statistics. 90 The black diamonds denote the point of the offender’s caution/conviction or release from prison. Please note that the spacing of the time periods displayed in the graph does not align with the actual time scales – the time period covered between conviction/caution of release and 1 month is much shorter than between 1 month and 1 year following, for example.
0
5
10
15
20
25
30
35
40
45
50
2 years 1 year 1 month 1 month 1 year 2 years
Before conviction/caution or prison At conviction/
caution
or release f rom prison
After conviction/caution or prison
Per cent
White - North European White - South EuropeanBlack AsianChinese, Japanese, SE Asian Middle Eastern

63
P14 income91
Offenders’ P14 income92 (accounting for earnings inflation) tended to increase in
each year after conviction/caution or release from prison. P14 median adjusted
income was highest in each financial year for the White – North European ethnic
group, whereas offenders in the Middle Eastern ethnic category consistently had the
lowest median adjusted income.
Figure 6.03: Median adjusted P14 income (to take into account earnings
inflation) of offenders released from prison or convicted/cautioned in 2003/04,
by ethnicity, 2004/05 – 2012/13
91 P14 income includes information on gross income derived from P14 forms sent to HMRC by
employers. Income from self-employment, cash-in-hand work and some lower paid jobs is not included.
P14 income includes income for part-year and part-time work, so does not only reflect full-time, annual
income. Data for the graph has been adjusted using Seasonally Adjusted Average Weekly Earnings
data from the Office for National Statistics (ONS), using 2012/13 as the base year. 92 The P14 data for 2012/2013 is incomplete and therefore results for this year should be treated with
caution. See the main linked data publication for more details, available here:
www.gov.uk/government/statistics/experimental-statistics-from-the-2013-moj-dwp-hmrc-data-share
£0
£2,000
£4,000
£6,000
£8,000
£10,000
£12,000
£14,000
£16,000
£18,000
2004/05 2005/06 2006/07 2007/08 2008/09 2009/10 2010/11 2011/12 2012/13
Med
ian a
dju
ste
d P
14 inco
me
Financial years
White - North European White - South European
Black Asian
Chinese, Japanese or SE Asian Middle Eastern

64
Offending Histories
First Time Offenders
A first time offender93 is an offender who has been arrested by police in England or
Wales and who has received a first conviction, caution or youth caution for any
offence94 recorded on the Police National Computer95.
In England and Wales in 2014, first time offenders comprised 22% of the total
number of offenders convicted or cautioned. This compares with 31% in 2004, and
the proportion has decreased steadily over this ten year period. The proportion of
offenders with one or more previous cautions has increased to 78% in 2014, up from
69% in 2004.
In 2014, offenders from the White96 ethnic group97 made up 4 in 5 first time offenders,
a smaller proportion than of the population. Among first time offenders, the Black
and Asian ethnic groups comprised 9% and 8% of offenders respectively in 2014, in
both cases higher than their population proportions, with 2% from the Other ethnic
group. The proportion of first-time offenders from each ethnic group has not changed
substantially over the last decade.
Of all offenders convicted or cautioned from the Black ethnic group in 2004, 31%
were first time offenders. This decreased to 20% in 2014. The proportions were
similar for first time offenders from the White ethnic group, with 30% recording their
first offence in 2004 compared with 21% in 2014. 42% of offenders from the Asian
ethnic group were first time offenders in 2004, decreasing to 31% in 2014.
Offenders with 15 or more previous cautions or convictions In 2014, 89% of offenders cautioned or sentenced who had 15 or more previous cautions or convictions were from the White ethnic group; slightly higher than the proportion in the overall population (87%). In contrast, just 3% of offenders with 15 or more previous cautions of convictions were from the Asian ethnic group; a substantially lower proportion than in the overall population (6%). 8% of those offenders cautioned or sentenced who had 15 or more previous cautions or
93 The definition of “first time offender” is different from “first time entrant”. A first time entrant (FTE) to
the criminal justice system is an offender residing in England and Wales at the time of the offence, who
has been recorded on the Police National Computer (PNC) by an English or Welsh police force as
having received their first conviction, caution or youth caution. Published figures for first time entrants
exclude any offenders who, at the time of their first conviction or caution, were resident outside England
or Wales. Offenders who had a conviction or caution outside England and Wales and who were
arrested by a police force in England and Wales would be counted as a First Time Offenders (FTO). 94 Where there were multiple offences on the same occasion, only the primary offence as recorded on the Police National Computer (PNC) would be counted. 95 The PNC data has a 6+1 ethnicity classification. For the purposes of this report, these categories were collapsed into a 4+1 classification. Please see Appendix I for further details. 96 The White ethnic group is comprised of two categories: White – North European and White – South European 97 Offenders whose ethnicity was unknown were excluded from all analysis, which may lead to inconsistencies with other published statistics on offenders. Between 2004 and 2014, this comprised between 2% and 3% of offenders overall.

65
convictions were from the Black ethnic group; substantially higher than the proportion in the overall population of England and Wales (3%). The Black ethnic group make up 25% of those with 15 or more previous cautions or convictions cautioned or sentenced for Robbery. Offenders receiving cautions
The proportion of all offenders receiving cautions has been falling since 2007, and
had decreased by 59% by 2014. Half of all cautions issued in 2014 were for first time
offenders (48%).
In the ten years to December 2014, cautions issued to first time offenders decreased
by 58%. The decreasing trend has been observed across all ethnic groups and for
both adult and juvenile offenders. The number of first time offenders receiving a
caution dropped 60% among the White ethnic group and 48% for the Black ethnic
group. First time offenders from the Asian and Other98 ethnic group categories were
issued with 38% and 37% fewer cautions in 2014 compared with 2004. The fall in
cautions issued has been particularly strong for juvenile offenders, with between 76%
(Black) and 84% (White) fewer cautions to first time offenders issued over the ten
years to December 2014.
The number of offenders who received a caution in 2014 and who had already
received at least one previous caution or conviction fluctuated for each of the ethnic
groups over the last ten years, but decreased 11% overall between December 2004
and December 2014. This has been driven by the falling numbers of cautions issued
to offenders from the White ethnic group, with 14% fewer cautions issued in 2014
than in 2004. The number of cautions issued for the Black, Asian and Other ethnic
groups with an offending history also fluctuated but increased overall during the ten
year period. Cautions issued for past offenders from the Other ethnic group
increased by 35%, and by 12% for past offenders from the Black and 9% from the
Asian ethnic groups respectively.
The trends for adult and juvenile offenders with a criminal history99 in terms of
receiving cautions were very different. There was a 70% decrease in the number of
cautions issued to juvenile offenders with an offending history in the last ten years.
This trend was observed across all ethnic groups, with the largest falls coming from
the White (70%), Asian (68%) and Other (66%) ethnic groups. Rising levels of
cautions issued were observed for adult offenders with an offending history across all
ethnic groups (a 13% increase overall). The largest increase was for the Other
ethnic group, with 60% more cautions issued in 2014 than in 2004, followed by the
Black and Asian ethnic groups (37% and 30% respectively).
98 Caution should be observed interpreting figures quoted for the Other ethnic group, as the numbers of offenders in this group was small compared with those from the White, Black and Asian ethnic groups. 99 An offender with a criminal history in this section refers to an offender with one or more previous cautions or convictions.

66
Offenders receiving sentences
Of all offenders receiving a sentence in 2014 for an indictable offence100, nine in ten
had at least one previous caution or conviction. Three quarters of those sentenced
who had an offending history were offenders from the White ethnic group.
The most commonly issued sentences in 2014 for first time offenders convicted of an
indictable offence from the White and Black ethnic groups were community sentence
orders (33% and 41% respectively, of all sentences issued). First time offenders
from the Asian and Other ethnic groups were more likely to receive immediate
custody (30% and 26% respectively) than other sentence types. White first time
offenders were equally likely to receive a suspended sentence or immediate
custodial sentence, with one in five offenders receiving each sentence type.
Offenders from the Black, Asian and Other ethnic groups were more likely to be
handed an immediate custodial sentence rather than a suspended sentence.
Figure 6.04: First time offenders sentenced for an indictable offence, by type
of sentence and ethnicity, 2014
100 Indictable offences include both indictable and triable either way offences, such as theft, drug offences, miscellaneous crimes and violence against the person offences.
0%
5%
10%
15%
20%
25%
30%
35%
40%
45%
50%
Absolute discharge
Conditional discharge
Fine Community sentence
Suspended sentence
Immediate custody
Other
Perc
enta
ge s
ente
nced
White Black Asian Other

67
In 2014, the most common sentence for offenders with 15 or more previous cautions
or convictions against them and who have been convicted of an indictable offence
was immediate custody for all ethnic groups. Offenders from the Asian ethnic group
were the most likely to receive an immediate custodial sentence (45% of all
sentences received) than any other sentence type.
Figure 6.05: Offenders sentenced for an indictable offence who have 15 or
more previous sanctions against them, by type of sentence and ethnicity, 2014
0%
5%
10%
15%
20%
25%
30%
35%
40%
45%
50%
Absolute discharge
Conditional discharge
Fine Community sentence
Suspended sentence
Immediate custody
Other
Perc
enta
ge s
ente
nced
White Black Asian Other

68
Chapter 7: Offenders: under supervision or in custody
This chapter provides statistics relating to offenders in custody or under supervision
in the community and proven re-offending information. Much of this information has
previously been published in the Offender Management Statistics Quarterly101, Safety
in Custody Statistics102, Accredited Programmes Annual Bulletin103 and Proven Re-
offending Statistics Quarterly Bulletin104 publications.
Prison Population
The total prison population includes offenders sentenced to immediate custody, those on remand, non-criminal prisoners and fine defaulters but does not include offenders under the age of 15 accommodated in the Youth Justice Board (YJB) operated secure estate. The proportion of prisoners who self-identified as White has remained broadly constant over the last ten years at 72%-75%.The proportion of prisoners of Mixed ethnicity has increased from 2.8% in 2005 to 4.1% in 2014 and the proportion who were Asian increased from 6.0% in 2005 to 7.7% in 2014. By contrast, the number of Black offenders fell slightly between 2005 and 2014, partly reflecting changes in the foreign national prison population (discussed below)105. The proportion of offenders who self-identified as Chinese or Other (C&O) has remained broadly constant over the last ten years between 1%-2%106,107. Figure 7.01 shows the prison population (only including British nationals) by self-identified ethnicity in 2014 per 10,000 people in England and Wales aged 15 years or older. Overall, there were just under 46 million people aged 15 or more in England and Wales according to the 2011 Census, and around 74,000 British nationals in prison in England and Wales in 2014, around 16 prisoners for each 10,000 people. There are wide variations by ethnicity, with 6 prisoners for each 10,000 people of C&O ethnic origin, 44 prisoners for each 10,000 of mixed ethnicity and 55 prisoners for each 10,000 people of Black ethnicity. As noted in the introduction, differences between ethnic groups may be attributable to a range of factors, including differences in the type or seriousness of the offences committed and previous criminal history. The differences observed broadly align with trends in remand and sentencing.
101 Source: Offender Management Statistics Bulletin annual 2013 (includes quarterly publication, October to December 2013), available here: www.gov.uk/government/statistics/offender-management-statistics-october-december-2013-and-annual. 102 Source: Safety in Custody Statistics England and Wales Deaths in prison custody to March 2015 Assaults and Self-harm to December 2014, available here: www.gov.uk/government/statistics/safety-in-custody-quarterly-update-to-december-2014-and-annual 103 Source: Accredited Programmes Annual Bulletin 2014/15, England and Wales, available here:
www.gov.uk/government/statistics/accredited-programmes-bulletin-2014-to-2015 104 Source: Proven Re-offending Statistics Quarterly Bulletin, January to December 2013, England and Wales, available here: www.gov.uk/government/statistics/proven-reoffending-statistics-january-2013-to-december-2013 105 Ethnicity data is missing for around 1% of prisoners in 2014 and has been less than 3% since 2005 106 Chinese prisoners were reclassified to the Asian ethnic group as of the latest year, making this the Other ethnic group as of June 2015. 107 Care should be taken when making comparisons between ethnicity trends in the prison population and those sentenced to custody presented in a previous chapter because of differences in the data: the sentencing data excludes those sentenced for summary offences whereas the prison population includes those offenders and levels of missing ethnicity data are very different for the two data sources. Moreover, the prison population reflects people who were sentenced to custody and also how long they were sentenced for.

69
The proportion of prisoners who self-identify as White was greater among older prisoners. Overall, in 2015, 74% of prisoners were White, but White offenders make up 54% of prisoners aged 15-17 years old and 92% of prisoners who were 60 years old or more. The proportion of prisoners who are female has declined among BAME but not among White offenders. In 2010, around 5% of prisoners were female. By 2015, among White prisoners, the proportion of females remained constant at around 5%, but among BAME prisoners, the proportion of females had fallen to around 3%. Figure 7.01: British nationals in the prison population by ethnicity per 10,000 people aged 15 years old or more, 2014
0
10
20
30
40
50
60
White Black Asian Mixed Chinese or Other
All
Priso
n p
op
ula
tio
n p
er 10,0
00 p
eo
ple
ag
ed
15 o
r m
ore

70
Prison population - foreign nationals only Of 86,000 people in prison in 2014 11,000 were foreign nationals. Of these, 42% were White, 28% were Black, 19% were Asian, 7% C&O and 4% Mixed. The number of White foreign national prisoners has steadily increased during the time-period shown, whilst the number of Black prisoners has steadily decreased. This is most likely a reflection of the changing profile of the foreign national prisoner population by country of origin, including a rise in the number of East European prisoners, particularly Poles, Romanians and Lithuanians, and a decline in the number of Jamaican prisoners108. Numbers of prisoners of Asian, Mixed and C&O ethnicities have remained broadly stable over the time-period109. Figure 7.02: Foreign national prison population by ethnicity, 2005- 2014
108Table A1.10, Source: Prison population by nationality, 2002 to 2014, England and Wales, available here: www.gov.uk/government/uploads/system/uploads/attachment_data/file/339036/prison-population-2014.xls 109 Ethnicity data is missing for around 2% of foreign national prisoners in 2014 and has been less than 5% since 2005. In addition, nationality data was missing for 1% of prisoners in 2014 and has been less than 4% in the time-period shown.
0
1,000
2,000
3,000
4,000
5,000
2005 2006 2007 2008 2009 2010 2011 2012 2013 2014
Num
ber
of
priso
ners
White Black Asian Mixed Chinese or Other

71
Discipline in Prison Establishments The adjudication process allows prison governors and independent adjudicators to deal with breaches of prison discipline internally, although the most serious offences can be referred to the police and ultimately dealt with by the courts110. In 2014, there were 91,000 adjudication hearings where the charge was proven and 19,000 where the charge was dismissed. Figure 7.03: Rates of proven adjudications per 100 prisoners, by ethnicity, 2010-2014
Mixed ethnicity offenders have consistently had the highest rates of adjudication (169 per hundred prisoners in 2014), followed by Black (126 per hundred prisoners), White (105 per hundred prisoners) and Asian offenders (70 per hundred prisoners). C&O offenders appear to have steadily increased in their adjudication rate in the time-period shown, although some care should be taken regarding this conclusion to the relatively small number of adjudications involved might result in some volatility.
110 Coverage of ethnicity for adjudications data is well completed, with approximately 0.5% of cases lacking information. Adjudications data can be found in the Offender Management Statistics quarterly
0
20
40
60
80
100
120
140
160
180
2010 2011 2012 2013 2014
Ad
jud
icatio
ns p
er year
per
100 p
riso
ners
White Black Asian Mixed Chinese or Other

72
Prison sentences Prison sentences can be divided into two broad groups: determinate sentences which are for a fixed period, and indeterminate sentences, which include life sentences and indeterminate sentences for public protection (IPPs) 111. Of the approximately 86,000 prisoners held in custody in June 2014, 13,000 (15%) were serving an indeterminate sentence. The ethnic profile of offenders serving an indeterminate sentence does not substantially differ from the ethnic profile of the wider prison population. The LASPO Act, which was passed on 3rd December 2012, abolished two types of indeterminate sentence: the Indeterminate sentences for Public Protection (IPPs) and Extended Sentence for Public protection (EPP) and replaced them with a determinate sentence, the Extended Determinate Sentences (EDS). Between June 2012 and June 2014 the number of prisoners serving an indeterminate sentence fell by 1,200 (8%) but the ethnic profile of those offenders has remained very similar. Custodial sentencing trends vary considerably by ethnicity but the proportion of the sentence that offenders serve in prison (which also contributes to trends in the prison population) does not vary a great deal by ethnicity. For example, in 2014, Black offenders were given custodial sentences of over 50% longer than White offenders, but both Black and White prisoners served 51% of their custodial sentence actually in prison. Figure 7.04: Prisoners, by whether or not serving an indeterminate sentence and ethnicity, 2014
111 Ethnicity coverage is good, with less than 1% missing data for both determinate and indeterminate sentences.
0%
10%
20%
30%
40%
50%
60%
70%
80%
90%
100%
All prisoners Prisoners on indeterminate sentences
Perc
ent
of
priso
ners
White Black Asian Mixed Chinese or Other

73
Safety in custody
Self-harm in prison custody is defined as, ‘any act where a prisoner deliberately harms themselves irrespective of the method, intent or severity of any injury.’ Although, those who self-harm often do so covertly, in prisons such incidents are more likely to be detected and counted112,113. In 2014, there were nearly 26,000 incidents of self-harm. Among male prisoners as well as female prisoners, White prisoners were more likely to commit an act of self-harm than BAME prisoners. There were too few female prisoners to provide a breakdown for each ethnicity, but BAME female prisoners overall were more likely to commit an act of self-harm than BAME male prisoners. White, female prisoners committed the most acts of self-harm at 1.9 acts per prisoner. Figure 7.05: Acts of self-harm per prisoner, by gender and ethnicity, 2014
As well as from acts of self-harm, safety in custody can also be endangered by assault from other prisoners. When compiling statistics on assault in prison, participants are categorised in three ways. Where an incident involves a clear aggressor and victim, participants are categorised as assailants or victims. Where an incident does not involve a clear aggressor or victim, participants are categorised as fighters114. In 2014, there were 10,000 prison assailants, 11,000 fighters and 8,000 victims.
112 Source: Safety in Custody Statistics England and Wales, Update to March 2014, available here:
www.gov.uk/government/uploads/system/uploads/attachment_data/file/339067/safety-in-custody-to-mar-2014.pdf 113 The proportion of self-harm incidents where the ethnicity was not known has been reducing over the past five years and now represents around 5% of all self-harm incidents. 114 Ethnicity information is available for over 99.7% of participants in all three categories in 2014.
0.0
0.5
1.0
1.5
2.0
2.5
All Male Female
Num
ber
of
self
-harm
incid
ents
per
priso
ner
White BAME

74
White or Asian prisoners were the least likely to be a participant in an assault in any capacity. For every 100 White prisoners, there were 9 assailants, 10 fighters and 8 victims. Black, Mixed and C&O prisoners were the most likely to be assailants or fighters. C&O prisoners were the most likely to be victims, although caution should be taken when interpreting this final result as it is based on relatively low numbers and shows considerable volatility over time. Figure 7.06: Rates of assaults in prison, by type of participant and ethnicity, 2014
Between 2010 and 2014 there were 1,040 deaths in prison which translates into between 2 and 3 deaths per 1,000 prisoners each year115,116. White prisoners were nearly three times as likely to die in custody, with rates of around 3 deaths per 1,000 prisoners each year, compared with BAME prisoners, with rates of around 1 death per 1,000 prisoners each year. Of the 1,040 deaths in prison between 2010 and 2014, 340 were self-inflicted, with around 0.8 deaths per 1,000 prisoners each year. White prisoners were nearly twice as likely to suffer a self-inflicted death in custody, with rates of around 0.9 deaths per 1,000 prisoners each year, compared with BAME prisoners, with rates of around 0.5 deaths per 1,000 prisoners each year.
115 Of the 1,040 deaths in prison ethnicity information was available for all but 2 prisoners. 116 Source: Safety in Custody Statistics England and Wales, Update to March 2014, available here:
www.gov.uk/government/statistics/safety-in-custody-quarterly-update-to-december-2014-and-annual
0
5
10
15
20
25
30
White Black Asian Mixed Chinese or Other
Rate
s p
er
100 p
risners
Assailants Fighters Victims

75
Probation
Probation caseload under supervision Overall, there were just over 44 million adults in England and Wales, according to the 2011 census, and there were around 110,000 adult offenders being supervised by the probation service117 at the end of December 2014 as part of a Community Order or Suspended Sentence Order. This is equivalent to around 25 offenders under supervision for every 10,000 people118. Figure 7.07 shows the ethnic breakdown of offenders under court order supervision as a result of a community order or Suspended Sentence Order in 2014. There were wide variations by ethnicity with 18 Asian offenders under probation supervision per 10,000 people, compared with 46 Black offenders. As noted elsewhere in this report, differences between ethnic groups may be attributable to a range of factors, including differences in the type or seriousness of the offences committed and previous criminal history. The pattern of offenders serving a prison sentence (see above) by ethnicity is similar to the pattern of offenders under probation supervision by ethnicity, with Mixed and Black offenders showing higher rates than C&O offenders. Figure 7.07: Adult offenders supervised by the Probation Service on a Community Order or Suspended Sentence Order by ethnicity per 10,000 people, December 2014
When a court imposes a community sentence or a suspended sentence with a requirement, the court says there are specific things the offender can, can't and must do while serving their sentence in the community. The most common requirements are unpaid work and supervision119. Unpaid work consists of offenders being required on local projects that may include cleaning litter or public land, redecorating public buildings or removing graffiti. Supervision consists of offenders attending appointments with a manager from the Probation Service. Offenders under
117 This chapter will not reflect any impact from Transforming Rehabilitation and the introduction of the National Probation Service, such as the extension of supervision to those with short custodial sentences, as the data only cover time periods prior to these changes. 118 Ethnicity data is missing for 9% of people supervised by the probation service under court orders. 119 Source: www.inbrief.co.uk/court-judgements/community-sentences.htm
0
10
20
30
40
50
60
White Black Asian Mixed Chinese or Other
Off
end
ers
sup
erv
ised
per 10,0
00 p
eo
ple

76
supervision show lower rates of re-offending compared with offenders with similar characteristics who were not supervised120. In 2014, White offenders were more likely to receive a supervision requirement than BAME offenders and less likely to receive an unpaid work requirement. In 2014, supervision requirements accounted for 34% of the requirements given to White offenders serving a community order compared with 29% of orders given to BAME offenders. Among offenders serving a Suspended Sentence Order, supervision requirements accounted for 36% of requirements given to White offenders compared with 32% of orders given to BAME offenders. In 2014, unpaid work accounted for 27% of requirements given to White offenders serving a community order compared with 36% of orders for BAME offenders. Among offenders serving a Suspended Sentence Order, unpaid work accounted for 23% of orders given to White offenders compared with 31% of orders for BAME offenders. Pre-release and post-release supervision All prisoners aged 21 or older given a custodial sentence of 12 months or more and all prisoners aged 18 to 21 are subject to pre-release and post-release supervision121,122. Offenders serving a sentence of 12 months and over are released from prison, in most cases automatically at the half way point of their sentence under supervision by the Probation Service123. Figure 7.08: Offenders under pre-release and post-release supervision by the Probation Service, by ethnicity, 2014
120 www.gov.uk/government/uploads/system/uploads/attachment_data/file/399389/impact-of-short-custodial-sentences-on-reoffending.PDF 121 Source: Offender management statistics: definitions and measurement, available here: www.gov.uk/government/uploads/system/uploads/attachment_data/file/218139/oms-definitions-measurement.pdf 122 Whilst ethnicity is self-declared, declaring ethnicity is not a requirement for prisoners – which may explain why the proportion of missing ethnicity data is 19% for offenders under pre-release supervision, a higher proportion than for other data-series used in this chapter. 123Missing and not stated data regarding ethnicity is much lower for this group at around 4%.
0%
10%
20%
30%
40%
50%
60%
70%
80%
90%
100%
Pre-release Post-release
Off
end
ers
sup
erv
ised
White Black Asian Mixed Chinese or Other

77
A higher proportion of offenders supervised post-release than pre-release were BAME. Differences in the ethnic profile of pre-release and post-release offenders are likely to reflect differences in the time spent in post-release supervision, with groups spending a long time on average more represented than groups spending less time. Time on post-release supervision generally reflects the length of sentence originally given at court. Recalls Offenders released on licence are subject to recall to prison immediately by Public Protection Casework Section if the supervising probation trust reports the offender as having breached the conditions of their licence124. Over the period April 1999 to December 2014, a total of 698,600 offenders were released from prison on licence supervision. Of those released on supervision 186,474 were recalled to custody for breaching the conditions of their licence, e.g. failing to report to their probation officer. The overwhelming majority of those were successfully returned (99.4% as of March 2015). In general, the results show very little variation by ethnicity. Just under 3 in 10 recalls in 2014 related to a further charge, just under 3 in 10 related to poor behaviour and the remainder (over 4 in 10) related to some other reason125. These proportions were similar for White and BAME offenders. Around 13% of recalls were on an emergency basis, and 87% were on a standard basis. These proportions were also similar for White and BAME offenders. Finally, as stated above, the vast majority of recalls were successful returned with a small number still at large, and this is again the case for both White and BAME offenders.
124 Source: Offender management statistics: definitions and measurement, available here: www.gov.uk/government/uploads/system/uploads/attachment_data/file/218139/oms-definitions-measurement.pdf 125 Ethnicity information is available for over 99.6% of offenders recalled during 2014.

78
Home Detention Curfew
On early release from prison, some offenders may go into the community under
Home Detention Curfew (HDC), which allows prisoners to live outside of prison
providing they do not breach the rules of their curfew and is designed to help
prisoners integrate into life outside prison. Around 9,000 offenders were released
under HDC in 2014, 19% of those eligible. 79% of those were White offenders, 9%
were Asian and 7% were Black.
Asian offenders were consistently the most likely to be released under HDC with 27%
of those eligible being released in 2014. C&O offenders were consistently the least
likely to be released under HDC with 10% of those eligible being released in 2014,
although these estimates should be treated with caution as they are based on low
number of released offenders of between 50 and 90 each year126.
Figure 7.09: Proportion of eligible prisoners released under Home Detention
Curfew by ethnicity, 2011-2014
126 Ethnicity data is available for over 99% of offenders who were released between 2011 and 2014.
Among offenders who were eligible for Home Detention Curfew, ethnicity data coverage improved from
to over 96% in 2011 to over 99% in 2014.
0%
5%
10%
15%
20%
25%
30%
35%
40%
45%
50%
2011 2012 2013 2014
Per cent
of
elig
ible
priso
ners
rele
ased
und
er
HD
C
White Black Asian Mixed Chinese or Other

79
Proven Re-offending
Proven re-offending for adult and juvenile offenders After offenders are released from custody or receive a non-custodial conviction at court or receive a caution, reprimand or warning, they may re-enter the Criminal Justice System if they are proven to have re-offended. For the purpose of the statistics presented below, a proven re-offence is defined as any offence committed in a one year follow-up period that leads to a court conviction, caution, reprimand or warning in a one year follow-up or within a further six month waiting period (to allow the offence to be proven in court)127. Published proven reoffending figures exclude those who are deported on release from prison, but include those who leave the country at a later date or after receiving a court order/caution etc. Because of the follow-up time and the waiting period, the most-up-to-date data for a calendar year relates to offenders released from custody, convicted, cautioned, reprimanded or given a warning in 2013128. In 2013, 84% of the offenders who were released from custody or received a non-custodial conviction at court or received a caution, reprimand or warning were White, 9% were Black, 6% were Asian and 1% were assigned to the ethnic category of Other129. Figure 7.10: Proven re-offending rates by ethnicity, 2003-2013
The re-offending rates of offenders for all offenders and for each ethnic group fell slightly over time. Black offenders have the highest re-offending rates at 29.8%, followed by White, Asian and Other offenders. These differences were consistent over time.
127 Details on the measurement of proven re-offending are available here: www.gov.uk/government/uploads/system/uploads/attachment_data/file/424830/proven-reoffending-definitions-measurement-apr15.pdf 128 Ethnicity information is not available for around 3-5% of offenders between 2002 and 2013. The re-offending rates of this group are much lower than for offenders who are assigned an ethnicity (around 7-8%). The reasons for this are not clear. 129 This comes from the ethnic categorisation used by police, based on officer identification
0
5
10
15
20
25
30
35
40
45
50
2003 2004 2005 2006 2007 2008 2009 2010 2011 2012 2013
Per cent
re-o
ffend
ing
White Black Asian Other

80
Figure 7.11: Re-offences per re-offender by ethnicity, 2003-2013
A slightly different pattern emerges when looking at the average number of proven re-offences committed over a year by each offender who re-offended at least once. White offenders have the highest number of re-offences per re-offender (3.16) but have the second highest re-offending rates. Black offenders have the second highest number of re-offences per re-offender (2.84) but have the highest re-offending rates. Like overall re-offending rates, the number of re-offences per re-offender fell from 2002 to 2009, but, unlike re-offending rates, it has since risen slightly since then. The differences between ethnicities have been consistent over time.
0.0
0.5
1.0
1.5
2.0
2.5
3.0
3.5
4.0
2003 2004 2005 2006 2007 2008 2009 2010 2011 2012 2013
Num
ber
of
re-o
ffences p
er re
-off
end
er
White Black Asian Other

81
Chapter 8: Offence Analysis
This section looks at common individual offences that can reasonably be used as
examples to investigate the relationship between ethnicity and the Criminal Justice
System. It will investigate differences between ethnic groups for these offences, and
whether this picture has changed over time.
The offences included in this chapter are mainly indictable offences, because as
discussed in this report (see Appendix II), the ethnicity coverage is better recorded
for these offences. However, ethnicity coverage for some high volume summary
offences tried in magistrates’ courts is sufficient for investigation in further detail.
Although, there are a number of offences that are of interest, the following were
chosen130
Shoplifting – Theft offences account for a high proportion of convictions
across ethnic groups and sexes, the majority of which are for shoplifting.
Selected ‘Violence against the person’ offences (indictable) – Violence
against the person offences account for a large proportion of convictions.
Common Assault (summary offence) – Of the summary offences with
sufficient ethnicity coverage, this is the second largest.
Drug Offences (indictable) – These account for the largest number of
convictions for all ethnic groups, with the exception of the White ethnic group.
130 Although the conviction ratio for the offence group Robbery is high – the number of individuals convicted is low volume compared with theft, drug and violence against the person offences. Where volumes are low, it is difficult to draw meaningful comparisons between ethnic groups. Likewise, the same can also be stated for sexual offences. In addition, the range of offences in the sexual offences group is varies, and reporting on overall trends dilutes the nuances and particular circumstances that encompass each case or offence type contained in sexual offences. As such, this offence analysis does not compare between ethnic groups, for these two offence types.

82
Theft Offences – Shoplifting
In 2014, shoplifting convictions made up the majority of theft convictions. Of those
convicted of theft, the offence was shoplifting in around 63% of cases for White
offenders, compared with around 58% of cases for Black offenders, and 56% of
cases for Asian offenders and Mixed offenders. Whilst the overall numbers convicted
for shoplifting have decreased in the last five years, the proportions of offenders
convicted of shoplifting by ethnicity have remained relatively stable.
In 2014, shoplifting was most commonly dealt with in court (as opposed to through an
out of court disposal), although this was relatively least common for Asian offenders.
This difference may in part be explained be attributed to the type of shoplifting
offences typically committed by different ethnic groups. For example, in each of the
previous five years a higher proportion of Asian offenders have been given a penalty
notice for disorder (PND) for retail theft of under £100131.
Figure 8.01: Proportion of offenders given a PND, caution or conviction for
shoplifting, by ethnicity, 2014132
131 Offence introduced with effect from 1 November 2001 132Ethnicity coverage for PNDs, cautions or convictions differs – see previous chapters - since these use different data sources. In addition, ethnicity is self-identified for PNDs and convictions, but officer identified for cautions.
0%
10%
20%
30%
40%
50%
60%
70%
80%
90%
100%
White Black Asian Other
2014
Perc
en
tag
e o
f P
ND
's,
Cau
tio
ns a
nd
C
on
vic
tio
ns
PNDs Cautions Convictions

83
The previous section 95 report, Women and the Criminal Justice System 2013 found
that shoplifting accounted for 45% of all female indictable convictions, up from 39% in
2009. This went down by one percentage point in 2014. The proportion of shoplifting
offences among all indictable offences, for each gender and ethnic group (i.e. Asian
females, etc.), was the highest for White female offenders at 50% - that is, half of all
indictable offences White females were convicted for were shoplifting. This compared
with 40% for Black females and 35% for Asian females.
Figure 8.02: Proportion of offenders convicted of all indictable offences who
were convicted for shoplifting, by ethnicity and sex, 2014
0%
5%
10%
15%
20%
25%
30%
35%
40%
45%
50%
Female Male Female Male Female Male Female Male Female Male
White Black Asian Mixed Chinese or Other
Pro
po
rtio
n o
f o
ffend
ers
co
nvic
ted
for
sho
plif
ting

84
Of those sentenced at court, the most common sentence type varied with ethnicity.
For example, in 2014, Asian offenders most commonly received immediate custody,
whereas White and C&O offenders most commonly received a conditional discharge.
The proportion of community sentences issued for all ethnic groups (except the C&O
group) fell in this five year time period.
Figure 8.03: Sentencing outcomes for shoplifting, by ethnicity, 2014133
133 In 2004, ethnicity coverage for shoplifting offences was at 23% - since then practices for recording ethnicity have improved, and in 2014, ethnicity coverage was at 90%.
0% 10% 20% 30% 40% 50% 60% 70% 80% 90% 100%
White
Black
Asian
Mixed
Chinese or Other
Percentage of sentencing outcomes, by ethnicity
Immediate custody Suspended sentence Community sentence
Fine Conditional discharge Other Outcomes

85
Selected violence against the person offences
The violence against the person (VATP) offence group contains a range of different
offences that fall under this category. The following section concentrates on high
volume offences, but amalgamates GBH with and without intent (as though GBH with
intent is a low volume offence, there is a suggestion from the data that there is a
relationship between prosecutions and sentencing for these two similar offences,
which is discussed below in further detail):
Grievous bodily harm (GBH) with intent
Grievous bodily harm (GBH) without intent
Actual bodily harm (ABH)134
Breach of a restraining order The most common VATP offence for which all offenders were proceeded and convicted for, between 2010 and 2014, was ABH. Mirroring broader trends in falling prosecutions, the number of people prosecuted for ABH has declined since 2010. There was around a 40% decline for the Black and Asian ethnic groups (and the C&O group, although the volumes were very low), and around a 50% decline for the Mixed and White defendants.
Prosecutions and convictions for ABH were around a third of all prosecutions for VATP offences in 2014. The proportion was higher for all ethnic groups in 2010 compared with 2014: it declined by 18 and 16 percentage points for White (50% in 2010 and 32% in 2014) and Mixed defendants (49% in 2010 and 33% in 2014), and by 10 percentage points for the Black defendants (44% in 2010 and 33% in 2014).
A partial explanation for the differences in overall decline could be an increase in prosecutions for another VATP offence, breach of a restraining order. Whilst the number of prosecutions for VATP offences has decreased since 2010, it appears that this is the only high volume VATP offence for which there has been a steady increase in the number of people proceeded against. Breach of a restraining order offences have increased as a proportion of all VATP offences between 2010 and 2014, by between approximately 7 and 12 percentage points for all ethnic groups, except for White defendants who had a higher increase of 17 percentage points.
134 Figures for ABH exclude Racially or religiously aggravated assault occasioning actual bodily harm

86
Figure 8.04: Convictions for the selected VATP offences, by ethnicity, 2014
Both prosecutions and convictions for ABH demonstrate slightly different trends for each ethnic group, and can be analysed using the conviction ratio135. In 2014, BAME groups had approximately a 57% conviction ratio for ABH, compared with White defendants, who had a 69% conviction ratio.
GBH without intent is the only VATP offence for which, across nearly all years and groups, there are more convictions than prosecutions (giving an apparent conviction ratio greater than 100%). A partial explanation for this may be that some offenders are originally prosecuted for GBH with intent, but this offence is downgraded to a GBH without intent, for example because of the difficulty of providing sufficient evidence to demonstrate a defendant’s intent. In 2014, for GBH without intent there is around a 5 to 10 percentage point difference in conviction ratio when comparing White (121%) and Mixed (120%) defendants to Black (110%) and Asian (114%) defendants. Although GBH with intent has a much lower conviction ratio across all defendants in 2014, there is some variation between groups, with 34% of Black defendants convicted compared with 29% of White, 28% of Mixed and 24% of Asian defendants.
In 2014, the most common sentence given to offenders across each of these four
specified offences was an immediate custodial sentence, for each ethnic group (with
the exception of C&O offenders sentenced for ABH). Nevertheless, the distribution of
sentence outcomes typically given at court differs between ethnic groups. For
example, for offenders sentenced to GBH without intent, a higher proportion of Black
and Mixed offenders (57%) received an immediate custodial sentence, compared
with around 50% for the other ethnic groups. In contrast, a higher proportion of White
and Asian offenders (38%) received a SSO compared with the Black (30%) and
Mixed (25%) ethnic groups. Patterns have also changed over time, due largely to the
greater use of SSOs, since 2005 (when they became more readily available under
135 The conviction ratio is calculated as the number of offenders convicted as a proportion of the number of defendants proceeded against.
0% 10% 20% 30% 40% 50% 60% 70% 80% 90% 100%
White
Black
Asian
Mixed
Chinese and Other
Percentage of convictions for VATP of fences
Other VATP of fences GBH without intent GBH with intent
Actual Bodily Harm (ABH) Breach of a restraining order

87
the Criminal Justice Act 2003). As with the wider trend for all indictable offences
(highlighted in the defendants’ chapter) there was also a decline in the proportion of
community sentences over the time period.
Average Custodial Sentence Length (ACSL)
In 2014, the ACSL for all violence against the person (VATP) offences was the
highest for Black offenders, at 37.2 months – around 10 months higher than Asian
and Mixed offenders, and 16 months higher than White offenders. However, when
looking at each of the selected high volume offences in the VATP offence group:
GBH without intent, ABH and Breach of a restraining order, the ACSL tends to be
more similar between all ethnic groups in the latest year136. The overall calculation
can be distorted by particular low volume offences and outliers (that can have varying
severity and a specific set of circumstances), which skew the overall average and
make it harder to draw out more general ethnicity trends. Previous years show
slightly more variation in the ACSL between ethnic groups for these selected
offences.
Figure 8.05: Average custodial sentence for all VATP offences and selected
offences, by ethnicity, 2014
Plea
If a defendant pleads guilty early on in a case, this often results in a discounted
sentence length or a smaller likelihood of receiving a custodial sentence. In 2014,
most White offenders tried for the selected VATP offences at the Crown Court whose
pleas are known pled guilty (74%), as did Mixed offenders (63%). These were higher
proportions than Black (54%), Asian (53%) and C&O offenders (48%). (This does not
mirror the overall Crown Court custody rates, but it is important to consider that the
136 This is less strongly the case for GBH with intent, likely a result of the smaller number of cases, as discussed above.
0
5
10
15
20
25
30
35
40
White Black Asian Mixed Chinese or other
Avera
ge C
usto
dia
l S
ente
nce L
eng
th
All VATP of fences GBH without intent ABH Breach of a restraining order

88
plea is only one component of sentencing decisions, alongside, for example, the
offence.)
The custody rate among those pleading guilty varied between ethnic groups and was
higher for Black (59%) and Mixed offenders (60%), compared to White (53%), Asian
(49%) and C&O (49%) offenders. The ACSL was longer for Black and C&O offenders
who pled guilty (27 months), compared to all other ethnic groups (between 22 and 25
months).
Pleading not guilty, but then being found guilty tends to result in a higher custody rate and a longer ACSL. Of those offenders who pled not guilty but were found guilty the ACSL was the highest for Black (62 months) and Mixed (56 months) offenders, compared to White (51 months), Asian (50 months) and C&O offenders (37 months). The custody rate was the highest for Mixed offenders at 81%, compared to around 65% to 69% for all other ethnic groups (except C&O offenders, at 54%, for whom there was only a small number of cases). Of those who pled not guilty, a higher proportion of White, Asian and C&O offenders (69% - 71% for all) were acquitted than Black (64%) and Mixed offenders (66%). Common assault Common assault is a high volume summary offence which has sufficient ethnicity
coverage to be considered137. The distribution of prosecutions broadly mirrors the
population, with 83% of those prosecuted being White, compared with 8% Black and
6% Asian. The number of defendants proceeded against for this offence has slightly
fluctuated in the last five years, falling by 6% for the White ethnic group and 11% for
the Mixed ethnic group, but rising for the Asian (7%) and C&O (8%) groups. The
conviction ratio was the highest for the White ethnic group (68%), compared with
54% for the Asian group and around 60% for other BAME groups.
The most common sentencing outcome for common assault was a community
sentence across all ethnic groups, and there are minimal differences between the
groups in the distribution of other outcomes.
137 Ethnicity coverage for common assault is approximately 90% between 2010 and 2014.

89
Drug Offences
Use of out of court disposals138
Drug offences vary both by their nature and their severity. In 2014, drug offences
accounted for the second highest proportion of cautions139 issued for all offenders,
including for each ethnic group taken separately (except for the Other ethnic group),
although a smaller proportion of drug offenders were dealt with through a caution in
2014 than 2010. Since 2010, a larger proportion of Black, Asian, and Other offenders
were dealt with for drug offences through a conviction at court rather than a caution,
compared with White offenders.
Figure 8.06: Proportion of offenders given a caution or conviction for drug
offences that were given a conviction, by ethnicity, 2010 and 2014.140
138 Due to modifications in the recording of ethnicity data, as well as lack of ethnicity coverage for
Cannabis/Khat Warnings, it has not been possible to investigate the extent to which these out of court
disposals have contributed to the decline in cautions. 139 Ethnicity data for caution is measured using the officer identified 4+1 categorisation, whereas convictions are measured using courts data which utilises the 5+1 categorisation. For the purpose of this analysis the 5+1 categorisation is re-calibrated to match the 4+1. 140 For cautions, ethnicity was well documented at a 98-99% coverage between 2010 and 2014. In the same time period, coverage in the Court Proceedings database was between 90-94%.

90
Sentencing outcomes
In 2014, the number of offenders sentenced for drug offences fell by around 20%
since 2010. This fell more for some groups than others: White, Asian and Mixed
offenders decreased by around 20%, compared with 10% for Black offenders. The
greatest decline was seen among C&O offenders, at 30%, though the small numbers
involved increase the likelihood of percentages fluctuating.
In contrast, the actual number of drug offenders (with the exception of the C&O
ethnic group) sentenced to immediate custody has remained relatively stable over
the past five years – and as a consequence, the custody rate has increased. Custody
rates were higher for C&O, Asian and Black offenders.
Figure 8.07: Number of offenders sentenced, offenders sentenced to custody
and custody rate for drug offences, by ethnicity, 2014
Plea
In 2014, a large majority of offenders tried for drug offences at the Crown Court
whose pleas are known pled guilty, although the proportion was greater for White
offenders (90%) – compared with BAME groups (80% to 85%). The custody rate
among those pleading guilty varied between ethnic groups – with Asian (64%) and
Black (63%) offenders being more likely to be sentenced to custody than White
(43%) or Mixed offenders (46%). The ACSL was shorter for White offenders, at 31
months compared with between 34 to 37 months for Black, Asian and Mixed
offenders.
The ACSL for those who pled not guilty but were subsequently convicted was longer
for White and Asian offenders, at 66 and 70 months respectively, compared with
Black (58 months) and Mixed offenders (55 months).
0%
5%
10%
15%
20%
25%
30%
35%
0
5,000
10,000
15,000
20,000
25,000
30,000
35,000
40,000
White Black Asian Mixed Chinese or Other
Custo
dy R
ate
Num
ber
of
Off
end
ers
Sente
nced
Total Sentenced Immediate Custody Custody Rate

91
Selected Drug Offences
The largest number of drug convictions in the past five years were given for
possession of Class A and B drugs, followed by as production, supply and intent to
supply a controlled Class A or B drug.
When considering either possession of or production, supply and intent to supply a
controlled Class A or B drug, the proportion of each ethnic group convicted of each
class differs. In 2014, although most offenders convicted of possession were
convicted for a Class B drug across all ethnic groups, the proportion was higher for
the Black (80%) and Mixed (78%) groups than for White (71%), Asian (73%) and
C&O (74%) offenders.
Black and Asian offenders convicted of production, supply and intent to supply were
less likely to be convicted for Class B than Class A drugs (36% and 48% Class B
respectively); whereas a higher proportion of all other ethnic groups convicted of
production, supply and intent to supply were convicted for Class B than Class A
drugs (for example, 69% Class B for the White group).
Tougher sentences are mandated for Class A drugs than Class B drugs, and as such
receiving a custodial sentence was more common for all ethnicities found in
possession of a Class A drug, compared with Class B drugs. The proportion of
offenders receiving community sentences for possession of Class A drugs fell by
around half across all ethnicities between 2010 and 2014, which can be attributed to
the introduction of Sentencing Council guidelines141 in 2012 that explicitly advised
courts that the initial sentence for a drug offence should be a fine142.
141 Source: Sentencing Council, Definitive Guidelines (2012), available here: www.sentencingcouncil.org.uk/wp-content/uploads/Drug_Offences_Definitive_Guideline_final_web1.pdf 142 This coincided with an increase in the proportion of offenders receiving a fine between 2010 and 2014

92
A higher proportion of White offenders received conditional discharges compared with other ethnic groups, among those sentenced for possession of Class A and Class B drugs. 16% of White offenders sentenced for possession of Class A drugs received a conditional discharge, compared with 11%-12% for Black, Mixed and Asian offenders. For possession of class B drugs, 27% of White offenders received a conditional discharge, compared with 18%-21% for Black, Mixed and Asian offenders. Black, Asian and C&O offenders had higher custody rates for production, supply and intent to supply offences, though it should be noted that the number of offenders in these groups is small: caution is advised when comparing small numbers (as discussed previously). Figure 8.08: Sentencing outcomes for production, supply and intent to supply a controlled Class A and Class B drug, by ethnicity, 2014
0%
10%
20%
30%
40%
50%
60%
70%
80%
90%
100%
White
Bla
ck
Asia
n
Mix
ed
Chin
ese
or O
ther
White
Bla
ck
Asia
n
Mix
ed
Chin
ese
or O
ther
Class A Class B
Perc
enta
ge o
f sente
ncin
g o
utc
om
es
Immediate custody Suspended sentence Community sentence
Fine Other outcomes Otherwise dealt with

93
Chapter 9: Practitioners
This chapter reports on the trends in the ethnic makeup of staff and practitioners
throughout the criminal justice system (CJS).
As in previous versions of this report, we will be including information on the ethnic
makeup of the police, Ministry of Justice (MoJ), Crown Prosecution Service (CPS)
and judiciary. Information on the National Offender Management Service [NOMS] will
continue to be included, although data limitations will restrict what we are able to say
about probation services. We will also comment briefly on the magistracy. Budgetary
restraint led to variable headcount falls throughout the public sector during this
period; to allow for this, ethnicity is best considered in terms of proportions of staff
rather than absolute numbers.
Trends in CJS organisations
The ethnic diversity of the various organisations involved in the CJS is variable, with
the highest proportion of BAME individuals being in the MoJ and CPS (both 19%,
higher than the population as a whole) and the lowest being in police officers and the
judiciary (6%). There has been little change in the makeup of organisations involved
in the CJS over the last 5 years.
Figure 9.01: Ethnic makeup of organisations involved in the CJS, most recent
year available143
MoJ staff144 have seen the greatest increases in the BAME population over the last 5
years, from 16% to 19%, including a 1 and 2 percentage point rise in Black and Asian
143 Latest data available for each – see footnotes below. Population data from 2011 - see Appendix III 144 Self-identified from HR records, as at 31 March 2011 – 2015, coded using the standard 5+1 scale. Typically not held for more than 20% of staff, however, which places substantial uncertainty around these findings. The 2013/14 MoJ Diversity Report is available from
0%
10%
20%
30%
40%
50%
60%
70%
80%
90%
100%
Po
pula
tio
n
Po
lice
off
icers
CP
S
Mo
J
Mag
istr
ate
s
Jud
icia
ry
NO
MS
(e
xclu
din
g
pro
batio
n)
Perc
enta
ge o
f sta
ff
White Black Asian Mixed Chinese or Other

94
staff members respectively. Within the CPS, the proportion of BAME staff145 has
been rising slowly over the last 5 years from 17% to 19%, with most of the rise
coming from the Asian ethnic group.
There has been an even slower rise among police officers146, from 5% to 6%, with
the largest rises coming in the Asian and Mixed groups. (The proportion of BAME
community support officers [CSOs] and special constables has not increased over
the same period, remaining at 11% of special constables and falling from 11% to 9%
of CSOs.) Although the proportion of new officers who are minority ethnic has risen
overall across the last 5 years by almost 2 percentage points, the proportion of the
officers leaving has also risen by more than 1 percentage point.
There has been a similarly slow increase among the judiciary147, from 5% to 6% over
the period. The proportion of BAME magistrates148 also rose slightly between 2011
and 2015, from 8 to 9%, with a small fall in the proportion of Black magistrates (from
4% to 3%) and a small increase in the proportion of Asian magistrates (from 3% to
5%).
NOMS’149 BAME proportion, excluding the probation service, has also stayed broadly
flat over the last 5 years, fluctuating around 6-7%. This is driven by Her Majesty’s
Prison Service (HMPS), which had 6% BAME staff throughout the period. (NOMS
HQ staff, similarly to central MoJ staff, were both generally and increasingly more
likely to be BAME compared with those in HMPS, rising from 11% to 13% over the
last 5 years.) Following the Transforming Rehabilitation reforms to probation and
creation and subsequent transfer of the National Probation Service (NPS) into NOMS
on 1 June 2014, only limited protected characteristics data were transferred. As with
new joiners, information on gender, age, and full-time/ part-time status was recorded
by default, however, other protected characteristics (ethnicity, disability, sexual
orientation and religion/belief) required NPS staff to make fresh declarations and as a
result response rates are currently low. It is therefore not possible to make a direct
comparison to previous years for probation staff.
www.gov.uk/government/publications/diversity-report-2013-to-2014, but numbers will not match as this encompasses NOMS and only includes ‘on strength’ (i.e. paid) staff. 145 Self-identified from HR records, snapshots from 31 December 2010 – 2014, coded using the standard scale. Typically not known for 12 – 13% of staff, which increases the uncertainty around these findings. CPS workforce diversity data can be found through: www.cps.gov.uk/publications/equality/equaloppsstats/index.html 146 Self-identified ethnicity, as at 31 March 2011 – 2015 coded using the 5+1 scale. Typically not known for 1 – 2% of officers. Joiners and leavers are only provided as White or minority ethnic, with similar typical not known rates, although this increased to 5% for joiners in the last 2 years. Police workforce statistics are available from www.gov.uk/government/collections/police-workforce-england-and-wales 147 Self declared ethnicity of judges in courts only, as at 1 April 2011 – 2015, reported in the latest Judicial Diversity Statistics. Not known for around 17% of judges. Chinese is categorised as Asian, otherwise this aligns with the standard Census classification – see Appendix I. Available here: www.judiciary.gov.uk/publications/judicial-statistics-2015/ 148 Self-identified ethnicity of serving magistrates, as at 31 March in 2011 and 2015, reported alongside the Judicial Diversity Statistics. Known in almost 100% of cases. Available here: www.judiciary.gov.uk/publications/judicial-statistics-2015/. 149 Self-identified from HR records, as at 31 March 2011 – 2015, coded using the standard scale. Across NOMS (excluding probation staff), levels of unknowns have increased over the last 5 years from 9% to 13%. This trend applies to both HMPS and central staff, although overall levels are much higher among central staff than HMPS (around 20% compared with around 10%). The 2013/14 MoJ Diversity Report is available here: www.gov.uk/government/publications/diversity-report-2013-to-2014

95
Trends in senior staff
Figure 9.02: Ethnic makeup of senior staff in organisations involved in the CJS,
most recent year available
The proportion of senior staff who are BAME was lower than the overall staff
proportion in every organisation considered, which may relate in part to the tendency
of senior staff to be older, given changes in the ethnic makeup of the population over
time. The CPS and MoJ are the most ethnically diverse organisations at senior levels
as well as more generally. Caution should be taken when comparing these figures,
however, because the numbers of individuals represented are small - changing a
single case could have a noticeable effect. Related to this, there are no clear trends
of changes in the makeup of senior staff over the last 5 years.
0%
10%
20%
30%
40%
50%
60%
70%
80%
90%
100%
Police of f icers CPS MoJ Judiciary NOMS (excluding probation)
Perc
enta
ge o
f senio
r sta
ff
White BAME

96
Appendix I: Ethnicity Classifications
There are two measures of recording ethnicity that are utilised throughout this publication: officer identified ethnicity and self identified ethnicity. This appendix details the categorical breakdowns of both types of ethnicity. Officer Identified Ethnicity
Officer identified ethnicity is ethnicity as recorded by a police officer or a member of
the administrative or clerical team, based on visual appearance. The data is initially
inputted into six detailed categories, which are then re-categorised in the Court
Proceedings database into four categories (as shown below). Most sections in this
report use the 4 point classification, as outlined below, when referring to officer
identified ethnicity.
Table I.01: Mapping of the 4 point classification to the Phoenix Classification
4 point classification (4+1) Phoenix Classification150
White White – North European (IC1)
White – South European (IC2)
Black Black (IC3)
Asian Asian (IC4)
Other Chinese, Japanese, or South East Asian
(IC5)
Middle Eastern (IC6)
Unknown/ Not Stated Unknown (IC0)
Self Identif ied Ethnicity
Self identified ethnicity is ethnicity as defined by an individual, and categories are based on the classifications as defined by the 2001 and 2011 Census151. The ONS introduced two further categories to the Census in 2011: ‘White – Gypsy or Irish Traveller’ and ‘Arab’; and moved ‘Chinese’ to the broader Asian category. To allow for comparability with previous editions of Race and the Criminal Justice System, Chinese are placed in the ‘Chinese and Other’, or ‘Other’ category, following the 2001 Census.
150 The Phoenix classification refers to the database in which officers enter details of ethnicity based on visual appearance. The corresponding Identity Code (IC) refer to how these are input into the database. 151 See Appendix III

97
Mapping Ethnicity Categorisations
Although data is in some places available for the full 2011 and 2001 Census categorisation, as these have 16 or more categories the number of people in each category when looking at the Criminal Justice System (CJS) can be very small. As a consequence, broader categories were used when drawing comparisons – see below. Both the 4 and 5 point classifications can also be mapped onto each other, which enable comparisons across data sources where different classifications have been used. Table I.02: Mapping of different ethnicity categorisations
152 Listed here as included in these summary groups in our analysis; in practise included in the Asian group in the 2011 census
5 point
classification
(5+1)
4 point
classification
(4+1)
2011 Census
Categorisation
(18+1)
2001 Census
Categorisation
(16+1)
White White White – British
White – Irish
White - Gypsy or
Irish traveller
White – Other
White – British
White – Irish
White – Other
Black Black Black – African
Black – Caribbean
Black – Other
Black – African
Black – Caribbean
Black – Other
Asian Asian Asian – Bangladeshi
Asian – Indian
Asian – Pakistani
Asian – Other
Asian – Bangladeshi
Asian – Indian
Asian – Pakistani
Asian – Other
Mixed [Divided
between
groups – group
in brackets]
White and Black
African (Black)
White and Black
Caribbean (Black)
White and Asian
(Asian)
Any other mixed
background (Other)
White and Black
African (Black)
White and Black
Caribbean (Black)
White and Asian
(Asian)
Any other mixed
background (Other)
Chinese or Other Other Chinese152
Other
Asian - Chinese
Other Arab
Any other ethnic
group
Not Stated Not Stated Not Stated Not Stated

98
Appendix II: Selection of ethnicity measures
Choice of classification
Throughout this publication, two main sources of ethnicity data are used: officer
identified ethnicity153 and self-identified ethnicity. Collecting data on ethnic groups is
complicated, because of the subjective, multifaceted and changing nature of ethnic
identification. There is no consensus on what constitutes an ethnic group, and
membership is viewed as self-defined and subjective to the individual. An ethnic
group can encompass common ancestry, shared heritage and elements of culture,
identity, religion, language and physical appearance154. In acknowledgement of this,
we have referred to self-identified ethnicity where the data is available and of
sufficient coverage.
Our use of either self-identified or officer identified ethnicity is constrained by data
coverage. Less serious crimes are tried at magistrates’ courts and mostly consist of
high volume summary motoring and non-motoring offences. The most typical
outcome for a majority of summary offences is a fine (see Criminal Justice Systems
Statistics Annual, 2014155), and the processing of these cases often does not result in
the defendant’s ethnicity being recorded. Largely this explains the relatively low
ethnicity coverage (around 40% - 50% in the latest 5 year period) across all crimes
proceeded against at magistrates’ courts. Ethnicity coverage for indictable offences is
better since defendants must appear in court: ethnicity coverage is between 86% and
90% for all defendants proceeded against for these offences in the same period.
153 Although called officer identified ethnicity, ethnicity is not necessarily recorded by a police officer but can be recorded by another member of the administration team. 154 Further details on guidance and methodology of ethnicity categories are available here: www.ons.gov.uk/ons/guide-method/measuring-equality/equality/ethnic-nat-identity-religion/ethnic-group/index.html#2 154 Source: Criminal Justice Statistics, 2014, available here: www.gov.uk/government/statistics/criminal-
justice-system-statistics-quarterly-december-2014

99
Table II.01: Proportion of missing data for self-identified ethnicity across key
data sources, 2010 to 2015
Missing data (calendar year)
Source Chapter 2010 2011 2012 2013 2014
Cautions 4 3% 2% 3% 3% 4%
PNDs 4 15% 18% 19% 9% 6%
CPD(1) - all offences 5 50% 51% 54% 55% 57%
CPD(1) - indictable 5 10% 11% 12% 13% 14%
Pre-sentence reports 5 6% 4% 5% 9% 13%
Offending histories - all 6 3% 3% 3% 4% 4%
Sources: Various, please consult individual chapter tables for more information
Missing data (financial year)
Source Chapter 2009/10 2010/11 2011/12 2012/13 2013/14 2014/15
Homicide (victims) 3 1% 2% .
Arrests 4 2% 2% 2% 2% 2% .
Stop and search 4 4% 4% 4% 5% 5% .
Prison population 7 2% 2% 3% 2% 1% .
Police 9 . 1% 1% 1% 1% 1%
Judiciary 9 . . . . . 17%
Sources: Various, please consult individual chapter tables for more information156
However, there are still areas in which officer identified ethnicity is the only type
available – for example, when the source is the Police National Computer (PNC),
which is used in Cautions (chapter 4) and Offending Histories (chapter 5).
156 A ‘.’ means this data is not shown as part of this publication. Homicide victim numbers are combined over 3 year periods: 2005/06 to 2007/08, 2008/09 to 2010/11 and 2011/12 to 2013/14. Figures shown are for the specific period as single years cannot be resolved. Missing data was 4% in the period 2005/06 to 2007/08.

100
Concordance between ethnicity classifications
Despite the differing nature of officer identified ethnicity and self-identified ethnicity –
both measures of ethnicity have a high measure of concordance with one another157.
The MoJ Court Proceedings database for defendants holds both officer identified and
self-identified ethnicity for the same individual. The matches between shared ethnic
groups between these two measures of ethnicity are high, with: White (98%), Black
(96%) and Asian (90%).
Table II.02: Concordance between ethnicity figures for White, Black and Asian:
combined data for 2010 to 2014, MoJ Court Proceedings Database
Concordance between the two measures of ethnicity has been replicated in Home
Office data with 95% to 99% of ethnicity matching across the White, Black and Asian
ethnic groups; when looking at suspects for homicides.
Table II.03: Concordance between ethnicity figures for White, Black and Asian
suspects for homicides, combined data for 2011/12 to 2013/14
Ethnic appearance (4+1 classification) (numbers)
White Black Asian Other Total (all)
Self-identified ethnicity (5+1
ethnicity classification) (percentages)
White 99.2% 0.1% 0.1% 0.7% 100.0%
Black or Black British 1.0% 97.7% 1.0% 0.3% 100.0%
Asian or Asian British 0.0% 0.7% 95.3% 4.0% 100.0%
Mixed 14.3% 60.7% 7.1% 17.9% 100.0%
Chinese or Other 0.0% 0.0% 8.3% 91.7% 100.0%
Source: Home Office Homicide Index, 2011/12 to 2013/14
157 A full data-set of defendants with officer identified and self identified ethnicity and court outcomes can be found in accompanying CSVs.
Ethnic appearance (4+1 classification) (percentages)
White Black Asian Other Not stated Total (all)
Self-identified ethnicity (5+1
ethnicity classification) (percentages)
White 98% 0% 0% 0% 1% 100%
Black 1% 96% 1% 1% 1% 100%
Asian 2% 1% 90% 6% 1% 100%
Mixed 17% 64% 10% 4% 5% 100%
Chinese or Other 36% 8% 12% 38% 6% 100%
Not stated 17% 4% 1% 1% 76% 100%
Total (all) 72% 10% 5% 1% 12% 100%
Source: Court Proceedings database

101
Ethnicity classifications used by topic
Table II.04: List of data sources and ethnicity classification used
Chapter Topic Parent publication/source Ethnic
groups
3. Victims Personal Crime and
racially motivated
incidents
Crime in England and Wales (Crime
Survey of England and Wales)
5 (no
unknowns)
Racist incidents
Racially or Religiously
Aggravated Crimes
(police recorded)
Hate Crime, England and Wales (police
records)
N/A
Racially or Religiously
Aggravated Crimes
(court proceedings)
Criminal Justice Statistics (Court
Proceedings database) 5+1
Homicide Focus on: Violent Crime and Sexual
Offences (police records) 4+1
4. Police
Activity
Stops and Searches Arrests
Police Powers and Procedures (police records)
5+1
PNDs Cautions
Criminal Justice Statistics (police records)
5+1 (based on
4+1 for some
police forces)
4+1
5. Defendants
and 7. Offence
analysis
Prosecutions
Remands
Sentences
Criminal Justice Statistics (Court
Proceedings database) 5+1
Pre-sentence reports Offender Management Statistics (prison
records and probation records) 5+1
6. Offender
Characteristics Employment, income
and benefits
Experimental statistics from the 2013
MoJ/ DWP/ HMRC data share (MoJ/
DWP/ HMRC data share)
4+1 (as 6+1)
Offending Histories Criminal Justice Statistics (police
records) 4+1
8. Offenders in
prison or
under
probation
supervision
Prison population
Sentences served
Adjudications
Probation / supervision
Offender Management Statistics (prison
records and probation records) 5+1
Assaults
Self-harm
Deaths in custody
Safety in Custody Statistics (prison
records and by Public Protection
Casework Section
5+1
Reoffending Proven Re-Offending (police records) 4+1
9. Practitioners Police
Police workforce England and Wales
statistics (police records) 5+1
Crown Prosecution
Service
Crown Prosecution Service Data –
Equality and Diversity (CPS records) 5+1
Ministry of Justice MoJ Diversity Report (MoJ records) 5+1
National Offender
Management Service
National Offender Management Service
workforce statistics (NOMS records) 5+1
Probation Service Probation Service workforce quarterly
statistics (probation service records) 5+1
Judiciary Judicial Diversity Statistics (judiciary
records)
5+1 (except
Chinese in
Asian)
Magistracy Judicial Diversity Statistics (magistrates
records) 5+1

102
Appendix III: Population Comparisons
Data source and calculations
Population data is presented throughout this report to contextualise the proportions of
ethnic groups observed. Doing this allows the assessment of the representation of
ethnic groups across the Criminal Justice System in relation to their representation in
the population.
The data source we have used for the population data is the 2011 Census158.
Previous editions of this bulletin have used Population Estimates by Ethnic Group
(PEEGs), since these were considered more current assessments of the ethnic
composition of the population. However, in 2011, the ONS issued a note159 about the
limitations of these “experimental” statistics and have not since produced any further
estimates, whilst they conduct an assessment of the methods used to produce the
PEEGs. As a result, the most recent well validated data source for the population
remains the 2011 Census – meaning that this bulletin uses the same data source for
the population as the 2012 edition.
Generally, we refer to the 2011 Census population figures for those who are aged 10
and over, or constrain the population to the age range of those we are comparing to.
For example, in the chapter on practitioners, the census data is constrained to the
working population by looking at 18 to 64 year olds.
Rates have been calculated throughout the bulletin in relation to the number of
individuals of a given ethnic group in the population, and most commonly per 1,000
population members. For example, the Black arrest rate is equal to the number of
Black suspects arrested divided by the number of Black individuals aged 10+ in the
population, multiplied by 1,000. It represents the number of Black individuals arrested
for every 1,000 Black individuals in England and Wales.
Implications and limitations
There are limitations surrounding the use of the 2011 Census, particularly since the
population is already estimated to have changed from around 56 million (as of the
2011 Census) to 64.6 million (as of mid 2014 population estimates)160. We cannot
assess the changes in each ethnic group, as some groups may have declined and
others have increased. For example, there is some evidence that suggests that the
Mixed ethnic group are a growing segment of the population.161
158 Adapted from data from the Office for National Statistics licensed under the Open Government
Licence v.3.0 159 Source: Population Estimates by Ethnic Group: Note on Reliability (Office of National Statistics,
2011), available here: www.ons.gov.uk/ons/rel/peeg/population-estimates-by-ethnic-group--
experimental-/current-estimates/peegs-notes-on-reliability-of-estimates.pdf 160 Source: National population projections, 2014-based Statistical Bulletin (Office of National Statistics, 2014), available here: www.ons.gov.uk/ons/dcp171778_420462.pdf 161 One example of this can be found here: www.ethnicity.ac.uk/medialibrary/briefings/dynamicsofdiversity/how-has-ethnic-diversity-grown-1991-2001-2011.pdf

103
It is almost a certainty that the population has undergone changes since 2011 and
ethnic diversity has altered within England and Wales, both at the police force area
level and nationally. However, given that we cannot comment on the level or extent
of these changes – until another Census has been carried out – this introduces an
element of uncertainty into all estimation of rates and consideration of over- or under-
representation in the CJS. This uncertainty represents a limitation of using the 2011
Census data to contextualise current ethnicity trends – these data should be viewed
as an approximation of the true population figures at present in 2014/15. (For this
reason we do not compare rates among the population over previous years). It is
particularly important to consider that, if the BAME census proportions are
underestimates, as we suspect, this could give the impression of overrepresentation
when current CJS proportions are compared with past population proportions.
There are particular risks when considering the data for more detailed groups,
because the smaller the numbers involved, the greater the potential for fluctuations
or uncertainty over the exact numbers to distort results. In particular, we would
advise caution when interpreting results for police force areas, as there are likely
differences in reporting practises and net migration trends as well as small numbers
in individual ethnic groups.
Considering all regions in England and Wales, London has the highest proportion of
members of BAME groups. As with our analysis of stops and searches, it may be
important to consider whether there is a difference between regions or police force
areas when considering differences between ethnic groups.
Figure III.01: Ethnic group representation in the population, 2011 Census
0%
10%
20%
30%
40%
50%
60%
70%
80%
90%
100%
White Black Asian Mixed C&O
Pro
po
rtio
n o
f in
div
iduals
over 10 y
ears
of
ag
e
London All England and Wales

104
Revisions Policy
In accordance with Principle 2 of the Code of Practice for Official Statistics, the
Ministry of Justice is required to publish transparent guidance on its policy for
revisions. A copy of this statement can be found at:
http://www.justice.gov.uk/downloads/statistics/mojstats/statistics-revisions-policy.pdf
The Ministry of Justice aims to avoid the need for revisions to publications unless
they are absolutely necessary and put systems and processes in place to minimise
the number of revisions.
Within the Ministry of Justice’s statistical publications there can be three main
reasons for statistics to be revised:
Changes in how either source administrative systems collect information or a change in statistical methodology to improve accuracy and measurement.
Receipt of subsequent information which alters our understanding of previous periods (for example – late recording on one of the administrative IT systems used operationally).
Errors in our statistical systems and processes.
Our policy in handling revisions is to be transparent with users about:
The need for revisions.
How and when to expect revisions as part of our standard processes.
The processes by which other revisions will be communicated and published.
To meet these commitments, all of our statistical publications will:
Ensure that the need for major revisions for any series are pre-announced on the Ministry of Justice website.
Include a detailed revisions policy within every release.
Detail how users will be informed of the need for revisions.
Give detailed and full explanations as to why the revisions were necessary.
In addition, the annual report from the Head of Profession to the National Statistician
will:
Provide information on how many revisions were required to our publications and the reasons for these.
Publish a time-series of revisions due to errors in our statistical processes and procedures so we can monitor the quality of our outputs.

105
Contacts
Press enquiries should be directed to the Ministry of Justice press office:
Tel: 020 3334 3536
Email: [email protected]
Other enquiries about these statistics should be directed to the Justice Statistics
Analytical Services division of the Ministry of Justice:
David Jagger, Criminal Justice System Statistics
Ministry of Justice, 7th Floor, 102 Petty France, London, SW1H 9AJ
Email: [email protected]
General enquiries about the statistical work of the Ministry of Justice can be e-mailed
General information about the official statistics system of the UK is available from:
www.statisticsauthority.gov.uk/about-the-authority/uk-statistical-system
Feedback The structure and content of this report is continually being reviewed to reflect user requirements. If you have any feedback about the changes referred to in the introduction, or the report more generally, please contact the production team through the Justice Statistics Analytical Services division of the Ministry of Justice: Email: [email protected]
© Crown copyright
Produced by the Ministry of Justice
Alternative formats are available on request from