Statistics on Public Sector Employment: … Activities Programme SAP 2.85/WP.144 Salaried Employees...
67
Sectoral Activities Programme Salaried Employees and Professional Workers’ Branch Bureau of Statistics Working Papers Statistics on Public Sector Employment: Methodology, Structures and Trends by Messaoud Hammouya INTERNATIONAL LABOUR OFFICE GENEVA
-
Upload
truongxuyen -
Category
Documents
-
view
215 -
download
1
Transcript of Statistics on Public Sector Employment: … Activities Programme SAP 2.85/WP.144 Salaried Employees...
Sectoral Activities ProgrammeSalaried Employees and Professional Workers’ Branch
Bureau of Statistics
Working Papers
Statistics on Public Sector Employment:Methodology, Structures and Trends
by Messaoud Hammouya
INTERNATIONAL LABOUR OFFICE GENEVA
Sectoral Activities Programme SAP 2.85/WP.144
Salaried Employees and Professional Workers’ Branch
Bureau of Statistics
Working Papers
Statistics on Public Sector Employment:Methodology, Structures and Trends
by Messaoud Hammouya, Bureau of Statistics, ILO
Working papers are preliminary documents intendedto stimulate discussion and critical comment
International Labour Office Geneva
Printed by the International Labour Office, Geneva, Switzerland
Copyright © International Labour Organization 1999
Publications of the International Labour Office enjoy copyright under Protocol 2 of the Universal Copyright Convention.Nevertheless, short excerpts from them may be reproduced without authorization, on condition that source is indicated. Forrights of reproduction or translation, application should be made to the Publications Branch (Rights and Permissions),International Labour Office, CH-1211 Geneva 22, Switzerland. The International Labour Office welcomes such applications.Libraries, institutions and other users registered in the United Kingdom with the Copyright Licensing Agency, 90 TottenhamCourt Road, London W1P 9HE (Fax: +44 171 436 3986), in the United States with the Copyright Clearance Center, 222Rosewood Drive, Danvers, MA 01923 (Fax: +1 508 750 4470), or in other countries with associated Reproduction RightsOrganizations, may make photocopies in accordance with the licences issued for this purpose.
ISBN 92-2-111785-5
First published 1999
The designations employed in ILO publications, which are in conformity with United Nations practice, and the representationof material therein do not imply the expression of any opinion whatsoever on the part of the International Labour Officeconcerning the legal status of any country, area or territory or of its authorities, or concerning the delimitation of its frontiers.The responsibility for opinions expressed in signed articles, studies and other contributions rests solely with their authors, andpublication does not constitute an endorsement by the International Labour Office of the opinions expressed in them.Reference to names of firms and commercial products and processes does not imply their endorsement by the InternationalLabour Office, and any failure to mention a particular firm, commercial product or process is not a sign of disapproval.
ILO publications can be obtained through major booksellers or ILO offices in many countries, or directly from ILOPublications, International Labour Office, CH-1211 Geneva 22, Switzerland. A catalogue or list of new publications will besent free of charge from the above address.
1 ILO, Report for discussion and Note on the proceedings (Documents JMPS/1998/8 and JMPS/1998).
2 ILO, Final Report (document JMPS/1995/10).
iii
Foreword
This working paper is the result of an interdepartmental study involving the SalariedEmployees and Professional Workers Branch of the Sectoral Activities Department and theBureau of Statistics of the International Labour Office (ILO).
The first version of this document was prepared as a contribution to the "Joint Meetingon Human Resource Development in the Public Service in the Context of Structural Adjustmentand Transition" concerning statistical information on employment in the public sector, whichwas held at the ILO Headquarters in Geneva from 14 to 18 December 19981. It alsorepresented a first step towards answering the request of the "Joint Meeting on the Impact ofStructural Adjustment in the Public Services (Efficiency, Quality Improvement and WorkingConditions)"2 in 1995, for comparable and useful statistics at the international level.
During the 1998 joint meeting, the discussions reflected a broad interest and increasedexpectation in this matter. This document now makes the study accessible to a larger audience.Comments and suggestions are welcomed and may be addressed to the Bureau of Statistics,ILO, CH-1211 Geneva, Switzerland. (E-mail: [email protected], [email protected]; Fax:+41 22 799 6957).
The ILO is indebted to the national statistical agencies which cooperated in providingstatistical information on public sector employment by replying to the ILO questionnaire onthe subject or supplying relevant reports or tabulated data currently available from surveys orother sources. Some of the available data are presented in this working paper.
K. Ashagrie V. Klotz Director Chief
Bureau of Statistics Salaried Employees and Professional Workers Branch
July 1999

v
Table of contents
Foreword . . . . . . . . . . . . . . . . . . . . . . . . . . . . . . . . . . . . . . . . . . . . . . . . . . . . . . . . . . . . iii
Introduction . . . . . . . . . . . . . . . . . . . . . . . . . . . . . . . . . . . . . . . . . . . . . . . . . . . . . . . . . . 1
1. Methodology for collecting comparable data . . . . . . . . . . . . . . . . . . . . . . . 2
1.1 Background . . . . . . . . . . . . . . . . . . . . . . . . . . . . . . . . . . . . . . . . . . . . . . . . . . . . . 2
1.2 Concept and definitions . . . . . . . . . . . . . . . . . . . . . . . . . . . . . . . . . . . . . . . . . . . . 3
1.3 The survey questionnaire . . . . . . . . . . . . . . . . . . . . . . . . . . . . . . . . . . . . . . . . . . . 4
2. The results of the collection of data . . . . . . . . . . . . . . . . . . . . . . . . . . . . . . . 5
2.1 Overview of the replies . . . . . . . . . . . . . . . . . . . . . . . . . . . . . . . . . . . . . . . . . . . . 5
2.2 Charts and tables . . . . . . . . . . . . . . . . . . . . . . . . . . . . . . . . . . . . . . . . . . . . . . . . . 7
2.2.1 Employment structures in the public sector . . . . . . . . . . . . . . . . . . . . . . . . . . . . . 7
Share of public employment in total employment . . . . . . . . . . . . . . . . . . . . . . . . . . . . . . . . 7
Share of employment of women in the public sector . . . . . . . . . . . . . . . . . . . . . . . . . 9
Public employment by type of institution and level of government . . . . . . . . . . . . . . . 14
Public employment by branch of activity . . . . . . . . . . . . . . . . . . . . . . . . . . . . . . . 18
2.2.2 Public employment trends . . . . . . . . . . . . . . . . . . . . . . . . . . . . . . . . . . . . . . . . . 23
Changes in public sector employment and total employment . . . . . . . . . . . . . . . . . . . 23
Changes in public sector employmentand in employment in community services etc. . . . . . . . . . . . . . . . . . . . . . . . . . . . 31
Annex 1: List of countries and territories contained in the database . . . . . . . . . . . . 37
Annex 2: Questionnaire on statistics on public sector employment . . . . . . . . . . . . . 39
Annex 3: List of sectorial working papers . . . . . . . . . . . . . . . . . . . . . . . . . . . . . . . . . 57
1 Estimated on the basis of the data collected in the survey described in the present report
1
Introduction
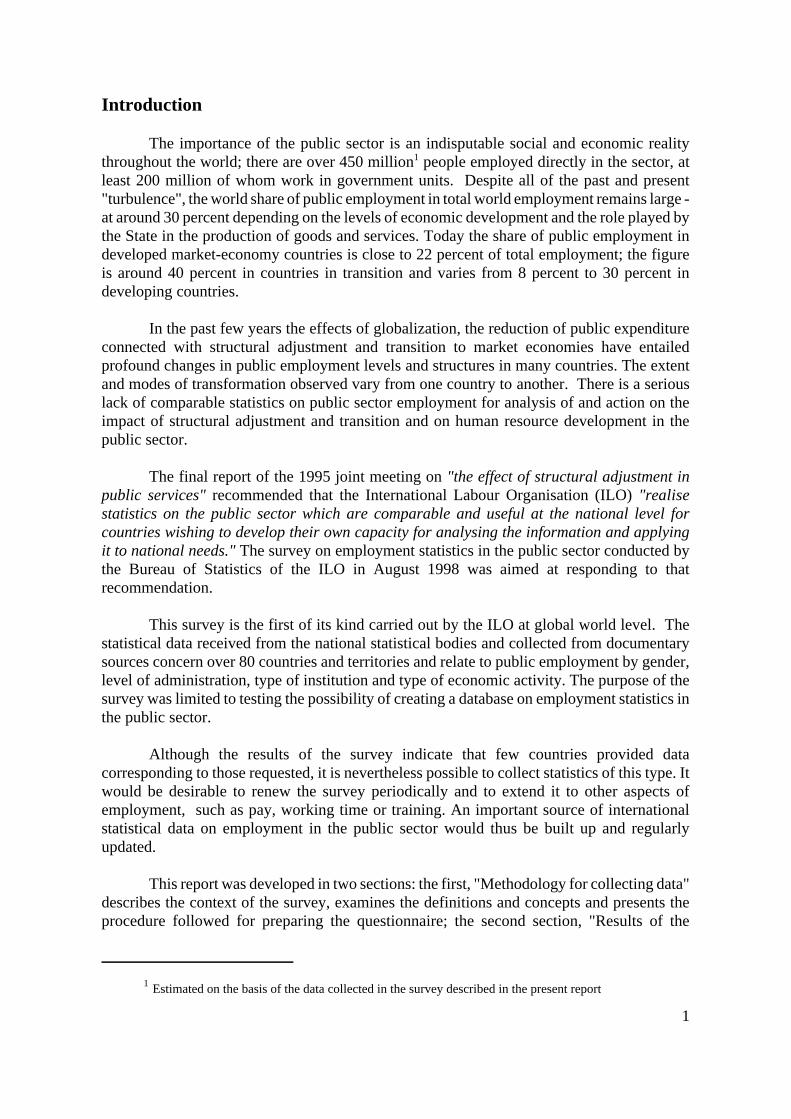
The importance of the public sector is an indisputable social and economic realitythroughout the world; there are over 450 million1 people employed directly in the sector, atleast 200 million of whom work in government units. Despite all of the past and present"turbulence", the world share of public employment in total world employment remains large -at around 30 percent depending on the levels of economic development and the role played bythe State in the production of goods and services. Today the share of public employment indeveloped market-economy countries is close to 22 percent of total employment; the figureis around 40 percent in countries in transition and varies from 8 percent to 30 percent indeveloping countries.
In the past few years the effects of globalization, the reduction of public expenditureconnected with structural adjustment and transition to market economies have entailedprofound changes in public employment levels and structures in many countries. The extentand modes of transformation observed vary from one country to another. There is a seriouslack of comparable statistics on public sector employment for analysis of and action on theimpact of structural adjustment and transition and on human resource development in thepublic sector.
The final report of the 1995 joint meeting on "the effect of structural adjustment inpublic services" recommended that the International Labour Organisation (ILO) "realisestatistics on the public sector which are comparable and useful at the national level forcountries wishing to develop their own capacity for analysing the information and applyingit to national needs." The survey on employment statistics in the public sector conducted bythe Bureau of Statistics of the ILO in August 1998 was aimed at responding to thatrecommendation.
This survey is the first of its kind carried out by the ILO at global world level. Thestatistical data received from the national statistical bodies and collected from documentarysources concern over 80 countries and territories and relate to public employment by gender,level of administration, type of institution and type of economic activity. The purpose of thesurvey was limited to testing the possibility of creating a database on employment statistics inthe public sector.
Although the results of the survey indicate that few countries provided datacorresponding to those requested, it is nevertheless possible to collect statistics of this type. Itwould be desirable to renew the survey periodically and to extend it to other aspects ofemployment, such as pay, working time or training. An important source of internationalstatistical data on employment in the public sector would thus be built up and regularlyupdated.
This report was developed in two sections: the first, "Methodology for collecting data"describes the context of the survey, examines the definitions and concepts and presents theprocedure followed for preparing the questionnaire; the second section, "Results of the

2 World Development Report, 1997 and "An International Statistical Survey of Government Employmentand Wages", Policy Research Working Paper, No. 1806, August 1997.
3 "Measuring Public Employment in OECD Countries: Sources, Methods and Results", WorkingPaper, OECD/DG(97)232.
2
survey", summarizes the data provided by the countries on structures and trends in the publicsector employment in the form of tables and charts.
1. Methodology for collecting comparable data
The ILO Bureau of Statistics has been proceeding pragmatically since 1997 with a viewto exploring the possibility of building up an international database on employment statisticsin the public sector. This undertaking is a follow-up to the collaboration with the PublicManagement Department (PUMA) of the OECD, the results of which were presented in 1994in a publication entitled "Statistical sources on public sector employment" (ILO/OECD, Paris1994).
The present work was carried out with the collaboration of the Salaried Employees andProfessional Workers Branch (TRAVINT) of the Sectoral Activities Department of the ILOand is part of the overall process of providing statistics on public sector employment whichother international organisations, in particular the World Bank2 and OECD3, have embarkedupon.
Few other attempts have been made to compare methods and figures with a view toimproving data collection and obtaining comparable statistics on public employment with asbroad coverage of countries.
1.1 Background
In July 1997 the Bureau of Statistics conducted an first survey, mainly among thenational statistical institutes of the ILO Member States, with a view to establish an inventoryof the various national sources and methods used for compiling statistics on public sectoremployment. Examination of the preliminary results of that survey reveals great diversity inthe manner in which employment levels and structures in the public sector are obtained.
This diversity must be taken into account in any study which involves internationalcomparisons; these findings are as follows:
- In most countries there are at least two, if not more, national institutions whichprepare statistics on public sector employment.
- There are different types of data sources which coexist within theseinstitutions.
- The field of the public sector is defined by a set of public institutionsaccording to the criteria chosen by the countries, and not all types of jobsand/or status situations of the persons employed are necessarily included.

4 "System of National Accounts", Commission of the European Communities, International MonetaryFund, Organisation for Economic Cooperation and Development, United Nations, World Bank,Bruxelles/Luxembourg, New York, Paris, Washington, D.C., 1993.
3
- The coverage of the "public sector" statistics varies from one country toanother and often from one institution to another within a given country. Thedefinitions are usually determined by national legislation and reflect thehistorical development of the State and the evolution of the status of publicinstitutions.
- There is very limited use of the standardised international definitions of thepublic sector.
- Very few countries conduct periodical and specific public employmentsurveys. In general, the data collected on public sector employment constitutesa sub-set of data which is collected in national surveys (censuses, labour forcesurveys, etc.) or which comes from a combination of various administrativesources (pay records, insurance records, etc.).
It transpires from these findings that considerable care must be taken in the comparisonof public sector employment statistics and that the main difficulty relating to the comparabilityof data lies in the definition of the public sector. The national definitions vary from onecountry to another and with the risk that they may not be stable over time - hence theadvantage of using common international definitions.
1.2 Concept and definitions
The most important international concept of the public sector is contained in the"System of National Accounts"4 (SNA 93).
Two major criteria are laid down in the SNA 93 for giving a precise definition of"government units" and, more broadly, the public sector: the criteria of "market / non-market"and "control and financing". The simultaneous application of these two criteria to everyactivity where goods or services are produced traces the boundary between the public and theprivate sector. And in order to make the definition clearer and more transparent a distinctionis made between the institutional levels of government: three levels are differentiated - thecentral level, the federal State level (or the regional level), and the local level.
The public sector is thus defined as all market or non-market activities which at eachinstitutional level are controlled and mainly financed by public authority. It is composed ofa general government sector and a public corporation sector (figure a, page 4).
The general government sector is made up of all of the government units, socialsecurity funds and non-profit, non-market public or private institutions which are controlledand mainly financed by public authority.

4
The public corporation sector comprises all of the institutional units which produce forthe market and are controlled and mainly financed by public authority.
The definitions are set out in further detail in Annex 2, page 39, in the "generalinstructions" of the questionnaire.
Public sector
Central level, federal state level (or regional level) and local level
Institutions controlled and mainly financed by public authority
General government sectorPublic
corporationsector
governmentsunits
Socialsecurityfunds
Non- profitand
non-marketinstitutions
Non-market institutions Market institutions
1.3 The survey questionnaire
The above-mentioned findings and national data-collecting practices were taken intoaccount in the designing of the questionnaire.
Description of the questionnaire
The questionnaire is composed of four tables, a set of instructions for completing thetables and an annex reproducing an extract from Chapter IV - "Institutional units and sectors"of the System of National Accounts 1993. It was drawn up in English, French and Spanish.
The first two tables (Table 1A "Total" and Table 1B "Women") relate to public sectoremployment data by type of institution and level of government, as well as to private sectoremployment.
The other two tables (Table 2A "Total" and Table 2B "Women") concern public sectoremployment by economic activity according to the International Standard IndustrialClassification of all Economic Activities (ISIC Rev. 2 or ISIC Rev. 3).
For each of these tables the agencies were requested to provide the data for four years:the latest year available plus 1995, 1990 and 1985, or years close to those years. They werealso asked to indicate the type of source and unit of measurement used.
Figure a:
Public sectoraccording to SNA 93
5
The choices made
1. Tables 1A and 1B are an accurate representation of the only standard internationaldefinition of the public sector, that which is contained in the System of NationalAccounts 1993: each type of institution is represented by a heading in the table.
2. The ISIC Rev. 2 and Rev. 3 classifications do not make any distinction betweenthe public and the private sector like the SNA does; on the other hand, however,both identify a part of the public sector, "Administration, national defence andcompulsory social insurance" represented by category 91 of ISIC Rev. 2 andcategory L of ISIC Rev. 3 respectively. The decision to add 2 tables with theseclassifications was motivated by the following considerations:
- In certain countries the only possibility of obtaining approximateestimates for public sector employment is to base them on the ISIC Rev.2 or Rev. 3 categories; the collection of such statistics is not yet linkedto the SNA 93 definitions.
- The public employment data by economic activity can make thestructural changes and the consequences of privatisation measures in thepublic sector more visible.
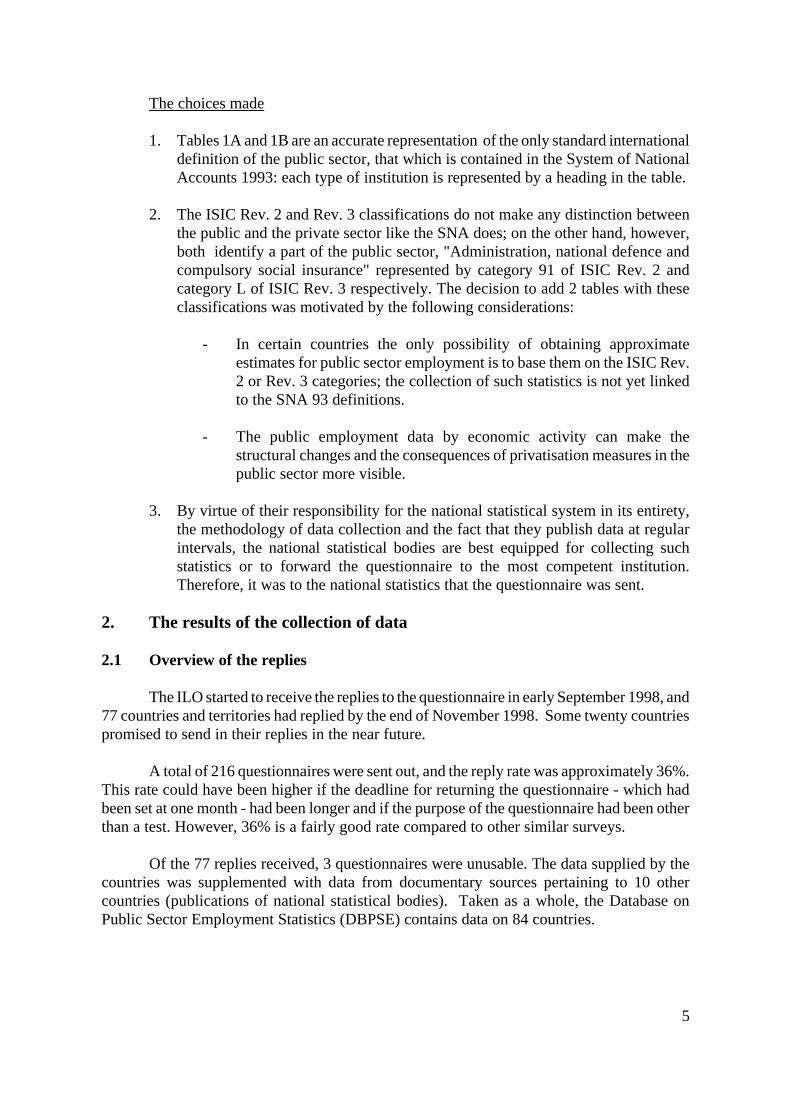
3. By virtue of their responsibility for the national statistical system in its entirety,the methodology of data collection and the fact that they publish data at regularintervals, the national statistical bodies are best equipped for collecting suchstatistics or to forward the questionnaire to the most competent institution.Therefore, it was to the national statistics that the questionnaire was sent.
2. The results of the collection of data
2.1 Overview of the replies
The ILO started to receive the replies to the questionnaire in early September 1998, and77 countries and territories had replied by the end of November 1998. Some twenty countriespromised to send in their replies in the near future.
A total of 216 questionnaires were sent out, and the reply rate was approximately 36%.This rate could have been higher if the deadline for returning the questionnaire - which hadbeen set at one month - had been longer and if the purpose of the questionnaire had been otherthan a test. However, 36% is a fairly good rate compared to other similar surveys.
Of the 77 replies received, 3 questionnaires were unusable. The data supplied by thecountries was supplemented with data from documentary sources pertaining to 10 othercountries (publications of national statistical bodies). Taken as a whole, the Database onPublic Sector Employment Statistics (DBPSE) contains data on 84 countries.
6
Data source %
Labour force Survey 23Establishment survey 23Administrative registers 18Combinaison of different sources 24Population census 4Others 10
Total 100
Unit of measuremant %
Employed persons 75Persons with regular contracts 2Persons working full time 5Employment as full time equivalents 4Paid Employment 1Others 13
Total 100
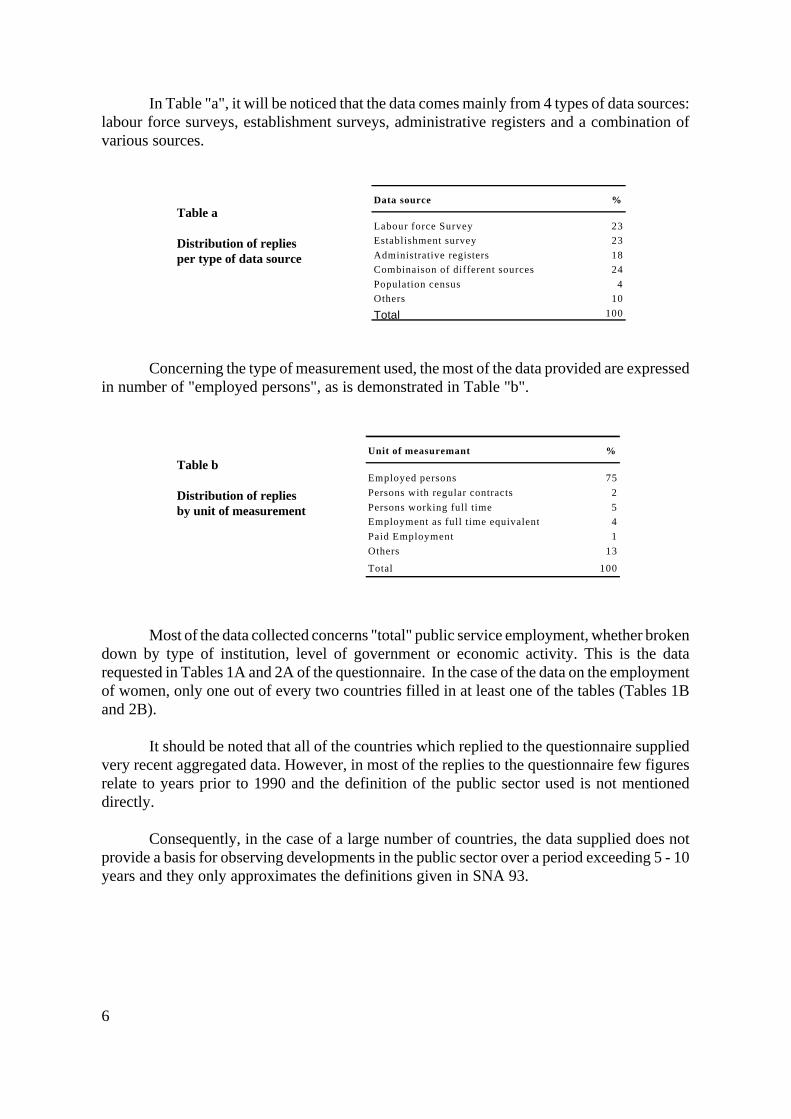
In Table "a", it will be noticed that the data comes mainly from 4 types of data sources:labour force surveys, establishment surveys, administrative registers and a combination ofvarious sources.
Table a
Distribution of repliesper type of data source
Concerning the type of measurement used, the most of the data provided are expressedin number of "employed persons", as is demonstrated in Table "b".
Table b
Distribution of repliesby unit of measurement
Most of the data collected concerns "total" public service employment, whether brokendown by type of institution, level of government or economic activity. This is the datarequested in Tables 1A and 2A of the questionnaire. In the case of the data on the employmentof women, only one out of every two countries filled in at least one of the tables (Tables 1Band 2B).
It should be noted that all of the countries which replied to the questionnaire suppliedvery recent aggregated data. However, in most of the replies to the questionnaire few figuresrelate to years prior to 1990 and the definition of the public sector used is not mentioneddirectly.
Consequently, in the case of a large number of countries, the data supplied does notprovide a basis for observing developments in the public sector over a period exceeding 5 - 10years and they only approximates the definitions given in SNA 93.

5 In the case of the majority of developing countries, total employment corresponds to formal sectoremployment.
7
To ta l (54 ) OCDE
count r ies (15) Developing
count r ies (25) Countries in
t rans i t ion (14)
7 2 %
7 9 %7 7 %
6 0 %
2 8 %
2 1 % 2 3 %
4 0 %
0%
20%
40%
60%
80%
Public Private
2.2 Charts and tables of figures
Although the data contained in the DBPSE relates to only 84 countries and territories,it provides a basis for revealing the general and current features concerning employmentstructures and trends in the public sector by group of countries. The following charts andtables of figures have been drawn up to illustrate these structures and trends.
2.2.1 Employment structures in the public sector
Share of public employment in total employment
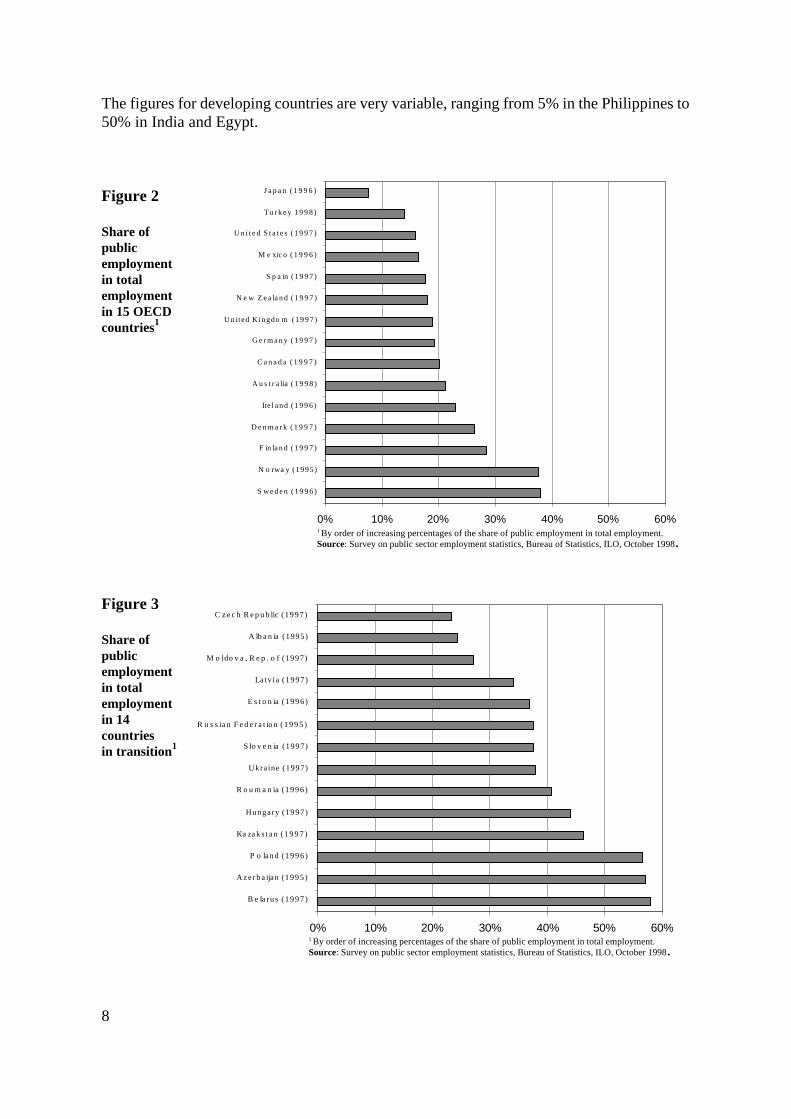
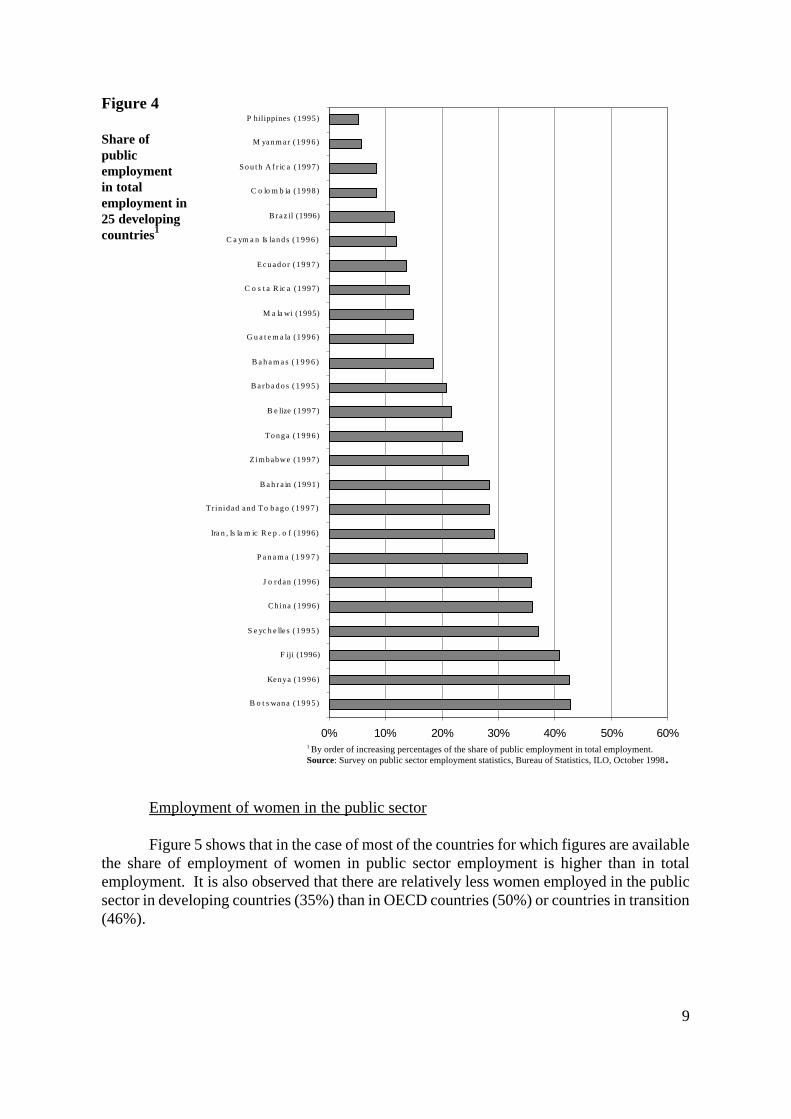
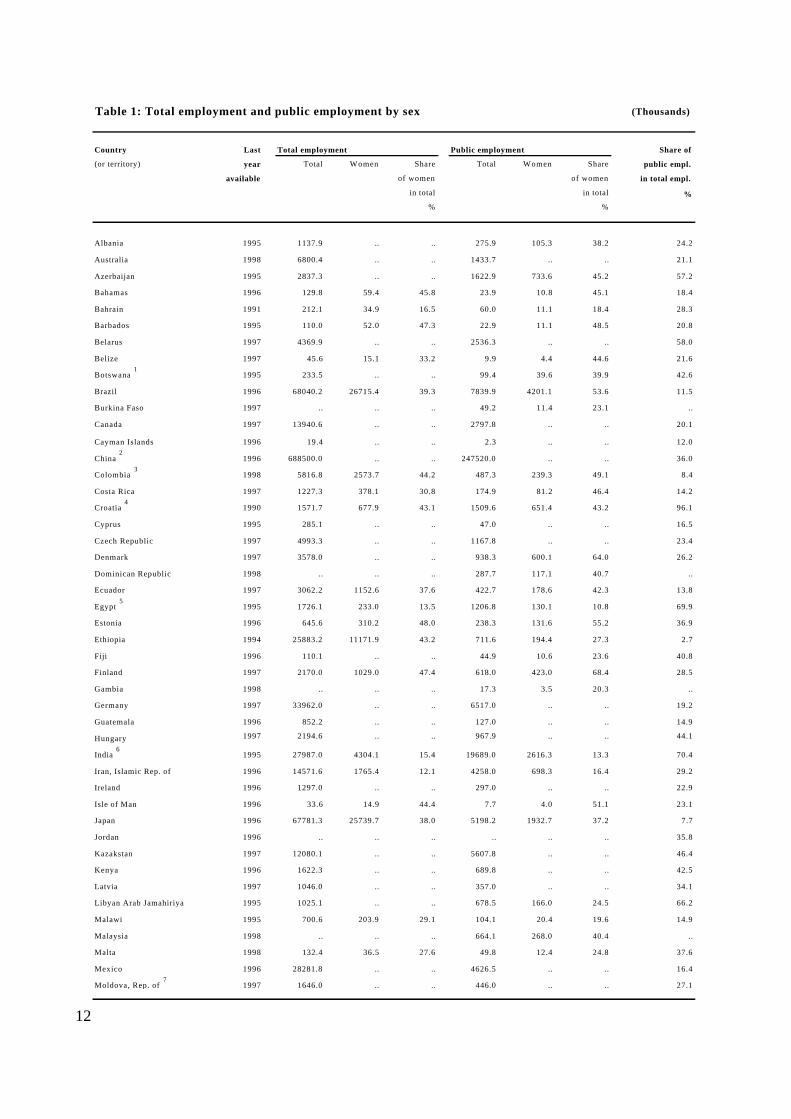
Figures 1, 2, 3 and 4 illustrate the share of public employment in total employment5 bycountry and for recent years. The figures quoted in the charts have been taken from the columnheaded "Share of public employment in total employment" of Table 1 "Total employment andpublic employment by sex", page 12.
Figure 1
Share of publicand privateemploymentby group ofcountries1
(Average of the nationalpercentages)
These charts show that there are big differences in the employment contributions ofpublic sector employment to total employment and thus in the degrees of participation ofgovernment units in the production of goods and services. In the countries for which data isavailable, the share of public employment ranges from 5% (Philippines) and 8% (South Africaand Japan) to over 55% (Azerbaijan and Belarus).
In the case of the OECD countries, the share of public employment in totalemployment is close to 21%; it is around 40% in countries in transition to a market economy.
1 In brackets the number of countries considered.Source: Survey on public sector employment statistics, Bureau of Statistics, ILO, October 1998.
8
0% 10% 20% 30% 40% 50% 60%
S weden (1996)
N o rwa y (1995)
F in la n d ( 1 9 9 7 )
D e n m a r k ( 1 9 9 7 )
Ire l and (1996)
A u s t r a lia ( 1 9 9 8 )
C a n a d a ( 1 9 9 7 )
G e r m a n y ( 1 9 9 7 )
United Kingdo m (1997)
N e w Z e a la n d ( 1 9 9 7 )
S p a in (1997)
M e xic o ( 1 9 9 6 )
U n i t e d S t a t e s ( 1 9 9 7 )
Turkey 1998)
J a p a n ( 1 9 9 6 )
0% 10% 20% 30% 40% 50% 60%
B e larus (1997)
Azerba ijan (1995)
P o land (1996)
Ka zaks t an (1997 )
Hungary (1997)
R o u m a n ia (1996)
Ukraine (1997)
S lo v e n ia (1997)
R u s s ia n F e d e r a t ion (1995)
E s t o n ia (1996)
Latvia (1997)
M o ldo v a , R e p . o f (1997)
A lb a n ia (1995)
C z e c h R e p u b lic (1997)
The figures for developing countries are very variable, ranging from 5% in the Philippines to50% in India and Egypt.
Figure 2
Share ofpublicemploymentin totalemploymentin 15 OECDcountries1
Figure 3
Share ofpublicemploymentin totalemploymentin 14countriesin transition1
1 By order of increasing percentages of the share of public employment in total employment.Source: Survey on public sector employment statistics, Bureau of Statistics, ILO, October 1998.
1 By order of increasing percentages of the share of public employment in total employment.Source: Survey on public sector employment statistics, Bureau of Statistics, ILO, October 1998.
9
0% 10% 20% 30% 40% 50% 60%
B o t s wana (1995)
Kenya (1996)
F iji (1996)
S e yc h e lles (1995)
China (1996)
J o rdan (1996)
P a n a m a ( 1 9 9 7 )
Ira n , Is la m ic R e p . o f (1996)
Trinidad and To bago (1997)
B a h r a in (1991)
Zimbabwe (1997)
Tonga (1996)
B e lize (1997)
B a r b a d o s ( 1 9 9 5 )
B a h a m a s ( 1 9 9 6 )
G u a t e m a la (1996)
M a la wi (1995)
C o s t a R ic a (1997)
Ecuador (1997)
C a ym a n Is lands (1996)
Braz il (1996)
C o lo m b ia (1998)
Sou th Af r ic a (1997)
M yanmar (1996)
P hilippines (1995)Figure 4
Share ofpublicemploymentin totalemployment in25 developingcountries1
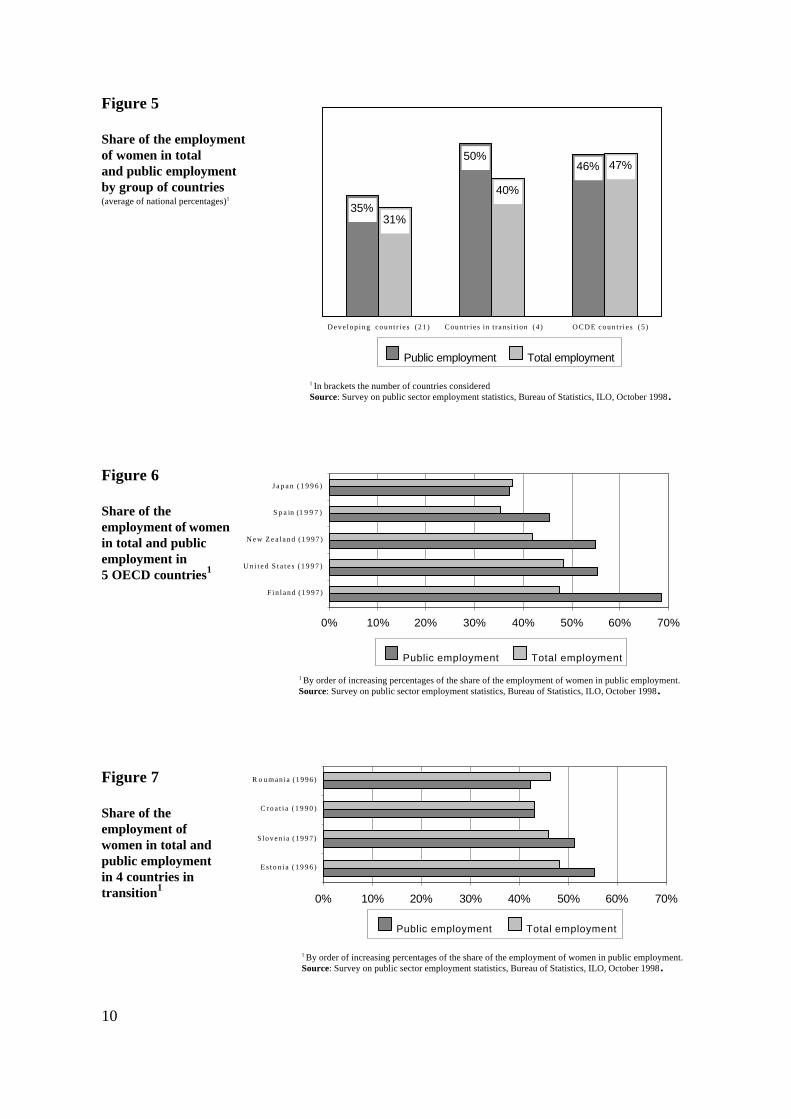
Employment of women in the public sector
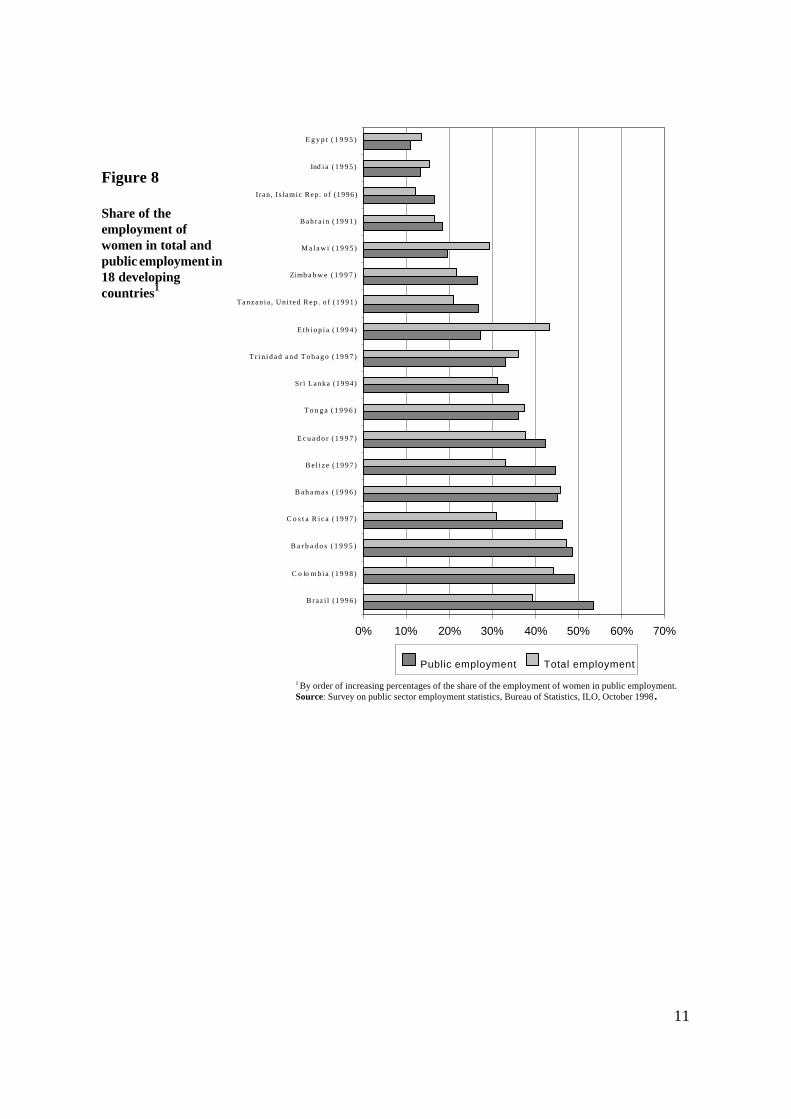
Figure 5 shows that in the case of most of the countries for which figures are availablethe share of employment of women in public sector employment is higher than in totalemployment. It is also observed that there are relatively less women employed in the publicsector in developing countries (35%) than in OECD countries (50%) or countries in transition(46%).
1 By order of increasing percentages of the share of public employment in total employment.Source: Survey on public sector employment statistics, Bureau of Statistics, ILO, October 1998.
10
50%46%
31%
40%
47%
35%
Developing count r ies (21) Countr ies in t ransi t ion (4) OCDE count r ies (5)
Public employment Total employment
0% 10% 20% 30% 40% 50% 60% 70%
Fin land (1997)
U n i t e d S t a t e s ( 1 9 9 7 )
New Zea land (1997)
S p a in (1 9 9 7 )
J a p a n ( 1 9 9 6 )
Public employment Total employment
0% 10% 20% 30% 40% 50% 60% 70%
Es ton i a (1996 )
Slovenia (1997)
C r o a t i a ( 1 9 9 0 )
R o umania (1996)
Public employment Total employment
Figure 5
Share of the employmentof women in totaland public employmentby group of countries(average of national percentages)1
Figure 6
Share of theemployment of womenin total and publicemployment in5 OECD countries1
Figure 7
Share of theemployment ofwomen in total andpublic employmentin 4 countries intransition1
1 In brackets the number of countries considered Source: Survey on public sector employment statistics, Bureau of Statistics, ILO, October 1998.
1 By order of increasing percentages of the share of the employment of women in public employment.Source: Survey on public sector employment statistics, Bureau of Statistics, ILO, October 1998.
1 By order of increasing percentages of the share of the employment of women in public employment.Source: Survey on public sector employment statistics, Bureau of Statistics, ILO, October 1998.
11
0% 10% 20% 30% 40% 50% 60% 70%
Braz i l (1996)
C o lo m b i a ( 1 9 9 8 )
B a r b a d o s ( 1 9 9 5 )
C o s t a R ica (1997)
B a h a m a s ( 1 9 9 6 )
Be l i ze (1997)
E c u a d o r ( 1 9 9 7 )
T o n g a ( 1 9 9 6 )
Sri Lanka (1994)
T r i n i d a d a n d T o b a g o ( 1 9 9 7 )
E th iop i a (1994 )
Tanzania , Uni ted Rep. of (1991)
Zimb a b w e ( 1 9 9 7 )
M a l a w i ( 1 9 9 5 )
Bahra in (1991)
Iran, Is lamic Rep. of (1996)
Ind i a (1995 )
E g y p t ( 1 9 9 5 )
Public employment Total employment
Figure 8
Share of theemployment ofwomen in total andpublic employment in18 developingcountries1
1 By order of increasing percentages of the share of the employment of women in public employment.Source: Survey on public sector employment statistics, Bureau of Statistics, ILO, October 1998.
12
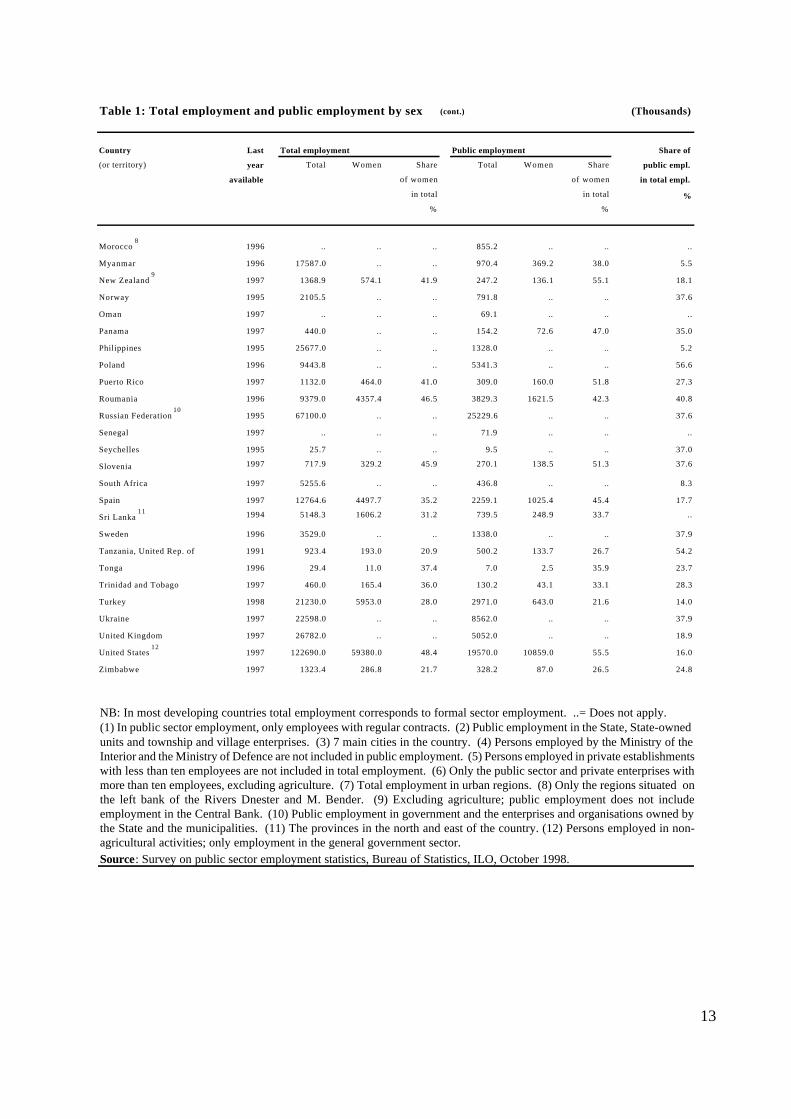
Table 1: Total employment and public employment by sex (Thousands)
Country Last Total employment Public employment Share of
(or territory) year Total Women Share Total Women Share public empl.
available of women of women in total empl.
in total in total %
% %
Albania 1995 1137.9 .. .. 275.9 105.3 38.2 24.2
Australia 1998 6800.4 .. .. 1433.7 .. .. 21.1
Azerbaijan 1995 2837.3 .. .. 1622.9 733.6 45.2 57.2
Bahamas 1996 129.8 59.4 45.8 23.9 10.8 45.1 18.4
Bahrain 1991 212.1 34.9 16.5 60.0 11.1 18.4 28.3
Barbados 1995 110.0 52.0 47.3 22.9 11.1 48.5 20.8
Belarus 1997 4369.9 .. .. 2536.3 .. .. 58.0
Belize 1997 45.6 15.1 33.2 9.9 4.4 44.6 21.6
Botswana 1
1995 233.5 .. .. 99.4 39.6 39.9 42.6
Brazil 1996 68040.2 26715.4 39.3 7839.9 4201.1 53.6 11.5
Burkina Faso 1997 .. .. .. 49.2 11.4 23.1 ..
Canada 1997 13940.6 .. .. 2797.8 .. .. 20.1
Cayman Islands 1996 19.4 .. .. 2.3 .. .. 12.0
China 2
1996 688500.0 .. .. 247520.0 .. .. 36.0
Colombia 3
1998 5816.8 2573.7 44.2 487.3 239.3 49.1 8.4
Costa Rica 1997 1227.3 378.1 30.8 174.9 81.2 46.4 14.2
Croatia 4
1990 1571.7 677.9 43.1 1509.6 651.4 43.2 96.1
Cyprus 1995 285.1 .. .. 47.0 .. .. 16.5
Czech Republic 1997 4993.3 .. .. 1167.8 .. .. 23.4
Denmark 1997 3578.0 .. .. 938.3 600.1 64.0 26.2
Dominican Republic 1998 .. .. .. 287.7 117.1 40.7 ..
Ecuador 1997 3062.2 1152.6 37.6 422.7 178.6 42.3 13.8
Egypt 5
1995 1726.1 233.0 13.5 1206.8 130.1 10.8 69.9
Estonia 1996 645.6 310.2 48.0 238.3 131.6 55.2 36.9
Ethiopia 1994 25883.2 11171.9 43.2 711.6 194.4 27.3 2.7
Fiji 1996 110.1 .. .. 44.9 10.6 23.6 40.8
Finland 1997 2170.0 1029.0 47.4 618.0 423.0 68.4 28.5
Gambia 1998 .. .. .. 17.3 3.5 20.3 ..
Germany 1997 33962.0 .. .. 6517.0 .. .. 19.2
Guatemala 1996 852.2 .. .. 127.0 .. .. 14.9
Hungary 1997 2194.6 .. .. 967.9 .. .. 44.1
India 6
1995 27987.0 4304.1 15.4 19689.0 2616.3 13.3 70.4
Iran, Islamic Rep. of 1996 14571.6 1765.4 12.1 4258.0 698.3 16.4 29.2
Ireland 1996 1297.0 .. .. 297.0 .. .. 22.9
Isle of Man 1996 33.6 14.9 44.4 7.7 4.0 51.1 23.1
Japan 1996 67781.3 25739.7 38.0 5198.2 1932.7 37.2 7.7
Jordan 1996 .. .. .. .. .. .. 35.8
Kazakstan 1997 12080.1 .. .. 5607.8 .. .. 46.4
Kenya 1996 1622.3 .. .. 689.8 .. .. 42.5
Latvia 1997 1046.0 .. .. 357.0 .. .. 34.1
Libyan Arab Jamahiriya 1995 1025.1 .. .. 678.5 166.0 24.5 66.2
Malawi 1995 700.6 203.9 29.1 104.1 20.4 19.6 14.9
Malaysia 1998 .. .. .. 664.1 268.0 40.4 ..
Malta 1998 132.4 36.5 27.6 49.8 12.4 24.8 37.6
Mexico 1996 28281.8 .. .. 4626.5 .. .. 16.4
Moldova, Rep. of 7
1997 1646.0 .. .. 446.0 .. .. 27.1
13
Table 1: Total employment and public employment by sex (cont.) (Thousands)
Country Last Total employment Public employment Share of
(or territory) year Total Women Share Total Women Share public empl.
available of women of women in total empl.
in total in total %
% %
Morocco 8
1996 .. .. .. 855.2 .. .. ..
Myanmar 1996 17587.0 .. .. 970.4 369.2 38.0 5.5
New Zealand 9
1997 1368.9 574.1 41.9 247.2 136.1 55.1 18.1
Norway 1995 2105.5 .. .. 791.8 .. .. 37.6
Oman 1997 .. .. .. 69.1 .. .. ..
Panama 1997 440.0 .. .. 154.2 72.6 47.0 35.0
Philippines 1995 25677.0 .. .. 1328.0 .. .. 5.2
Poland 1996 9443.8 .. .. 5341.3 .. .. 56.6
Puerto Rico 1997 1132.0 464.0 41.0 309.0 160.0 51.8 27.3
Roumania 1996 9379.0 4357.4 46.5 3829.3 1621.5 42.3 40.8
Russian Federation 10
1995 67100.0 .. .. 25229.6 .. .. 37.6
Senegal 1997 .. .. .. 71.9 .. .. ..
Seychelles 1995 25.7 .. .. 9.5 .. .. 37.0
Slovenia 1997 717.9 329.2 45.9 270.1 138.5 51.3 37.6
South Africa 1997 5255.6 .. .. 436.8 .. .. 8.3
Spain 1997 12764.6 4497.7 35.2 2259.1 1025.4 45.4 17.7
Sri Lanka 11 1994 5148.3 1606.2 31.2 739.5 248.9 33.7 ..
Sweden 1996 3529.0 .. .. 1338.0 .. .. 37.9
Tanzania, United Rep. of 1991 923.4 193.0 20.9 500.2 133.7 26.7 54.2
Tonga 1996 29.4 11.0 37.4 7.0 2.5 35.9 23.7
Trinidad and Tobago 1997 460.0 165.4 36.0 130.2 43.1 33.1 28.3
Turkey 1998 21230.0 5953.0 28.0 2971.0 643.0 21.6 14.0
Ukraine 1997 22598.0 .. .. 8562.0 .. .. 37.9
United Kingdom 1997 26782.0 .. .. 5052.0 .. .. 18.9
United States 12
1997 122690.0 59380.0 48.4 19570.0 10859.0 55.5 16.0
Zimbabwe 1997 1323.4 286.8 21.7 328.2 87.0 26.5 24.8
NB: In most developing countries total employment corresponds to formal sector employment. ..= Does not apply.(1) In public sector employment, only employees with regular contracts. (2) Public employment in the State, State-ownedunits and township and village enterprises. (3) 7 main cities in the country. (4) Persons employed by the Ministry of theInterior and the Ministry of Defence are not included in public employment. (5) Persons employed in private establishmentswith less than ten employees are not included in total employment. (6) Only the public sector and private enterprises withmore than ten employees, excluding agriculture. (7) Total employment in urban regions. (8) Only the regions situated onthe left bank of the Rivers Dnester and M. Bender. (9) Excluding agriculture; public employment does not includeemployment in the Central Bank. (10) Public employment in government and the enterprises and organisations owned bythe State and the municipalities. (11) The provinces in the north and east of the country. (12) Persons employed in non-agricultural activities; only employment in the general government sector.Source: Survey on public sector employment statistics, Bureau of Statistics, ILO, October 1998.

14
0% 100%
Zimbabw e (1997)
United States (1997)
Spain (1997)
Norw ay (1995)
New Zealand (1997)
Mexico (1996)
Malaysia (1998)
Malaw i (1995)
Japan (1996)
Ireland (1996)
Indonesia (1997)
Hungary (1997)
Finland (1997)
Fiji (1996)
Denmark (1997)
Cyprus (1995)
Costa Rica (1997)
Canada (1997)
Brazil (1996)
Botsw ana (1995)
A lbania (1997)
Central State( or regional) Loca l
Public employment by type of institution and level of government
The figure below gives a panorama of the distribution of public employment by levelof government. The data is presented in Table 2 "Public employment by type of institutionand level of government", page 15.
As can be seen, the distribution of responsibilities and of the conducting of activitiesover the various levels depends more on the social and political context than on the size of thecountry or the level of economic development.
Figure 9
Contributionexpressed aspercentages of thelevels ofgovernmentto employment inthe generalgovernment sectorin 21 countries1
1 By alphabetical order of countries.Source: Survey on public sector employment statistics, Bureau of Statistics, ILO, October 1998.

15
Table 2: Public employment by type of institution and level of government Total(Thousands)
Country Last Level General government sector Public Public(or territory) year of Govern. social No Profit Total Corporation sector
available admin. units security institut. Number % sector Numbre %
funds Number %
Albania 1997
Central 1.9 0.1 12.7 14.7 10.1 .. .. .. ..
Local 6.9 1.0 122.8 130.6 89.9 .. .. .. ..
Total 8.7 1.1 135.5 145.3 100.0 81.0 100.0 226.3 100.0
Azerbaijan 1995
Total 1220.1 11.3 67.9 1299.3 100.0 323.6 100.0 1622.9 100.0
Bangladesh 1993
Total .. .. .. 971.0 100.0 .. .. .. ..
Belarus 1997
Total .. .. .. 1130.4 100.0 1405.9 100.0 2536.3 100.0
Belize 1997
Total .. .. .. 5.9 100.0 4.0 100.0 9.9 100.0
Botswana 1 1995
Central .. .. .. 70.1 81.2 13.2 100.0 83.3 83.7
Local 16.2 18.8 .. .. 16.2 16.3
Total .. .. .. 86.2 100.0 13.2 100.0 99.4 100.0
Brazil 1996
Central 913.9 62.8 .. 976.8 15.7 491.6 30.7 1468.3 18.7
State (regional) 2705.3 21.9 .. 2727.2 43.7 658.0 41.1 3385.2 43.2
Local 2518.5 15.2 .. 2533.8 40.6 452.6 28.2 2986.4 38.1
Total 61137.7 99.9 .. 6237.7 100.0 1602.2 100.0 7839.9 100.0
Canada 1997
Central 338.0 .. .. 338.0 13.3 92.3 35.5 430.3 15.4
State (regional) 342.0 .. 972.8 1314.8 51.8 119.7 46.0 1434.5 51.3
Local 343.8 .. 541.1 884.9 34.9 48.1 18.5 933.0 33.3
Total 1023.8 .. 1513.9 2537.7 100.0 260.1 100.0 2797.8 100.0
Cayman Islands 1996
Central 2.1 .. .. 2.1 100.0 0.2 100.0 2.3 100.0
Total 2.1 .. .. 2.1 100.0 0.2 100.0 2.3 100.0Costa Rica
21997
Central 85.6 28.7 79.4 193.7 95.2 .. .. 193.7 95.2
Local 9.9 9.9 4.8 .. .. 9.9 4.8
Total 95.4 28.7 79.4 203.6 100.0 .. .. 203.6 100.0
Cyprus 1995
Central .. .. .. 35.2 92.3 .. .. .. ..
Local .. .. .. 3.0 7.7 .. .. .. ..
Total .. .. .. 38.1 100.0 8.4 100.0 47.0 100.0
Czech Republic 1997
Total 741.3 7.3 748.6 100.0 419.2 100.0 1167.8 100.0
Denmark 1997
Central .. .. .. 262.6 19.0 .. .. .. ..
State (regional) .. .. .. 323.9 23.4 .. .. .. ..
Local .. .. .. 798.0 57.6 .. .. .. ..
Total .. .. .. 1384.5 100.0 116.1 100.0 938.3 100.0
Estonia 1996
Total .. .. .. 154.5 100.0 83.8 100.0 238.3 100.0
Fiji 1996
Central 30.3 .. .. 30.3 97.7 13.9 95.1 44.2 98.4
Local 0.7 .. .. 0.7 2.3 0.7 4.9 0.7 1.6
Total 31.0 .. .. 31.0 100.0 14.6 100.0 44.9 100.0
Finland 1997
Central 71.0 1.0 32.0 104.0 19.9 80.0 40.8 144.0 23.2
Local 35.0 259.0 124.0 418.0 80.1 116.0 59.2 476.0 76.8
Total 106.0 260.0 156.0 522.0 100.0 196.0 100.0 620.0 100.0

16
Table 2: Public employment by type of institution and level of government (cont.) Total(Thousands)
Country Last Level General government sector Public Public(or territory) year of Govern. social No Profit Total Corporation sector
available admin. units security institut. Number % sector Numbre %
funds Number %
Germany 1997
Total .. .. .. 5210.0 100.0 1307.0 100.0 6517.0 100.0
Hungary 1997
Central 255.8 10.9 .. 266.7 35.2 .. .. .. ..
Local 491.3 .. 491.3 64.8 .. .. .. ..
Total 747.1 10.9 .. 758.0 100.0 209.9 100.0 967.9 100.0
Indonesia 1997
Central 3588.7 .. .. 3588.7 87.7 .. .. .. ..
Local 505.6 .. .. 505.6 12.3 .. .. .. ..
Total 4094.3 .. .. 4094.3 100.0 .. .. .. ..
Ireland 1996
Central .. .. .. 196.6 86.7 54.0 100.0 250.6 89.2
Local .. .. .. 30.2 13.3 .. .. 30.2 10.8
Total .. .. .. 226.8 100.0 54.0 100.0 280.8 100.0
Japan 1996
Central .. .. .. .. .. .. .. 1290.8 24.8
State (regional) .. .. .. .. .. .. .. 1191.5 22.9
Local .. .. .. .. .. .. .. 2716.0 52.2
Total .. .. .. .. .. .. .. 5198.2 100.0
Kazakhstan 1997
Total 1903.7 .. .. 1903.7 100.0 3704.1 100.0 5607.8 100.0
Korea, Republic of 1996
Total .. .. .. 927.8 100.0 .. .. .. ..
Macau 1997
Total .. .. .. 17.6 100.0 .. .. .. ..
Malawi 3
1995Central 88.5 .. .. 88.5 85.0 49.8 100.0 138.3 89.8
Local 15.6 .. .. 15.6 15.0 .. 15.6 10.1
Total 104.1 .. .. 104.1 100.0 49.8 100.0 153.9 100.0
Malaysia 1998
Central .. .. .. .. .. .. .. 526.1 79.2
State (regional) .. .. .. .. .. .. .. 93.7 14.1
Local .. .. .. .. .. .. .. 44.2 6.7
Total .. .. .. .. .. .. .. 664.1 100.0
Malta 1998
Total 31.4 0.7 .. 32.1 100.0 17.7 100.0 49.8 100.0
Mexico 1996
Central 1419.4 433.1 .. 1852.5 45.1 517.4 100.0 2370.0 51.2
State (regional) 2005.6 .. .. 2005.6 48.8 .. .. 2005.6 43.3
Local 251.0 .. .. 251.0 6.1 .. .. 251.0 5.4
Total 3676.0 433.1 .. 4109.1 100.0 517.4 100.0 4626.6 100.0
Moldova, Rep. of 4
1997Total 25.0 .. 23.0 48.0 100.0 398.0 100.0 446.0 100.0
New Zealand 5
1997
Central 190.0 2.0 .. 192.0 90.7 19.1 55.2 211.1 85.7
State (regional) 2.5 .. .. 2.5 1.2 .. .. 2.5 1.0
Local 17.2 .. .. 17.2 8.1 15.5 44.8 32.7 13.3
Total 209.7 2.0 .. 211.7 100.0 34.6 100.0 246.3 100.0
Norway 1995
Central .. .. .. 149.9 23.1 116.0 81.7 266.4 33.6
Local .. .. .. 500.0 76.9 25.0 17.6 525.4 66.4
Total .. .. .. 649.9 100.0 142.0 100.0 791.8 100.0
Oman 1997
Total .. .. .. 96.6 100.0 7.0 100.0 69.1 100.0
Panama 1997
Total 92.9 .. .. 92.9 100.0 61.3 100.0 154.2 100.0

17
Table 2: Public employment by type of institution and level of government (cont.) Total(Thousands)
Country Last Level General government sector Public Public(or territory) year of Govern. social No Profit Total Corporation sector
available admin. units security institut. Number % sector Numbre %
funds Number %
Philippines 1995
Total .. .. .. 1208.0 100.0 120.0 100.0 1328.0 100.0
Poland 1996
Total 290.3 41.5 2099.0 2430.8 100.0 2910.5 100.0 5341.3 100.0
Roumania 1996
Total .. .. .. 125.1 100.0 3704.2 100.0 3829.3 100.0
Russian Federation 6 1997
Total 1045.4 137.7 1350.2 2533.3 100.0 23361.5 100.0 25894.8 100.0
Senegal 1997
Central 66.3 .. .. 66.3 100.0 5.5 100.0 71.9 100.0
Total 66.3 .. .. 66.3 100.0 5.5 100.0 71.9 100.0
Singapore 1997
Total .. .. .. 97.5 100.0 .. .. .. ..
Slovenia 1997
Total .. .. .. 121.5 100.0 148.7 100.0 270.1 100.0
Spain 1997
Central 615.8 372.6 .. 988.4 49.8 .. .. 988.4 43.8
State (regional) 578.3 .. .. 578.3 29.1 .. .. 578.3 25.6
Local 418.5 .. .. 418.5 21.1 .. .. 418.5 18.5
Total 1612.6 372.6 .. 1985.2 100.0 270.1 100.0 2259.1 100.0
Syrian Arab Republic 1995
Total .. .. .. 760.8 100.0 .. .. .. ..
Tanzania, United Rep. of 1991
Central 319.5 .. .. 319.5 100.0 180.8 100.0 500.2 100.0
Total 319.5 .. .. 319.5 100.0 180.8 100.0 500.2 100.0
Tonga 1996
Total 5.3 .. .. 5.3 100.0 1.7 100.0 7.0 100.0
Trinidad and Tobago 1997
Total .. .. .. 105.1 100.0 25.1 100.0 130.2 100.0United States 7 1997
Central .. .. .. .. .. .. .. 2699 13.8
State (regional) .. .. .. .. .. .. .. 4594 23.5
Local .. .. .. .. .. .. .. 12276 62.7
Total .. .. .. .. .. .. .. 19570 100.0
Zimbabwe 1997
Central .. .. .. 249.0 88.7 43.1 90.0 .. ..
Local .. .. .. 31.6 11.3 4.5 9.4 .. ..
Total .. .. .. 280.6 100.0 47.9 100.0 328.2 100.0
NB: In most developing countries total employment corresponds to formal sector employment. .. = Does not apply.(1) In public sector employment, only employees with regular contracts. (2) Employment in “non-profit” institutionscorresponds to employment in autonomous and semi-autonomous institutions. (3) Employment in social security funds andother non-profit institutions is included in the private sector. (4) Only the regions situated on the left bank of the Rivers Dnesterand M. Bender. (5) Excluding agriculture; public employment does not include employment in the Central Bank(6) Employment in non-profit institutions corresponds to employment in judicial institutions and public security councils. (7)Persons employed in non-agricultural activities. Source: Survey on public sector employment statistics, Bureau of Statistics, ILO, October 1998.
18
Not adequatly defined
3%
Services91%
Agriculture1%
Industry5%
0% 100%
United States (1997)
Turkey (1998)
Spain (1997)
Norway (1995)
New Zealand (1997)
Japan (1996)
Finland (1997)
Denmark (1997)
Canada (1997)
Australia (1998)
Services Industry Agriculture Not adequatly defined
Public employment by branch of activity
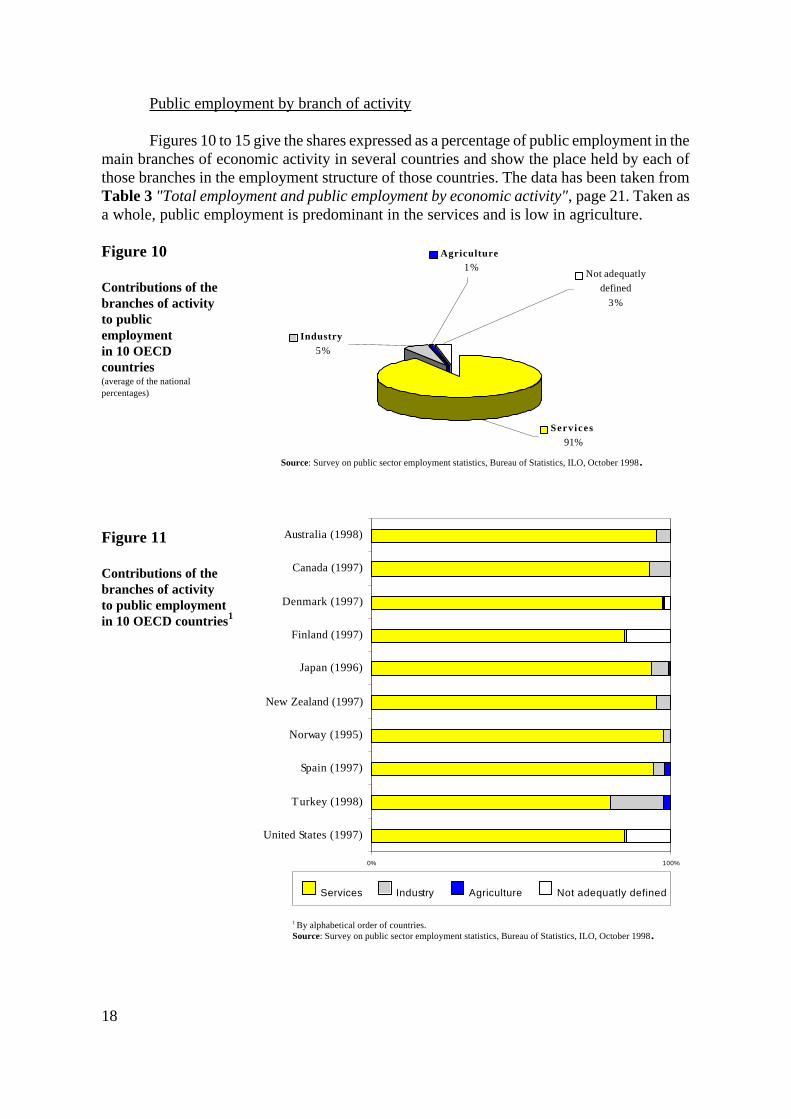
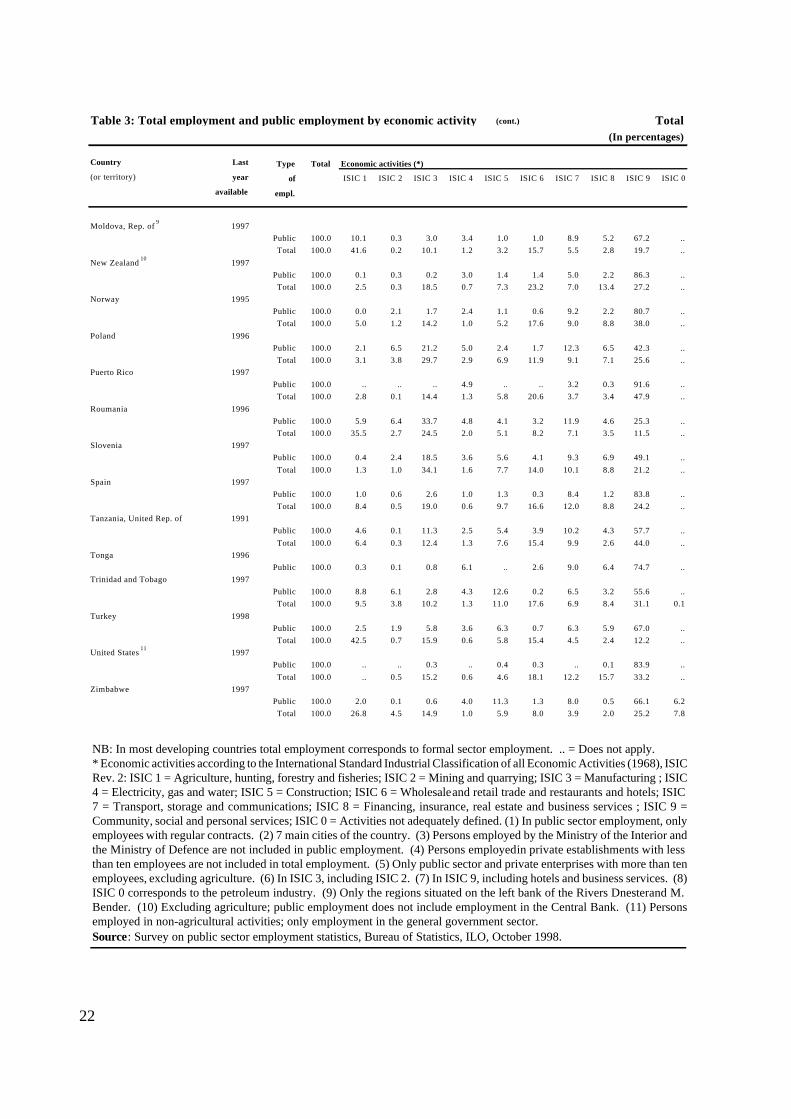
Figures 10 to 15 give the shares expressed as a percentage of public employment in themain branches of economic activity in several countries and show the place held by each ofthose branches in the employment structure of those countries. The data has been taken fromTable 3 "Total employment and public employment by economic activity", page 21. Taken asa whole, public employment is predominant in the services and is low in agriculture.
Figure 10
Contributions of thebranches of activityto publicemploymentin 10 OECDcountries(average of the nationalpercentages)
Figure 11
Contributions of thebranches of activityto public employmentin 10 OECD countries1
Source: Survey on public sector employment statistics, Bureau of Statistics, ILO, October 1998.
1 By alphabetical order of countries.Source: Survey on public sector employment statistics, Bureau of Statistics, ILO, October 1998.

19
Industry28%
Agriculture4%
S e r v i c e s65%
Not adequatly defined
3%
0% 100%
Slovenia (1997)
Roumania (1996)
Poland (1996)
Moldova, Rep. of (1997)
Estonia (1996)
Czech Republic (1997)
Croatia (1997)
Albania (1995)
Services Industry Agriculture Not adequatly defined
The structure of employment by economic sector in developed countries is marked bythe virtually total predominance of employment in the services (over 90%), the marginalnature of employment in agriculture and a modest contribution of industrial employment.
In comparison to the OECD countries, Figures 10 and 12 show that in the countries intransition the contribution of industrial employment to total public employment is larger (28%)and that the contribution of agriculture, albeit modest, is higher than that in the OECDcountries.
Figure 12
Contributions of thebranches of activityto publicemploymentin 8 countriesin transition(averages of the nationalpercentages)
Figure 13
Contributions of thebranches of activity topublic employment in 8countries in transition1
Source: Survey on public sector employment statistics, Bureau of Statistics, ILO, October 1998.
1 By alphabetical order of countries.Source: Survey on public sector employment statistics, Bureau of Statistics, ILO, October 1998.
20
Not adequatly defined
1%
Services83%
Industry12%
Agriculture4%
0% 100%
Zimbabwe (1997)
Tonga (1996)
Malawi (1995)
Kenya (1996)
Iran, Islamic Rep. of (1996)
India (1995)
Fiji (1996)
Ethiopia (1994)
Ecuador (1997)
Costa Rica (1997)
Colombia (1998)
Brazil (1996)
Botswana (1995)
Services Industry Agriculture Not adequatly defined
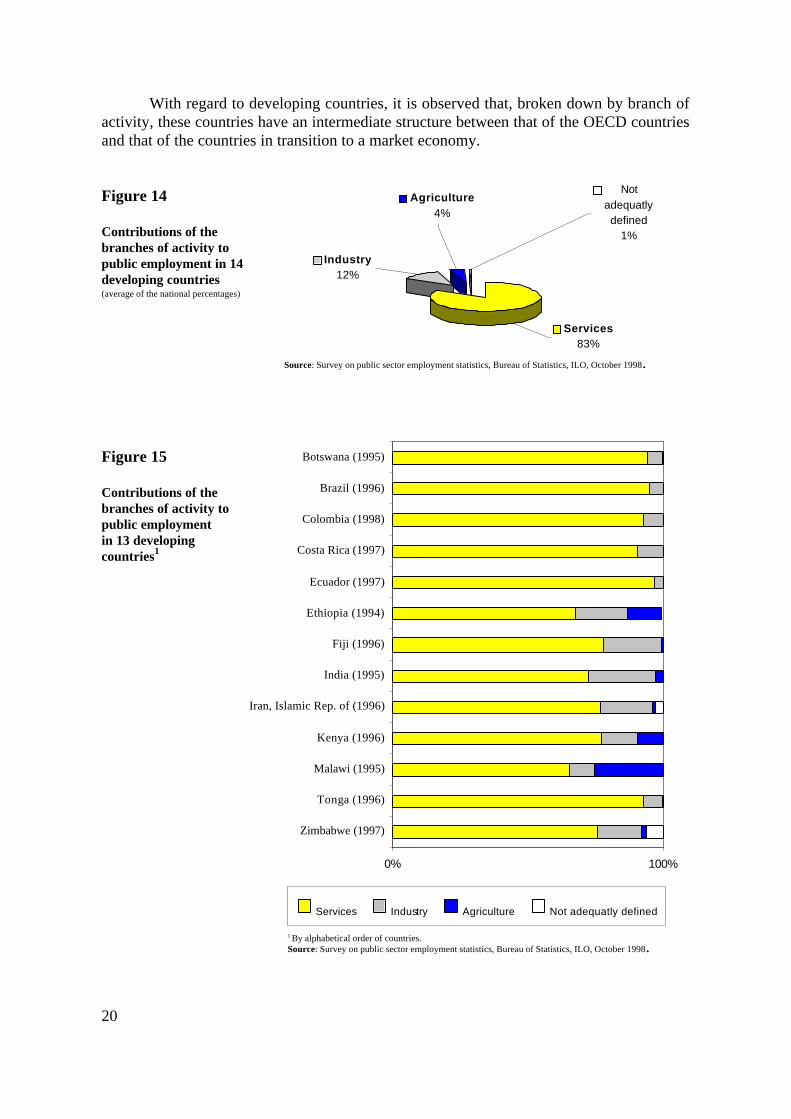
With regard to developing countries, it is observed that, broken down by branch ofactivity, these countries have an intermediate structure between that of the OECD countriesand that of the countries in transition to a market economy.
Figure 14
Contributions of thebranches of activity topublic employment in 14developing countries(average of the national percentages)
Figure 15
Contributions of thebranches of activity topublic employment in 13 developingcountries1
Source: Survey on public sector employment statistics, Bureau of Statistics, ILO, October 1998.
1 By alphabetical order of countries.Source: Survey on public sector employment statistics, Bureau of Statistics, ILO, October 1998.

21
Table 3: Total employment and public employment by economic activity Total(In percentages)
Country Last Type Total Economic activities (*)
(or territory) year of ISIC 1 ISIC 2 ISIC 3 ISIC 4 ISIC 5 ISIC 6 ISIC 7 ISIC 8 ISIC 9 ISIC 0
available empl.
Albania 1996Public 100.0 2.5 7.2 22.0 6.2 2.8 1.7 7.5 .. 28.9 21.1
Total 100.0 70.6 1.6 5.1 0.9 1.9 5.2 3.9 .. 6.2 4.6Australia 1998
Public 100.0 0.4 .. 0.3 3.1 1.2 .. 10.8 2.3 81.5 ..Total 100.0 .. 1.2 13.7 0.8 4.9 21.4 11.3 14.8 31.8 ..
Botswana 1 1995Public 100.0 0.3 2.2 2.4 0.6 0.2 6.1 .. .. 88.2 ..
Total 100.0 5.4 10.4 1.1 9.6 19.5 11.3 4.2 .. 38.5 ..Brazil 1996
Public 100.0 0.3 0.8 3.3 0.7 0.4 3.5 5.4 85.6 ..Total 100.0 24.5 0.3 12.4 0.5 6.4 17.0 3.8 6.4 28.5 0.3
Canada 1997Public 100.0 0.4 0.0 0.1 3.6 0.8 0.6 4.5 1.7 88.2 ..
Total 100.0 3.9 1.3 15.5 1.0 5.4 23.6 6.4 12.9 30.1 ..Colombia 2 1998
Public 100.0 .. 0.6 1.1 5.1 0.7 0.2 4.5 2.6 85.1 ..Total 100.0 1.0 0.2 20.9 0.7 5.9 25.4 7.4 8.6 29.8 0.1
Costa Rica 1997Public 100.0 .. .. 1.8 6.6 1.2 2.7 8.0 79.5 0.2
Total 100.0 20.6 0.1 15.6 1.1 6.8 19.1 5.4 5.1 25.6 0.7Croatia 3 1997
Public 100.0 3.7 1.2 21.5 4.8 4.0 4.1 15.5 5.0 40.2 ..Total 100.0 2.9 0.7 24.4 2.2 5.7 12.6 10.8 5.9 19.0 15.8
Czech Republic 1997Public 100.0 1.7 1.1 10.8 2.1 0.7 0.5 19.6 3.6 60.0 ..
Total 100.0 5.6 1.6 28.7 1.7 8.7 16.0 10.1 9.6 18.0 ..Denmark 1997
Public 100.0 0.3 .. .. 1.8 0.2 0.2 7.7 2.5 87.2 ..Total 100.0 2.2 .. 19.0 0.7 5.7 17.3 6.8 10.8 37.5 ..
Ecuador 1997Public 100.0 0.1 0.7 0.5 1.5 0.5 0.2 1.4 2.4 92.8 -
Total 100.0 6.8 0.4 15.5 0.3 6.0 28.4 5.7 4.5 32.1 0.1Egypt 4 1995
Public 100.0 1.7 1.4 53.6 8.8 9.8 10.0 6.6 7.7 0.5 ..Total 100.0 1.8 1.6 56.0 6.2 7.4 11.0 5.4 7.0 3.5 ..
Estonia 1996Public 100.0 2.1 3.3 7.5 5.1 3.2 14.1 5.5 57.3 ..
Total 100.0 10.0 1.4 23.9 2.5 5.7 13.3 12.8 6.0 24.2 ..Ethiopia 1994
Public 100.0 12.2 0.4 13.0 2.7 3.3 3.0 5.8 1.8 57.0 0.7Total 100.0 89.3 0.1 1.8 0.1 0.3 2.4 2.4 0.1 2.8 0.8
Fiji 1996Public 100.0 0.8 0.2 11.7 4.2 5.0 2.3 10.3 3.2 62.3 ..
Total 100.0 1.8 2.1 22.4 1.7 5.2 18.8 8.9 6.5 32.6 ..Finland 1997
Public 100.0 1.8 .. 0.2 1.3 2.6 0.5 1.6 7.6 84.3 0.2Total 100.0 7.0 0.3 20.1 1.0 6.0 15.2 7.6 11.1 31.5 0.3
India 5
1995Public 100.0 2.8 5.1 9.1 4.9 5.9 0.8 15.7 6.9 48.7 ..
Total 100.0 5.1 4.0 23.7 3.6 4.4 1.7 11.3 5.9 40.4 ..
Iran, Islamic Rep. of 1996Public 100.0 1.3 2.3 12.3 2.9 1.5 1.7 5.0 4.2 66.2 2.6
Total 100.0 23.0 0.8 17.5 1.0 11.3 12.6 7.3 2.1 22.3 2.0Isle of Man 6 1996
Public 100.0 0.9 .. .. 4.7 4.8 .. 10.6 .. 78.9 ..Total 100.0 2.8 .. 10.6 1.4 10.0 11.0 13.7 21.2 29.3 ..
Japan 7 1996Public 100.0 0.4 0.0 0.2 0.2 0.0 0.7 8.3 0.4 87.7 2.1
Total 100.0 0.4 0.1 19.1 0.5 8.5 26.9 5.7 4.3 27.1 7.4Kenya 1996
Public 100.0 9.6 0.1 5.5 3.2 4.2 1.0 5.9 2.7 67.7 ..Total 100.0 18.7 0.3 13.0 4.9 4.9 6.4 4.9 5.0 42.0 ..
Malawi 1995Public 100.0 25.3 .. 2.7 1.5 5.0 0.7 2.8 2.2 59.8 ..
Total 100.0 53.7 0.1 14.5 0.9 6.7 4.3 3.2 4.8 11.8 ..Mexico 8 1996
Public 100.0 0.7 0.0 0.5 .. 3.1 0.3 2.7 0.7 90.2 1.8Total 100.0 22.3 0.4 11.6 10.7 0.5 18.4 5.7 2.0 28.3 ..
22
Table 3: Total employment and public employment by economic activity (cont.) Total(In percentages)
Country Last Type Total Economic activities (*)
(or territory) year of ISIC 1 ISIC 2 ISIC 3 ISIC 4 ISIC 5 ISIC 6 ISIC 7 ISIC 8 ISIC 9 ISIC 0
available empl.
Moldova, Rep. of 9 1997Public 100.0 10.1 0.3 3.0 3.4 1.0 1.0 8.9 5.2 67.2 ..Total 100.0 41.6 0.2 10.1 1.2 3.2 15.7 5.5 2.8 19.7 ..
New Zealand 10 1997Public 100.0 0.1 0.3 0.2 3.0 1.4 1.4 5.0 2.2 86.3 ..Total 100.0 2.5 0.3 18.5 0.7 7.3 23.2 7.0 13.4 27.2 ..
Norway 1995Public 100.0 0.0 2.1 1.7 2.4 1.1 0.6 9.2 2.2 80.7 ..Total 100.0 5.0 1.2 14.2 1.0 5.2 17.6 9.0 8.8 38.0 ..
Poland 1996Public 100.0 2.1 6.5 21.2 5.0 2.4 1.7 12.3 6.5 42.3 ..Total 100.0 3.1 3.8 29.7 2.9 6.9 11.9 9.1 7.1 25.6 ..
Puerto Rico 1997Public 100.0 .. .. .. 4.9 .. .. 3.2 0.3 91.6 ..Total 100.0 2.8 0.1 14.4 1.3 5.8 20.6 3.7 3.4 47.9 ..
Roumania 1996Public 100.0 5.9 6.4 33.7 4.8 4.1 3.2 11.9 4.6 25.3 ..Total 100.0 35.5 2.7 24.5 2.0 5.1 8.2 7.1 3.5 11.5 ..
Slovenia 1997Public 100.0 0.4 2.4 18.5 3.6 5.6 4.1 9.3 6.9 49.1 ..Total 100.0 1.3 1.0 34.1 1.6 7.7 14.0 10.1 8.8 21.2 ..
Spain 1997Public 100.0 1.0 0.6 2.6 1.0 1.3 0.3 8.4 1.2 83.8 ..Total 100.0 8.4 0.5 19.0 0.6 9.7 16.6 12.0 8.8 24.2 ..
Tanzania, United Rep. of 1991Public 100.0 4.6 0.1 11.3 2.5 5.4 3.9 10.2 4.3 57.7 ..Total 100.0 6.4 0.3 12.4 1.3 7.6 15.4 9.9 2.6 44.0 ..
Tonga 1996Public 100.0 0.3 0.1 0.8 6.1 .. 2.6 9.0 6.4 74.7 ..
Trinidad and Tobago 1997Public 100.0 8.8 6.1 2.8 4.3 12.6 0.2 6.5 3.2 55.6 ..Total 100.0 9.5 3.8 10.2 1.3 11.0 17.6 6.9 8.4 31.1 0.1
Turkey 1998Public 100.0 2.5 1.9 5.8 3.6 6.3 0.7 6.3 5.9 67.0 ..Total 100.0 42.5 0.7 15.9 0.6 5.8 15.4 4.5 2.4 12.2 ..
United States 11 1997Public 100.0 .. .. 0.3 .. 0.4 0.3 .. 0.1 83.9 ..Total 100.0 .. 0.5 15.2 0.6 4.6 18.1 12.2 15.7 33.2 ..
Zimbabwe 1997Public 100.0 2.0 0.1 0.6 4.0 11.3 1.3 8.0 0.5 66.1 6.2Total 100.0 26.8 4.5 14.9 1.0 5.9 8.0 3.9 2.0 25.2 7.8
NB: In most developing countries total employment corresponds to formal sector employment. .. = Does not apply.* Economic activities according to the International Standard Industrial Classification of all Economic Activities (1968), ISICRev. 2: ISIC 1 = Agriculture, hunting, forestry and fisheries; ISIC 2 = Mining and quarrying; ISIC 3 = Manufacturing ; ISIC4 = Electricity, gas and water; ISIC 5 = Construction; ISIC 6 = Wholesale and retail trade and restaurants and hotels; ISIC7 = Transport, storage and communications; ISIC 8 = Financing, insurance, real estate and business services ; ISIC 9 =Community, social and personal services; ISIC 0 = Activities not adequately defined. (1) In public sector employment, onlyemployees with regular contracts. (2) 7 main cities of the country. (3) Persons employed by the Ministry of the Interior andthe Ministry of Defence are not included in public employment. (4) Persons employed in private establishments with lessthan ten employees are not included in total employment. (5) Only public sector and private enterprises with more than tenemployees, excluding agriculture. (6) In ISIC 3, including ISIC 2. (7) In ISIC 9, including hotels and business services. (8)ISIC 0 corresponds to the petroleum industry. (9) Only the regions situated on the left bank of the Rivers Dnester and M.Bender. (10) Excluding agriculture; public employment does not include employment in the Central Bank. (11) Personsemployed in non-agricultural activities; only employment in the general government sector.Source: Survey on public sector employment statistics, Bureau of Statistics, ILO, October 1998.

23
-80% -60% -40% -20% 0% 20% 40% 60%
Spain (1997)
United States (1997)
Japan (1) (1996)
Ireland (1996)
Mexico (1996)
Canada (1997)
Finland (1997)
United Kingdom (1996)
Australia (1998)
New Zealand (1997)
Sweden (1996)
Public employment Total employment
2.2.2 Public employment trends
Changes in public employment and total employment
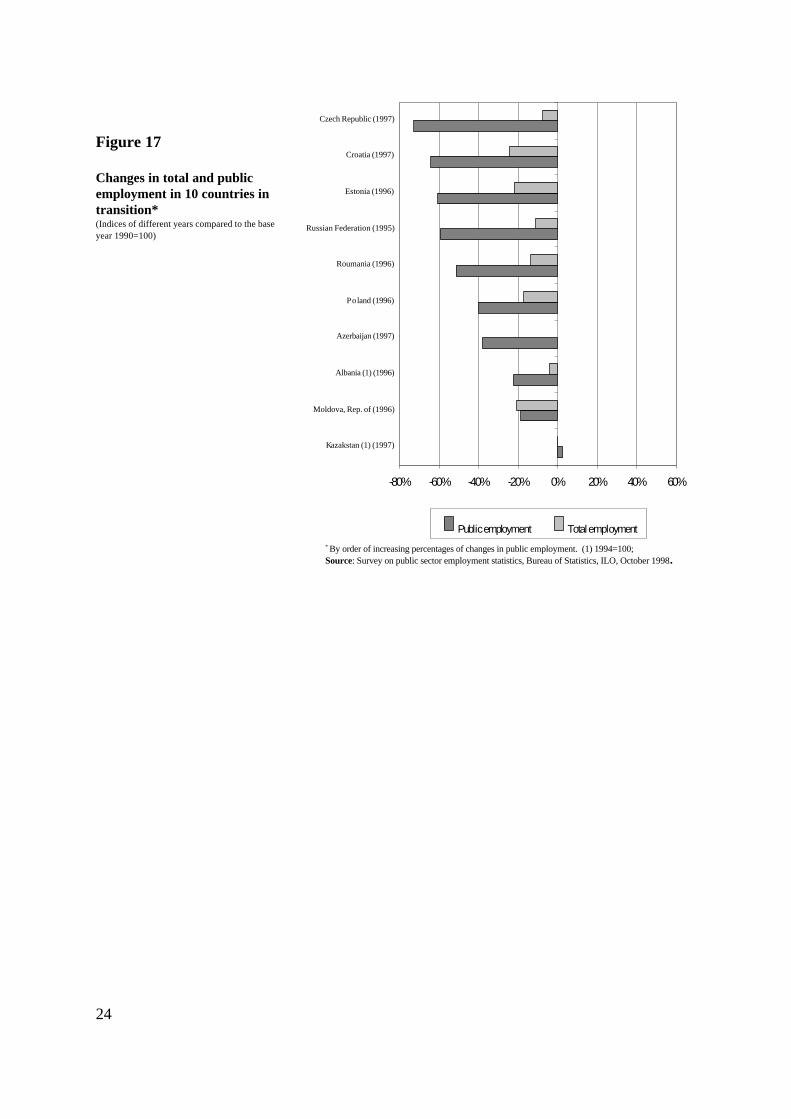
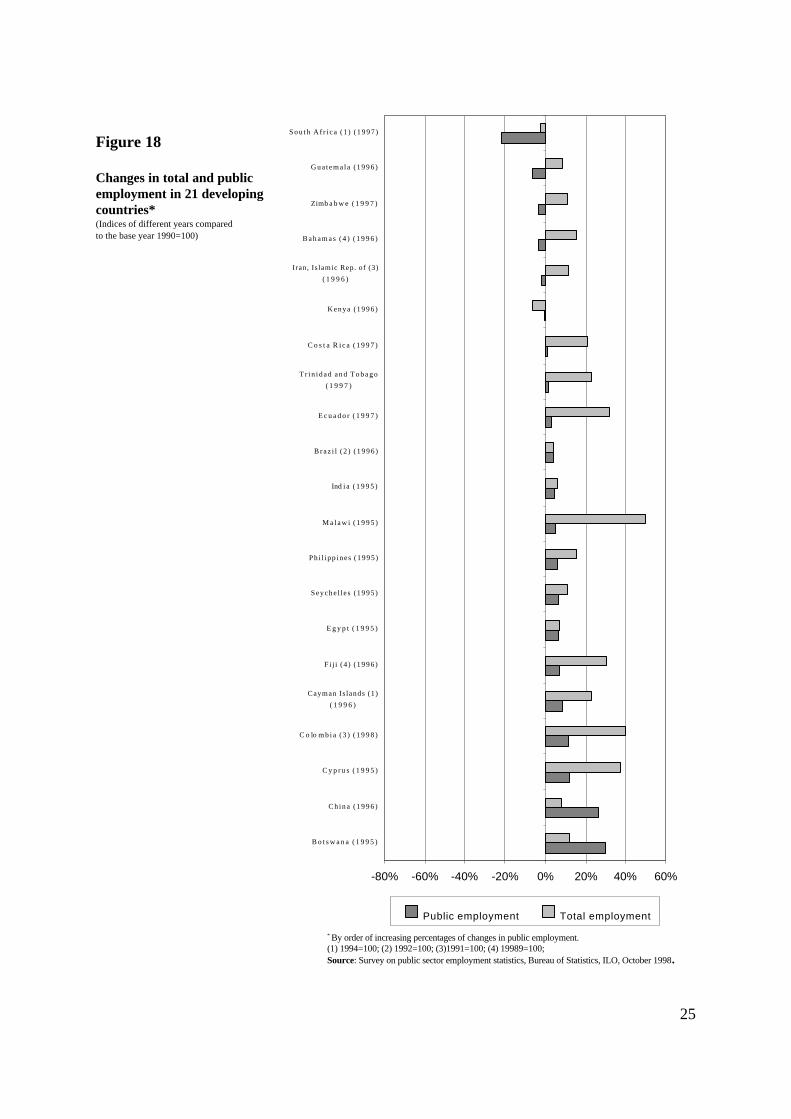
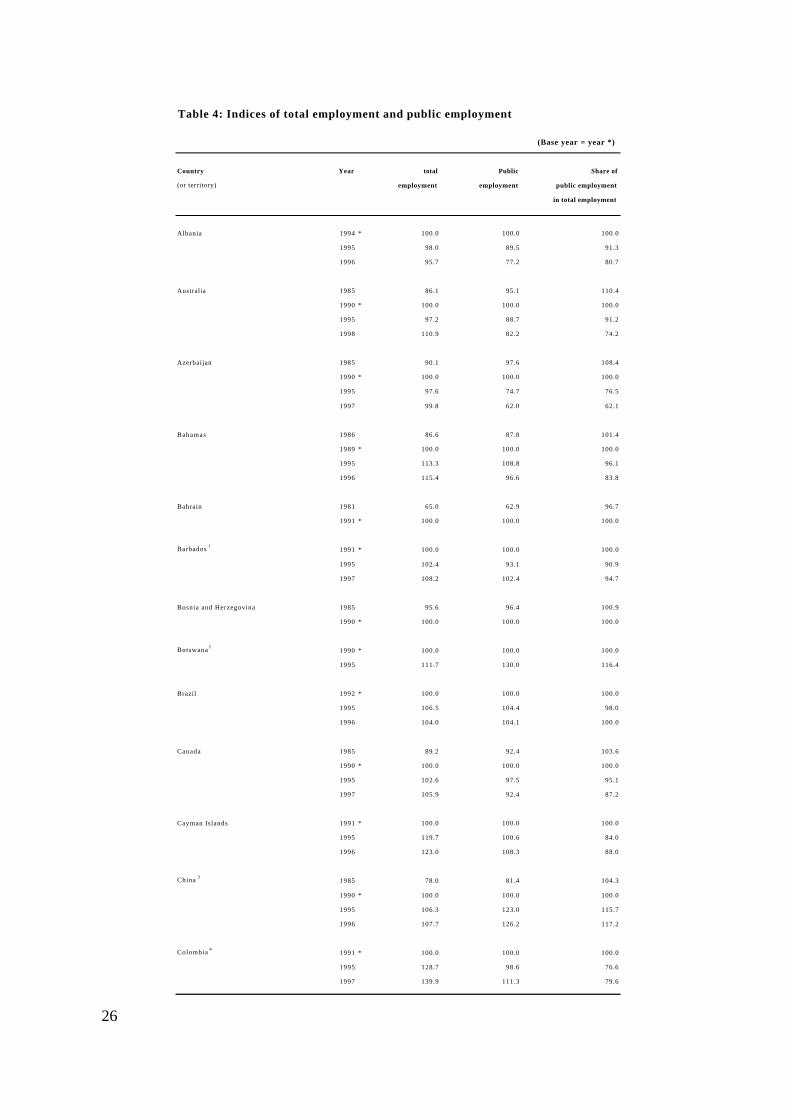
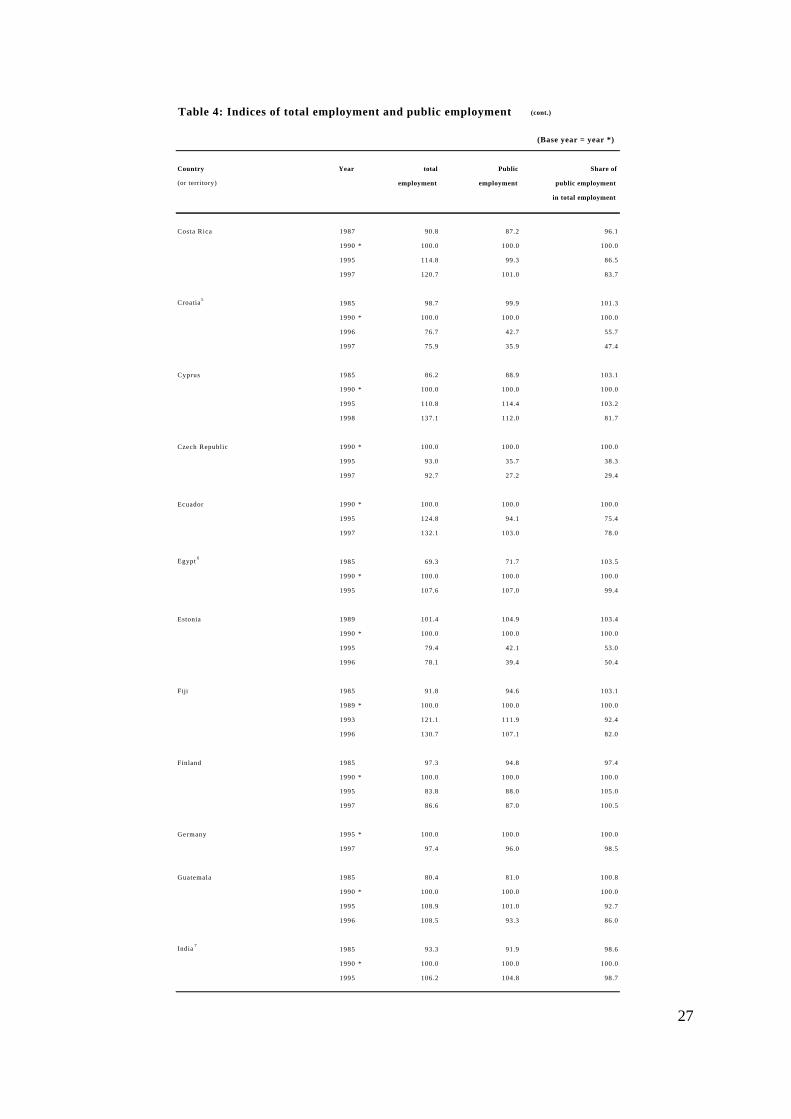
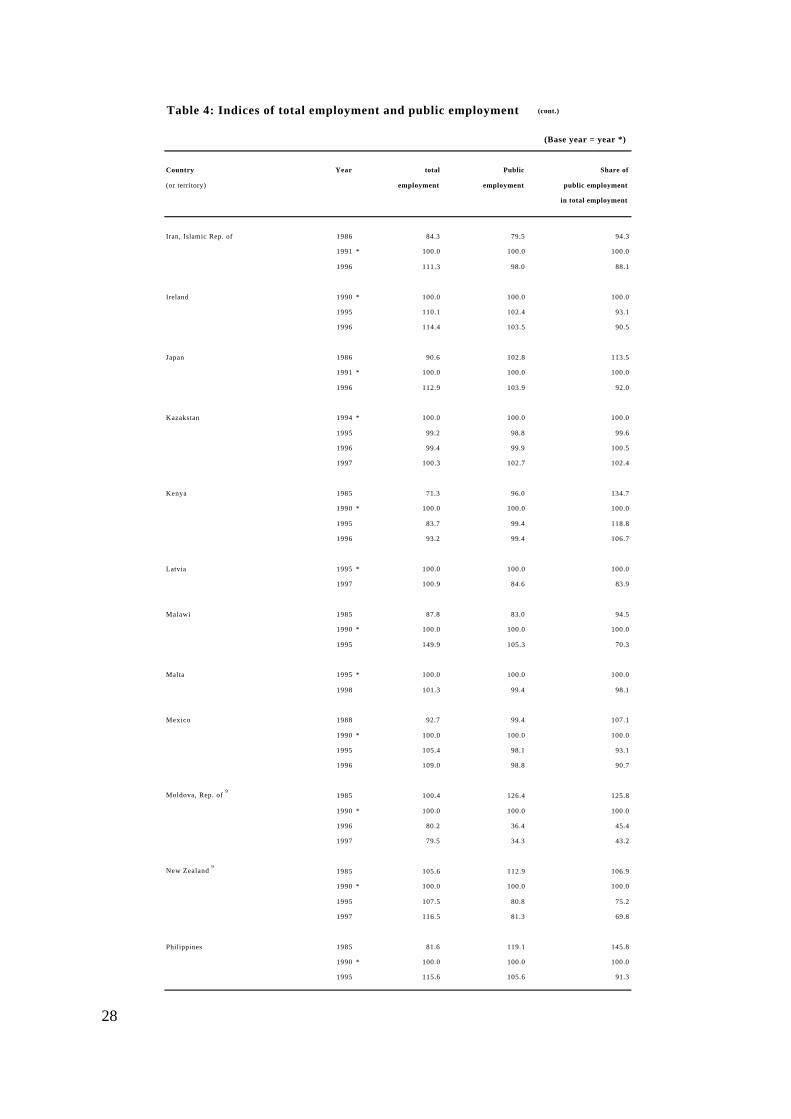
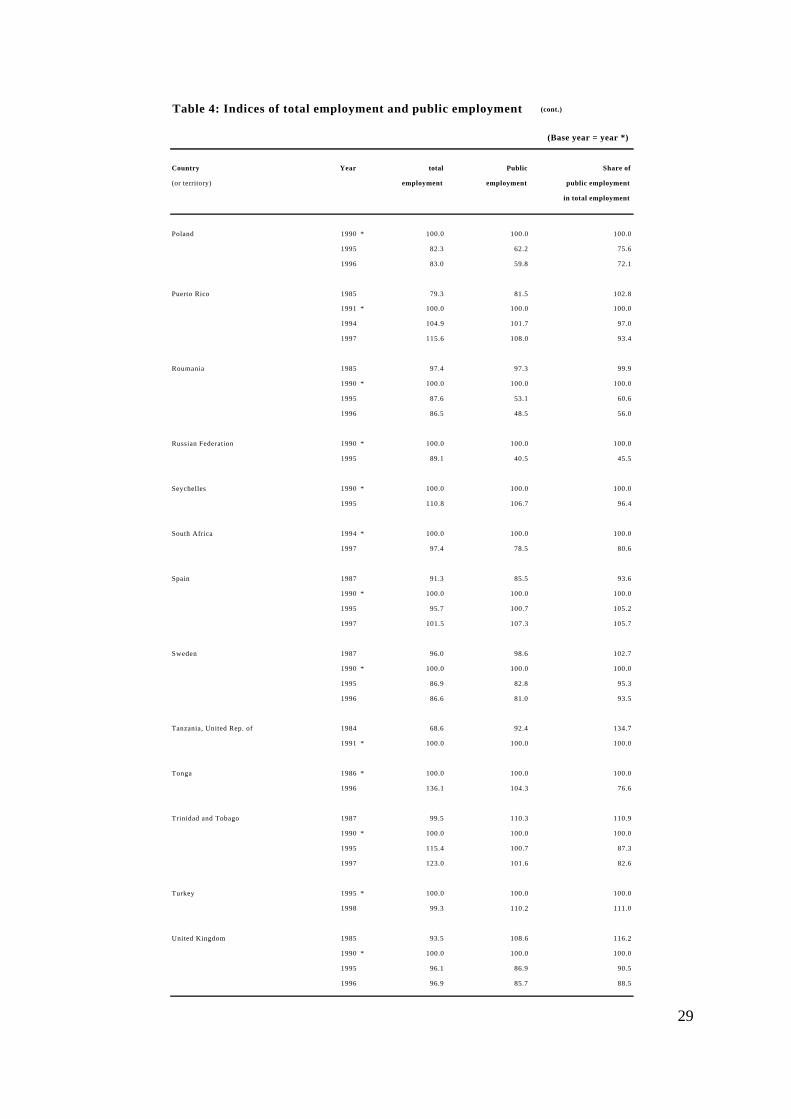
Figures 16, 17 and 18 show the changes total and public employment as indices.The index of the latest year available is compared to the 1990 base year. The data in thesecharts has been taken from Table 4 "Indices of total employment and public employment",page 26.
In general, where there has been a decrease in current total employment comparedto the 1990 level, the decrease in public sector employment has been more marked; andwhere there has been an increase in total employment the increase in public sectoremployment has been less marked. It is the countries in transition which have registered thesteepest declines in public sector employment.
Figure 16
Changes in total and publicemployment in 11 OECDcountries*(Indices of different years comparedto the base year 1990=100)
* By order of increasing percentages of changes in public employment. (1) 1991=100.Source: Survey on public sector employment statistics, Bureau of Statistics, ILO, October 1998.
24
-80% -60% -40% -20% 0% 20% 40% 60%
Kazakstan (1) (1997)
Moldova, Rep. of (1996)
Albania (1) (1996)
Azerbaijan (1997)
Poland (1996)
Roumania (1996)
Russian Federation (1995)
Estonia (1996)
Croatia (1997)
Czech Republic (1997)
Public employment Total employment
Figure 17
Changes in total and publicemployment in 10 countries intransition*(Indices of different years compared to the baseyear 1990=100)
* By order of increasing percentages of changes in public employment. (1) 1994=100;Source: Survey on public sector employment statistics, Bureau of Statistics, ILO, October 1998.
25
-80% -60% -40% -20% 0% 20% 40% 60%
B o t s w a n a ( 1 9 9 5 )
China (1996)
C y p r u s ( 1 9 9 5 )
C o lo mbia (3 ) ( 1998 )
Cayman Islands (1)
( 1 9 9 6 )
Fi j i (4) (1996)
E g y p t ( 1 9 9 5 )
Seychel les (1995)
Phi l ippines (1995)
M a l a w i ( 1 9 9 5 )
Ind i a (1995 )
Braz i l (2 ) (1996)
E c u a d o r ( 1 9 9 7 )
Tr in idad and Tobago
( 1 9 9 7 )
C o s t a R ica (1997)
Kenya (1996)
Iran, Islamic Rep. of (3)
( 1 9 9 6 )
Bahamas (4 ) ( 1996 )
Zimb a b w e ( 1 9 9 7 )
Guatemala (1996)
Sou th Af r i ca (1 ) (1997)
Public employment Total employment
Figure 18
Changes in total and publicemployment in 21 developingcountries*(Indices of different years comparedto the base year 1990=100)
* By order of increasing percentages of changes in public employment.(1) 1994=100; (2) 1992=100; (3)1991=100; (4) 19989=100;Source: Survey on public sector employment statistics, Bureau of Statistics, ILO, October 1998.
26
Table 4: Indices of total employment and public employment
(Base year = year *)
Country Year total Public Share of
(or territory) employment employment public employment
in total employment
Albania 1994 * 100.0 100.0 100.0
1995 98.0 89.5 91.3
1996 95.7 77.2 80.7
Australia 1985 86.1 95.1 110.4
1990 * 100.0 100.0 100.0
1995 97.2 88.7 91.2
1998 110.9 82.2 74.2
Azerbaijan 1985 90.1 97.6 108.4
1990 * 100.0 100.0 100.0
1995 97.6 74.7 76.5
1997 99.8 62.0 62.1
Bahamas 1986 86.6 87.8 101.4
1989 * 100.0 100.0 100.0
1995 113.3 108.8 96.1
1996 115.4 96.6 83.8
Bahrain 1981 65.0 62.9 96.7
1991 * 100.0 100.0 100.0
Barbados 1 1991 * 100.0 100.0 100.0
1995 102.4 93.1 90.9
1997 108.2 102.4 94.7
Bosnia and Herzegovina 1985 95.6 96.4 100.9
1990 * 100.0 100.0 100.0
Botswana 21990 * 100.0 100.0 100.0
1995 111.7 130.0 116.4
Brazil 1992 * 100.0 100.0 100.0
1995 106.5 104.4 98.0
1996 104.0 104.1 100.0
Canada 1985 89.2 92.4 103.6
1990 * 100.0 100.0 100.0
1995 102.6 97.5 95.1
1997 105.9 92.4 87.2
Cayman Islands 1991 * 100.0 100.0 100.0
1995 119.7 100.6 84.0
1996 123.0 108.3 88.0
China 3 1985 78.0 81.4 104.3
1990 * 100.0 100.0 100.0
1995 106.3 123.0 115.7
1996 107.7 126.2 117.2
Colombia 4 1991 * 100.0 100.0 100.0
1995 128.7 98.6 76.6
1997 139.9 111.3 79.6
27
Table 4: Indices of total employment and public employment (cont.)
(Base year = year *)
Country Year total Public Share of
(or territory) employment employment public employment
in total employment
Costa Rica 1987 90.8 87.2 96.1
1990 * 100.0 100.0 100.0
1995 114.8 99.3 86.5
1997 120.7 101.0 83.7
Croatia 51985 98.7 99.9 101.3
1990 * 100.0 100.0 100.0
1996 76.7 42.7 55.7
1997 75.9 35.9 47.4
Cyprus 1985 86.2 88.9 103.1
1990 * 100.0 100.0 100.0
1995 110.8 114.4 103.2
1998 137.1 112.0 81.7
Czech Republic 1990 * 100.0 100.0 100.0
1995 93.0 35.7 38.3
1997 92.7 27.2 29.4
Ecuador 1990 * 100.0 100.0 100.0
1995 124.8 94.1 75.4
1997 132.1 103.0 78.0
Egypt 6 1985 69.3 71.7 103.5
1990 * 100.0 100.0 100.0
1995 107.6 107.0 99.4
Estonia 1989 101.4 104.9 103.4
1990 * 100.0 100.0 100.0
1995 79.4 42.1 53.0
1996 78.1 39.4 50.4
Fiji 1985 91.8 94.6 103.1
1989 * 100.0 100.0 100.0
1993 121.1 111.9 92.4
1996 130.7 107.1 82.0
Finland 1985 97.3 94.8 97.4
1990 * 100.0 100.0 100.0
1995 83.8 88.0 105.0
1997 86.6 87.0 100.5
Germany 1995 * 100.0 100.0 100.0
1997 97.4 96.0 98.5
Guatemala 1985 80.4 81.0 100.8
1990 * 100.0 100.0 100.0
1995 108.9 101.0 92.7
1996 108.5 93.3 86.0
India 71985 93.3 91.9 98.6
1990 * 100.0 100.0 100.0
1995 106.2 104.8 98.7
28
Table 4: Indices of total employment and public employment (cont.)
(Base year = year *)
Country Year total Public Share of
(or territory) employment employment public employment
in total employment
Iran, Islamic Rep. of 1986 84.3 79.5 94.3
1991 * 100.0 100.0 100.0
1996 111.3 98.0 88.1
Ireland 1990 * 100.0 100.0 100.0
1995 110.1 102.4 93.1
1996 114.4 103.5 90.5
Japan 1986 90.6 102.8 113.5
1991 * 100.0 100.0 100.0
1996 112.9 103.9 92.0
Kazakstan 1994 * 100.0 100.0 100.0
1995 99.2 98.8 99.6
1996 99.4 99.9 100.5
1997 100.3 102.7 102.4
Kenya 1985 71.3 96.0 134.7
1990 * 100.0 100.0 100.0
1995 83.7 99.4 118.8
1996 93.2 99.4 106.7
Latvia 1995 * 100.0 100.0 100.0
1997 100.9 84.6 83.9
Malawi 1985 87.8 83.0 94.5
1990 * 100.0 100.0 100.0
1995 149.9 105.3 70.3
Malta 1995 * 100.0 100.0 100.0
1998 101.3 99.4 98.1
Mexico 1988 92.7 99.4 107.1
1990 * 100.0 100.0 100.0
1995 105.4 98.1 93.1
1996 109.0 98.8 90.7
Moldova, Rep. of 9
1985 100.4 126.4 125.8
1990 * 100.0 100.0 100.0
1996 80.2 36.4 45.4
1997 79.5 34.3 43.2
New Zealand 9
1985 105.6 112.9 106.9
1990 * 100.0 100.0 100.0
1995 107.5 80.8 75.2
1997 116.5 81.3 69.8
Philippines 1985 81.6 119.1 145.8
1990 * 100.0 100.0 100.0
1995 115.6 105.6 91.3
29
Table 4: Indices of total employment and public employment (cont.)
(Base year = year *)
Country Year total Public Share of
(or territory) employment employment public employment
in total employment
Poland 1990 * 100.0 100.0 100.0
1995 82.3 62.2 75.6
1996 83.0 59.8 72.1
Puerto Rico 1985 79.3 81.5 102.8
1991 * 100.0 100.0 100.0
1994 104.9 101.7 97.0
1997 115.6 108.0 93.4
Roumania 1985 97.4 97.3 99.9
1990 * 100.0 100.0 100.0
1995 87.6 53.1 60.6
1996 86.5 48.5 56.0
Russian Federation 1990 * 100.0 100.0 100.0
1995 89.1 40.5 45.5
Seychelles 1990 * 100.0 100.0 100.0
1995 110.8 106.7 96.4
South Africa 1994 * 100.0 100.0 100.0
1997 97.4 78.5 80.6
Spain 1987 91.3 85.5 93.6
1990 * 100.0 100.0 100.0
1995 95.7 100.7 105.2
1997 101.5 107.3 105.7
Sweden 1987 96.0 98.6 102.7
1990 * 100.0 100.0 100.0
1995 86.9 82.8 95.3
1996 86.6 81.0 93.5
Tanzania, United Rep. of 1984 68.6 92.4 134.7
1991 * 100.0 100.0 100.0
Tonga 1986 * 100.0 100.0 100.0
1996 136.1 104.3 76.6
Trinidad and Tobago 1987 99.5 110.3 110.9
1990 * 100.0 100.0 100.0
1995 115.4 100.7 87.3
1997 123.0 101.6 82.6
Turkey 1995 * 100.0 100.0 100.0
1998 99.3 110.2 111.0
United Kingdom 1985 93.5 108.6 116.2
1990 * 100.0 100.0 100.0
1995 96.1 86.9 90.5
1996 96.9 85.7 88.5

30
Table 4: Indices of total employment and public employment (cont.)
(Base year = year *)
Country Year total Public Share of
(or territory) employment employment public employment
in total employment
United States 10
1985 89.0 89.6 100.6
1990 * 100.0 100.0 100.0
1995 107.1 105.5 98.5
1997 112.1 106.9 95.3
Zimbabwe 1985 90.7 91.9 101.3
1990 * 100.0 100.0 100.0
1995 104.0 92.4 88.8
1997 111.0 96.6 87.0
NB: In most developing countries total employment corresponds to formal sector employment...= Does not apply.(1) Two public utilities have not been included in the public sector. (2) In public sectoremployment, only employees with regular contracts. (3) Public employment in the State, State-owned units and township and village enterprises. (4) 7 main cities of the country. (5) Personsemployed by the Ministry of the Interior and the Ministry of Defence are not included in publicemployment. (6) Persons employed in private establishments with less than ten employees arenot included in total employment. (7) Only the public sector and private enterprises with morethan ten employees, excluding agriculture. (8) For 1996 and 1997, only the regions situated onthe left bank of the Rivers Dnester and M. Bender. (9) Excluding agriculture; public employmentdoes not include employment in the Central Bank. (10) Persons employed in non-agriculturalactivities; only employment in the general government sector.
Source: Survey on public sector employment statistics, Bureau of Statistics, ILO, October 1998.
31
-60% -40% -20% 0% 20%
Spain (1997)
Finland (1997)
United States (1997)
Japan (1) (1996)
Mexico (1996)
Australia (1998)
New Zealand (1997)
Public employment Employment in Community services
Changes in public employment and in employment in community services
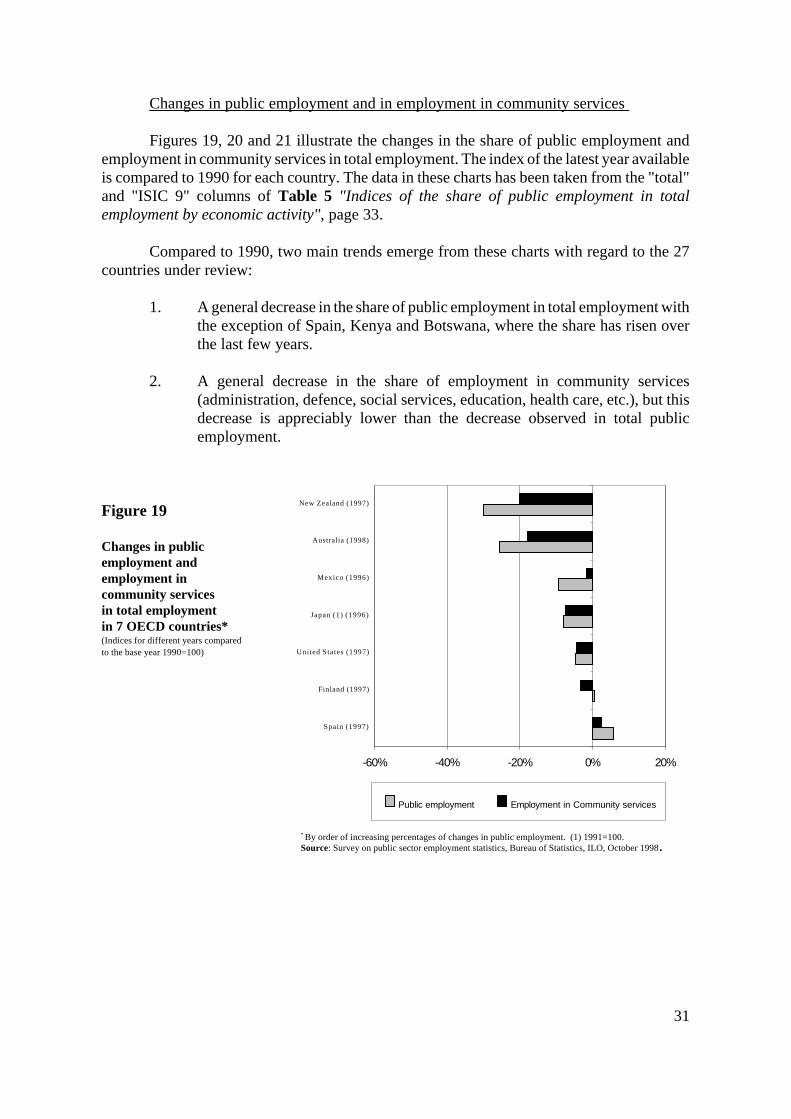
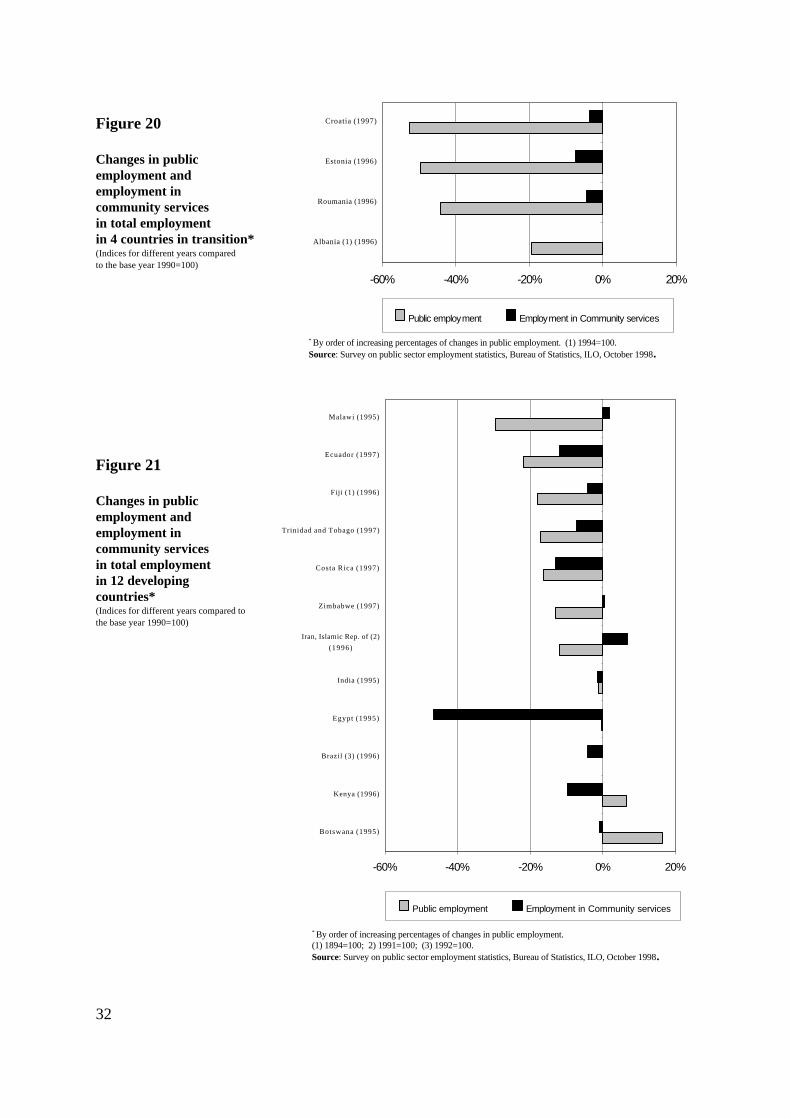
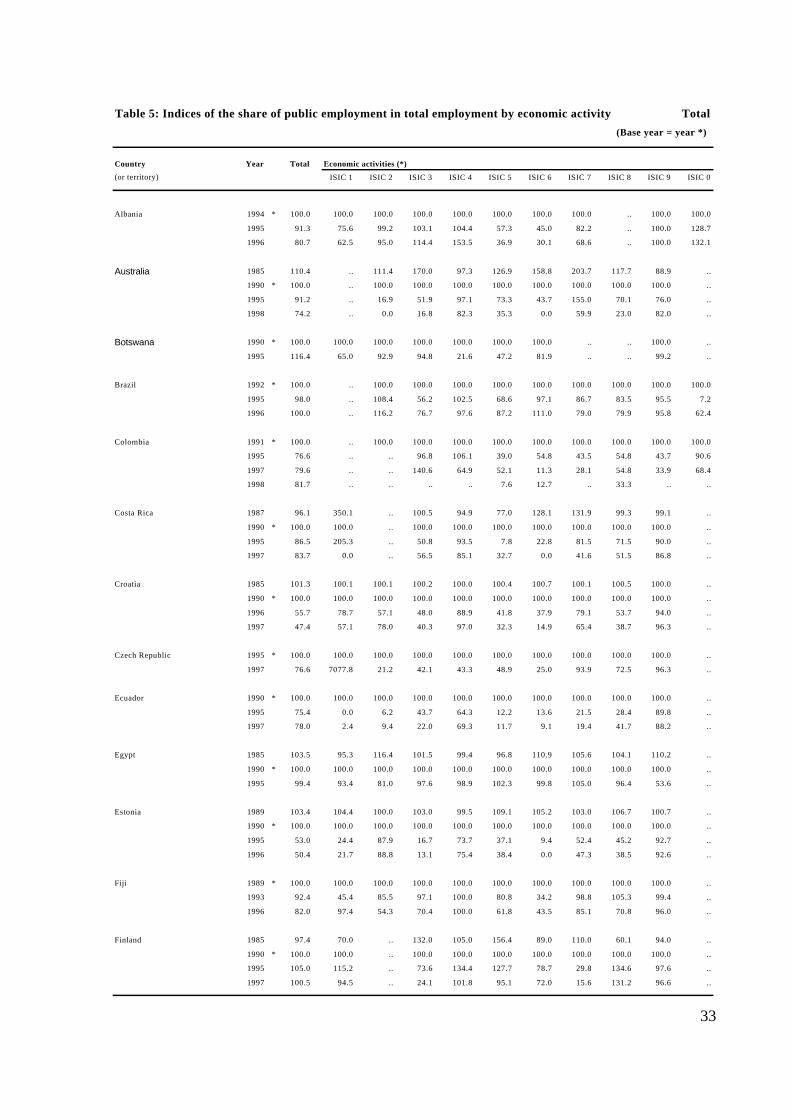
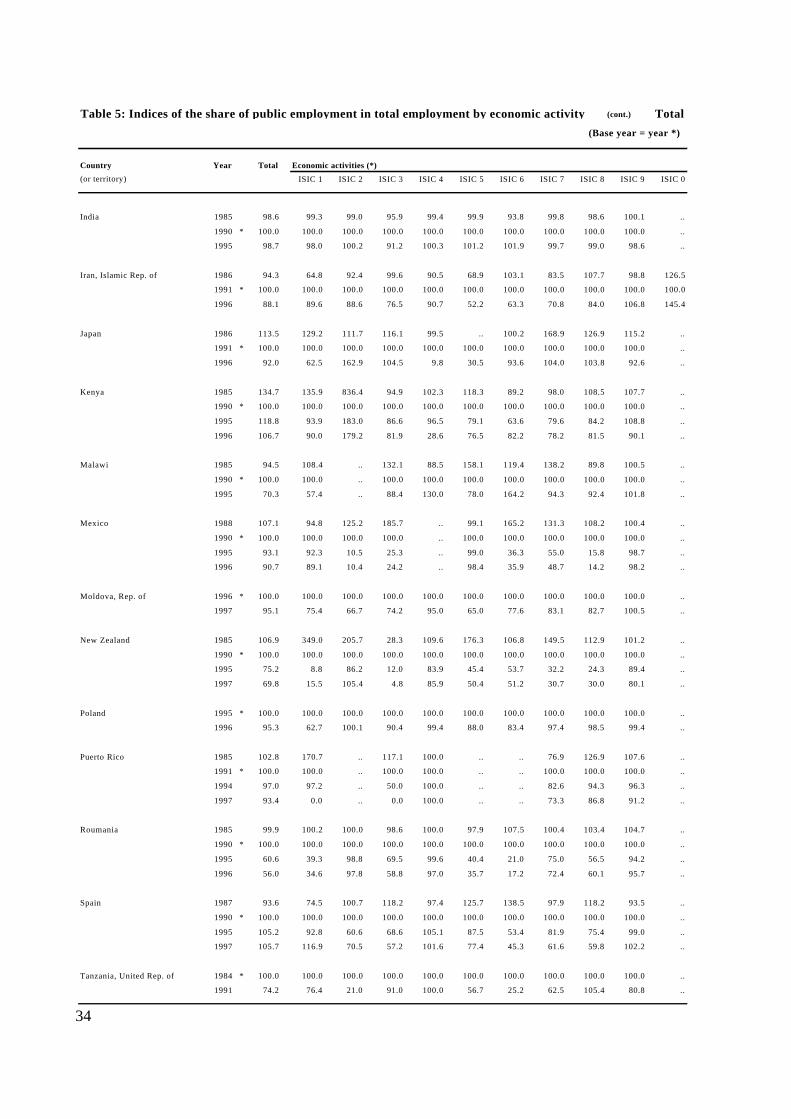
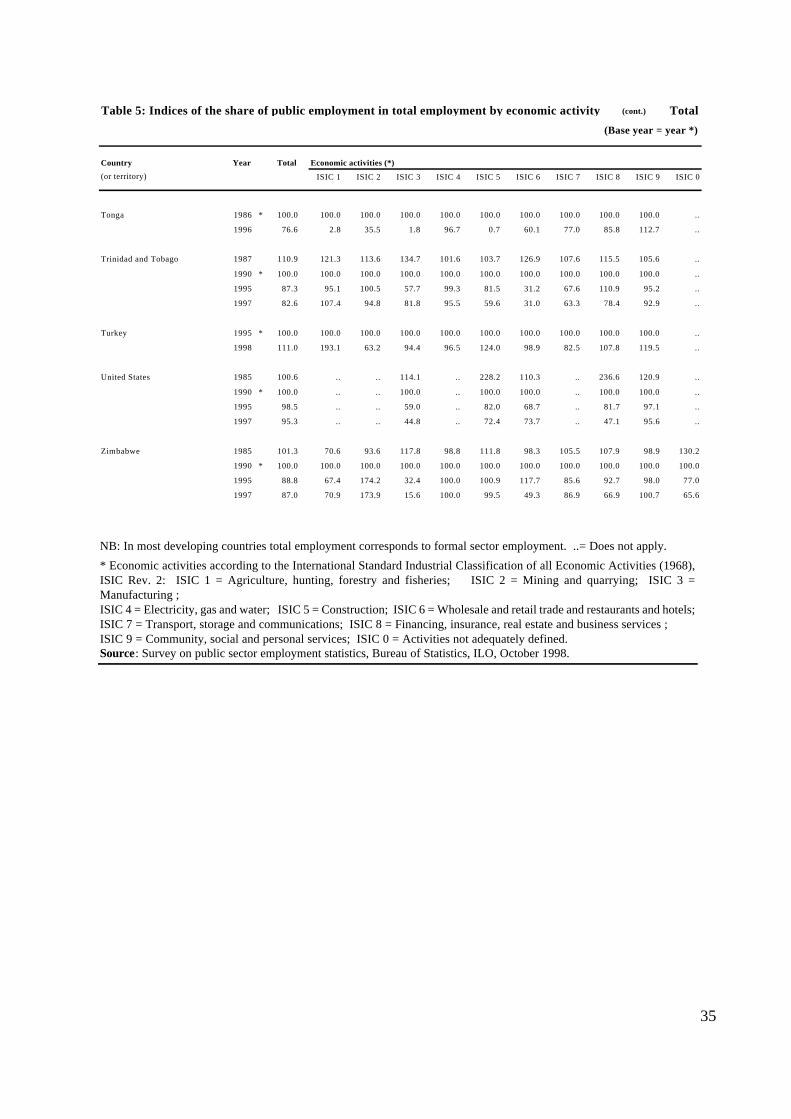
Figures 19, 20 and 21 illustrate the changes in the share of public employment andemployment in community services in total employment. The index of the latest year availableis compared to 1990 for each country. The data in these charts has been taken from the "total"and "ISIC 9" columns of Table 5 "Indices of the share of public employment in totalemployment by economic activity", page 33.
Compared to 1990, two main trends emerge from these charts with regard to the 27countries under review:
1. A general decrease in the share of public employment in total employment withthe exception of Spain, Kenya and Botswana, where the share has risen overthe last few years.
2. A general decrease in the share of employment in community services(administration, defence, social services, education, health care, etc.), but thisdecrease is appreciably lower than the decrease observed in total publicemployment.
Figure 19
Changes in publicemployment andemployment incommunity servicesin total employmentin 7 OECD countries*(Indices for different years compared to the base year 1990=100)
* By order of increasing percentages of changes in public employment. (1) 1991=100.Source: Survey on public sector employment statistics, Bureau of Statistics, ILO, October 1998.
32
-60% -40% -20% 0% 20%
Albania (1) (1996)
Roumania (1996)
Estonia (1996)
Croatia (1997)
Public employment Employment in Community services
-60% -40% -20% 0% 20%
Botswana (1995)
Kenya (1996)
Brazil (3) (1996)
Egypt (1995)
India (1995)
Iran, Islamic Rep. of (2)(1996)
Zimbabwe (1997)
Costa Rica (1997)
Trinidad and Tobago (1997)
Fiji (1) (1996)
Ecuador (1997)
Malawi (1995)
Public employment Employment in Community services
Figure 20
Changes in publicemployment andemployment incommunity servicesin total employmentin 4 countries in transition*(Indices for different years comparedto the base year 1990=100)
Figure 21
Changes in publicemployment andemployment incommunity servicesin total employment in 12 developingcountries*(Indices for different years compared tothe base year 1990=100)
* By order of increasing percentages of changes in public employment. (1) 1994=100.Source: Survey on public sector employment statistics, Bureau of Statistics, ILO, October 1998.
* By order of increasing percentages of changes in public employment.(1) 1894=100; 2) 1991=100; (3) 1992=100.Source: Survey on public sector employment statistics, Bureau of Statistics, ILO, October 1998.
33
Table 5: Indices of the share of public employment in total employment by economic activity Total(Base year = year *)
Country Year Total Economic activities (*)
(or territory) ISIC 1 ISIC 2 ISIC 3 ISIC 4 ISIC 5 ISIC 6 ISIC 7 ISIC 8 ISIC 9 ISIC 0
Albania 1994 * 100.0 100.0 100.0 100.0 100.0 100.0 100.0 100.0 .. 100.0 100.0
1995 91.3 75.6 99.2 103.1 104.4 57.3 45.0 82.2 .. 100.0 128.7
1996 80.7 62.5 95.0 114.4 153.5 36.9 30.1 68.6 .. 100.0 132.1
Australia 1985 110.4 .. 111.4 170.0 97.3 126.9 158.8 203.7 117.7 88.9 ..
1990 * 100.0 .. 100.0 100.0 100.0 100.0 100.0 100.0 100.0 100.0 ..
1995 91.2 .. 16.9 51.9 97.1 73.3 43.7 155.0 70.1 76.0 ..
1998 74.2 .. 0.0 16.8 82.3 35.3 0.0 59.9 23.0 82.0 ..
Botswana 1990 * 100.0 100.0 100.0 100.0 100.0 100.0 100.0 .. .. 100.0 ..
1995 116.4 65.0 92.9 94.8 21.6 47.2 81.9 .. .. 99.2 ..
Brazil 1992 * 100.0 .. 100.0 100.0 100.0 100.0 100.0 100.0 100.0 100.0 100.0
1995 98.0 .. 108.4 56.2 102.5 68.6 97.1 86.7 83.5 95.5 7.2
1996 100.0 .. 116.2 76.7 97.6 87.2 111.0 79.0 79.9 95.8 62.4
Colombia 1991 * 100.0 .. 100.0 100.0 100.0 100.0 100.0 100.0 100.0 100.0 100.0
1995 76.6 .. .. 96.8 106.1 39.0 54.8 43.5 54.8 43.7 90.6
1997 79.6 .. .. 140.6 64.9 52.1 11.3 28.1 54.8 33.9 68.4
1998 81.7 .. .. .. .. 7.6 12.7 .. 33.3 .. ..
Costa Rica 1987 96.1 350.1 .. 100.5 94.9 77.0 128.1 131.9 99.3 99.1 ..
1990 * 100.0 100.0 .. 100.0 100.0 100.0 100.0 100.0 100.0 100.0 ..
1995 86.5 205.3 .. 50.8 93.5 7.8 22.8 81.5 71.5 90.0 ..
1997 83.7 0.0 .. 56.5 85.1 32.7 0.0 41.6 51.5 86.8 ..
Croatia 1985 101.3 100.1 100.1 100.2 100.0 100.4 100.7 100.1 100.5 100.0 ..
1990 * 100.0 100.0 100.0 100.0 100.0 100.0 100.0 100.0 100.0 100.0 ..
1996 55.7 78.7 57.1 48.0 88.9 41.8 37.9 79.1 53.7 94.0 ..
1997 47.4 57.1 78.0 40.3 97.0 32.3 14.9 65.4 38.7 96.3 ..
Czech Republic 1995 * 100.0 100.0 100.0 100.0 100.0 100.0 100.0 100.0 100.0 100.0 ..
1997 76.6 7077.8 21.2 42.1 43.3 48.9 25.0 93.9 72.5 96.3 ..
Ecuador 1990 * 100.0 100.0 100.0 100.0 100.0 100.0 100.0 100.0 100.0 100.0 ..
1995 75.4 0.0 6.2 43.7 64.3 12.2 13.6 21.5 28.4 89.8 ..
1997 78.0 2.4 9.4 22.0 69.3 11.7 9.1 19.4 41.7 88.2 ..
Egypt 1985 103.5 95.3 116.4 101.5 99.4 96.8 110.9 105.6 104.1 110.2 ..
1990 * 100.0 100.0 100.0 100.0 100.0 100.0 100.0 100.0 100.0 100.0 ..
1995 99.4 93.4 81.0 97.6 98.9 102.3 99.8 105.0 96.4 53.6 ..
Estonia 1989 103.4 104.4 100.0 103.0 99.5 109.1 105.2 103.0 106.7 100.7 ..
1990 * 100.0 100.0 100.0 100.0 100.0 100.0 100.0 100.0 100.0 100.0 ..
1995 53.0 24.4 87.9 16.7 73.7 37.1 9.4 52.4 45.2 92.7 ..
1996 50.4 21.7 88.8 13.1 75.4 38.4 0.0 47.3 38.5 92.6 ..
Fiji 1989 * 100.0 100.0 100.0 100.0 100.0 100.0 100.0 100.0 100.0 100.0 ..
1993 92.4 45.4 85.5 97.1 100.0 80.8 34.2 98.8 105.3 99.4 ..
1996 82.0 97.4 54.3 70.4 100.0 61.8 43.5 85.1 70.8 96.0 ..
Finland 1985 97.4 70.0 .. 132.0 105.0 156.4 89.0 110.0 60.1 94.0 ..
1990 * 100.0 100.0 .. 100.0 100.0 100.0 100.0 100.0 100.0 100.0 ..
1995 105.0 115.2 .. 73.6 134.4 127.7 78.7 29.8 134.6 97.6 ..
1997 100.5 94.5 .. 24.1 101.8 95.1 72.0 15.6 131.2 96.6 ..
34
Table 5: Indices of the share of public employment in total employment by economic activity (cont.) Total(Base year = year *)
Country Year Total Economic activities (*)
(or territory) ISIC 1 ISIC 2 ISIC 3 ISIC 4 ISIC 5 ISIC 6 ISIC 7 ISIC 8 ISIC 9 ISIC 0
India 1985 98.6 99.3 99.0 95.9 99.4 99.9 93.8 99.8 98.6 100.1 ..
1990 * 100.0 100.0 100.0 100.0 100.0 100.0 100.0 100.0 100.0 100.0 ..
1995 98.7 98.0 100.2 91.2 100.3 101.2 101.9 99.7 99.0 98.6 ..
Iran, Islamic Rep. of 1986 94.3 64.8 92.4 99.6 90.5 68.9 103.1 83.5 107.7 98.8 126.5
1991 * 100.0 100.0 100.0 100.0 100.0 100.0 100.0 100.0 100.0 100.0 100.0
1996 88.1 89.6 88.6 76.5 90.7 52.2 63.3 70.8 84.0 106.8 145.4
Japan 1986 113.5 129.2 111.7 116.1 99.5 .. 100.2 168.9 126.9 115.2 ..
1991 * 100.0 100.0 100.0 100.0 100.0 100.0 100.0 100.0 100.0 100.0 ..
1996 92.0 62.5 162.9 104.5 9.8 30.5 93.6 104.0 103.8 92.6 ..
Kenya 1985 134.7 135.9 836.4 94.9 102.3 118.3 89.2 98.0 108.5 107.7 ..
1990 * 100.0 100.0 100.0 100.0 100.0 100.0 100.0 100.0 100.0 100.0 ..
1995 118.8 93.9 183.0 86.6 96.5 79.1 63.6 79.6 84.2 108.8 ..
1996 106.7 90.0 179.2 81.9 28.6 76.5 82.2 78.2 81.5 90.1 ..
Malawi 1985 94.5 108.4 .. 132.1 88.5 158.1 119.4 138.2 89.8 100.5 ..
1990 * 100.0 100.0 .. 100.0 100.0 100.0 100.0 100.0 100.0 100.0 ..
1995 70.3 57.4 .. 88.4 130.0 78.0 164.2 94.3 92.4 101.8 ..
Mexico 1988 107.1 94.8 125.2 185.7 .. 99.1 165.2 131.3 108.2 100.4 ..
1990 * 100.0 100.0 100.0 100.0 .. 100.0 100.0 100.0 100.0 100.0 ..
1995 93.1 92.3 10.5 25.3 .. 99.0 36.3 55.0 15.8 98.7 ..
1996 90.7 89.1 10.4 24.2 .. 98.4 35.9 48.7 14.2 98.2 ..
Moldova, Rep. of 1996 * 100.0 100.0 100.0 100.0 100.0 100.0 100.0 100.0 100.0 100.0 ..
1997 95.1 75.4 66.7 74.2 95.0 65.0 77.6 83.1 82.7 100.5 ..
New Zealand 1985 106.9 349.0 205.7 28.3 109.6 176.3 106.8 149.5 112.9 101.2 ..
1990 * 100.0 100.0 100.0 100.0 100.0 100.0 100.0 100.0 100.0 100.0 ..
1995 75.2 8.8 86.2 12.0 83.9 45.4 53.7 32.2 24.3 89.4 ..
1997 69.8 15.5 105.4 4.8 85.9 50.4 51.2 30.7 30.0 80.1 ..
Poland 1995 * 100.0 100.0 100.0 100.0 100.0 100.0 100.0 100.0 100.0 100.0 ..
1996 95.3 62.7 100.1 90.4 99.4 88.0 83.4 97.4 98.5 99.4 ..
Puerto Rico 1985 102.8 170.7 .. 117.1 100.0 .. .. 76.9 126.9 107.6 ..
1991 * 100.0 100.0 .. 100.0 100.0 .. .. 100.0 100.0 100.0 ..
1994 97.0 97.2 .. 50.0 100.0 .. .. 82.6 94.3 96.3 ..
1997 93.4 0.0 .. 0.0 100.0 .. .. 73.3 86.8 91.2 ..
Roumania 1985 99.9 100.2 100.0 98.6 100.0 97.9 107.5 100.4 103.4 104.7 ..
1990 * 100.0 100.0 100.0 100.0 100.0 100.0 100.0 100.0 100.0 100.0 ..
1995 60.6 39.3 98.8 69.5 99.6 40.4 21.0 75.0 56.5 94.2 ..
1996 56.0 34.6 97.8 58.8 97.0 35.7 17.2 72.4 60.1 95.7 ..
Spain 1987 93.6 74.5 100.7 118.2 97.4 125.7 138.5 97.9 118.2 93.5 ..
1990 * 100.0 100.0 100.0 100.0 100.0 100.0 100.0 100.0 100.0 100.0 ..
1995 105.2 92.8 60.6 68.6 105.1 87.5 53.4 81.9 75.4 99.0 ..
1997 105.7 116.9 70.5 57.2 101.6 77.4 45.3 61.6 59.8 102.2 ..
Tanzania, United Rep. of 1984 * 100.0 100.0 100.0 100.0 100.0 100.0 100.0 100.0 100.0 100.0 ..
1991 74.2 76.4 21.0 91.0 100.0 56.7 25.2 62.5 105.4 80.8 ..
35
Table 5: Indices of the share of public employment in total employment by economic activity (cont.) Total
(Base year = year *)
Country Year Total Economic activities (*)
(or territory) ISIC 1 ISIC 2 ISIC 3 ISIC 4 ISIC 5 ISIC 6 ISIC 7 ISIC 8 ISIC 9 ISIC 0
Tonga 1986 * 100.0 100.0 100.0 100.0 100.0 100.0 100.0 100.0 100.0 100.0 ..
1996 76.6 2.8 35.5 1.8 96.7 0.7 60.1 77.0 85.8 112.7 ..
Trinidad and Tobago 1987 110.9 121.3 113.6 134.7 101.6 103.7 126.9 107.6 115.5 105.6 ..
1990 * 100.0 100.0 100.0 100.0 100.0 100.0 100.0 100.0 100.0 100.0 ..
1995 87.3 95.1 100.5 57.7 99.3 81.5 31.2 67.6 110.9 95.2 ..
1997 82.6 107.4 94.8 81.8 95.5 59.6 31.0 63.3 78.4 92.9 ..
Turkey 1995 * 100.0 100.0 100.0 100.0 100.0 100.0 100.0 100.0 100.0 100.0 ..
1998 111.0 193.1 63.2 94.4 96.5 124.0 98.9 82.5 107.8 119.5 ..
United States 1985 100.6 .. .. 114.1 .. 228.2 110.3 .. 236.6 120.9 ..
1990 * 100.0 .. .. 100.0 .. 100.0 100.0 .. 100.0 100.0 ..
1995 98.5 .. .. 59.0 .. 82.0 68.7 .. 81.7 97.1 ..
1997 95.3 .. .. 44.8 .. 72.4 73.7 .. 47.1 95.6 ..
Zimbabwe 1985 101.3 70.6 93.6 117.8 98.8 111.8 98.3 105.5 107.9 98.9 130.2
1990 * 100.0 100.0 100.0 100.0 100.0 100.0 100.0 100.0 100.0 100.0 100.0
1995 88.8 67.4 174.2 32.4 100.0 100.9 117.7 85.6 92.7 98.0 77.0
1997 87.0 70.9 173.9 15.6 100.0 99.5 49.3 86.9 66.9 100.7 65.6
NB: In most developing countries total employment corresponds to formal sector employment. ..= Does not apply.
* Economic activities according to the International Standard Industrial Classification of all Economic Activities (1968),ISIC Rev. 2: ISIC 1 = Agriculture, hunting, forestry and fisheries; ISIC 2 = Mining and quarrying; ISIC 3 =Manufacturing ; ISIC 4 = Electricity, gas and water; ISIC 5 = Construction; ISIC 6 = Wholesale and retail trade and restaurants and hotels;ISIC 7 = Transport, storage and communications; ISIC 8 = Financing, insurance, real estate and business services ; ISIC 9 = Community, social and personal services; ISIC 0 = Activities not adequately defined.Source: Survey on public sector employment statistics, Bureau of Statistics, ILO, October 1998.
37
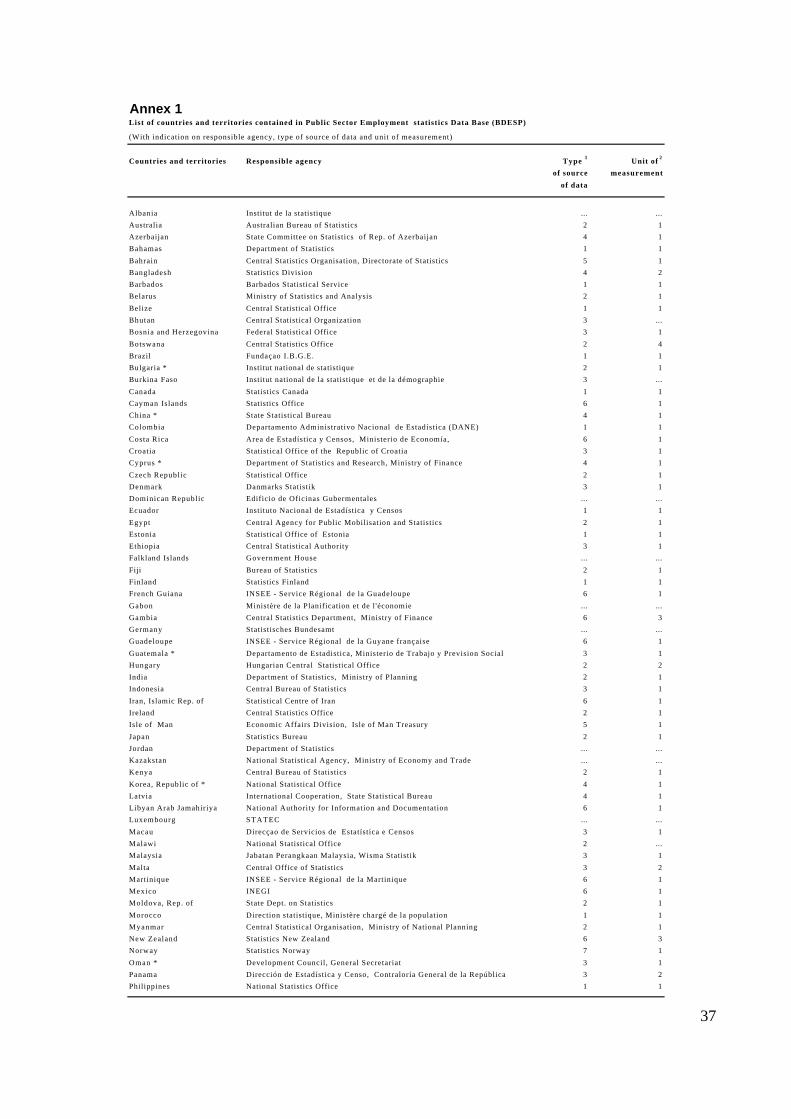
Annex 1List of countries and territories contained in Public Sector Employment statistics Data Base (BDESP)
(With indication on responsible agency, type of source of data and unit of measurement)
Countries and territories Responsible agency Type 1 Unit of 2
of source measurement
of data
Albania Institut de la statistique ... ...Australia Australian Bureau of Statistics 2 1Azerbaijan State Committee on Statistics of Rep. of Azerbaijan 4 1Bahamas Department of Statistics 1 1
Bahrain Central Statistics Organisation, Directorate of Statistics 5 1Bangladesh Statistics Division 4 2Barbados Barbados Statistical Service 1 1Belarus Ministry of Statistics and Analysis 2 1
Belize Central Statistical Office 1 1Bhutan Central Statistical Organization 3 ...Bosnia and Herzegovina Federal Statistical Office 3 1
Botswana Central Statistics Office 2 4Brazil Fundaçao I.B.G.E. 1 1Bulgaria * Institut national de statistique 2 1Burkina Faso Institut national de la statistique et de la démographie 3 ...
Canada Statistics Canada 1 1Cayman Islands Statistics Office 6 1China * State Statistical Bureau 4 1Colombia Departamento Administrativo Nacional de Estadística (DANE) 1 1
Costa Rica Area de Estadística y Censos, Ministerio de Economía, 6 1Croatia Statistical Office of the Republic of Croatia 3 1Cyprus * Department of Statistics and Research, Ministry of Finance 4 1
Czech Republic Statistical Office 2 1Denmark Danmarks Statistik 3 1Dominican Republic Edificio de Oficinas Gubermentales ... ...Ecuador Instituto Nacional de Estadística y Censos 1 1
Egypt Central Agency for Public Mobilisation and Statistics 2 1Estonia Statistical Office of Estonia 1 1Ethiopia Central Statistical Authority 3 1Falkland Islands Government House ... ...
Fiji Bureau of Statistics 2 1Finland Statistics Finland 1 1French Guiana INSEE - Service Régional de la Guadeloupe 6 1
Gabon Ministère de la Planification et de l'économie ... ...Gambia Central Statistics Department, Ministry of Finance 6 3Germany Statistisches Bundesamt ... ...Guadeloupe INSEE - Service Régional de la Guyane française 6 1
Guatemala * Departamento de Estadistica, Ministerio de Trabajo y Prevision Social 3 1Hungary Hungarian Central Statistical Office 2 2India Department of Statistics, Ministry of Planning 2 1Indonesia Central Bureau of Statistics 3 1
Iran, Islamic Rep. of Statistical Centre of Iran 6 1Ireland Central Statistics Office 2 1Isle of Man Economic Affairs Division, Isle of Man Treasury 5 1
Japan Statistics Bureau 2 1Jordan Department of Statistics ... ...Kazakstan National Statistical Agency, Ministry of Economy and Trade ... ...Kenya Central Bureau of Statistics 2 1
Korea, Republic of * National Statistical Office 4 1Latvia International Cooperation, State Statistical Bureau 4 1Libyan Arab Jamahiriya National Authority for Information and Documentation 6 1Luxembourg STATEC ... ...
Macau Direcçao de Servicios de Estatística e Censos 3 1Malawi National Statistical Office 2 ...Malaysia Jabatan Perangkaan Malaysia, Wisma Statistik 3 1
Malta Central Office of Statistics 3 2Martinique INSEE - Service Régional de la Martinique 6 1Mexico INEGI 6 1Moldova, Rep. of State Dept. on Statistics 2 1
Morocco Direction statistique, Ministère chargé de la population 1 1Myanmar Central Statistical Organisation, Ministry of National Planning 2 1New Zealand Statistics New Zealand 6 3Norway Statistics Norway 7 1
Oman * Development Council, General Secretariat 3 1Panama Dirección de Estadística y Censo, Contraloría General de la República 3 2Philippines National Statistics Office 1 1
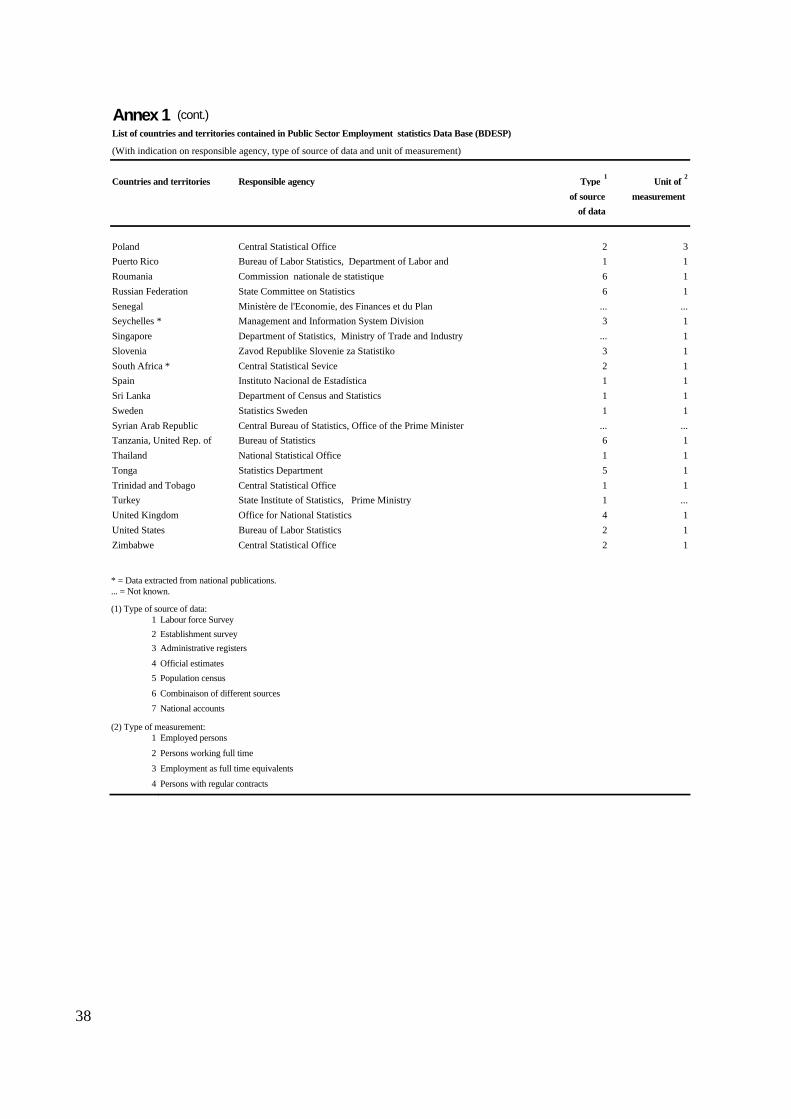
38
Annex 1 (cont.)List of countries and territories contained in Public Sector Employment statistics Data Base (BDESP)
(With indication on responsible agency, type of source of data and unit of measurement)
Countries and territories Responsible agency Type 1
Unit of 2
of source measurementof data
Poland Central Statistical Office 2 3Puerto Rico Bureau of Labor Statistics, Department of Labor and 1 1Roumania Commission nationale de statistique 6 1Russian Federation State Committee on Statistics 6 1Senegal Ministère de l'Economie, des Finances et du Plan ... ...Seychelles * Management and Information System Division 3 1Singapore Department of Statistics, Ministry of Trade and Industry ... 1Slovenia Zavod Republike Slovenie za Statistiko 3 1South Africa * Central Statistical Sevice 2 1Spain Instituto Nacional de Estadística 1 1Sri Lanka Department of Census and Statistics 1 1Sweden Statistics Sweden 1 1Syrian Arab Republic Central Bureau of Statistics, Office of the Prime Minister ... ...Tanzania, United Rep. of Bureau of Statistics 6 1Thailand National Statistical Office 1 1Tonga Statistics Department 5 1Trinidad and Tobago Central Statistical Office 1 1Turkey State Institute of Statistics, Prime Ministry 1 ...United Kingdom Office for National Statistics 4 1United States Bureau of Labor Statistics 2 1Zimbabwe Central Statistical Office 2 1
* = Data extracted from national publications.... = Not known.
(1) Type of source of data:1 Labour force Survey2 Establishment survey3 Administrative registers
4 Official estimates
5 Population census
6 Combinaison of different sources
7 National accounts
(2) Type of measurement:1 Employed persons
2 Persons working full time
3 Employment as full time equivalents
4 Persons with regular contracts

39
Annex 2:
Questionnaire
on statistic of
Public sector employment

ST-01-11
International Labour Office
QUESTIONNAIRE
on statistics of the
PUBLIC SECTOR EMPLOYMENT
This questionnaire is used to test the possibility of creating an international data base for statistics
on public sector employment
Please fill in the tables in accordance with the instructions provided.
Please return this questionnaireto the ILO by 15 September 1998.
Country:(or territory)
Agency:
Name:
Address:
Contact person:
Name:
Tel.:
Fax:
E-mail:
If you have questions, please contact:
M. Hammouya Tel.: +4122/7996365; e-mail: [email protected]. Hoffmann Tel.: +4122/7998076; e-mail: [email protected]
Bureau of Statistics, ILO CH-1211 Genève 22
SwitzerlandFax: +4122/7796957
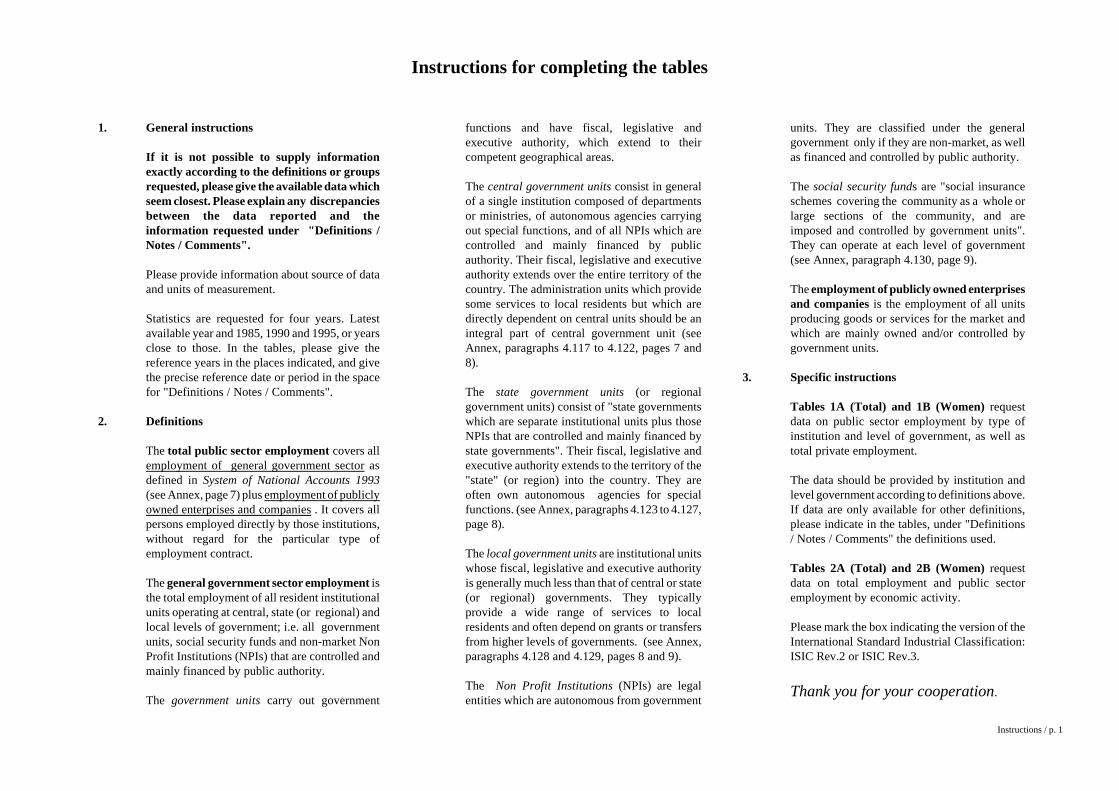
Instructions / p. 1
Instructions for completing the tables
1. General instructions
If it is not possible to supply informationexactly according to the definitions or groupsrequested, please give the available data whichseem closest. Please explain any discrepanciesbetween the data reported and theinformation requested under "Definitions /Notes / Comments".
Please provide information about source of dataand units of measurement.
Statistics are requested for four years. Latestavailable year and 1985, 1990 and 1995, or yearsclose to those. In the tables, please give thereference years in the places indicated, and givethe precise reference date or period in the spacefor "Definitions / Notes / Comments".
2. Definitions
The total public sector employment covers allemployment of general government sector asdefined in System of National Accounts 1993(see Annex, page 7) plus employment of publiclyowned enterprises and companies . It covers allpersons employed directly by those institutions,without regard for the particular type ofemployment contract.
The general government sector employment isthe total employment of all resident institutionalunits operating at central, state (or regional) andlocal levels of government; i.e. all governmentunits, social security funds and non-market NonProfit Institutions (NPIs) that are controlled andmainly financed by public authority.
The government units carry out government
functions and have fiscal, legislative andexecutive authority, which extend to theircompetent geographical areas.
The central government units consist in generalof a single institution composed of departmentsor ministries, of autonomous agencies carryingout special functions, and of all NPIs which arecontrolled and mainly financed by publicauthority. Their fiscal, legislative and executiveauthority extends over the entire territory of thecountry. The administration units which providesome services to local residents but which aredirectly dependent on central units should be anintegral part of central government unit (seeAnnex, paragraphs 4.117 to 4.122, pages 7 and8).
The state government units (or regionalgovernment units) consist of "state governmentswhich are separate institutional units plus thoseNPIs that are controlled and mainly financed bystate governments". Their fiscal, legislative andexecutive authority extends to the territory of the"state" (or region) into the country. They areoften own autonomous agencies for specialfunctions. (see Annex, paragraphs 4.123 to 4.127,page 8).
The local government units are institutional unitswhose fiscal, legislative and executive authorityis generally much less than that of central or state(or regional) governments. They typicallyprovide a wide range of services to localresidents and often depend on grants or transfersfrom higher levels of governments. (see Annex,paragraphs 4.128 and 4.129, pages 8 and 9).
The Non Profit Institutions (NPIs) are legalentities which are autonomous from government
units. They are classified under the generalgovernment only if they are non-market, as wellas financed and controlled by public authority.
The social security funds are "social insuranceschemes covering the community as a whole orlarge sections of the community, and areimposed and controlled by government units".They can operate at each level of government(see Annex, paragraph 4.130, page 9).
The employment of publicly owned enterprisesand companies is the employment of all unitsproducing goods or services for the market andwhich are mainly owned and/or controlled bygovernment units.
3. Specific instructions
Tables 1A (Total) and 1B (Women) requestdata on public sector employment by type ofinstitution and level of government, as well astotal private employment.
The data should be provided by institution andlevel government according to definitions above.If data are only available for other definitions,please indicate in the tables, under "Definitions/ Notes / Comments" the definitions used.
Tables 2A (Total) and 2B (Women) requestdata on total employment and public sectoremployment by economic activity.
Please mark the box indicating the version of theInternational Standard Industrial Classification:ISIC Rev.2 or ISIC Rev.3.
Thank you for your cooperation.

Table 1A: Public sector employment by type of institution and level of government, and total private employment
TOTAL
Country: Source of data: [ ] Labour force survey [ ] Establishment survey [ ] Administrative registers
[ ] Official estimates[ ] Combination of different sources[ ] ..................................................
Units of measurement: [ ] All employed persons [ ] Person s with regular contracts [ ] Person s working full time
[ ] Employment as full time equivalents[ ] ................................................
Year Level of government
Employment in general government sector Employment inpublicly owned
enterprises and companies
Employmentin total
public sector(6+7)
Employment inprivate sector
(Total)Government units Social security
funds Other No Profit
InstitutionsTotal
(3+4+5)
1 2 3 4 5 6 7 8 9
Latest available year
199___
Central/Federal
Regional/State government
Local
Total
1995 or year close to 1995
199__
Central/Federal
Regional//State government
Local
Total
1990 or year close to 1990
199__
Central/Federal
Regional//State government
Local
Total
1985 or year close to 1985
198___
Central/Federal
Regional//State government
Local
Total
Definitions / Notes / Comments:
Table 1A / p. 3

Table 1B: Public sector employment by type of institution and level of government, and total private employment
WOMEN
Country: Source of data: [ ] Labour force survey [ ] Establishment survey [ ] Administrative registers
[ ] Official estimates[ ] Combination of different sources[ ] ..................................................
Units of measurement: [ ] All employed persons [ ] Person s with regular contracts [ ] Person s working full time
[ ] Employment as full time equivalents[ ] ................................................
Year Level of government
Employment in general government sector Employment inpublicly owned
enterprises and companies
Employmentin total
public sector(6+7)
Employment inprivate sector
(Total)Government units Social security
funds Other no profit
institutionsTotal
(3+4+5)
1 2 3 4 5 6 7 8 9
Latest available year
199___
Central/Federal
Regional/State government
Local
Total
1995 or year close to 1995
199__
Central/Federal
Regional//State government
Local
Total
1990 or year close to 1990
199__
Central/Federal
Regional//State government
Local
Total
1985 or year close to 1985
198___
Central/Federal
Regional//State government
Local
Total
Definitions / Notes / Comments:
Table 1B / p. 4
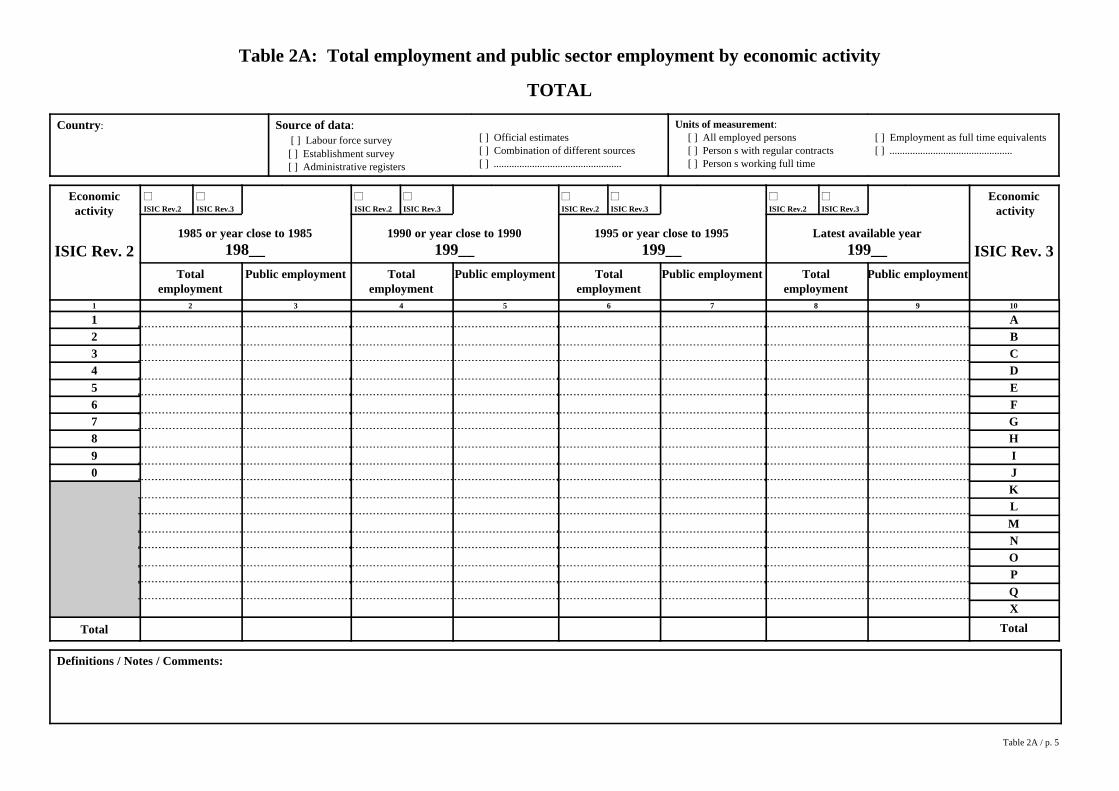
Table 2A: Total employment and public sector employment by economic activity
TOTAL
Country: Source of data: [ ] Labour force survey [ ] Establishment survey [ ] Administrative registers
[ ] Official estimates[ ] Combination of different sources[ ] ..................................................
Units of measurement: [ ] All employed persons [ ] Person s with regular contracts [ ] Person s working full time
[ ] Employment as full time equivalents[ ] ................................................
Economicactivity
ISIC Rev. 2
ISIC Rev.2 ISIC Rev.3 ISIC Rev.2 ISIC Rev.3 ISIC Rev.2 ISIC Rev.3 ISIC Rev.2 ISIC Rev.3Economic activity
ISIC Rev. 31985 or year close to 1985
198__1990 or year close to 1990
199__1995 or year close to 1995
199__Latest available year
199__
Totalemployment
Public employment Totalemployment
Public employment Totalemployment
Public employment Totalemployment
Public employment
1 2 3 4 5 6 7 8 9 10
1 A2 B3 C4 D5 E6 F7 G8 H9 I0 J
KLMNOPQX
Total Total
Definitions / Notes / Comments:
Table 2A / p. 5
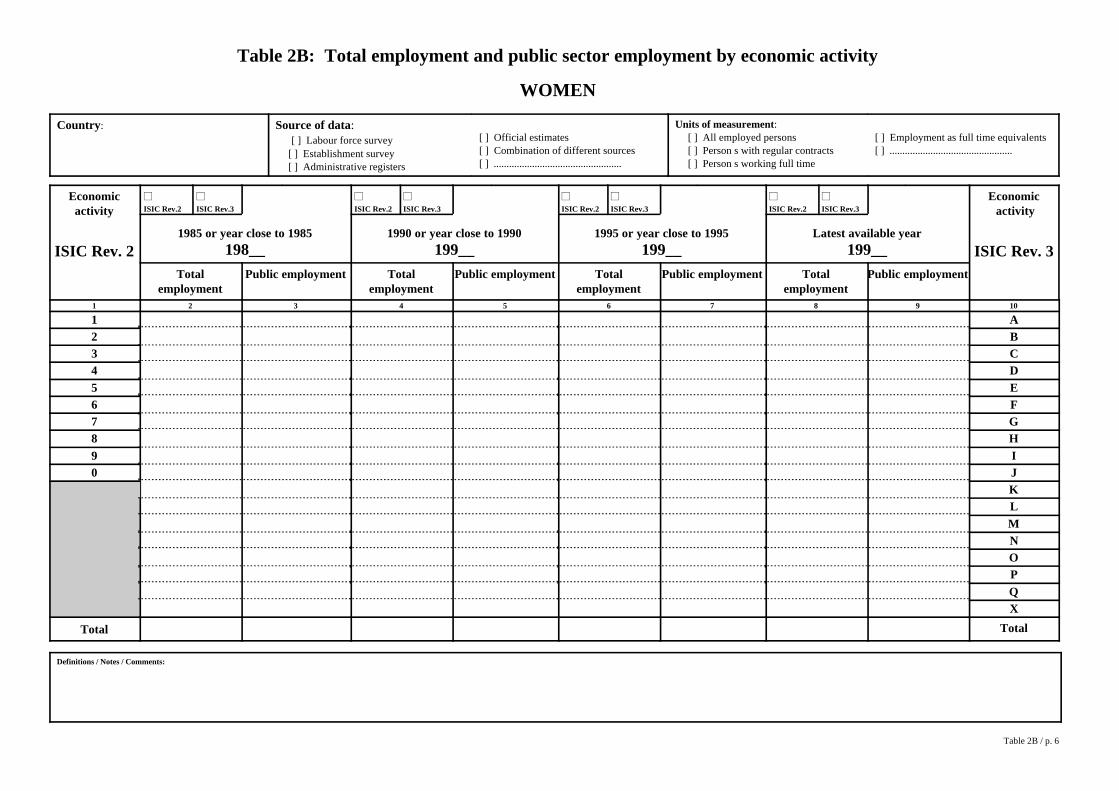
Table 2B: Total employment and public sector employment by economic activity
WOMEN
Country: Source of data: [ ] Labour force survey [ ] Establishment survey [ ] Administrative registers
[ ] Official estimates[ ] Combination of different sources[ ] ..................................................
Units of measurement: [ ] All employed persons [ ] Person s with regular contracts [ ] Person s working full time
[ ] Employment as full time equivalents[ ] ................................................
Economicactivity
ISIC Rev. 2
ISIC Rev.2 ISIC Rev.3 ISIC Rev.2 ISIC Rev.3 ISIC Rev.2 ISIC Rev.3 ISIC Rev.2 ISIC Rev.3Economic activity
ISIC Rev. 31985 or year close to 1985
198__1990 or year close to 1990
199__1995 or year close to 1995
199__Latest available year
199__
Totalemployment
Public employment Totalemployment
Public employment Totalemployment
Public employment Totalemployment
Public employment
1 2 3 4 5 6 7 8 9 10
1 A2 B3 C4 D5 E6 F7 G8 H9 I0 J
KLMNOPQX
Total Total
Definitions / Notes / Comments:
Table 2B / p. 6
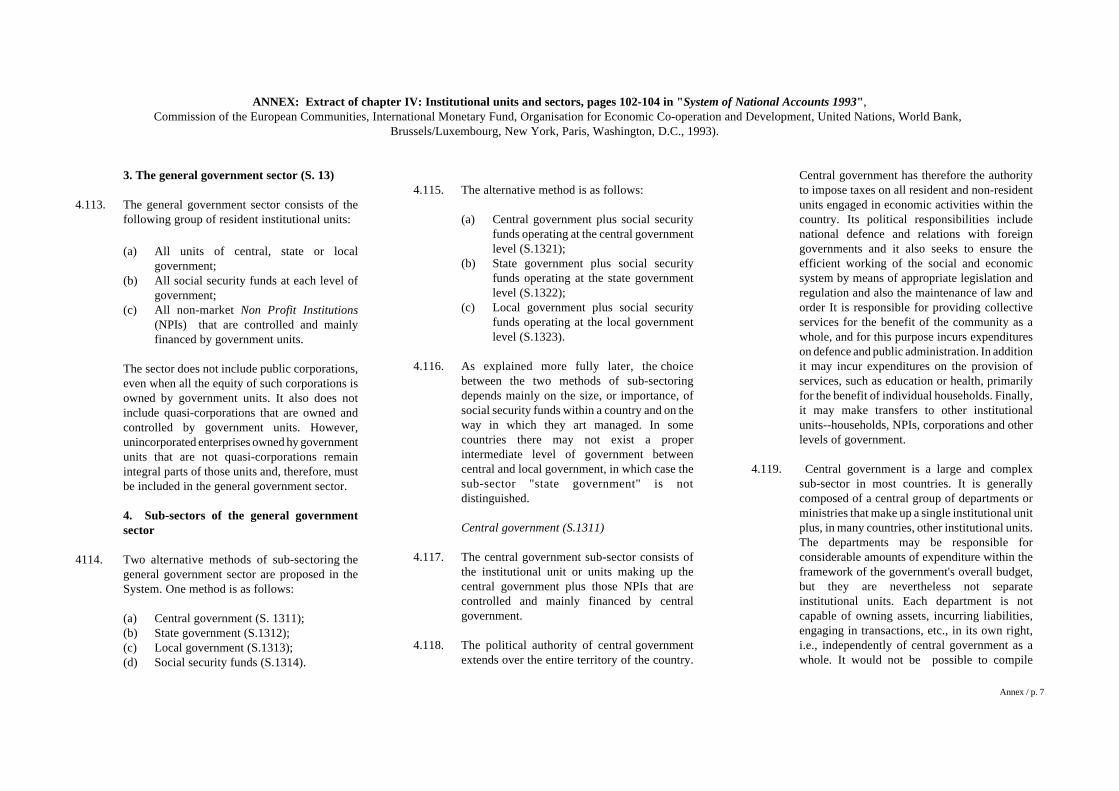
Annex / p. 7
ANNEX: Extract of chapter IV: Institutional units and sectors, pages 102-104 in "System of National Accounts 1993",Commission of the European Communities, International Monetary Fund, Organisation for Economic Co-operation and Development, United Nations, World Bank,
Brussels/Luxembourg, New York, Paris, Washington, D.C., 1993).
3. The general government sector (S. 13)
4.113. The general government sector consists of thefollowing group of resident institutional units:
(a) All units of central, state or localgovernment;
(b) All social security funds at each level ofgovernment;
(c) All non-market Non Profit Institutions(NPIs) that are controlled and mainlyfinanced by government units.
The sector does not include public corporations,even when all the equity of such corporations isowned by government units. It also does notinclude quasi-corporations that are owned andcontrolled by government units. However,unincorporated enterprises owned hy governmentunits that are not quasi-corporations remainintegral parts of those units and, therefore, mustbe included in the general government sector.
4. Sub-sectors of the general governmentsector
4114. Two alternative methods of sub-sectoring thegeneral government sector are proposed in theSystem. One method is as follows:
(a) Central government (S. 1311);(b) State government (S.1312);(c) Local government (S.1313);(d) Social security funds (S.1314).
4.115. The alternative method is as follows:
(a) Central government plus social securityfunds operating at the central governmentlevel (S.1321);
(b) State government plus social securityfunds operating at the state governmentlevel (S.1322);
(c) Local government plus social securityfunds operating at the local governmentlevel (S.1323).
4.116. As explained more fully later, the choicebetween the two methods of sub-sectoringdepends mainly on the size, or importance, ofsocial security funds within a country and on theway in which they art managed. In somecountries there may not exist a properintermediate level of government betweencentral and local government, in which case thesub-sector "state government" is notdistinguished.
Central government (S.1311)
4.117. The central government sub-sector consists ofthe institutional unit or units making up thecentral government plus those NPIs that arecontrolled and mainly financed by centralgovernment.
4.118. The political authority of central governmentextends over the entire territory of the country.
Central government has therefore the authorityto impose taxes on all resident and non-residentunits engaged in economic activities within thecountry. Its political responsibilities includenational defence and relations with foreigngovernments and it also seeks to ensure theefficient working of the social and economicsystem by means of appropriate legislation andregulation and also the maintenance of law andorder It is responsible for providing collectiveservices for the benefit of the community as awhole, and for this purpose incurs expenditureson defence and public administration. In additionit may incur expenditures on the provision ofservices, such as education or health, primarilyfor the benefit of individual households. Finally,it may make transfers to other institutionalunits--households, NPIs, corporations and otherlevels of government.
4.119. Central government is a large and complexsub-sector in most countries. It is generallycomposed of a central group of departments orministries that make up a single institutional unitplus, in many countries, other institutional units.The departments may be responsible forconsiderable amounts of expenditure within theframework of the government's overall budget,but they are nevertheless not separateinstitutional units. Each department is notcapable of owning assets, incurring liabilities,engaging in transactions, etc., in its own right,i.e., independently of central government as awhole. It would not be possible to compile
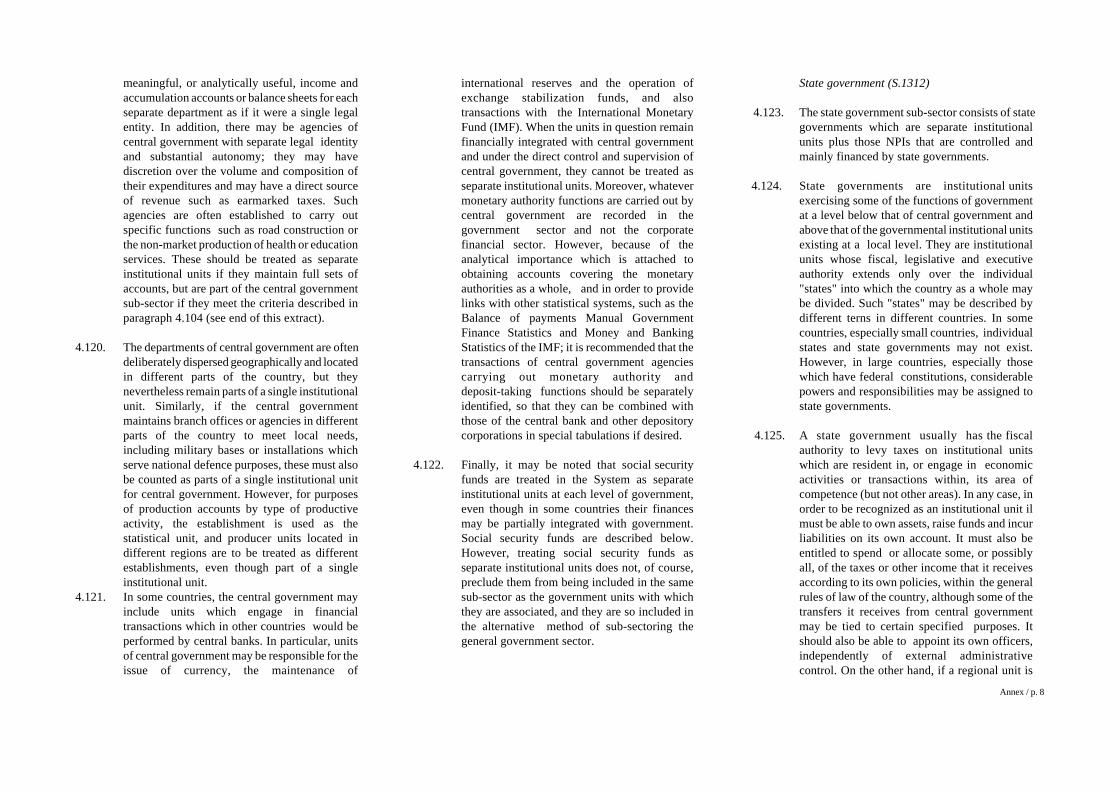
Annex / p. 8
meaningful, or analytically useful, income andaccumulation accounts or balance sheets for eachseparate department as if it were a single legalentity. In addition, there may be agencies ofcentral government with separate legal identityand substantial autonomy; they may havediscretion over the volume and composition oftheir expenditures and may have a direct sourceof revenue such as earmarked taxes. Suchagencies are often established to carry outspecific functions such as road construction orthe non-market production of health or educationservices. These should be treated as separateinstitutional units if they maintain full sets ofaccounts, but are part of the central governmentsub-sector if they meet the criteria described inparagraph 4.104 (see end of this extract).
4.120. The departments of central government are oftendeliberately dispersed geographically and locatedin different parts of the country, but theynevertheless remain parts of a single institutionalunit. Similarly, if the central governmentmaintains branch offices or agencies in differentparts of the country to meet local needs,including military bases or installations whichserve national defence purposes, these must alsobe counted as parts of a single institutional unitfor central government. However, for purposesof production accounts by type of productiveactivity, the establishment is used as thestatistical unit, and producer units located indifferent regions are to be treated as differentestablishments, even though part of a singleinstitutional unit.
4.121. In some countries, the central government mayinclude units which engage in financialtransactions which in other countries would beperformed by central banks. In particular, unitsof central government may be responsible for theissue of currency, the maintenance of
international reserves and the operation ofexchange stabilization funds, and alsotransactions with the International MonetaryFund (IMF). When the units in question remainfinancially integrated with central governmentand under the direct control and supervision ofcentral government, they cannot be treated asseparate institutional units. Moreover, whatevermonetary authority functions are carried out bycentral government are recorded in thegovernment sector and not the corporatefinancial sector. However, because of theanalytical importance which is attached toobtaining accounts covering the monetaryauthorities as a whole, and in order to providelinks with other statistical systems, such as theBalance of payments Manual GovernmentFinance Statistics and Money and BankingStatistics of the IMF; it is recommended that thetransactions of central government agenciescarrying out monetary authority anddeposit-taking functions should be separatelyidentified, so that they can be combined withthose of the central bank and other depositorycorporations in special tabulations if desired.
4.122. Finally, it may be noted that social security
funds are treated in the System as separateinstitutional units at each level of government,even though in some countries their financesmay be partially integrated with government.Social security funds are described below.However, treating social security funds asseparate institutional units does not, of course,preclude them from being included in the samesub-sector as the government units with whichthey are associated, and they are so included inthe alternative method of sub-sectoring thegeneral government sector.
State government (S.1312)
4.123. The state government sub-sector consists of stategovernments which are separate institutionalunits plus those NPIs that are controlled andmainly financed by state governments.
4.124. State governments are institutional units
exercising some of the functions of governmentat a level below that of central government andabove that of the governmental institutional unitsexisting at a local level. They are institutionalunits whose fiscal, legislative and executiveauthority extends only over the individual"states" into which the country as a whole maybe divided. Such "states" may be described bydifferent terns in different countries. In somecountries, especially small countries, individualstates and state governments may not exist.However, in large countries, especially thosewhich have federal constitutions, considerablepowers and responsibilities may be assigned tostate governments.
4.125. A state government usually has the fiscal
authority to levy taxes on institutional unitswhich are resident in, or engage in economicactivities or transactions within, its area ofcompetence (but not other areas). In any case, inorder to be recognized as an institutional unit ilmust be able to own assets, raise funds and incurliabilities on its own account. It must also beentitled to spend or allocate some, or possiblyall, of the taxes or other income that it receivesaccording to its own policies, within the generalrules of law of the country, although some of thetransfers it receives from central governmentmay be tied to certain specified purposes. Itshould also be able to appoint its own officers,independently of external administrativecontrol. On the other hand, if a regional unit is
Annex / p. 9
entirely dependent on funds from centralgovernment, and if the central government alsodictates the ways in which those funds are to bespent at the regional level, il should be treated asan agency of central government rather than as aseparate institutional unit.
4.126. State governments, when they exist, are
distinguished by the fact that their fiscalauthority extends over the largest geographicalareas into which the country as a whole may bedivided for political or administrative purposes.In a few countries more than one level ofgovernment exists between the centralgovernment and the smallest governmentalinstitutional units at a local level; in such cases,these intermediate levels of government aregrouped together with the level of government,either state or local, with which they are mostclosely associated for purposes of sectoring inthe System.
4.127. State governments may own, or control,corporations in the same way as centralgovernment. Similarly, they may have unitswhich engage in market production, in whichcase the relevant producer units should be treatedas quasi-corporations whenever their operationsand accounting records justify this. Socialsecurity schemes may also exist at a state leveland are treated as separate institutional units.
Local government (S.1313)
4.128. The local government sub-sector consists of local
governments that are separate institutional unitsplus those NPIs which are controlled and mainlyfinanced by local governments. In principle,local government units are institutional unitswhose fiscal, legislative and executive authorityextends over the smallest geographical areas
distinguished for administrative and politicalpurposes. The scope of their authority isgenerally much less than that of centralgovernment or regional governments, and theymay, or may not, be entitled to levy taxes oninstitutional units resident in their areas. Theyare often heavily dependent on grants ortransfers from higher levels of government, andthey may also act as agents of central or regionalgovernments to some extent. However, in orderto be treated as institutional units they must beentitled to own assets, raise funds and incurliabilities by borrowing on their own account;similarly, they must have some discretion overhow such funds are spent. They should also beable to point their own officers, independently ofexternal administrative control. The fact thatthey may also act as agents of central or stategovernments to some extent does not preventthem from being treated as separate institutionalunits provided they are also able to raise andspend some funds on their own initiative andown responsibility.
4.129. As they are the government units which are inclosest contact with the institutional unitsresident in their localities, they typically providea wide range of services to local residents, someof which may be financed out of transfers fromhigher levels of government. The same rulesgovern the treatment of the production of goodsand services by local government units as areapplied to central and state governments. Unitssuch as municipal theatres, museums, swimmingpools, etc., which supply goods or services on amarket basis should be treated as quasi-corporations whenever appropriate. Unitssupplying services such as education or healthon a non-market basis remain an integral part ofthe local government unit to which they belong.
Social security funds (S.1314)
4.130. The social security funds sub-sector consists ofthe social security funds operating at all levels ofgovernment. As explained in paragraph 111above, social security funds are socialinsurance schemes covering the community asa whole or large sections of the community, thatare imposed and controlled by government units.
5. The alternative method of sub-sectoring
4.131. The alternative method of sub-sectoring thegeneral government sector is to group the socialsecurity funds operating at each level ofgovernment with the corresponding governmentunits and government controlled and financedNPIs at that level of government. The twoalternative methods of sub-sectoring aredesigned to accommodate different analyticalneeds. The decision as to which method is moreappropriate in a given country cannot be made apriori. It depends on how well organized andimportant social security funds are and on theextent to which they are managed independentlyof the government units with which they areassociated. If the management of social securityfunds is so closely integrated with the short-ormedium-term requirements of the government'sgeneral economic policy that contributions andbenefits are deliberately adjusted in the interestsof overall economic policy, it becomes difficult,at a conceptual level, to draw any cleardistinction between the management of socialsecurity and the other economic functions ofgovernment. Alternatively, in some countries,social security funds may exist in only a veryrudimentary form. In either of thesecircumstances it is difficult to justify treatingsocial security funds as a separate sub-sector ona par with central, state and local government,
Annex / p. 10
and it is more appropriate to use the alternativemethod of sub~sectoring in which they aregrouped with the corresponding governmentunits at each level of government.
Paragraph 4.104, page 101 in “ System ofNational Accounts 1993"
4.104. Government units may be described as uniquekinds of legal entities established by politicalprocesses which have legislative, judicial orexecutive authority over other institutional unitswithin a given area. Viewed as institutional units,the principal functions of government are toassume responsibility for the provision of goodsand services to the community or to individualhouseholds and to finance their provision out oftaxation or other incomes; to redistribute incomeand wealth by means of transfers; and to engagein non-market production. In general terms:
(a) A government unit usually has the authority toraise funds by collecting taxes or compulsorytransfers from other institutional units. In order to
satisfy the basic requirements of aninstitutional unit in the System, agovernment unit -whether at the level ofthe nation, a region or a locality- musthave funds of its own either raised bytaxing other units or received as transfersfrom other government units and theauthority to disburse some, or all, of suchfunds in the pursuit of its policyobjectives. It must also be able to borrowfunds on its own account;
(b) Government units typically make threedifferent kinds of final outlays:
(i) The first group consists of actualor imputed expenditures on thefree provision to the community ofcollective services such as publicadministration, defence, lawenforcement, public health, etc.which, as a result of marketfailure, have to be organizedcollectively by governmentandfinanced out of general taxation orother income;
(ii) The second group consists ofexpenditures on the provision ofgoods or services free, or at pricesthat are not economicallysignificant, to individualhouseholds. These expendituresare deliberately incurred andfinanced out of taxation or otherincome by government in thepursuit of its social or politicalobject ives, even thoughindividuals could be chargedaccording to their usage;
(iii) The third group consists oftransfers paid to other institutionalunits, mostly households, in orderto redistribute income or wealth.

1 Out of print
57
Annex 3: Sectoral working papers
Year Reference
New Technology in Banking and Insurance: 1985 SAP 4.1/WP.1Relative Provisions and Collective Agreements(Edith Epstein)
The Socio-Economic Implications of Structural 1985 SAP 2.1/WP.2Changes in Plantations in Asian Countries(K.N. Sircar, J.P. Sajhau, A. Navamukundan,R. Sukarja)1
The Socio-Economic Implications of Structural 1986 SAP 2.2/WP.3Changes in Plantations in African Countries(J.A. Lugogo, L.A. Msambichaka andM.S.D. Bagachwa, J.A. Dadson, K. Tano)
Las implicaciones socioeconómicas de los 1986 SAP 2.3/WP.4 cambios estructurales en las plantacionesde países de América latina y del Caribe(E. Torres-Rivas, M. Chiriboga, T.F. Clarke)
The Formulation and Implementation of Housing 1986 SAP 2.4/WP.5Policy in Sri Lanka: The origin andimplications of the "Million Houses Programme"(Marni Pigott)
Labour and Social Effects of Restructuring in 1986 SAP 1.1/WP.6the Iron and Steel Industry(Oleg Stepanov)
The Teller and the Terminal: The Effects of 1988 SAP 4.2/WP.7Computerisation on the Work and on theEmployment of Bank Tellers(Michael Bell)
Social and Economic Effects of El Cerrejon 1987 SAP 2.5/WP.8Coal Project in Colombia(James Jonish)
Income of Workers in the Hotel, Catering and 1987 SAP 6.1/WP.9Tourism Sector(A. Faymann)

2 Out of print
58
Social and Labour Effects of Computer-Aided 1987 SAP 1.2/WP.10Design and Computer-Aided Manufacturing (CAD/CAM), (Karl-H. Ebel and Erhard Ulrich)
La participation des femmes aux coopératives 1987 SAP 5.1/WP.11(D. Mavrogiannis)
La mobilisation de l’épargne rurale par les 1987 SAP 5.2/WP.12institutions de type coopératif et son impactsur le développement local dans sept paysafricains - synthèse de sept études de cas :Burkina Faso, Cameroun, Egypte, Nigeria, Rwanda,Togo, Zimbabwe(Gilbert Renard)
Rural Savings Mobilisation by Co-operative 1988 SAP 5.2/WP.12Institutions and its Impact on Local Developmentin Seven African Countries - Synthesis of SevenCase Studies: Burkina Faso, Cameroon, Egypt,Nigeria, Rwanda, Togo, Zimbabwe(Gilbert Renard)
Coopératives à buts multiples dans les régions 1987 SAP 5.3/WP.13rurales des pays en développement(Albert Benjacov)2
Social and Economic Conditions in Plantation 1988 SAP 2.6/WP.14Agriculture in Kenya - Proceedings of a TripartiteWorkshop organised by the InternationalLabour Office at Egerton University College,Njoro, Kenya, 4 - 8 May 1987(J.P. Sajhau)
Productivity and its Impact on Employment and on 1988 SAP 1.3/WP.15the Working and Living Conditions of Iron andSteel Workers(Oleg Stepanov)
Social and Economic Implications of Tea 1989 SAP 2.7/WP.16Processing - The Experiences of India and Kenya(B. Sivaram and G.A. Orao Obura)
Economic and Social Implications of Sugar Cane 1989 SAP 2.8/WP.17Processing in Developing Countries(T. Hannah, International Sugar Organization)
Social and Labour Consequences of Economic and 1989 SAP 2.9/WP.18Technological Change in Civil Aviation(A. Gil)
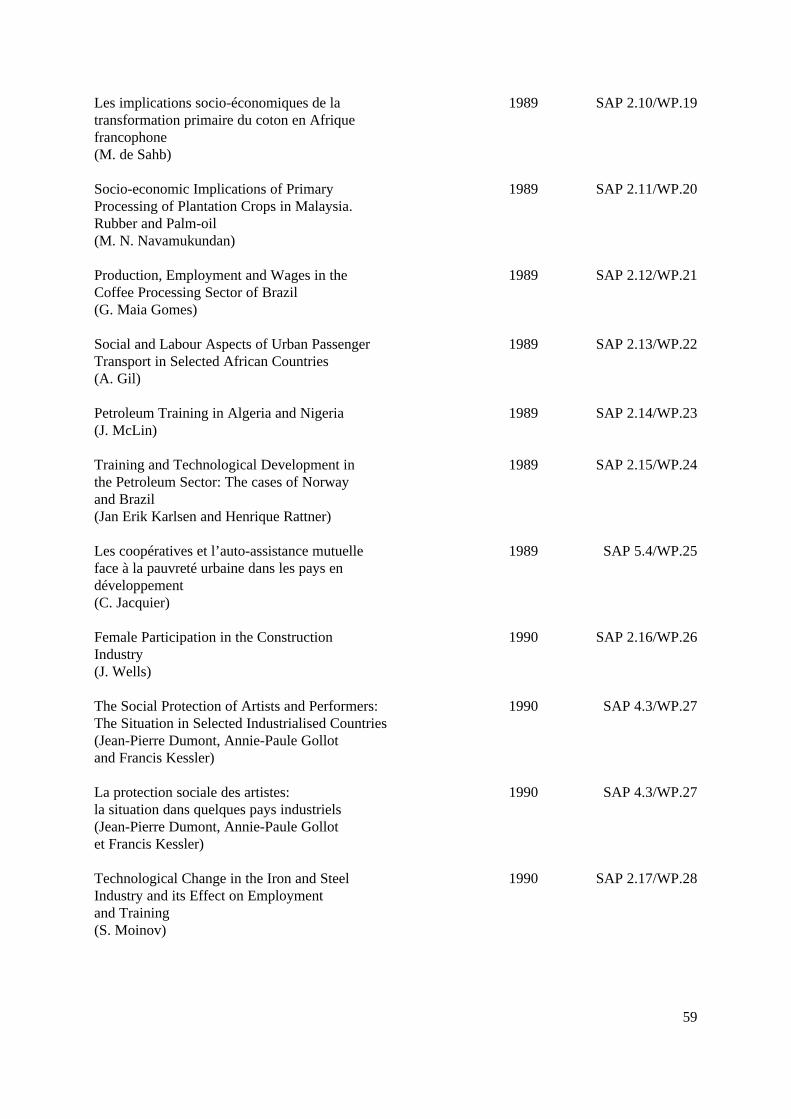
59
Les implications socio-économiques de la 1989 SAP 2.10/WP.19transformation primaire du coton en Afriquefrancophone(M. de Sahb)
Socio-economic Implications of Primary 1989 SAP 2.11/WP.20Processing of Plantation Crops in Malaysia.Rubber and Palm-oil(M. N. Navamukundan)
Production, Employment and Wages in the 1989 SAP 2.12/WP.21Coffee Processing Sector of Brazil(G. Maia Gomes)
Social and Labour Aspects of Urban Passenger 1989 SAP 2.13/WP.22Transport in Selected African Countries(A. Gil)
Petroleum Training in Algeria and Nigeria 1989 SAP 2.14/WP.23(J. McLin)
Training and Technological Development in 1989 SAP 2.15/WP.24the Petroleum Sector: The cases of Norwayand Brazil(Jan Erik Karlsen and Henrique Rattner)
Les coopératives et l’auto-assistance mutuelle 1989 SAP 5.4/WP.25face à la pauvreté urbaine dans les pays endéveloppement(C. Jacquier)
Female Participation in the Construction 1990 SAP 2.16/WP.26Industry(J. Wells)
The Social Protection of Artists and Performers: 1990 SAP 4.3/WP.27The Situation in Selected Industrialised Countries(Jean-Pierre Dumont, Annie-Paule Gollotand Francis Kessler)
La protection sociale des artistes: 1990 SAP 4.3/WP.27la situation dans quelques pays industriels(Jean-Pierre Dumont, Annie-Paule Gollotet Francis Kessler)
Technological Change in the Iron and Steel 1990 SAP 2.17/WP.28Industry and its Effect on Employmentand Training(S. Moinov)
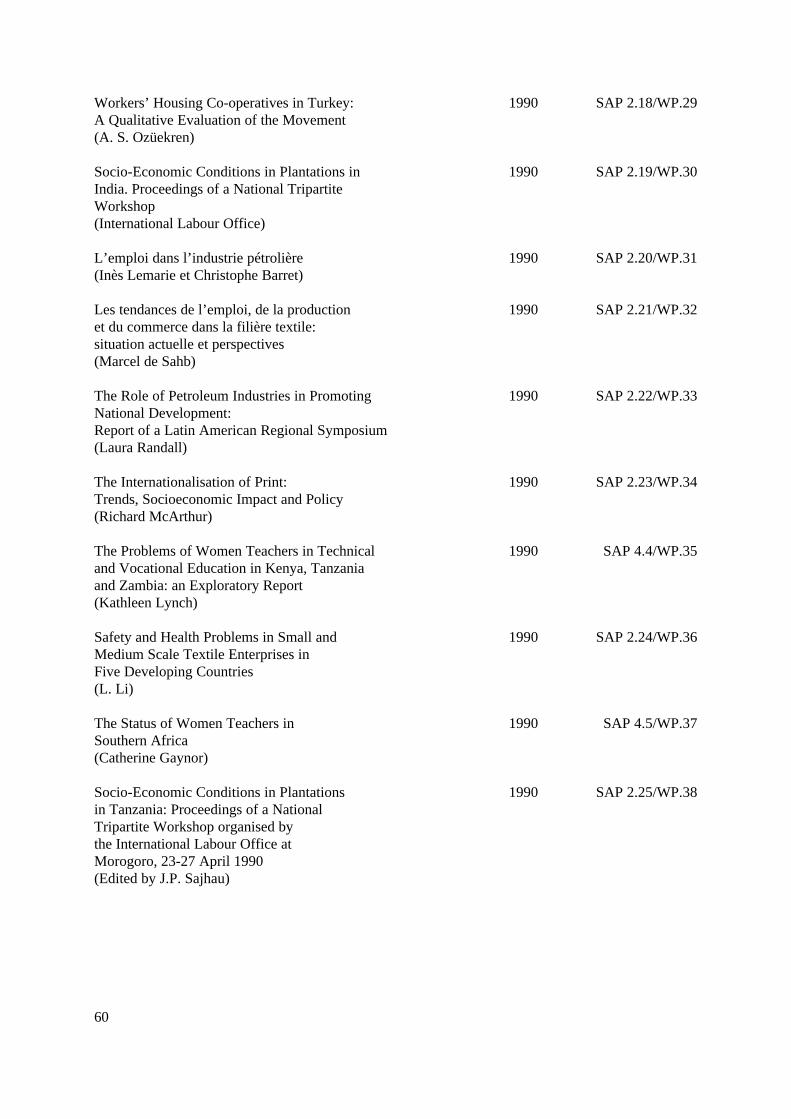
60
Workers’ Housing Co-operatives in Turkey: 1990 SAP 2.18/WP.29A Qualitative Evaluation of the Movement(A. S. Ozüekren)
Socio-Economic Conditions in Plantations in 1990 SAP 2.19/WP.30India. Proceedings of a National TripartiteWorkshop(International Labour Office)
L’emploi dans l’industrie pétrolière 1990 SAP 2.20/WP.31(Inès Lemarie et Christophe Barret)
Les tendances de l’emploi, de la production 1990 SAP 2.21/WP.32et du commerce dans la filière textile:situation actuelle et perspectives(Marcel de Sahb)
The Role of Petroleum Industries in Promoting 1990 SAP 2.22/WP.33National Development:Report of a Latin American Regional Symposium(Laura Randall)
The Internationalisation of Print: 1990 SAP 2.23/WP.34Trends, Socioeconomic Impact and Policy(Richard McArthur)
The Problems of Women Teachers in Technical 1990 SAP 4.4/WP.35and Vocational Education in Kenya, Tanzaniaand Zambia: an Exploratory Report(Kathleen Lynch)
Safety and Health Problems in Small and 1990 SAP 2.24/WP.36Medium Scale Textile Enterprises inFive Developing Countries(L. Li)
The Status of Women Teachers in 1990 SAP 4.5/WP.37Southern Africa(Catherine Gaynor)
Socio-Economic Conditions in Plantations 1990 SAP 2.25/WP.38in Tanzania: Proceedings of a NationalTripartite Workshop organised bythe International Labour Office atMorogoro, 23-27 April 1990(Edited by J.P. Sajhau)
61
Adjustment and Restructuring in Plantations: 1990 SAP 2.26/WP.39The Case of Sugar-cane in Mauritius andNegros Occidental (Philippines)(J.M. Paturau (Mauritius) andT.S. Untalan (Negros Occidental)
The communication of phonograms 1991 SAP 4.6/WP.40to the public: Remuneration ofperformers and producers(Pierre Chesnais)
Iron and Steel Producers: 1991 SAP 2.27/WP.41Fourteen of the Smaller Players(Stephan Moinov)
Professional and Managerial Staff: 1991 SAP 4.7/WP.42Their Place in the Labour Relations Systemof Canada and the United States(Michael Bendel)
Producers’ Small Scale Industrial Co-operatives 1991 SAP 5.5/WP.43Some Case Studies from Developing Countries(Malcolm Harper)
La condition de l’artiste 1991 SAP 4.8/WP.44(André Nayer and Suzanne Capiau)
Gestion des ressources humaines dans le 1991 SAP 4.9/WP.45secteur public: Réflexion méthodologique àpartir de l’étude de quelques projetsde coopération technique conduits par leBureau international du Travail(Joël Cauden et José Trouvé)
Labour Market Flexibility: 1991 SAP 4.10/WP.46The Challenge Facing Senior MedicalOfficers in New Zealand(Ian Powell)
Crise et assainissement des services 1991 SAP 4.11/WP.47publics africains. Le cas des servicesde fourniture d’eau et d’électricité etdes transports au Cameroun, Niger et Sénégal(Patrick Plane)
Manpower Aspects of Restructuring Railways 1991 SAP 2.28/WP.48in Developing Countries:A synthesis of six country case studies(A. Silverleaf)
62
Negotiating technological and structural 1992 SAP 4.12/WP.49change in Australia Post(R. Lansbury)
Women in scientific research in Australia: 1992 SAP 4.13/WP.50A case study(C. Macpherson)
Global information processing: The emergence 1992 SAP 4.14/WP.51of software services and data entry jobsin selected developing countries(S. Mitter and R. Pearson)
The construction industry in Brazil: Surviving 1992 SAP 2.29/WP.52the transition to a more competitive market(H. Zylberstajn)
Human resource management issues in developing 1992 SAP 2.30/WP.53country public enterprises (petroleum/chemicalsectors)(D.G.M. Cheshire)
The restructuring of the Japanese National 1992 SAP 2.31/WP.54Railways: Effects on labour and management(S. Watanabe)
El sector bancario argentino: El impacto de 1993 SAP 4.15/WP.55los cambios tecnologicos y estructurales sobre el trabajo y el empleo(J.C. Neffa)
An industry steels itself for change 1993 SAP 2.32/WP.56(S. Moinov)
Un atout pour la santé: La rémunération 1993 SAP 4.16/WP.57du personnel infirmier (A. Brihaye)
Les conditions d’emploi des travailleurs 1993 SAP 2.33/WP.58des plantations: Compte-rendu d’un ateliertripartite national(P. Egger)
Ajustement structurel, politiques agricoles 1993 SAP 2.34/WP.59et efforts d’adaptations paysannes en Côte d’Ivoire(M. Allechi, Y. Affou, D. Ngaresseum)
White-collar unionism in selected European 1993 SAP 4.17/WP.60countries: Issues and prospects(E. Kassalow)
63
Les enjeux des services bancaires: 1993 SAP 4.18/WP.61hommes, techniques et marchés(J. D’Alançon)
Occupational Safety and Health 1993 SAP 2.35/WP.62in the Food and Drink Industries(Shizue Tomoda)
Employed or Self-Employed? Contract Labour 1993 SAP 2.36/WP.63in the British Construction Industry(Julian Birch)
The effects of technological and structural 1993 SAP 4.19/WP.64changes on employment in major Irish banks(Noelle Donnelly)
La banque française en mutation: marché, 1993 SAP 4.20/WP.65profession, organisation, culture(E. Blaustein, M. Dressen)
Nurses’ pay: A vital factor in health care 1993 SAP 4.21/WP.66(A. Brihaye)
Part-time and temporary employees in the 1993 SAP 4.22/WP.67Public Service in Japan(Seiichiro Hayakawa)
La situación de las mujeres docentes en 1994 SAP 4.23/WP.68centroamérica: Hacia la igualdad deoportunidades y de trato(Mafalda Sibille Martina)
Por la remuneración equitativa del personal 1994 SAP 4.24/WP.69de enfermería(A. Brihaye)
Privatization of public services and public 1994 SAP 4.25/WP.70utilities(C. Oestmann)
Les droits syndicaux des cadres: Une perspective 1995 SAP 4.26/WP.71internationale(Claire Dupont-Sakharov et Laure Frexinos)
Consequences for Management and Personnel of the 1994 SAP 2.37/WP.72Reorganization of Railways in the RussianFederation - 1990-1992(Irene Valkova)

64
Trends and Perspectives in the Nursing 1995 SAP 4.27/WP.73Profession(Christine Hancock, James Buchan, Phil Gray;Cécile Fontaine; Sholom Glouberman;Tom Keighley)
Trade union rights of managerial staff: An 1995 SAP 4.28/WP.74international perspective(Claire Dupont-Sakharov and Laure Frexinos)
Los derechos sindicales del personal dirigente: 1995 SAP 4.29/WP.75una perspectiva internacional(Claire Dupont-Sakharov and Laure Frexinos)
Productivity, employment and industrial 1994 SAP 2.38/WP.76relations in coal minesTwo case studies from the Czech Republicand the Russian Federation(Edited by Norman S. Jennings)
Productivity, employment and industrial 1994 SAP 2.39/WP.77relations in coal minesThree case studies from China, India andZimbabwe(Edited by Norman S. Jennings)
Productivity, employment and industrial 1994 SAP 2.40/WP.78relations in coal minesThree case studies from Australia, UnitedKingdom, United States(Edited by Norman S. Jennings)
Atmospheric pollution control: How much 1994 SAP 2.41/WP.79of a threat to coal?(Sonja Boehmer-Christiansen)
Job satisfaction and decentralization: 1995 SAP 4.30/WP.80The effects of systemic change on Swedishcomprehensive school teachers from 1988to 1993(Roger Ellmin)
Contract labour in Malaysian plantation, 1995 SAP 2.42/WP.81construction and sawmilling industries:A survey report(Lee Kiong Hock and A. Sivananthiran)
Sectoral trends in world employment 1995 SAP 2.43/WP.82(Jaroslaw Wieczorek)

65
Les femmes enseignantes dans l’enseignement 1995 SAP 4.31/WP.83technique et professionnel au Bénin, enCôte d’Ivoire, au Mali, au Sénégal:Une étude comparative(Soledad Perez)
Occupational stress and burn-out of teachers: 1995 SAP 4.32/WP.84A review(Tom Cox and Amanda Griffiths)
Gender and employment on sugar cane 1995 SAP 2.44/WP.85plantations in Tanzania(Marjorie Mbilinyi with Ave Maria Semakafu)
Various forms of employment in the food and 1995 SAP 2.45/WP.86drink industries(Shizue Tomoda)
L’ajustement dans le secteur public et la 1995 SAP 4.33/WP.87gestion des ressources humaines:le cas du Sénégal(Abdoul Aziz Tall)
Privatization in Mauritius: Semi-privatization, 1995 SAP 4.34/WP.88Counter-privatization and Closure(P. Ujoodha)
L’ajustement structurel dans le secteur public 1995 SAP 4.35/WP.89et la gestion des ressources humaines:Le cas du Mali(Mohamed Moustapha Sissoko)
Document d’orientation sur les politiques 1995 SAP 4.36/WP.90de privatisation du secteur public(Alain Adérito Sanches)
Women workers in manufacturing, 1971-91 1995 SAP 2.46/WP.91(Shizue Tomoda)
Adjustment in the public sector and 1995 SAP 4.37/WP.92management of human resources in Mauritius(Raj Mudhoo)
Privatization in the iron and steel industry 1995 SAP 2.47/WP.93(Stephan Moinov)
Privatization and human resource issues in 1995 SAP 2.48/WP.94the Caribbean sugar industry(Clive Y. Thomas)

66
Foreign labour in the Malaysian construction 1995 SAP 2.49/WP.95industry(A.-R. Abdul-Aziz)
Recherche de la productivité et rentabilité 1995 SAP 4.38/WP.96dans le secteur bancaire: théorie, pratiqueset conséquences sur la gestion des ressourceshumaines(Edgar Blaustein et Marnix Dressen)
Proceso de privatización en Argentina y 1995 SAP 2.50/WP.97Brasil: Consecuencias en materia de mercadode trabajo y desempeño empresarialPracticas utilizadas para el ajuste de personal(Enrique Saravia)
Deregulation of Road Freight Transport: 1996 SAP 2.51/WP.98Labour Implications(Yukari Suzuki)
Improving working conditions and 1996 SAP 2.52/WP.99increasing profits in forestry(Kiki Johanssson and Bernt Strehlke)
ILO industrial committees and sectoral 1996 SAP 2.53/WP.100activities: An institutional history(Edward Weisband)
Productivity improvement and labour relations 1996 SAP 2.54/WP.101in the tea industry in South Asia(B. Sivaram)
Egalité des chances entre les hommes et les 1996 SAP 4.39/WP.102femmes des catégories cadres et professionnelles(J. Laufer)
Health care personnel in Central and 1996 SAP 4.40/WP.103Eastern Europe(J. Healy/C. Humphries)
Safety and health of meat, poultry and 1996 SAP 2.55/WP.104fish processing workers(S. Tomoda)
Labour migration in the construction industry in 1996 SAP 2.56/WP.105Latin America and the Caribbean(Edmundo Werna)
67
Foreign construction workers in Singapore - School of 1996 SAP 2.57/WP.106building & estate management - The National University of Singapore(George Ofori)
Ethique des affaires dans les industries THC 1997 SAP 2.58/WP.107(textile, habillement, chaussures):Les codes de conduite(J.P. Sajhau)
Health Care Personnel in Central 1997 SAP 4.41/WP.108and Eastern Europe (Russian version)(J. Healy/C. Humphries)
Responsible Care and related voluntary 1997 SAP 2.59/WP.109initiatives to improve enterprise performanceon health, safety and environment in thechemical industry(Kevin Munn)
Business ethics in the textile, clothing and 1997 SAP 2.60/WP.110footwear (TCF) industries: Codes of Conduct(J.P. Sajhau)
Trayectoria de modernización y calificación en la 1997 SAP 2.61/WP.111industria siderúrgica: Perspectivas para el Siglo 21Estudio de caso de una planta en México(Andrés Hernández, Anselmo García y Leornad Mertens)
Steel in the new millennium: Nine case studies 1997 SAP 2.62/WP.112(Edited by Norman S. Jennings)
People, Forest and Sustainability: Social Elements ofSustainable Forest Management in Europe 1997 SAP 2.63/WP.113(Proceedings)
Strategies to reach the top for women in management: 1997 SAP 4.42/WP.114Perspectives from ASEAN(Sieh Lee Mei Ling)
The impact of climate change policies 1997 SAP 2.64/WP.115on employment in the coalmining industry(Cain Polidano )
Breaking through the glass ceiling: Women 1998 SAP 4.43/WP.116in management in Poland(Anna Fotyga) (forthcoming)
68
Rompiendo el techo de cristal: las mujeres 1998 SAP 4.44/WP.117en puestos de dirección en Argentina(A.M. Mass, M.A. Saez, S. García y L. Cukierman) (forthcoming)
Breaking through the glass ceiling: Women 1998 SAP 4.45/WP.118in management in Argentina(A.M. Mass, M.A. Saez, S. García and L. Cukierman) (forthcoming)
Environmental protection and its employment 1998 SAP 2.65/WP.119effects on miners in small and artisanal mines in Zimbabwe(Marilyn Carr, David Laurence and Richard Svotwa)
The impact of globalization on the construction industry 1998 SAP 2.66/WP.120Activities of contractors and workers across borders(Ryo Kawano)
The machinery, electrical and electronic industries 1998 SAP 2.67/WP.121in numbers(Maryke Dessing and Olivier Mutter)
The Dutch flower sector: Structure, trends and employment 1998 SAP 2.68/WP.122(Paul Elshof)
Indigenous peoples and oil development: reconciling 1998 SAP 2.69/WP.123 conflicting interests(Manuela Tomei)
Current trends in the flexible organization of working time 1998 SAP 2.70/WP.124in Germany: A survey of recent internal agreements in theengineering industry(Christiane Lindecke and Steffen Lehndorff)
Survival of the flexibile in the global economy: 1998 SAP 2.71/WP.125Employment security and shopfloor re-organization in twoMassachusetts metalworking firms(Bob Forrant)
The impact of flexible labour market arrangements in the 1998 SAP 2.72/WP.126Australian metals and engineering industries(J. Buchanan)
Employment and industrial relations issues in thecigarette manufacturing industry 1998 SAP 2.73/WP.127(Miriam Szapiro)
Agrarian transition in Viet Nam 1999 SAP.2.74/WP.128(Vali Jamal and Karel Jansen)
69
Employment and working conditions in the Colombian 1999 SAP 2.75/WP.129flower industry(Stefano Farné)
Small-scale gold mining: 1999 SAP 2.76/WP.130Examples from Bolivia, Philippines & Zimbabwe(Edited by Norman S. Jennings)
Estudio sobre reestructuración portuaria - impacto social 1999 SAP 3.1/WP.131Puerto de Buenos Aires (Argentina)(Martín Sgut)
Estudio sobre reestructuración portuaria - impacto social 1999 SAP 3.2/WP.132Puerto de Valparaíso (Chile)(Rodrígo García Bernal)
Estudio sobre reestructuración portuaria - impacto social 1999 SAP 3.3/WP.133Puerto de Buenaventura (Colombia)(Gerardo Solano Gomez y Nazly Fontalvo de Zapata)
Estudio sobre reestructuración portuaria - impacto social 1999 SAP 3.4/WP.134Puerto del Callao (Perú)(Manuel Mogollón Venegas)
Estudio sobre reestructuración portuaria - impacto social 1999 SAP 3.5/WP.135Puerto de Veracruz (México)(Jaime R. Sanchez Diéz)
L’industrie du textile-habillement en Tunisie: 1999 SAP 2.77/WP.136Les besoins des chefs d’entreprise et les conditionsde travail des femmes dans les PME(Riad Meddeb)
Child labour in small-scale mining: 1999 SAP 2.78/WP.137Examples from Niger, Peru, & Philippines(Edited by Norman Jennings)
Employment and working conditions in the 1999 SAP 2.79/WP.138Ecuadorian flower industry(Zonia Palán & Carlos Palán)
The world cut flower industry:Trends and prospects 1999 SAP 2.80/WP.139(Gijsbert van Liemt)
Le travail des enfants dans les petites exploitations 1999 SAP 2.81/WP.140minières du Niger: cas des sites de natron, de sel,de gypse et d’orpaillage(Alfa Soumaila)

70
Trabajo infantil en el centro minero artesanal 1999 SAP 2.82/WP.141de Mollehuaca - Huanuhuanu - Arequipa - Perú(Zoila Martínez Castilla)
Estudio monográfico sobre la explotación minera 1999 SAP 2.83/WP.142pequeña - Ejemplo de San Simón (Bolivia)(Thomas Hentschel, Diógenes Roque y Evelyn Taucer)
Statistiques de l’emploi dans le secteur public: 1999 SAP 2.84/WP.143Méthodologie, structures et tendances(Messaoud Hammouya)
Statistics on Public Sector Employment 1999 SAP 2.84/WP.144Methodology, Structures et Trends(Messaoud Hammouya)