Statistical evaluation of the impact of ICT on Nigerian
17
International Journal of Education and Development using Information and Communication Technology (IJEDICT), 2012, Vol. 8, Issue 1, pp. 104-120. Statistical evaluation of the impact of ICT on Nigerian universities Iwasokun Gabriel Babatunde, Alese Boniface Kayode, Thompson Aderonke Favour Bethy Federal University of Technology, Akure, Nigeria Aranuwa Felix Ola Adekunle Ajasin University, Akungba, Nigeria ABSTRACT This paper proposes twenty-four performance indices that were freely considered by the authors as relevant for the conceptualization and evaluation of the impact of ICT on the Nigerian Universities. The indices are contained in the questionnaire that was administered on forty five out of sixty three public universities that span the six geo-political zones of Nigeria to obtain relevant data. Copies of the questionnaire were administered at meetings with staff and students. The data obtained were subjected to factor analysis by principal components using Statistical Package for Social Scientists (SPSS). From this analysis, four factors were extracted with different set of indices. The extracted factors are communication and feedback, study aid, processing and administration and management and relationship. The percentage contribution of each factor to the current performance of ICT in the university system in Nigeria was estimated. Each percentage contribution also exhibits the degree of relevance of the associated indices. It was discovered that the total sum of the percentage contributions was less than 100. This showed that the performance indices of some extraneous factors which contribute in no small measure to the current performance of ICT in Nigerian universities were not given consideration in the research instrument. Such extraneous factors include but not limited to staff training, security of lives and properties, discipline among staff and student, curriculum and government policy on ICT. Moreover, a factor scores coefficient matrix was generated and used to estimate and rank the contribution of each respondent to the performance figure. Keywords: Nigerian Universities, Information Communication Technology, Model, Factor Analysis, Performance INTRODUCTION Nigeria as a developing country is currently experiencing rapid transformation in the various sectors of her economy. Rapid growth is being experienced with the participation of both public and private organizations in the Information and Communication Technology (ICT) sector. This has continued to pave way for ICT as a tool for finding, exploring, analyzing, exchanging and presenting information responsibly and without discrimination. (UNDP 2007) reported that ICT is presently a veritable tool for quick access to ideas and experiences from a wide range of people, communities and cultures and also offers solid support for improved and enhanced service delivery. Selected parameters for measuring the overall contributions of ICT to the university educational system in Nigeria are taken based on their support for quick access to information, improved response time, increased usefulness, greater reliability, availability and so on (Wescott et al 2007, Dinusha et al 2007, SUACC 2002 & Okele 1986). Such support could be in areas such as lecture delivery, private studies, information disseminations, program (conferences and seminars) planning and execution, communication at different levels, crises prevention and management. With this array of interest areas, ICT has become a versatile tool for running a
Transcript of Statistical evaluation of the impact of ICT on Nigerian
International Journal of Education and Development using Information and Communication Technology (IJEDICT), 2012, Vol. 8, Issue 1, pp. 104-120.
Statistical evaluation of the impact of ICT on Nigerian universities
Iwasokun Gabriel Babatunde, Alese Boniface Kayode, Thompson Aderonke Favour Bethy
Federal University of Technology, Akure, Nigeria
Aranuwa Felix Ola Adekunle Ajasin University, Akungba, Nigeria
ABSTRACT This paper proposes twenty-four performance indices that were freely considered by the authors as relevant for the conceptualization and evaluation of the impact of ICT on the Nigerian Universities. The indices are contained in the questionnaire that was administered on forty five out of sixty three public universities that span the six geo-political zones of Nigeria to obtain relevant data. Copies of the questionnaire were administered at meetings with staff and students. The data obtained were subjected to factor analysis by principal components using Statistical Package for Social Scientists (SPSS). From this analysis, four factors were extracted with different set of indices. The extracted factors are communication and feedback, study aid, processing and administration and management and relationship. The percentage contribution of each factor to the current performance of ICT in the university system in Nigeria was estimated. Each percentage contribution also exhibits the degree of relevance of the associated indices. It was discovered that the total sum of the percentage contributions was less than 100. This showed that the performance indices of some extraneous factors which contribute in no small measure to the current performance of ICT in Nigerian universities were not given consideration in the research instrument. Such extraneous factors include but not limited to staff training, security of lives and properties, discipline among staff and student, curriculum and government policy on ICT. Moreover, a factor scores coefficient matrix was generated and used to estimate and rank the contribution of each respondent to the performance figure. Keywords: Nigerian Universities, Information Communication Technology, Model, Factor Analysis, Performance INTRODUCTION Nigeria as a developing country is currently experiencing rapid transformation in the various sectors of her economy. Rapid growth is being experienced with the participation of both public and private organizations in the Information and Communication Technology (ICT) sector. This has continued to pave way for ICT as a tool for finding, exploring, analyzing, exchanging and presenting information responsibly and without discrimination. (UNDP 2007) reported that ICT is presently a veritable tool for quick access to ideas and experiences from a wide range of people, communities and cultures and also offers solid support for improved and enhanced service delivery. Selected parameters for measuring the overall contributions of ICT to the university educational system in Nigeria are taken based on their support for quick access to information, improved response time, increased usefulness, greater reliability, availability and so on (Wescott et al 2007, Dinusha et al 2007, SUACC 2002 & Okele 1986). Such support could be in areas such as lecture delivery, private studies, information disseminations, program (conferences and seminars) planning and execution, communication at different levels, crises prevention and management. With this array of interest areas, ICT has become a versatile tool for running a
Statistical evaluation of the impact of ICT 105
smooth and efficient university system. Positive attitudes towards financing good ICT projects for the universities by major stakeholders such as government, parents and the private sectors is inevitably of paramount importance (AYIN 2006). In Bach et al (2011), factor analysis was used for measuring the effectiveness and usefulness of ICT in managements and investments. A special base model for the systematic study of the features, factors and delivered benefits was used for the analysis. Survey was employed as an instrument to operationalize the model. The results revealed that system quality, service quality, use, user satisfaction and net benefits are the underlying constructs that guide decision making and planning process for successful ICT implementations. In Akinyokun et al (2011), an evaluation of ICT projects performance in the public sector of the Nigerian economy was carried out. A questionnaire comprising of fifty three (53) performance indices of ICT projects was used for data collection and evaluation. Completed questionnaires were received from forty five (45) Federal Ministries, Departments and Agencies; thirty six (36) States and Federal Capital Territory (FCT); one model local government from each State; thirty seven (37) Universities; forty two (42) Polytechnics and forty three (43) Colleges of Education. The data collected were subjected to factor analysis by principal components using SPSS. The results obtained placed high premium on the involvement of users in the effective planning and implementation as well as efficient management of ICT projects. It was also reported that the approach to ICT projects’ planning, implementation and management should be evolutionary and allow for the active participation of the community of users. The main objective of the current study is to take a holistic view of the practical issues of the conceptualization of the impact of ICT and provides data that serve the basis for the determination of the contribution of some factors (extracted from some formulated indices) to its present level of performance in Nigerian universities. In addition, the study will also provides data that is relevant for drawing conclusion based on comparison between results from current and some related works. RESEARCH METHODOLOGY The Indices or variables used for evaluating the performance of ICT in Nigerian universities are numerous and are related to one another for the ith respondent in a general form as follows: where Ye represents the eth respondent, ae,f represents the assessment of the fth index by eth respondent, Xf represents the fth index and n is the number of indices. In this research, the method of factor analysis by principal components was used to generate some clusters of performance indices. Each cluster is a factor with its percentage contribution to the overall performance of ICT. The following statistics were derived and used to achieve this objective. a. Descriptive Statistics. b. Correlation Matrix. c. Bartlett’s and Kaiser-Mayer Olkin (KMO) tests. d. Communalities. e. Initial Factor loadings. f. Rotated factor loadings. g. Factor Score coefficient matrix. h. Eigenvalue.
106 IJEDICT
The descriptive statistics defined the mean and standard deviation of the scores of each decision variable given by the respondents. The correlation matrix showed the degree of pair-wise relationships of the performance indices. A positive value in the correlation showed a positive relationship while a negative value dictates a negative relationship. Zero value means there is no relationship between indices. The Bartlett’s test of sphericity is used to test the adequacy of the sample from the population. Another measure of sample adequacy is Kaiser-Mayer Olkin (KMO) test. In factor analysis, there is a set of factors which are generally referred to as “common factors”, each of which loads on some variables. There is another set of factors, which are extraneous to each of the variables. The proportion of the variance of a variable explained by the common factor is called the “communality” of the variable (Loehlin 1999 & Bryant and Yarnold 1995). The factor loading associated with a specific performance variable is the correlations between the factor and the variable’s standard scores. Each factor represents an area of generalization that is qualitatively distinct from that represented by another factor. The degree of generalization found between each variable and each factor is referred to as “factor loading”. The farther a loading is from zero in the positive direction, the more we can conclude the contribution of a variable to a factor. In SPSS, the component matrix can be rotated orthogonally by varimax, equamax, quartimax or promax for the purpose of establishing a high correlation between variables and factors. While the component score matrix of the factors is generated to evaluate the contributions of each of the variables to the performance of the university system, the eigenvalue and percentage variance of the extracted factors are generated for evaluating the contribution of each factor (Iwasokun and Akingbesote, 2007). DATA SURVEY AND COLLECTION The questionnaire shown in Appendix 1 was designed using the performance indices of ICT formulated by the researchers. Each of the formulated performance indices was offered loose linguistic representation and range of values as shown in Table 1. Table 1: Matrix of the Weight Attached to Linguistic value
Linguistic Representation
Excellent Very Good
Good Average Poor
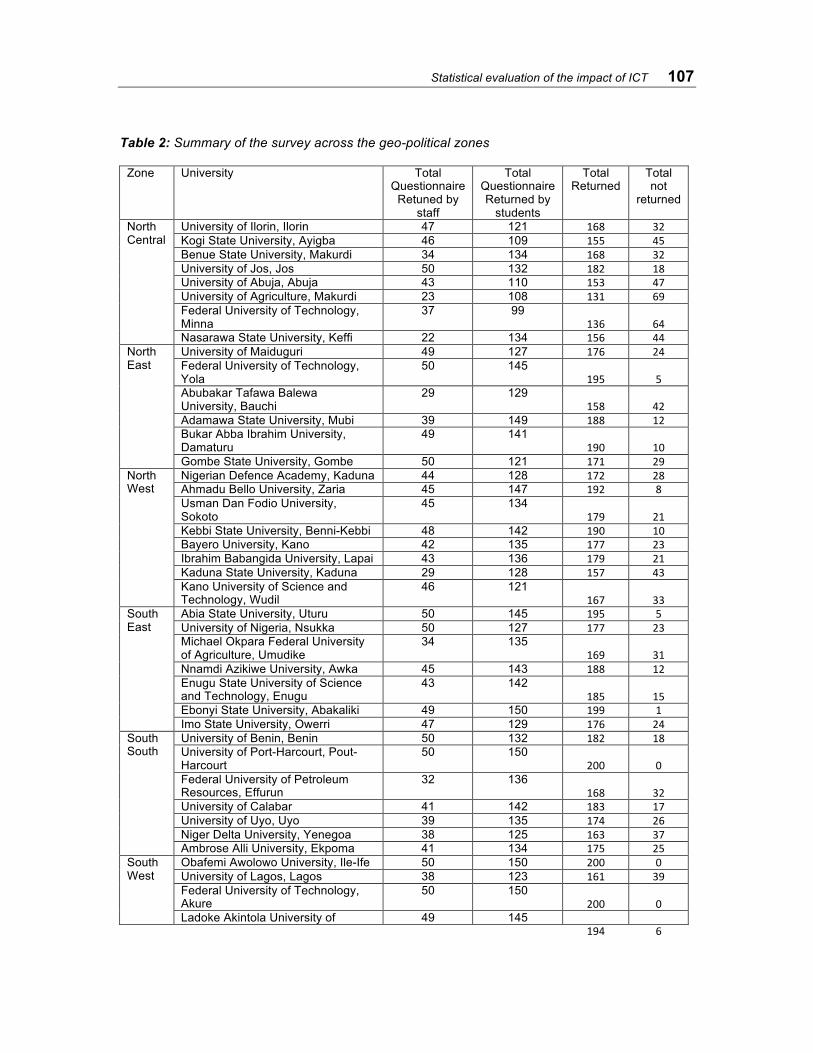
Range of Values 4.01-5.0 3.01-4.0 2.01-3.0 1.01-2.0 0.0-1.0 The questionnaire served as the research instrument and its first part provides vital information about each respondent while the second part provides five columns where a respondent can rank each of the twenty four indices as ‘Excellent’, ‘Very Good’, “Good’, ’Average’ or ‘Poor’. The questionnaire was administered to forty five out of sixty three (NUC, 2010) public (government) universities selected across the six geo-political zones of Nigeria. A total of fifty (50) staff and one hundred and fifty (150) students were surveyed in each university. The summary of the number of questionnaires that were duly completed and returned is presented in Table 2.
Statistical evaluation of the impact of ICT 107
Table 2: Summary of the survey across the geo-political zones
Zone University Total Questionnaire
Retuned by staff
Total Questionnaire Returned by
students
Total Returned
Total not
returned
University of Ilorin, Ilorin 47 121 168 32 Kogi State University, Ayigba 46 109 155 45 Benue State University, Makurdi 34 134 168 32 University of Jos, Jos 50 132 182 18 University of Abuja, Abuja 43 110 153 47 University of Agriculture, Makurdi 23 108 131 69 Federal University of Technology, Minna
37 99 136 64
North Central
Nasarawa State University, Keffi 22 134 156 44 University of Maiduguri 49 127 176 24 Federal University of Technology, Yola
50 145 195 5
Abubakar Tafawa Balewa University, Bauchi
29 129 158 42
Adamawa State University, Mubi 39 149 188 12 Bukar Abba Ibrahim University, Damaturu
49 141 190 10
North East
Gombe State University, Gombe 50 121 171 29 Nigerian Defence Academy, Kaduna 44 128 172 28 Ahmadu Bello University, Zaria 45 147 192 8 Usman Dan Fodio University, Sokoto
45 134 179 21
Kebbi State University, Benni-Kebbi 48 142 190 10 Bayero University, Kano 42 135 177 23 Ibrahim Babangida University, Lapai 43 136 179 21 Kaduna State University, Kaduna 29 128 157 43
North West
Kano University of Science and Technology, Wudil
46 121 167 33
Abia State University, Uturu 50 145 195 5 University of Nigeria, Nsukka 50 127 177 23 Michael Okpara Federal University of Agriculture, Umudike
34 135 169 31
Nnamdi Azikiwe University, Awka 45 143 188 12 Enugu State University of Science and Technology, Enugu
43 142 185 15
Ebonyi State University, Abakaliki 49 150 199 1
South East
Imo State University, Owerri 47 129 176 24 University of Benin, Benin 50 132 182 18 University of Port-Harcourt, Pout-Harcourt
50 150 200 0
Federal University of Petroleum Resources, Effurun
32 136 168 32
University of Calabar 41 142 183 17 University of Uyo, Uyo 39 135 174 26 Niger Delta University, Yenegoa 38 125 163 37
South South
Ambrose Alli University, Ekpoma 41 134 175 25 Obafemi Awolowo University, Ile-Ife 50 150 200 0 University of Lagos, Lagos 38 123 161 39 Federal University of Technology, Akure
50 150 200 0
South West
Ladoke Akintola University of 49 145 194 6
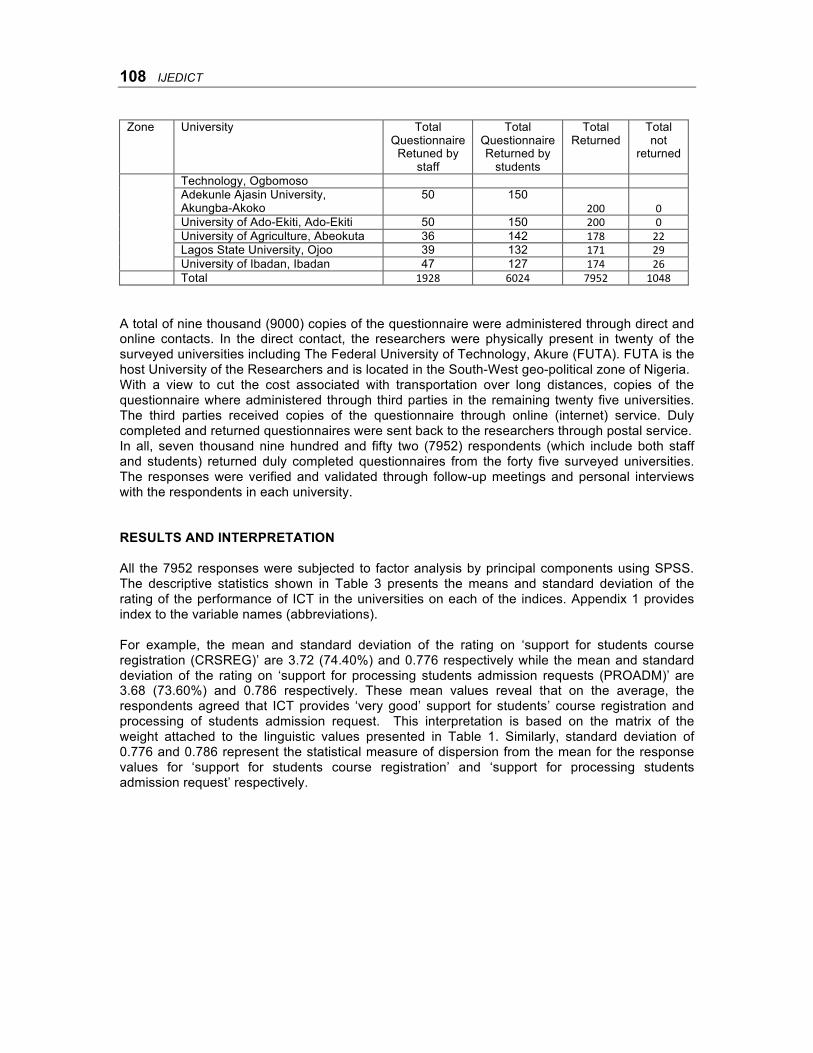
108 IJEDICT
Zone University Total Questionnaire
Retuned by staff
Total Questionnaire Returned by
students
Total Returned
Total not
returned
Technology, Ogbomoso Adekunle Ajasin University, Akungba-Akoko
50 150 200 0
University of Ado-Ekiti, Ado-Ekiti 50 150 200 0 University of Agriculture, Abeokuta 36 142 178 22 Lagos State University, Ojoo 39 132 171 29
University of Ibadan, Ibadan 47 127 174 26 Total 1928 6024 7952 1048
A total of nine thousand (9000) copies of the questionnaire were administered through direct and online contacts. In the direct contact, the researchers were physically present in twenty of the surveyed universities including The Federal University of Technology, Akure (FUTA). FUTA is the host University of the Researchers and is located in the South-West geo-political zone of Nigeria. With a view to cut the cost associated with transportation over long distances, copies of the questionnaire where administered through third parties in the remaining twenty five universities. The third parties received copies of the questionnaire through online (internet) service. Duly completed and returned questionnaires were sent back to the researchers through postal service. In all, seven thousand nine hundred and fifty two (7952) respondents (which include both staff and students) returned duly completed questionnaires from the forty five surveyed universities. The responses were verified and validated through follow-up meetings and personal interviews with the respondents in each university. RESULTS AND INTERPRETATION All the 7952 responses were subjected to factor analysis by principal components using SPSS. The descriptive statistics shown in Table 3 presents the means and standard deviation of the rating of the performance of ICT in the universities on each of the indices. Appendix 1 provides index to the variable names (abbreviations). For example, the mean and standard deviation of the rating on ‘support for students course registration (CRSREG)’ are 3.72 (74.40%) and 0.776 respectively while the mean and standard deviation of the rating on ‘support for processing students admission requests (PROADM)’ are 3.68 (73.60%) and 0.786 respectively. These mean values reveal that on the average, the respondents agreed that ICT provides ‘very good’ support for students’ course registration and processing of students admission request. This interpretation is based on the matrix of the weight attached to the linguistic values presented in Table 1. Similarly, standard deviation of 0.776 and 0.786 represent the statistical measure of dispersion from the mean for the response values for ‘support for students course registration’ and ‘support for processing students admission request’ respectively.
Statistical evaluation of the impact of ICT 109
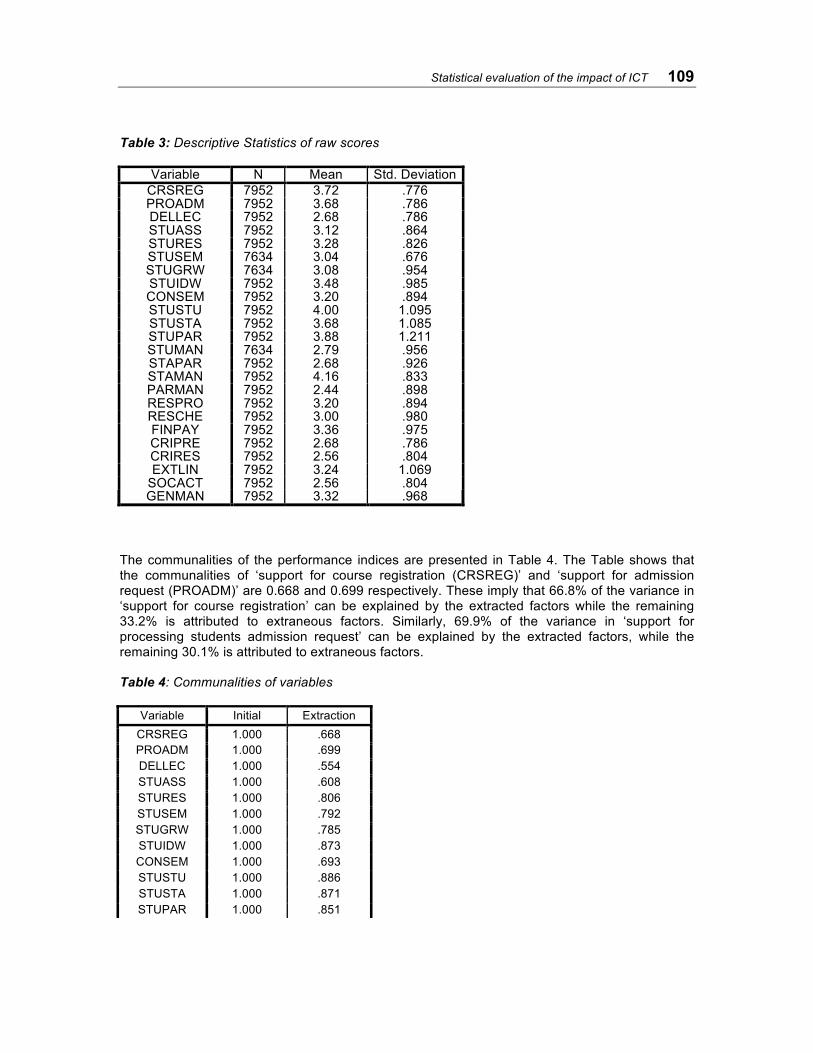
Table 3: Descriptive Statistics of raw scores
Variable N Mean Std. Deviation CRSREG 7952 3.72 .776 PROADM 7952 3.68 .786 DELLEC 7952 2.68 .786 STUASS 7952 3.12 .864 STURES 7952 3.28 .826 STUSEM 7634 3.04 .676 STUGRW 7634 3.08 .954 STUIDW 7952 3.48 .985 CONSEM 7952 3.20 .894 STUSTU 7952 4.00 1.095 STUSTA 7952 3.68 1.085 STUPAR 7952 3.88 1.211 STUMAN 7634 2.79 .956 STAPAR 7952 2.68 .926 STAMAN 7952 4.16 .833 PARMAN 7952 2.44 .898 RESPRO 7952 3.20 .894 RESCHE 7952 3.00 .980 FINPAY 7952 3.36 .975 CRIPRE 7952 2.68 .786 CRIRES 7952 2.56 .804 EXTLIN 7952 3.24 1.069
SOCACT 7952 2.56 .804 GENMAN 7952 3.32 .968
The communalities of the performance indices are presented in Table 4. The Table shows that the communalities of ‘support for course registration (CRSREG)’ and ‘support for admission request (PROADM)’ are 0.668 and 0.699 respectively. These imply that 66.8% of the variance in ‘support for course registration’ can be explained by the extracted factors while the remaining 33.2% is attributed to extraneous factors. Similarly, 69.9% of the variance in ‘support for processing students admission request’ can be explained by the extracted factors, while the remaining 30.1% is attributed to extraneous factors. Table 4: Communalities of variables
Variable Initial Extraction CRSREG 1.000 .668 PROADM 1.000 .699 DELLEC 1.000 .554 STUASS 1.000 .608 STURES 1.000 .806 STUSEM 1.000 .792 STUGRW 1.000 .785 STUIDW 1.000 .873 CONSEM 1.000 .693 STUSTU 1.000 .886 STUSTA 1.000 .871 STUPAR 1.000 .851
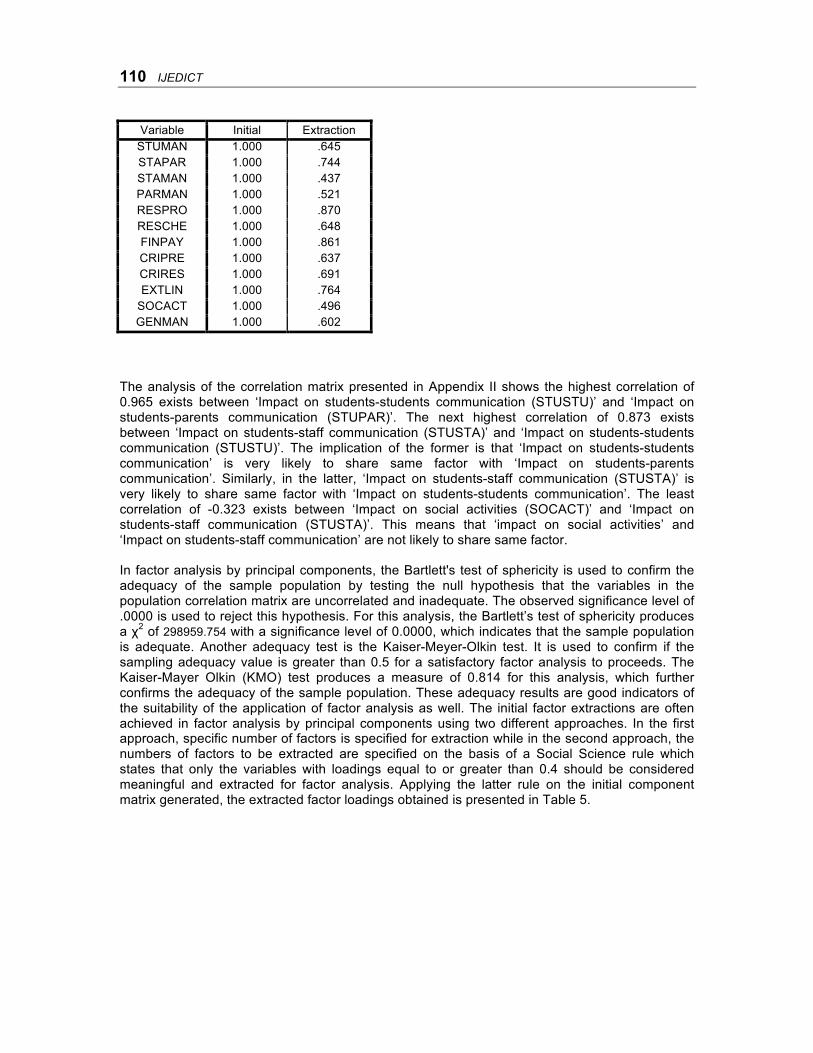
110 IJEDICT
Variable Initial Extraction STUMAN 1.000 .645 STAPAR 1.000 .744 STAMAN 1.000 .437 PARMAN 1.000 .521 RESPRO 1.000 .870 RESCHE 1.000 .648 FINPAY 1.000 .861 CRIPRE 1.000 .637 CRIRES 1.000 .691 EXTLIN 1.000 .764
SOCACT 1.000 .496 GENMAN 1.000 .602
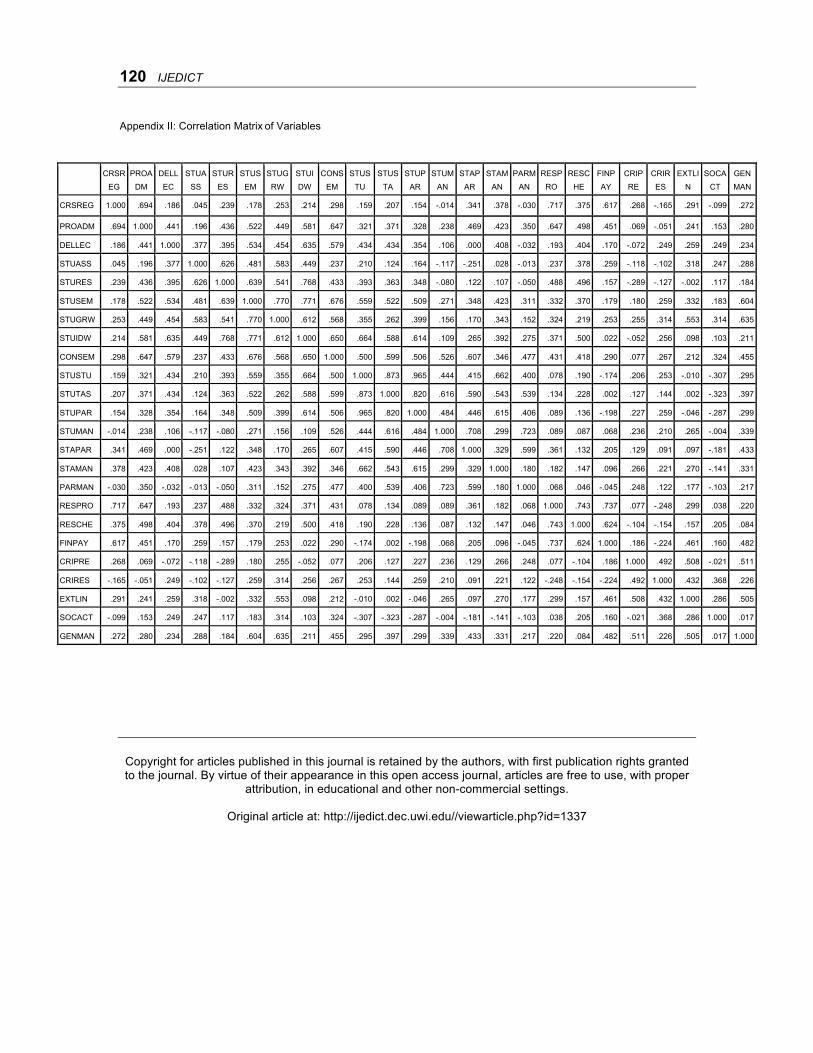
The analysis of the correlation matrix presented in Appendix II shows the highest correlation of 0.965 exists between ‘Impact on students-students communication (STUSTU)’ and ‘Impact on students-parents communication (STUPAR)’. The next highest correlation of 0.873 exists between ‘Impact on students-staff communication (STUSTA)’ and ‘Impact on students-students communication (STUSTU)’. The implication of the former is that ‘Impact on students-students communication’ is very likely to share same factor with ‘Impact on students-parents communication’. Similarly, in the latter, ‘Impact on students-staff communication (STUSTA)’ is very likely to share same factor with ‘Impact on students-students communication’. The least correlation of -0.323 exists between ‘Impact on social activities (SOCACT)’ and ‘Impact on students-staff communication (STUSTA)’. This means that ‘impact on social activities’ and ‘Impact on students-staff communication’ are not likely to share same factor. In factor analysis by principal components, the Bartlett's test of sphericity is used to confirm the adequacy of the sample population by testing the null hypothesis that the variables in the population correlation matrix are uncorrelated and inadequate. The observed significance level of .0000 is used to reject this hypothesis. For this analysis, the Bartlett’s test of sphericity produces a χ2 of 298959.754 with a significance level of 0.0000, which indicates that the sample population is adequate. Another adequacy test is the Kaiser-Meyer-Olkin test. It is used to confirm if the sampling adequacy value is greater than 0.5 for a satisfactory factor analysis to proceeds. The Kaiser-Mayer Olkin (KMO) test produces a measure of 0.814 for this analysis, which further confirms the adequacy of the sample population. These adequacy results are good indicators of the suitability of the application of factor analysis as well. The initial factor extractions are often achieved in factor analysis by principal components using two different approaches. In the first approach, specific number of factors is specified for extraction while in the second approach, the numbers of factors to be extracted are specified on the basis of a Social Science rule which states that only the variables with loadings equal to or greater than 0.4 should be considered meaningful and extracted for factor analysis. Applying the latter rule on the initial component matrix generated, the extracted factor loadings obtained is presented in Table 5.

Statistical evaluation of the impact of ICT 111
Table 5: Extracted factor loadings Variable Component 1 2 3 4 STUSEM .835 CONSEM .808 STUIDW .798 -.444 STUSTA .747 -.480 STUSTU .728 -.501 STUGRW .721 STUPAR .709 -.523 PROADM .662 GENMAN .606 .434 STAMAN .605 STURES .593 -.455 STAPAR .571 .536 DELLEC .557 -.476 CRSREG .459 PARMAN .450 -.450 FINPAY .643 .580 RESPRO .518 .604 .421 RESCHE .511 .553 STUMAN .498 -.508 STUASS .413 .462 -.458 EXTLIN .717 CRIRES .681 CRIPRE .412 .591 SOCACT .515 From Table 5, it is revealed that:
a. Four factors were extracted, b. Nineteen variables load on factor 1 c. Nine variables load on factor 2 d. Eight variables load on factor 3 e. Five variables load on factor 4
In order to obtain a meaningful representation of variables and factor mapping along principal axis, the resulted principal component is rotated using orthogonal transformation by varimax, promax, equamax and quartimax. However, the result obtained from the rotation by promax, which is presented in Table 6, appears to be most realistic and meaningful for interpretation among all others. Hence, it is used for the purpose of the analysis. Table 6 reveals four factors with their corresponding loadings.
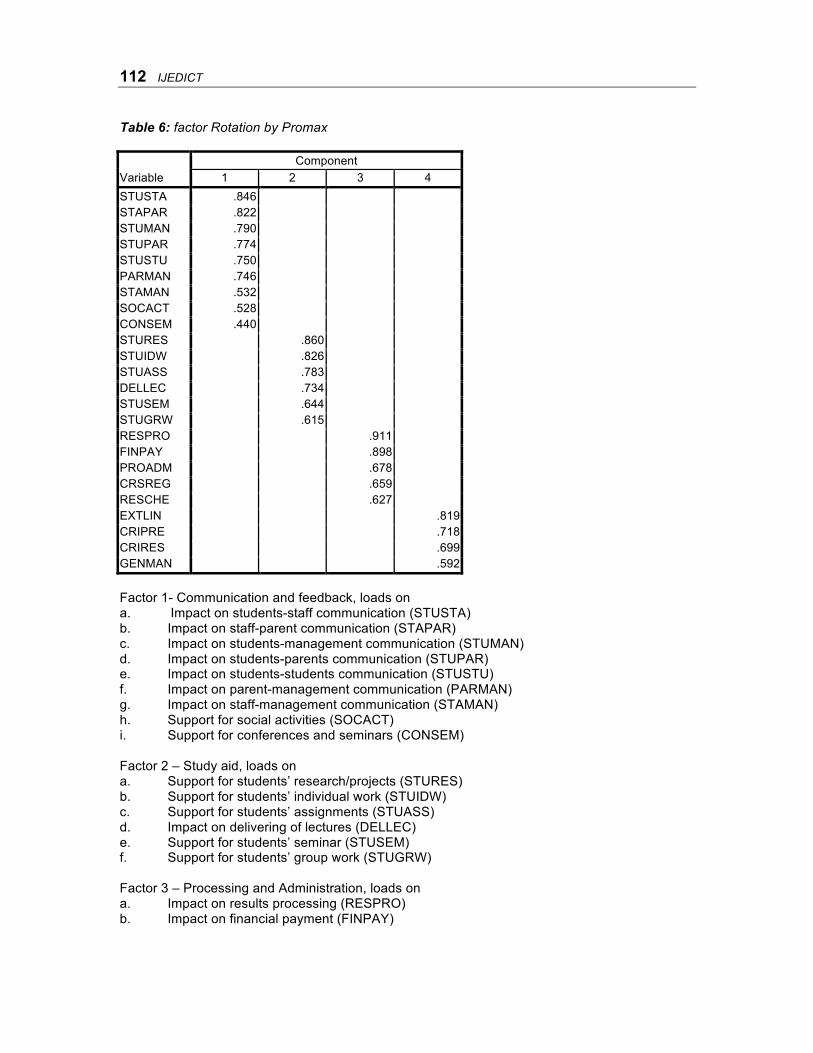
112 IJEDICT
Table 6: factor Rotation by Promax Component Variable 1 2 3 4 STUSTA .846 STAPAR .822 STUMAN .790 STUPAR .774 STUSTU .750 PARMAN .746 STAMAN .532 SOCACT .528 CONSEM .440 STURES .860 STUIDW .826 STUASS .783 DELLEC .734 STUSEM .644 STUGRW .615 RESPRO .911 FINPAY .898 PROADM .678 CRSREG .659 RESCHE .627 EXTLIN .819 CRIPRE .718 CRIRES .699 GENMAN .592 Factor 1- Communication and feedback, loads on a. Impact on students-staff communication (STUSTA) b. Impact on staff-parent communication (STAPAR) c. Impact on students-management communication (STUMAN) d. Impact on students-parents communication (STUPAR) e. Impact on students-students communication (STUSTU) f. Impact on parent-management communication (PARMAN) g. Impact on staff-management communication (STAMAN) h. Support for social activities (SOCACT) i. Support for conferences and seminars (CONSEM) Factor 2 – Study aid, loads on a. Support for students’ research/projects (STURES) b. Support for students’ individual work (STUIDW) c. Support for students’ assignments (STUASS) d. Impact on delivering of lectures (DELLEC) e. Support for students’ seminar (STUSEM) f. Support for students’ group work (STUGRW) Factor 3 – Processing and Administration, loads on a. Impact on results processing (RESPRO) b. Impact on financial payment (FINPAY)
Statistical evaluation of the impact of ICT 113
c. support for processing students’ admission request (PROADM) d. Support for students’ course registration (CRSREG) e. Impact on results checking (RESCHE) Factor 4 – Management and Relationship, loads on a. Impact on external linkages (EXTLIN) b. Impact on crises prevention (CRIPRE) c. Impact on crises resolution (CRIRES) d. Impact on general management (GENMAN)
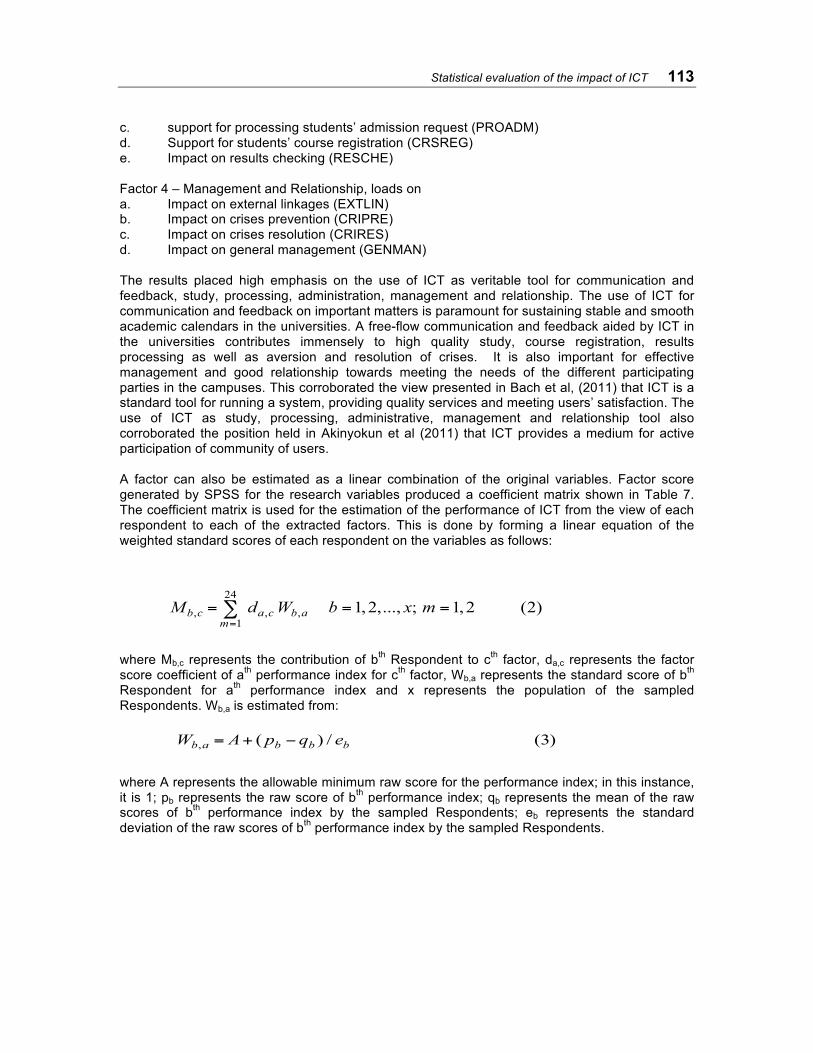
The results placed high emphasis on the use of ICT as veritable tool for communication and feedback, study, processing, administration, management and relationship. The use of ICT for communication and feedback on important matters is paramount for sustaining stable and smooth academic calendars in the universities. A free-flow communication and feedback aided by ICT in the universities contributes immensely to high quality study, course registration, results processing as well as aversion and resolution of crises. It is also important for effective management and good relationship towards meeting the needs of the different participating parties in the campuses. This corroborated the view presented in Bach et al, (2011) that ICT is a standard tool for running a system, providing quality services and meeting users’ satisfaction. The use of ICT as study, processing, administrative, management and relationship tool also corroborated the position held in Akinyokun et al (2011) that ICT provides a medium for active participation of community of users. A factor can also be estimated as a linear combination of the original variables. Factor score generated by SPSS for the research variables produced a coefficient matrix shown in Table 7. The coefficient matrix is used for the estimation of the performance of ICT from the view of each respondent to each of the extracted factors. This is done by forming a linear equation of the weighted standard scores of each respondent on the variables as follows: where Mb,c represents the contribution of bth Respondent to cth factor, da,c represents the factor score coefficient of ath performance index for cth factor, Wb,a represents the standard score of bth Respondent for ath performance index and x represents the population of the sampled Respondents. Wb,a is estimated from: where A represents the allowable minimum raw score for the performance index; in this instance, it is 1; pb represents the raw score of bth performance index; qb represents the mean of the raw scores of bth performance index by the sampled Respondents; eb represents the standard deviation of the raw scores of bth performance index by the sampled Respondents.
114 IJEDICT
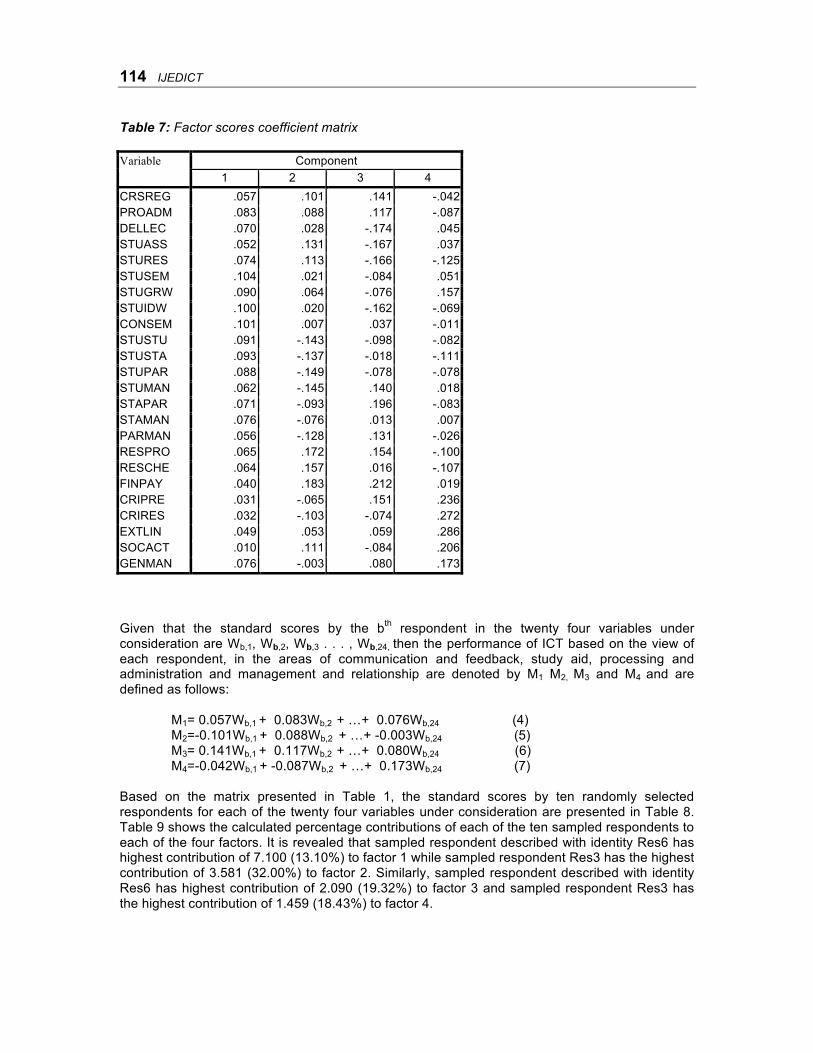
Table 7: Factor scores coefficient matrix Variable Component 1 2 3 4 CRSREG .057 .101 .141 -.042 PROADM .083 .088 .117 -.087 DELLEC .070 .028 -.174 .045 STUASS .052 .131 -.167 .037 STURES .074 .113 -.166 -.125 STUSEM .104 .021 -.084 .051 STUGRW .090 .064 -.076 .157 STUIDW .100 .020 -.162 -.069 CONSEM .101 .007 .037 -.011 STUSTU .091 -.143 -.098 -.082 STUSTA .093 -.137 -.018 -.111 STUPAR .088 -.149 -.078 -.078 STUMAN .062 -.145 .140 .018 STAPAR .071 -.093 .196 -.083 STAMAN .076 -.076 .013 .007 PARMAN .056 -.128 .131 -.026 RESPRO .065 .172 .154 -.100 RESCHE .064 .157 .016 -.107 FINPAY .040 .183 .212 .019 CRIPRE .031 -.065 .151 .236 CRIRES .032 -.103 -.074 .272 EXTLIN .049 .053 .059 .286 SOCACT .010 .111 -.084 .206 GENMAN .076 -.003 .080 .173 Given that the standard scores by the bth respondent in the twenty four variables under consideration are Wb,1, Wb,2, Wb,3 . . . , Wb,24, then the performance of ICT based on the view of each respondent, in the areas of communication and feedback, study aid, processing and administration and management and relationship are denoted by M1 M2, M3 and M4 and are defined as follows:
M1= 0.057Wb,1 + 0.083Wb,2 + …+ 0.076Wb,24 (4) M2=-0.101Wb,1 + 0.088Wb,2 + …+ -0.003Wb,24 (5)
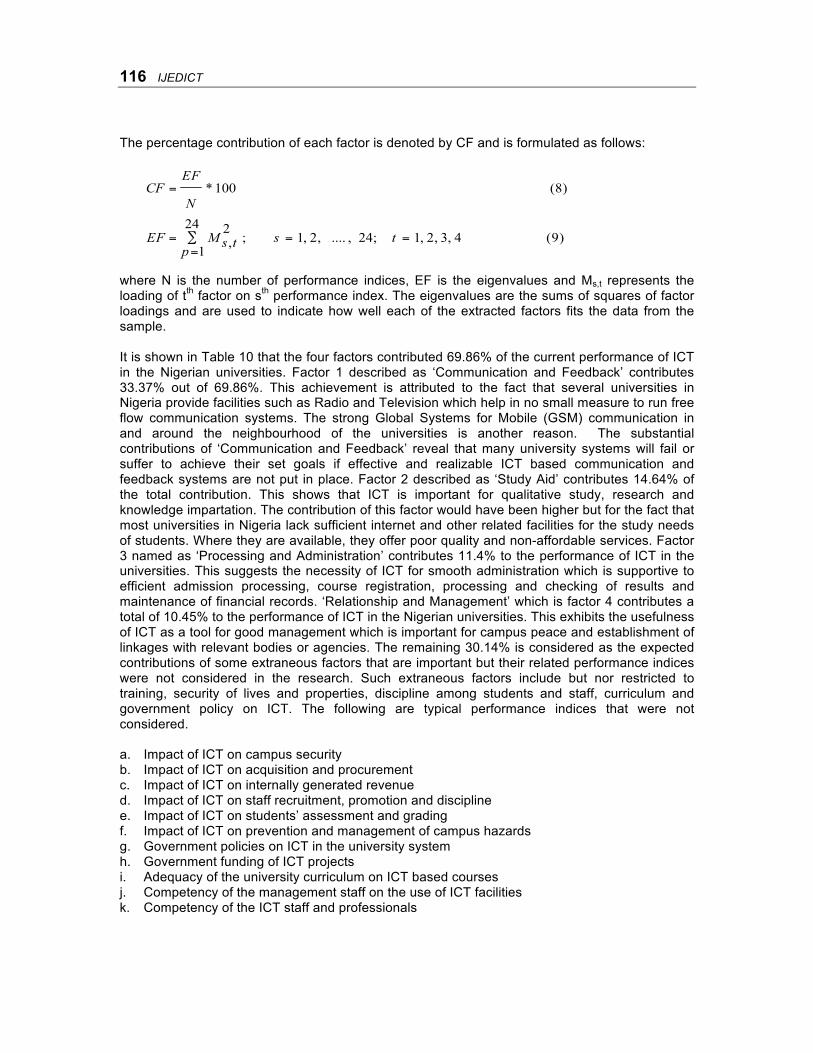
M3= 0.141Wb,1 + 0.117Wb,2 + …+ 0.080Wb,24 (6) M4=-0.042Wb,1 + -0.087Wb,2 + …+ 0.173Wb,24 (7) Based on the matrix presented in Table 1, the standard scores by ten randomly selected respondents for each of the twenty four variables under consideration are presented in Table 8. Table 9 shows the calculated percentage contributions of each of the ten sampled respondents to each of the four factors. It is revealed that sampled respondent described with identity Res6 has highest contribution of 7.100 (13.10%) to factor 1 while sampled respondent Res3 has the highest contribution of 3.581 (32.00%) to factor 2. Similarly, sampled respondent described with identity Res6 has highest contribution of 2.090 (19.32%) to factor 3 and sampled respondent Res3 has the highest contribution of 1.459 (18.43%) to factor 4.
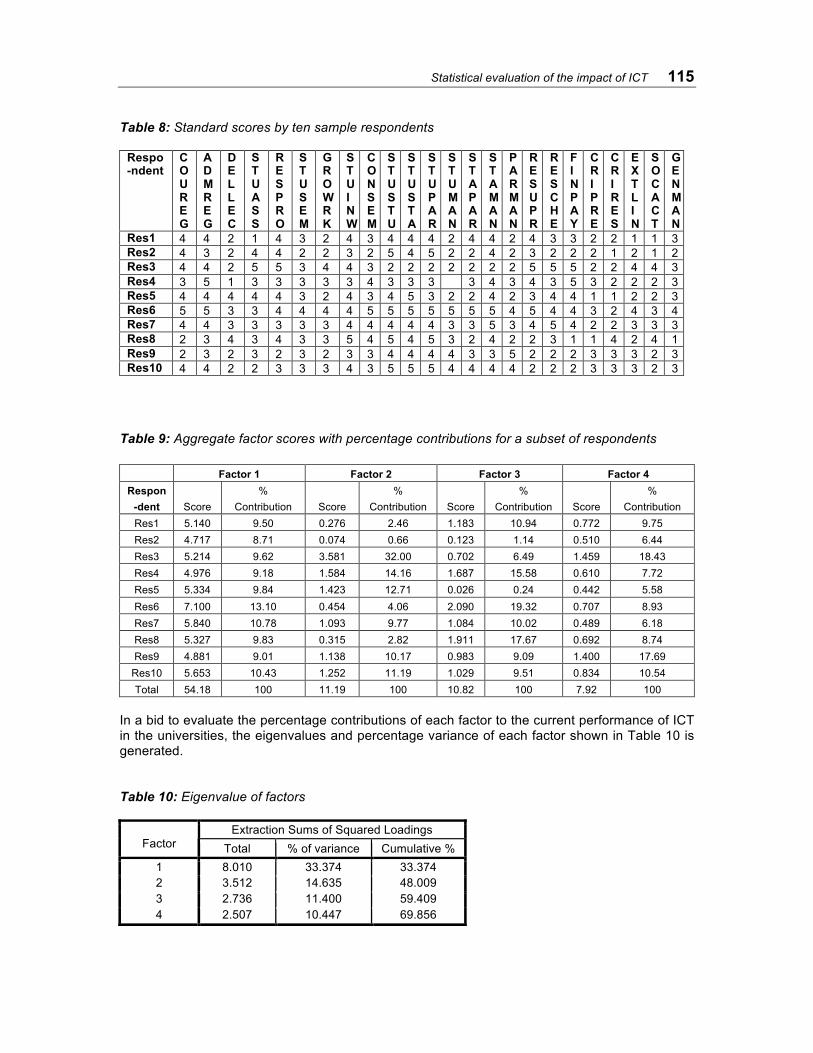
Statistical evaluation of the impact of ICT 115
Table 8: Standard scores by ten sample respondents
Respo-ndent
COUREG
ADMREG
DELLEC
ST UA SS
RESPRO
STUSEM
GROWRK
STUINW
CONSEM
STUSTU
STUSTA
STUPAR
STUMAN
STAPAR
STAMAN
PARMAN
RESUPR
RESCHE
FINPAY
CRIPRE
CRIRES
EXTLIN
SOCACT
GENMAN
Res1 4 4 2 1 4 3 2 4 3 4 4 4 2 4 4 2 4 3 3 2 2 1 1 3 Res2 4 3 2 4 4 2 2 3 2 5 4 5 2 2 4 2 3 2 2 2 1 2 1 2 Res3 4 4 2 5 5 3 4 4 3 2 2 2 2 2 2 2 5 5 5 2 2 4 4 3 Res4 3 5 1 3 3 3 3 3 4 3 3 3 3 4 3 4 3 5 3 2 2 2 3 Res5 4 4 4 4 4 3 2 4 3 4 5 3 2 2 4 2 3 4 4 1 1 2 2 3 Res6 5 5 3 3 4 4 4 4 5 5 5 5 5 5 5 4 5 4 4 3 2 4 3 4 Res7 4 4 3 3 3 3 3 4 4 4 4 4 3 3 5 3 4 5 4 2 2 3 3 3 Res8 2 3 4 3 4 3 3 5 4 5 4 5 3 2 4 2 2 3 1 1 4 2 4 1 Res9 2 3 2 3 2 3 2 3 3 4 4 4 4 3 3 5 2 2 2 3 3 3 2 3 Res10 4 4 2 2 3 3 3 4 3 5 5 5 4 4 4 4 2 2 2 3 3 3 2 3
Table 9: Aggregate factor scores with percentage contributions for a subset of respondents
Factor 1 Factor 2 Factor 3 Factor 4 Respon
-dent
Score %
Contribution
Score %
Contribution
Score %
Contribution
Score %
Contribution Res1 5.140 9.50 0.276 2.46 1.183 10.94 0.772 9.75 Res2 4.717 8.71 0.074 0.66 0.123 1.14 0.510 6.44 Res3 5.214 9.62 3.581 32.00 0.702 6.49 1.459 18.43 Res4 4.976 9.18 1.584 14.16 1.687 15.58 0.610 7.72 Res5 5.334 9.84 1.423 12.71 0.026 0.24 0.442 5.58 Res6 7.100 13.10 0.454 4.06 2.090 19.32 0.707 8.93 Res7 5.840 10.78 1.093 9.77 1.084 10.02 0.489 6.18 Res8 5.327 9.83 0.315 2.82 1.911 17.67 0.692 8.74 Res9 4.881 9.01 1.138 10.17 0.983 9.09 1.400 17.69
Res10 5.653 10.43 1.252 11.19 1.029 9.51 0.834 10.54 Total 54.18 100 11.19 100 10.82 100 7.92 100
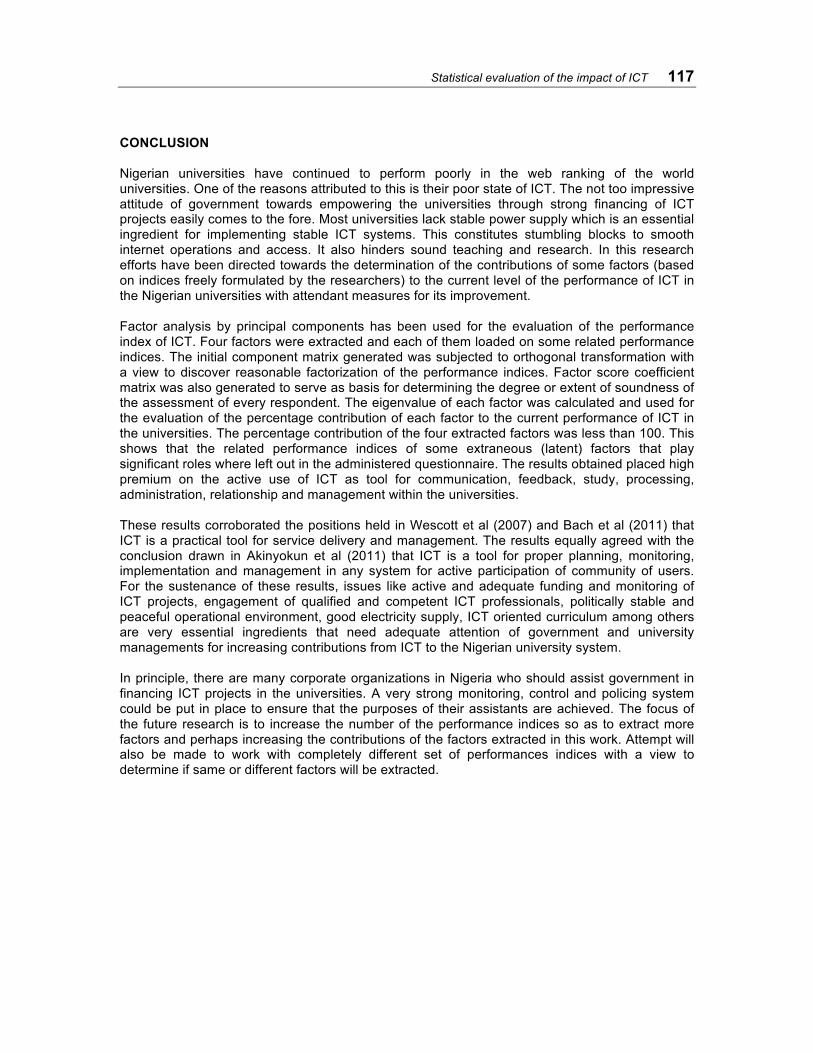
In a bid to evaluate the percentage contributions of each factor to the current performance of ICT in the universities, the eigenvalues and percentage variance of each factor shown in Table 10 is generated. Table 10: Eigenvalue of factors
Extraction Sums of Squared Loadings Factor Total % of variance Cumulative %
1 8.010 33.374 33.374 2 3.512 14.635 48.009 3 2.736 11.400 59.409 4 2.507 10.447 69.856
116 IJEDICT
The percentage contribution of each factor is denoted by CF and is formulated as follows: where N is the number of performance indices, EF is the eigenvalues and Ms,t represents the loading of tth factor on sth performance index. The eigenvalues are the sums of squares of factor loadings and are used to indicate how well each of the extracted factors fits the data from the sample. It is shown in Table 10 that the four factors contributed 69.86% of the current performance of ICT in the Nigerian universities. Factor 1 described as ‘Communication and Feedback’ contributes 33.37% out of 69.86%. This achievement is attributed to the fact that several universities in Nigeria provide facilities such as Radio and Television which help in no small measure to run free flow communication systems. The strong Global Systems for Mobile (GSM) communication in and around the neighbourhood of the universities is another reason. The substantial contributions of ‘Communication and Feedback’ reveal that many university systems will fail or suffer to achieve their set goals if effective and realizable ICT based communication and feedback systems are not put in place. Factor 2 described as ‘Study Aid’ contributes 14.64% of the total contribution. This shows that ICT is important for qualitative study, research and knowledge impartation. The contribution of this factor would have been higher but for the fact that most universities in Nigeria lack sufficient internet and other related facilities for the study needs of students. Where they are available, they offer poor quality and non-affordable services. Factor 3 named as ‘Processing and Administration’ contributes 11.4% to the performance of ICT in the universities. This suggests the necessity of ICT for smooth administration which is supportive to efficient admission processing, course registration, processing and checking of results and maintenance of financial records. ‘Relationship and Management’ which is factor 4 contributes a total of 10.45% to the performance of ICT in the Nigerian universities. This exhibits the usefulness of ICT as a tool for good management which is important for campus peace and establishment of linkages with relevant bodies or agencies. The remaining 30.14% is considered as the expected contributions of some extraneous factors that are important but their related performance indices were not considered in the research. Such extraneous factors include but nor restricted to training, security of lives and properties, discipline among students and staff, curriculum and government policy on ICT. The following are typical performance indices that were not considered. a. Impact of ICT on campus security b. Impact of ICT on acquisition and procurement c. Impact of ICT on internally generated revenue d. Impact of ICT on staff recruitment, promotion and discipline e. Impact of ICT on students’ assessment and grading f. Impact of ICT on prevention and management of campus hazards g. Government policies on ICT in the university system h. Government funding of ICT projects i. Adequacy of the university curriculum on ICT based courses j. Competency of the management staff on the use of ICT facilities k. Competency of the ICT staff and professionals
Statistical evaluation of the impact of ICT 117
CONCLUSION Nigerian universities have continued to perform poorly in the web ranking of the world universities. One of the reasons attributed to this is their poor state of ICT. The not too impressive attitude of government towards empowering the universities through strong financing of ICT projects easily comes to the fore. Most universities lack stable power supply which is an essential ingredient for implementing stable ICT systems. This constitutes stumbling blocks to smooth internet operations and access. It also hinders sound teaching and research. In this research efforts have been directed towards the determination of the contributions of some factors (based on indices freely formulated by the researchers) to the current level of the performance of ICT in the Nigerian universities with attendant measures for its improvement. Factor analysis by principal components has been used for the evaluation of the performance index of ICT. Four factors were extracted and each of them loaded on some related performance indices. The initial component matrix generated was subjected to orthogonal transformation with a view to discover reasonable factorization of the performance indices. Factor score coefficient matrix was also generated to serve as basis for determining the degree or extent of soundness of the assessment of every respondent. The eigenvalue of each factor was calculated and used for the evaluation of the percentage contribution of each factor to the current performance of ICT in the universities. The percentage contribution of the four extracted factors was less than 100. This shows that the related performance indices of some extraneous (latent) factors that play significant roles where left out in the administered questionnaire. The results obtained placed high premium on the active use of ICT as tool for communication, feedback, study, processing, administration, relationship and management within the universities. These results corroborated the positions held in Wescott et al (2007) and Bach et al (2011) that ICT is a practical tool for service delivery and management. The results equally agreed with the conclusion drawn in Akinyokun et al (2011) that ICT is a tool for proper planning, monitoring, implementation and management in any system for active participation of community of users. For the sustenance of these results, issues like active and adequate funding and monitoring of ICT projects, engagement of qualified and competent ICT professionals, politically stable and peaceful operational environment, good electricity supply, ICT oriented curriculum among others are very essential ingredients that need adequate attention of government and university managements for increasing contributions from ICT to the Nigerian university system. In principle, there are many corporate organizations in Nigeria who should assist government in financing ICT projects in the universities. A very strong monitoring, control and policing system could be put in place to ensure that the purposes of their assistants are achieved. The focus of the future research is to increase the number of the performance indices so as to extract more factors and perhaps increasing the contributions of the factors extracted in this work. Attempt will also be made to work with completely different set of performances indices with a view to determine if same or different factors will be extracted.
118 IJEDICT
REFERENCES African Youth ICT4D Network (AYIN), (2006,). ‘Harnessing information & knowledge for youth
development through education and skills development’ http://www.vliruos.be/downloads/IUS_evaluation_report_SUA.pdf (accessed 13th June, 2011
Akinyokun, O. C., Angaye, C. O. and Ubaru, M. O.,( 2011). Factor analysis of the performance
analysis of the performance Indices of information and communication technology projects in the public sector of the Nigerian economy. Journal of Technology Research, vol1, page 1-15
Bach, C., Belardo, S., Bajwa, H., Kantharaju, P. and Prasanth, O.( 2011). Factor analysis in
measuring information systems effectiveness. Proceedings of the 2011 ASEE Northeast Section Annual Conference, University of Hartford
Bryant, G and Yarnold, H. (1995) Principal components analysis and exploratory and
confirmatory factor analysis. In Grimm and Yarnold, Reading and understanding multivariate analysis. American Psychological Association Books.
Dinusha, V., Kavitha, G., Saatviga, S., Suganthini, F. and Thanuja, T. (2007). Information and
technology role. In HRM Functions’ Iwasokun, G. B. and Akingbesote, A. O.( 2007). Computer evaluation of the effects of
performance indices of public secondary schools. Science Research Annals, AAU, Akungba, Nigeria
Loehlin, J.C. (1992) Latent variable models. Erlbaum Associates, Hillsdale NJ United Nations Development Programme (UNDP), (2007).The Role of Governments in Promoting
ICT Access and Use by SMEs, considerations for public policy. APDIP eNote 12, http://www.apdip.net/apdipenote/12.pdf/, pp.1-4, (accessed 30th November, 2010)
National Universities Commission (NUC), ( May,2010) List of Nigerian Universities and Year
Founded. http://www.nuc.edu.ng/pages/universities.asp (accessed 12th May, 2010) Okele, A. N. (1986). Administering education in Nigeria: Problems and prospects. Heinemann
Educational Books. Sokoine University of Agriculture Computer Centre (SUACC) (2002). Information and
communication technology policy and guidelines. http://www.vliruos.be/downloads/IUS_evaluation_report_SUA.pdf, pp. 1-10, (accessed 10th January, 2011)
Wescott, C., Pizarro, M., and Schiavo-Campo, S. (2007), ‘The Role of information and
communication technology in improving public administration. http://www.adb.org/documents/manuals/serve_and_preserve/Chapter19.pdf, pp. 674-701, (accessed 23rd February, 2011)
Statistical evaluation of the impact of ICT 119
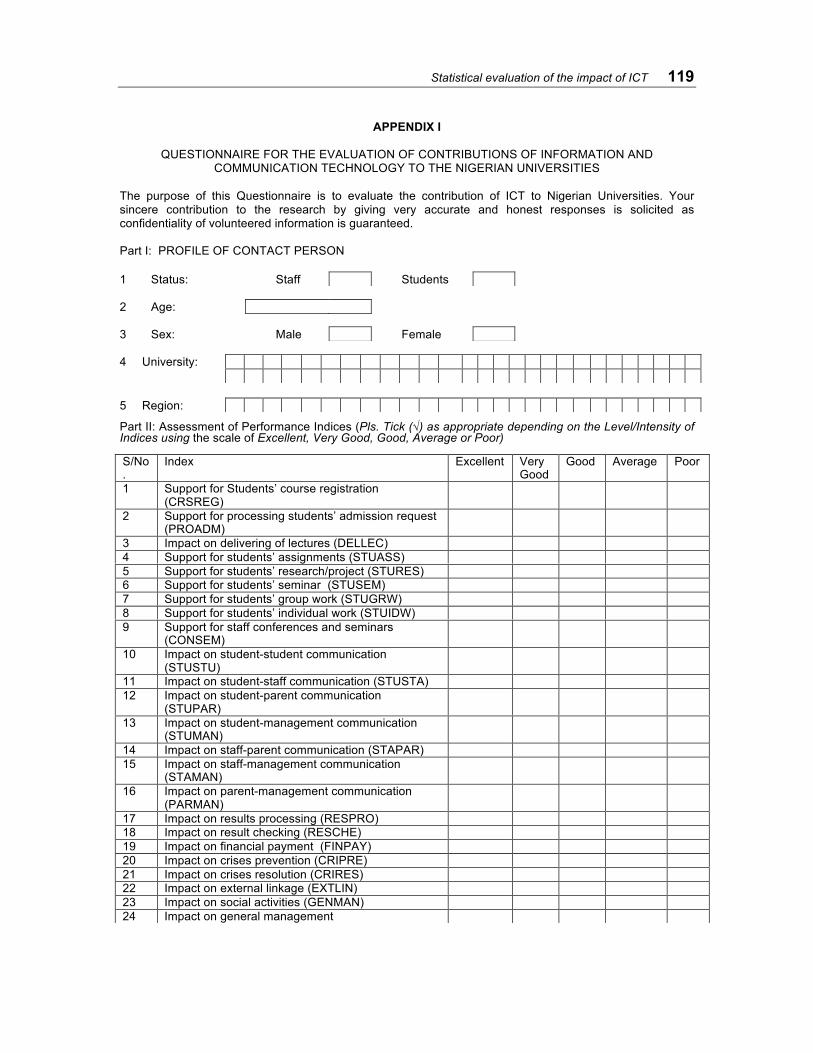
APPENDIX I
QUESTIONNAIRE FOR THE EVALUATION OF CONTRIBUTIONS OF INFORMATION AND COMMUNICATION TECHNOLOGY TO THE NIGERIAN UNIVERSITIES
The purpose of this Questionnaire is to evaluate the contribution of ICT to Nigerian Universities. Your sincere contribution to the research by giving very accurate and honest responses is solicited as confidentiality of volunteered information is guaranteed. Part I: PROFILE OF CONTACT PERSON
Part II: Assessment of Performance Indices (Pls. Tick (√) as appropriate depending on the Level/Intensity of Indices using the scale of Excellent, Very Good, Good, Average or Poor)
1 Status: Staff Students
2 Age:
3 Sex: Male Female
4 University:
5 Region:
S/No.
Index Excellent Very Good
Good Average Poor
1 Support for Students’ course registration (CRSREG)
2 Support for processing students’ admission request (PROADM)
3 Impact on delivering of lectures (DELLEC) 4 Support for students’ assignments (STUASS) 5 Support for students’ research/project (STURES) 6 Support for students’ seminar (STUSEM) 7 Support for students’ group work (STUGRW) 8 Support for students’ individual work (STUIDW) 9 Support for staff conferences and seminars
(CONSEM)
10 Impact on student-student communication (STUSTU)
11 Impact on student-staff communication (STUSTA) 12 Impact on student-parent communication
(STUPAR)
13 Impact on student-management communication (STUMAN)
14 Impact on staff-parent communication (STAPAR) 15 Impact on staff-management communication
(STAMAN)
16 Impact on parent-management communication (PARMAN)
17 Impact on results processing (RESPRO) 18 Impact on result checking (RESCHE) 19 Impact on financial payment (FINPAY) 20 Impact on crises prevention (CRIPRE) 21 Impact on crises resolution (CRIRES) 22 Impact on external linkage (EXTLIN) 23 Impact on social activities (GENMAN) 24 Impact on general management
120 IJEDICT
Appendix II: Correlation Matrix of Variables
CRSR
EG
PROA
DM
DELL
EC
STUA
SS
STUR
ES
STUS
EM
STUG
RW
STUI
DW
CONS
EM
STUS
TU
STUS
TA
STUP
AR
STUM
AN
STAP
AR
STAM
AN
PARM
AN
RESP
RO
RESC
HE
FINP
AY
CRIP
RE
CRIR
ES
EXTLI
N
SOCA
CT
GEN
MAN
CRSREG 1.000 .694 .186 .045 .239 .178 .253 .214 .298 .159 .207 .154 -.014 .341 .378 -.030 .717 .375 .617 .268 -.165 .291 -.099 .272
PROADM .694 1.000 .441 .196 .436 .522 .449 .581 .647 .321 .371 .328 .238 .469 .423 .350 .647 .498 .451 .069 -.051 .241 .153 .280
DELLEC .186 .441 1.000 .377 .395 .534 .454 .635 .579 .434 .434 .354 .106 .000 .408 -.032 .193 .404 .170 -.072 .249 .259 .249 .234
STUASS .045 .196 .377 1.000 .626 .481 .583 .449 .237 .210 .124 .164 -.117 -.251 .028 -.013 .237 .378 .259 -.118 -.102 .318 .247 .288
STURES .239 .436 .395 .626 1.000 .639 .541 .768 .433 .393 .363 .348 -.080 .122 .107 -.050 .488 .496 .157 -.289 -.127 -.002 .117 .184
STUSEM .178 .522 .534 .481 .639 1.000 .770 .771 .676 .559 .522 .509 .271 .348 .423 .311 .332 .370 .179 .180 .259 .332 .183 .604
STUGRW .253 .449 .454 .583 .541 .770 1.000 .612 .568 .355 .262 .399 .156 .170 .343 .152 .324 .219 .253 .255 .314 .553 .314 .635
STUIDW .214 .581 .635 .449 .768 .771 .612 1.000 .650 .664 .588 .614 .109 .265 .392 .275 .371 .500 .022 -.052 .256 .098 .103 .211
CONSEM .298 .647 .579 .237 .433 .676 .568 .650 1.000 .500 .599 .506 .526 .607 .346 .477 .431 .418 .290 .077 .267 .212 .324 .455
STUSTU .159 .321 .434 .210 .393 .559 .355 .664 .500 1.000 .873 .965 .444 .415 .662 .400 .078 .190 -.174 .206 .253 -.010 -.307 .295
STUTAS .207 .371 .434 .124 .363 .522 .262 .588 .599 .873 1.000 .820 .616 .590 .543 .539 .134 .228 .002 .127 .144 .002 -.323 .397
STUPAR .154 .328 .354 .164 .348 .509 .399 .614 .506 .965 .820 1.000 .484 .446 .615 .406 .089 .136 -.198 .227 .259 -.046 -.287 .299
STUMAN -.014 .238 .106 -.117 -.080 .271 .156 .109 .526 .444 .616 .484 1.000 .708 .299 .723 .089 .087 .068 .236 .210 .265 -.004 .339
STAPAR .341 .469 .000 -.251 .122 .348 .170 .265 .607 .415 .590 .446 .708 1.000 .329 .599 .361 .132 .205 .129 .091 .097 -.181 .433
STAMAN .378 .423 .408 .028 .107 .423 .343 .392 .346 .662 .543 .615 .299 .329 1.000 .180 .182 .147 .096 .266 .221 .270 -.141 .331
PARMAN -.030 .350 -.032 -.013 -.050 .311 .152 .275 .477 .400 .539 .406 .723 .599 .180 1.000 .068 .046 -.045 .248 .122 .177 -.103 .217
RESPRO .717 .647 .193 .237 .488 .332 .324 .371 .431 .078 .134 .089 .089 .361 .182 .068 1.000 .743 .737 .077 -.248 .299 .038 .220
RESCHE .375 .498 .404 .378 .496 .370 .219 .500 .418 .190 .228 .136 .087 .132 .147 .046 .743 1.000 .624 -.104 -.154 .157 .205 .084
FINPAY .617 .451 .170 .259 .157 .179 .253 .022 .290 -.174 .002 -.198 .068 .205 .096 -.045 .737 .624 1.000 .186 -.224 .461 .160 .482
CRIPRE .268 .069 -.072 -.118 -.289 .180 .255 -.052 .077 .206 .127 .227 .236 .129 .266 .248 .077 -.104 .186 1.000 .492 .508 -.021 .511
CRIRES -.165 -.051 .249 -.102 -.127 .259 .314 .256 .267 .253 .144 .259 .210 .091 .221 .122 -.248 -.154 -.224 .492 1.000 .432 .368 .226
EXTLIN .291 .241 .259 .318 -.002 .332 .553 .098 .212 -.010 .002 -.046 .265 .097 .270 .177 .299 .157 .461 .508 .432 1.000 .286 .505
SOCACT -.099 .153 .249 .247 .117 .183 .314 .103 .324 -.307 -.323 -.287 -.004 -.181 -.141 -.103 .038 .205 .160 -.021 .368 .286 1.000 .017
GENMAN .272 .280 .234 .288 .184 .604 .635 .211 .455 .295 .397 .299 .339 .433 .331 .217 .220 .084 .482 .511 .226 .505 .017 1.000
Copyright for articles published in this journal is retained by the authors, with first publication rights granted to the journal. By virtue of their appearance in this open access journal, articles are free to use, with proper
attribution, in educational and other non-commercial settings.
Original article at: http://ijedict.dec.uwi.edu//viewarticle.php?id=1337