STATISTICAL ANALYSIS AND CLASSIFICATION OF THE WATER ...
14
Romanian Reports in Physics 71, 716 (2019) STATISTICAL ANALYSIS AND CLASSIFICATION OF THE WATER PARAMETERS OF BEAS RIVER (INDIA) ALINA BARBULESCU 1 and ANITA DANI 2 1 “Ovidius” University of Constanta, Romania, 124 Mamaia Blvd., 900527, Constanta, Romania E-mail: [email protected] 2 Higher Colleges of Technology, Sharjah, United Arab Emirates E-mail: [email protected] Received September 3, 2019 Abstract. Historical secondary data for Beas River (India) were used to study the water parameters for a period of eight years at 23 hydrological stations. Similarity tests have been conducted for each parameter to examine the fluctuations at the stations and per years. An aggregated indicator of water quality (WA) was computed using the mean value of each parameter and two classification techniques were used for the analysis of river water quality data. Two-step clustering proved to be an appropriate technique to create three profiles of all data collected from the stations of Beas River for each year. C&RT technique was used to classify all stations based on the WA indicator. The approach can be employed for any data for taking documented decision about preservation and amelioration the water quality of different rivers. Key words: water quality, classification, aggregated indicator, statistical analysis. 1. INTRODUCTION Nowadays, pollution is one of the most important issues all over the world since it impacts the health of people life, the soil fertility and crops’ quality, so it is widely studied [1–5]. Particularly, consumption of polluted water can provoke different diseases as cholera, diarrhoea, dysentery, jaundice, tuberculosis that can affect the entire community in a region. Given the importance of freshwater for human life, scientists raised their concern about the accelerating diminishing of freshwater quality [6, 7] that has as sources the sewage discharge, industrial effluents and agricultural runoff. Effects of the water pollution on the eco-systems have also been studied by different authors [8]. In India, more than 70% of the fresh water can’t be used for consumption [9, 10]. The Ganges and the Yamuna are considered among the most polluted rivers in the world, the last one being covered with toxic foam provoked by industrial waste deposition [11]. The Report of Ministry of Environment & Forest [12] presents the situation of the water pollution in India, the trend of water quality in the main rivers’ basins, and the criteria for identification of polluted rivers [13]. Other studies
Transcript of STATISTICAL ANALYSIS AND CLASSIFICATION OF THE WATER ...
Romanian Reports in Physics 71, 716 (2019)
STATISTICAL ANALYSIS AND CLASSIFICATION OF THE WATER PARAMETERS OF BEAS RIVER (INDIA)
ALINA BARBULESCU1 and ANITA DANI2
1 “Ovidius” University of Constanta, Romania, 124 Mamaia Blvd., 900527, Constanta, Romania E-mail: [email protected]
2 Higher Colleges of Technology, Sharjah, United Arab Emirates E-mail: [email protected]
Received September 3, 2019
Abstract. Historical secondary data for Beas River (India) were used to study the water parameters for a period of eight years at 23 hydrological stations. Similarity tests have been conducted for each parameter to examine the fluctuations at the stations and per years. An aggregated indicator of water quality (WA) was computed using the mean value of each parameter and two classification techniques were used for the analysis of river water quality data. Two-step clustering proved to be an appropriate technique to create three profiles of all data collected from the stations of Beas River for each year. C&RT technique was used to classify all stations based on the WA indicator. The approach can be employed for any data for taking documented decision about preservation and amelioration the water quality of different rivers.
Key words: water quality, classification, aggregated indicator, statistical analysis.
1. INTRODUCTION
Nowadays, pollution is one of the most important issues all over the world since it impacts the health of people life, the soil fertility and crops’ quality, so it is widely studied [1–5]. Particularly, consumption of polluted water can provoke different diseases as cholera, diarrhoea, dysentery, jaundice, tuberculosis that can affect the entire community in a region. Given the importance of freshwater for human life, scientists raised their concern about the accelerating diminishing of freshwater quality [6, 7] that has as sources the sewage discharge, industrial effluents and agricultural runoff. Effects of the water pollution on the eco-systems have also been studied by different authors [8].
In India, more than 70% of the fresh water can’t be used for consumption [9, 10]. The Ganges and the Yamuna are considered among the most polluted rivers in the world, the last one being covered with toxic foam provoked by industrial waste deposition [11]. The Report of Ministry of Environment & Forest [12] presents the situation of the water pollution in India, the trend of water quality in the main rivers’ basins, and the criteria for identification of polluted rivers [13]. Other studies
Article no. 716 Alina Barbulescu, Anita Dani
2
contain the results of the analysis of the water quality of selected rivers in India [14–18].
According to international criteria, the water quality is assessed by using several parameters, as water temperature (T), pH, electrical conductivity (EC), dissolved oxygen (DO), biological oxygen demand 5 days at 20oC (BOD5), chemical oxygen demand (COD), total dissolved solids (TDS), total suspended solids (TSS), total phosphate, nitrite, nitrate, ammonia ions, heavy metals, total salt concentration, fecal coliform (FC) and total coliform (TC).
The water quality management in India is performed under the provision of Water (Prevention and Control of Pollution) Act, 1974 [19]. The Central Pollution Control Board introduced the concept of “designated best use”, for the classification of water bodies, based on the criteria: pH, DO, EC, BOD5, total coliform and fecal coliform. Accordingly, for drinking water source without conventional treatment, but after disinfection, pH should be between 6.5 and 8.5, DO at least 6 mg/l, BOD5 less than or equal to 2 mg/l and the total coliform organism MPN/200 ml shall be 50 or less. For drinking water source after conventional treatment and disinfection pH should be between 6 and 9, DO at least 4mg/l, BOD5 less than or equal to 3 mg/l, fecal coliform (MPN/100 ml) shall be less than 2500 MPN/100ml and the total coliform organism shall be 5000 MPN/100 ml or less [18].
pH represents the degree of acidity or alkalinity of a water sample. Dissolved oxygen represents the amount of total oxygen dissolved in a water body. Biochemical oxygen demand represents the quantity of oxygen required by aerobic microorganisms for complete degradation of organic waste from a water body. Thus, this is an indicator of organic pollution [14]. All the mentioned parameters are essential for water quality.
In this article we analyze the levels of some water parameters of Beas River recorded during a period of eight years (annual data) at 23 collection points and we classify the observation sites on each river function of the pollutants’ level. We apply two classification techniques used in data-mining for analysis of river water quality data-two-step clustering and classification & regression trees (C&RT). Two-step clustering is employed to create three profiles of the data collected from all stations of Beas River for each year, while the C&RT technique was used to classify all stations based on a common aggregated indicator introduced in the following.
2. METHODOLOGY
Data used in this study consists of the following water quality parameters for the Beas River (India): temperature, pH, DO, EC, BOD5, nitrate, FC, TC. Annual data (called secondary data) for the period 2007–2014, recorded at 23 hydrological stations, was downloaded from the site of ENVIS Centre on Control of Pollution Water, Air and Noise [9].
Statistical analysis and classification of the water parameters of Beas River Article no. 716
3
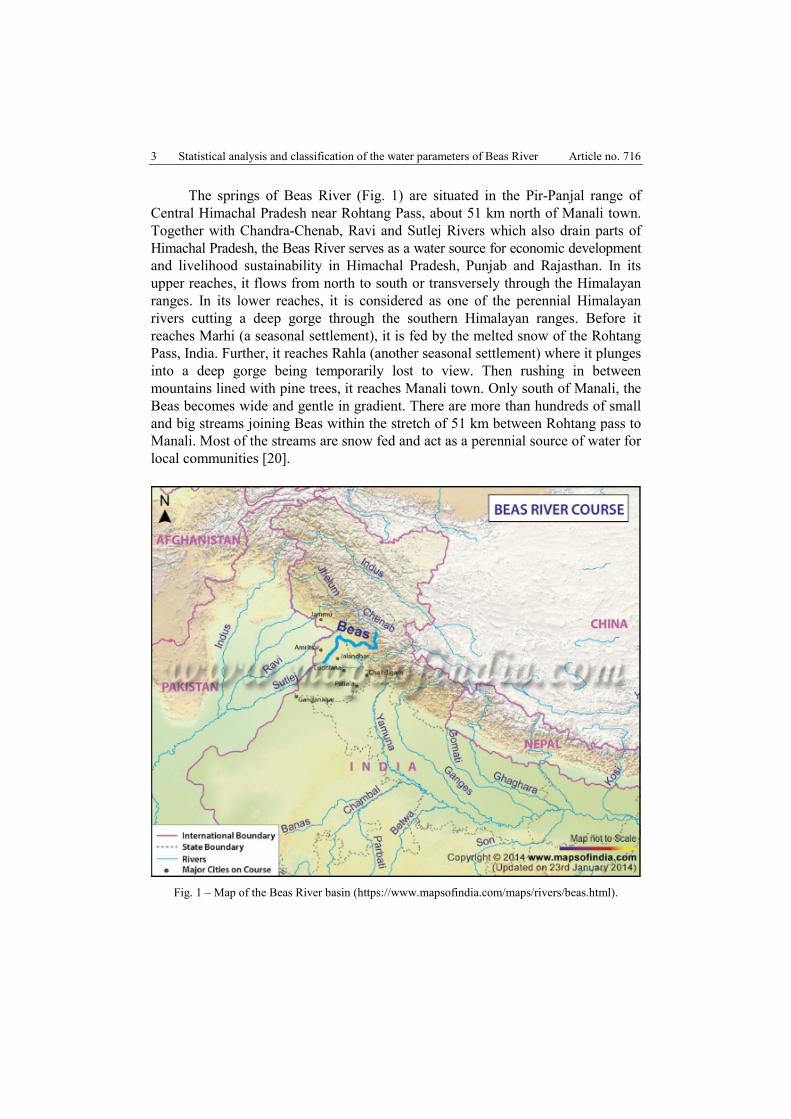
The springs of Beas River (Fig. 1) are situated in the Pir-Panjal range of Central Himachal Pradesh near Rohtang Pass, about 51 km north of Manali town. Together with Chandra-Chenab, Ravi and Sutlej Rivers which also drain parts of Himachal Pradesh, the Beas River serves as a water source for economic development and livelihood sustainability in Himachal Pradesh, Punjab and Rajasthan. In its upper reaches, it flows from north to south or transversely through the Himalayan ranges. In its lower reaches, it is considered as one of the perennial Himalayan rivers cutting a deep gorge through the southern Himalayan ranges. Before it reaches Marhi (a seasonal settlement), it is fed by the melted snow of the Rohtang Pass, India. Further, it reaches Rahla (another seasonal settlement) where it plunges into a deep gorge being temporarily lost to view. Then rushing in between mountains lined with pine trees, it reaches Manali town. Only south of Manali, the Beas becomes wide and gentle in gradient. There are more than hundreds of small and big streams joining Beas within the stretch of 51 km between Rohtang pass to Manali. Most of the streams are snow fed and act as a perennial source of water for local communities [20].
Fig. 1 – Map of the Beas River basin (https://www.mapsofindia.com/maps/rivers/beas.html).
Article no. 716 Alina Barbulescu, Anita Dani
4
To assess the homogeneity of each annual series of water parameters recorded at different observation points, their boxplots are plotted. Since the data series are not normally distributed, the non-parametric Kruskal-Wallis test on ranks [21] was used for testing the hypothesis that the subseries recorded at different stations come from the same distribution. If this hypothesis was rejected, the Conover-Iman test of multiple comparisons using rank sums was performed. The null hypothesis for the pairwise comparisons is that the probability of observing a randomly selected value from the first group that is larger than a randomly selected value from the second group equals one half [22]. The tests have been performed at a significance level of 5%. The null hypothesis was rejected if the computed p-value was less than 5%.
Three statistical methods were applied: clustering, computation of weighted average and classification & regression trees.
Nonpredictive clustering is a subjective process in nature which involves partitioning the data set into a number of subgroups on the basis of a measure of similarity such as the objects within a group have similar profiles and the objects’ profile within two different groups are different. Clustering algorithms divide the data into a number of clusters (groups, subsets, or categories), the similarity and dissimilarity being decided using a certain distance measure. Thus, the clusters are objectively created [23].
To determine the groups of hydrological stations with similar profiles, a cluster analysis is applied. Two-step clustering with the log-likelihood distance measure algorithm was applied to the normalized data, using SPSS software. Three clusters were determined defining differentiated profiles indicating different levels of water parameters. Based on the mean value of the water parameters in each cluster, three profiles were defined on the scale of Low, Medium, and High levels. These profiles were created for each year. Since the aim of the analysis is to explore the overall profile of the river for each year, the clustering algorithm was applied by taking mean values of all parameters for each year. Then, the Kruskal-Wallis test was performed to test the hypothesis that the parameters values significantly differ between the clusters. The use of the Kruskal-Wallis test is appropriate because the data doesn’t follow the normal distribution.
Even if data was available for 2007 and 2008, it was not included in the classification because there are missing values.
A weighted average method, inspired from [24], was used for getting an aggregated indicator of water quality, denoted in the following by WA.
To determine the weights for each water parameter (pi), the coefficients of variation (ai) were calculated for all stations overall years. Higher value of the variation coefficient of a water parameter implies higher fluctuations of the values of that parameter.
Standardized weights (bi) are calculated by:
Statistical analysis and classification of the water parameters of Beas River Article no. 716
5
1
100,ii n
ii
aba
(1)
where n is the number of parameters.
Then, the aggregated indicator of the water parameters is computed by:
_1WA n
i i meanib p
(2)
where pi_mean is the average of the values of the parameter pi.
Classification and Regression Trees (C&RT) involve a recursive and iterative procedure widely used in medicine, biology and psychology but not so commonly used in analysis of water quality data. This is a modelling technique which can be employed for both exploratory and predictive modelling. Other complex predictive modelling techniques, such as spatial-temporal analysis or neural networks require large samples with finest granularity, whereas C&RT is applicable to small sample sizes of minimum 10 events per variable to obtain a reasonable predictive modelling with stable performance [25].
Decision tree methodology is a commonly used data mining method for establishing classification systems based on multiple covariates or for developing prediction algorithms for a target variable. The decision tree is built using automatic stepwise variable selection to identify mutually exhaustive and exclusive subgroups of a population. This method classifies a population into branch-like segments that construct an inverted tree with a root node, internal nodes, and leaf nodes. The tree acts as a representation with terminal nodes (leaves) representing a cell of the partition, each with a simple model that applies to that cell only. Each node is split through the best variable, maximizing the purity of the resulting nodes. The algorithm is non-parametric and can efficiently deal with large datasets without imposing a complicated parametric structure [25–27].
2. RESULTS AND DISCUSSION
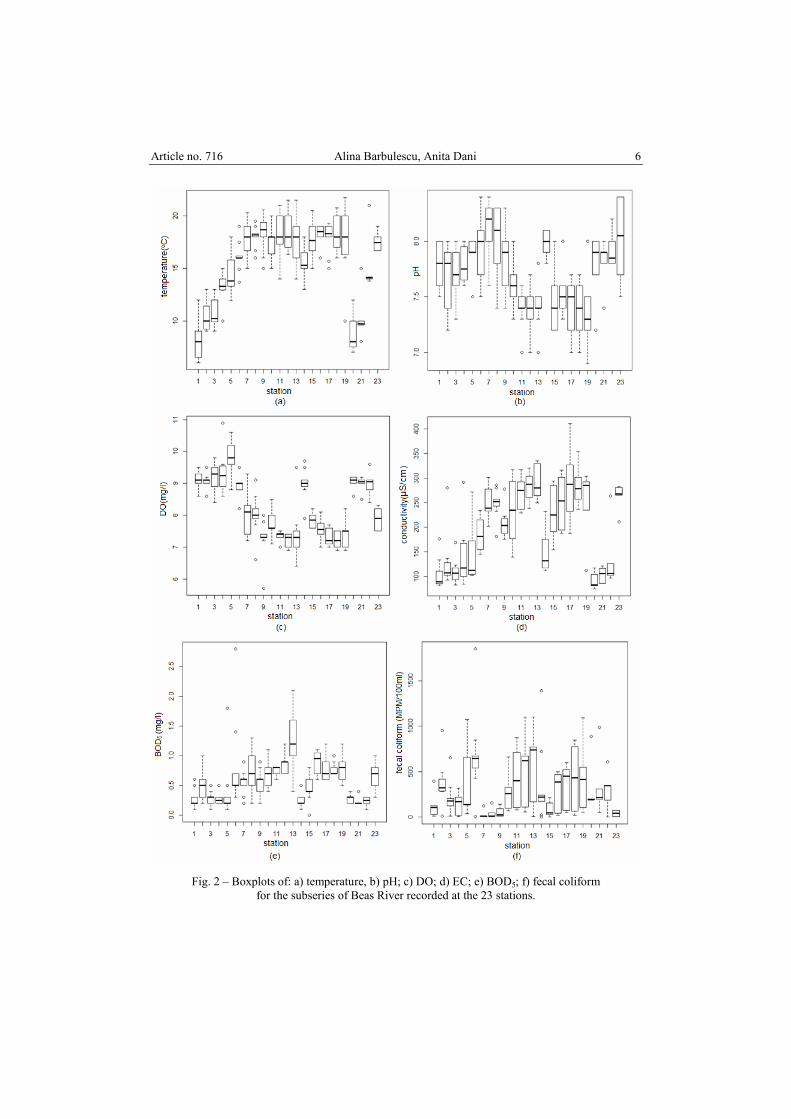
The boxplots of the average parameters recorded at the 23 hydrological stations on the Beas River during the period 2007–2010 are presented in Fig. 2.
From Fig. 2 it results that there exists dissimilarities of the water parameters’ distributions at different stations of Beas River. This observation is confirmed by the Kruskal-Wallis test, which rejects the null hypothesis for all the subseries of parameters. After performing the Conover test, the pairs of series for which the null hypothesis could be rejected were provided. 121 pairs of pH subseries, 74 pairs of BOD5 subseries, 32 pairs of DO subseries, 62 pairs of EC subseries and 162 pairs of FC subseries are not similar.
Article no. 716 Alina Barbulescu, Anita Dani
6
Fig. 2 – Boxplots of: a) temperature, b) pH; c) DO; d) EC; e) BOD5; f) fecal coliform
for the subseries of Beas River recorded at the 23 stations.
Statistical analysis and classification of the water parameters of Beas River Article no. 716
7
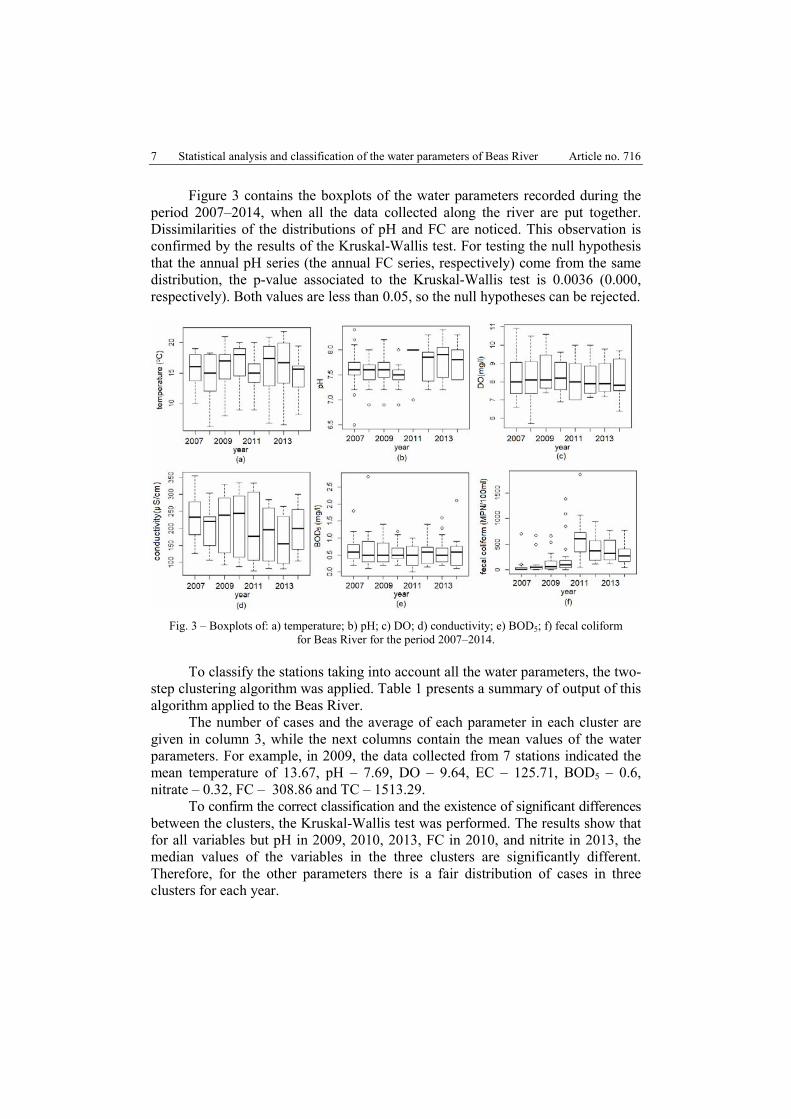
Figure 3 contains the boxplots of the water parameters recorded during the period 2007–2014, when all the data collected along the river are put together. Dissimilarities of the distributions of pH and FC are noticed. This observation is confirmed by the results of the Kruskal-Wallis test. For testing the null hypothesis that the annual pH series (the annual FC series, respectively) come from the same distribution, the p-value associated to the Kruskal-Wallis test is 0.0036 (0.000, respectively). Both values are less than 0.05, so the null hypotheses can be rejected.
Fig. 3 – Boxplots of: a) temperature; b) pH; c) DO; d) conductivity; e) BOD5; f) fecal coliform
for Beas River for the period 2007–2014. To classify the stations taking into account all the water parameters, the two-
step clustering algorithm was applied. Table 1 presents a summary of output of this algorithm applied to the Beas River.
The number of cases and the average of each parameter in each cluster are given in column 3, while the next columns contain the mean values of the water parameters. For example, in 2009, the data collected from 7 stations indicated the mean temperature of 13.67, pH – 7.69, DO – 9.64, EC – 125.71, BOD5 – 0.6, nitrate – 0.32, FC – 308.86 and TC – 1513.29.
To confirm the correct classification and the existence of significant differences between the clusters, the Kruskal-Wallis test was performed. The results show that for all variables but pH in 2009, 2010, 2013, FC in 2010, and nitrite in 2013, the median values of the variables in the three clusters are significantly different. Therefore, for the other parameters there is a fair distribution of cases in three clusters for each year.
Article no. 716 Alina Barbulescu, Anita Dani
8
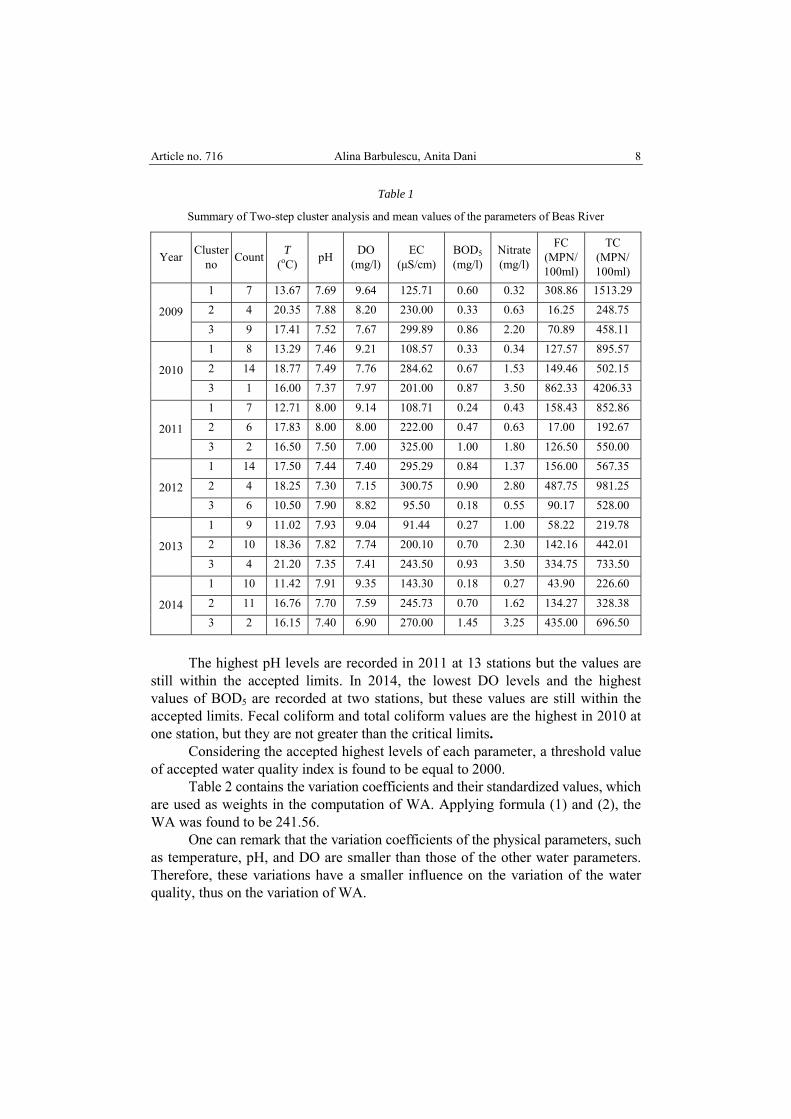
Table 1
Summary of Two-step cluster analysis and mean values of the parameters of Beas River
Year Cluster no Count T
(oC) pH DO (mg/l)
EC (μS/cm)
BOD5 (mg/l)
Nitrate (mg/l)
FC (MPN/ 100ml)
TC (MPN/ 100ml)
1 7 13.67 7.69 9.64 125.71 0.60 0.32 308.86 1513.29 2 4 20.35 7.88 8.20 230.00 0.33 0.63 16.25 248.75 2009 3 9 17.41 7.52 7.67 299.89 0.86 2.20 70.89 458.11 1 8 13.29 7.46 9.21 108.57 0.33 0.34 127.57 895.57 2 14 18.77 7.49 7.76 284.62 0.67 1.53 149.46 502.15 2010 3 1 16.00 7.37 7.97 201.00 0.87 3.50 862.33 4206.33 1 7 12.71 8.00 9.14 108.71 0.24 0.43 158.43 852.86 2 6 17.83 8.00 8.00 222.00 0.47 0.63 17.00 192.67 2011 3 2 16.50 7.50 7.00 325.00 1.00 1.80 126.50 550.00 1 14 17.50 7.44 7.40 295.29 0.84 1.37 156.00 567.35 2 4 18.25 7.30 7.15 300.75 0.90 2.80 487.75 981.25 2012 3 6 10.50 7.90 8.82 95.50 0.18 0.55 90.17 528.00 1 9 11.02 7.93 9.04 91.44 0.27 1.00 58.22 219.78 2 10 18.36 7.82 7.74 200.10 0.70 2.30 142.16 442.01 2013 3 4 21.20 7.35 7.41 243.50 0.93 3.50 334.75 733.50 1 10 11.42 7.91 9.35 143.30 0.18 0.27 43.90 226.60 2 11 16.76 7.70 7.59 245.73 0.70 1.62 134.27 328.38 2014 3 2 16.15 7.40 6.90 270.00 1.45 3.25 435.00 696.50
The highest pH levels are recorded in 2011 at 13 stations but the values are
still within the accepted limits. In 2014, the lowest DO levels and the highest values of BOD5 are recorded at two stations, but these values are still within the accepted limits. Fecal coliform and total coliform values are the highest in 2010 at one station, but they are not greater than the critical limits.
Considering the accepted highest levels of each parameter, a threshold value of accepted water quality index is found to be equal to 2000.
Table 2 contains the variation coefficients and their standardized values, which are used as weights in the computation of WA. Applying formula (1) and (2), the WA was found to be 241.56.
One can remark that the variation coefficients of the physical parameters, such as temperature, pH, and DO are smaller than those of the other water parameters. Therefore, these variations have a smaller influence on the variation of the water quality, thus on the variation of WA.
Statistical analysis and classification of the water parameters of Beas River Article no. 716
9
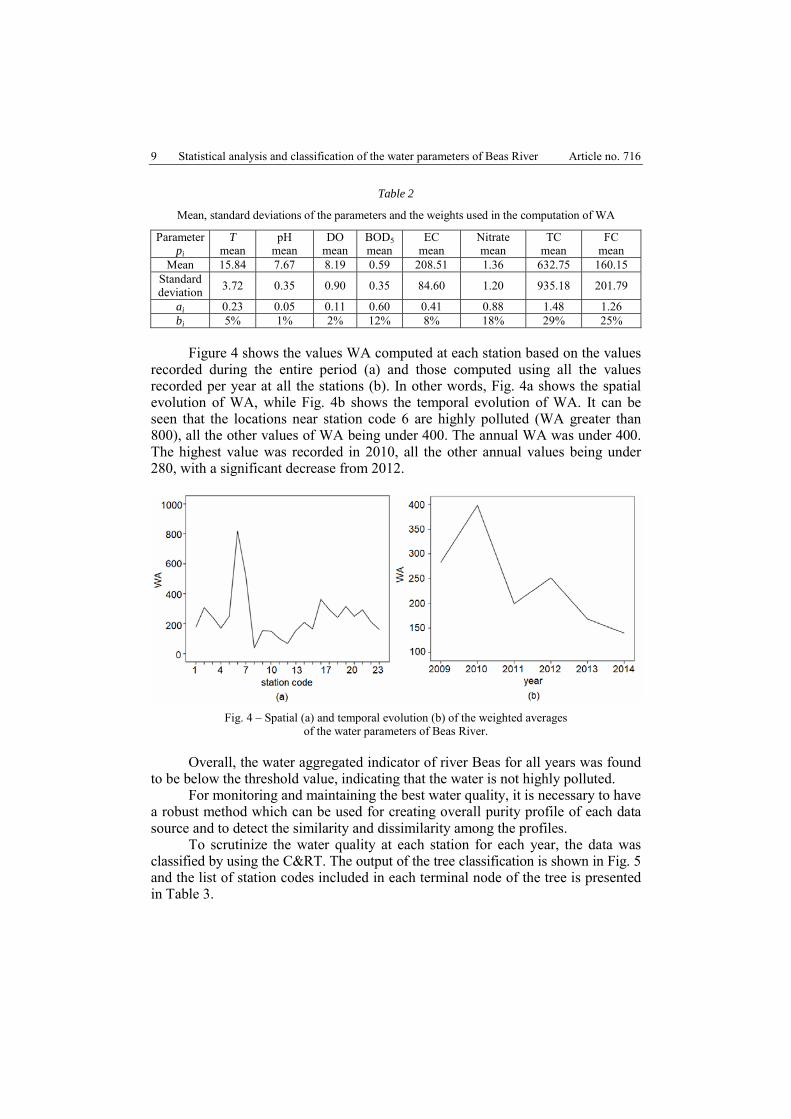
Table 2
Mean, standard deviations of the parameters and the weights used in the computation of WA
Parameter pi
T mean
pH mean
DO mean
BOD5 mean
EC mean
Nitrate mean
TC mean
FC mean
Mean 15.84 7.67 8.19 0.59 208.51 1.36 632.75 160.15 Standard deviation 3.72 0.35 0.90 0.35 84.60 1.20 935.18 201.79
ai 0.23 0.05 0.11 0.60 0.41 0.88 1.48 1.26 bi 5% 1% 2% 12% 8% 18% 29% 25%
Figure 4 shows the values WA computed at each station based on the values
recorded during the entire period (a) and those computed using all the values recorded per year at all the stations (b). In other words, Fig. 4a shows the spatial evolution of WA, while Fig. 4b shows the temporal evolution of WA. It can be seen that the locations near station code 6 are highly polluted (WA greater than 800), all the other values of WA being under 400. The annual WA was under 400. The highest value was recorded in 2010, all the other annual values being under 280, with a significant decrease from 2012.
Fig. 4 – Spatial (a) and temporal evolution (b) of the weighted averages
of the water parameters of Beas River.
Overall, the water aggregated indicator of river Beas for all years was found to be below the threshold value, indicating that the water is not highly polluted.
For monitoring and maintaining the best water quality, it is necessary to have a robust method which can be used for creating overall purity profile of each data source and to detect the similarity and dissimilarity among the profiles.
To scrutinize the water quality at each station for each year, the data was classified by using the C&RT. The output of the tree classification is shown in Fig. 5 and the list of station codes included in each terminal node of the tree is presented in Table 3.
Article no. 716 Alina Barbulescu, Anita Dani
10
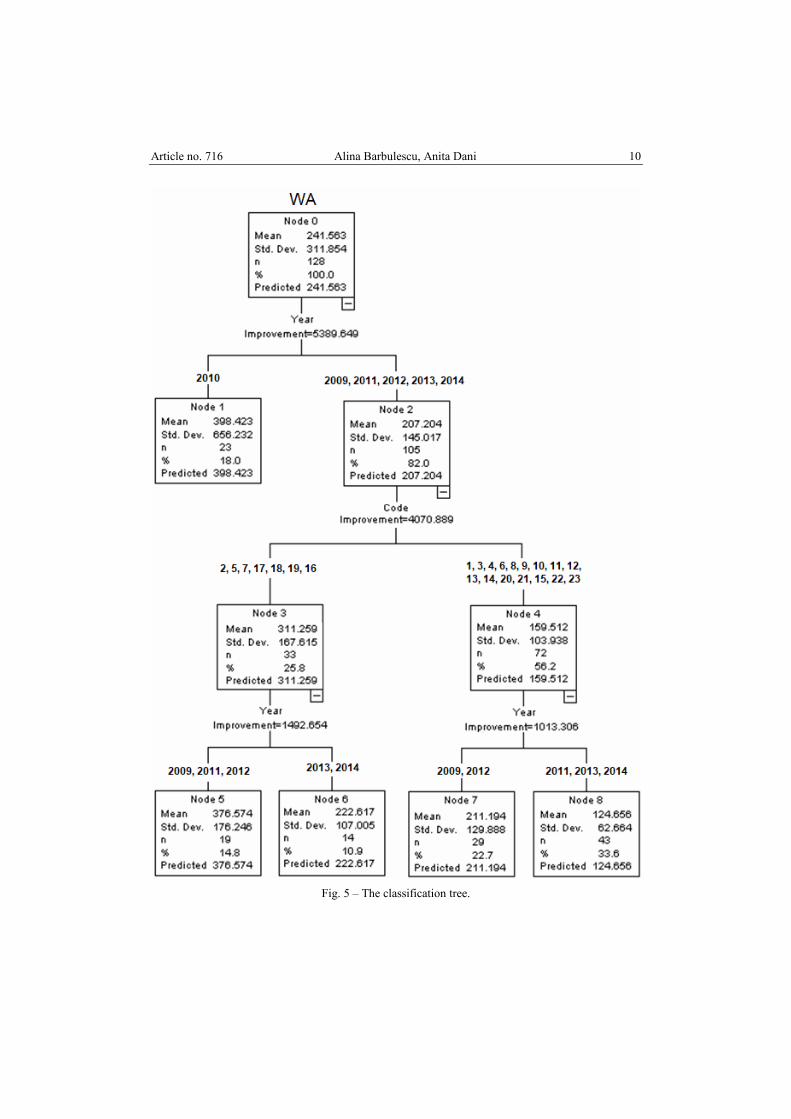
Fig. 5 – The classification tree.
Statistical analysis and classification of the water parameters of Beas River Article no. 716
11
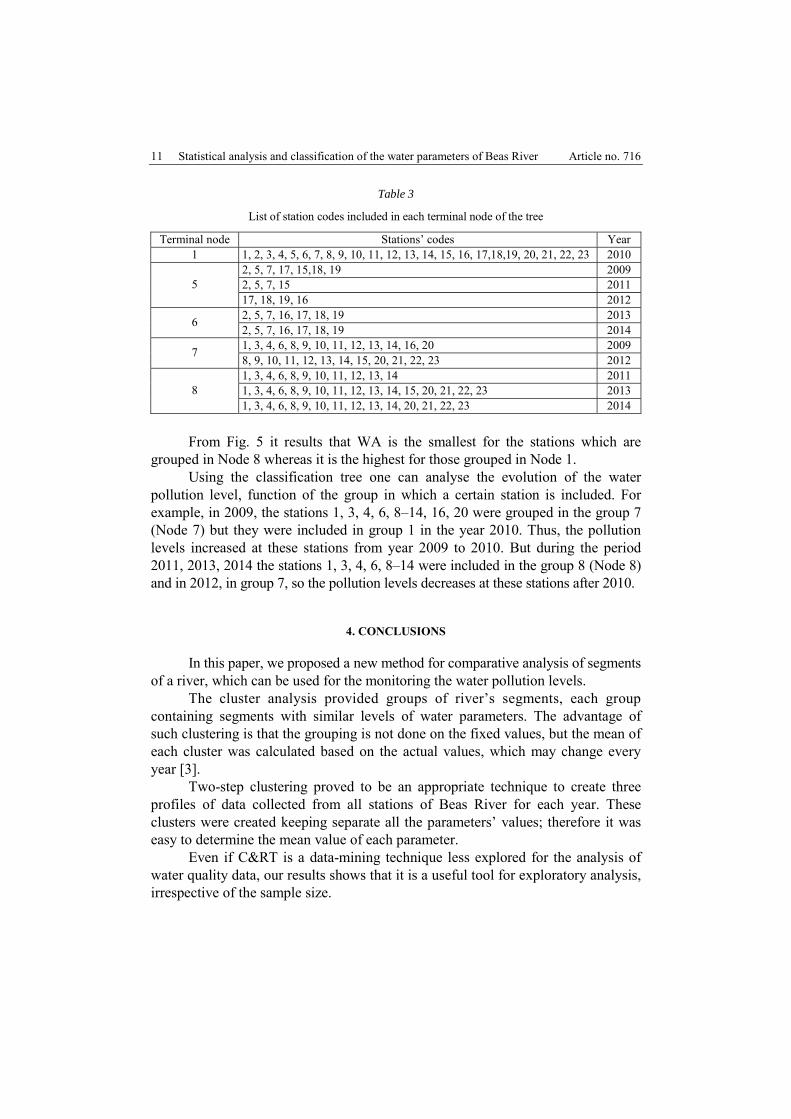
Table 3
List of station codes included in each terminal node of the tree
Terminal node Stations’ codes Year 1 1, 2, 3, 4, 5, 6, 7, 8, 9, 10, 11, 12, 13, 14, 15, 16, 17,18,19, 20, 21, 22, 23 2010
2, 5, 7, 17, 15,18, 19 2009 2, 5, 7, 15 2011 5 17, 18, 19, 16 2012 2, 5, 7, 16, 17, 18, 19 2013 6 2, 5, 7, 16, 17, 18, 19 2014 1, 3, 4, 6, 8, 9, 10, 11, 12, 13, 14, 16, 20 2009 7 8, 9, 10, 11, 12, 13, 14, 15, 20, 21, 22, 23 2012 1, 3, 4, 6, 8, 9, 10, 11, 12, 13, 14 2011 1, 3, 4, 6, 8, 9, 10, 11, 12, 13, 14, 15, 20, 21, 22, 23 2013 8 1, 3, 4, 6, 8, 9, 10, 11, 12, 13, 14, 20, 21, 22, 23 2014
From Fig. 5 it results that WA is the smallest for the stations which are
grouped in Node 8 whereas it is the highest for those grouped in Node 1. Using the classification tree one can analyse the evolution of the water
pollution level, function of the group in which a certain station is included. For example, in 2009, the stations 1, 3, 4, 6, 8–14, 16, 20 were grouped in the group 7 (Node 7) but they were included in group 1 in the year 2010. Thus, the pollution levels increased at these stations from year 2009 to 2010. But during the period 2011, 2013, 2014 the stations 1, 3, 4, 6, 8–14 were included in the group 8 (Node 8) and in 2012, in group 7, so the pollution levels decreases at these stations after 2010.
4. CONCLUSIONS
In this paper, we proposed a new method for comparative analysis of segments of a river, which can be used for the monitoring the water pollution levels.
The cluster analysis provided groups of river’s segments, each group containing segments with similar levels of water parameters. The advantage of such clustering is that the grouping is not done on the fixed values, but the mean of each cluster was calculated based on the actual values, which may change every year [3].
Two-step clustering proved to be an appropriate technique to create three profiles of data collected from all stations of Beas River for each year. These clusters were created keeping separate all the parameters’ values; therefore it was easy to determine the mean value of each parameter.
Even if C&RT is a data-mining technique less explored for the analysis of water quality data, our results shows that it is a useful tool for exploratory analysis, irrespective of the sample size.
Article no. 716 Alina Barbulescu, Anita Dani
12
Assessing the water quality using one of the various water quality indexes may give more accurate and robust results when applied to primary and fine granulated data. The proposed aggregate (WA) is similar to the weighted water quality index, but its suitability as a robust water quality index should be examined in future works.
These results can be used for making decisions on the implementation of necessary measures for cleaning the water and stopping its pollution.
REFERENCES
1. A. Bărbulescu, L. Barbeș, Statistical Analysis and Mathematical Models for the VOCs Concentrations on the Romanian Littoral. A case study, Analytical Letters 49(3), 387–399 (2016).
2. A. Bărbulescu, L. Barbes, Y. Nazzal, New model for inorganic pollutants dissipation on the northern part of the Romanian Black Sea coast, Rom. J. Phys. 63(5–6), 806 (2018).
3. A. Dani, A. Barbulescu, Statistical analysis of the water quality of the major rivers in India, in: V. Naddeo, M. Balakrishnan, K-W Choo (eds.), Frontiers in Water-Energy-Nexus–Nature-Based Solutions, Advanced Technologies and Best Practices for Environmental Sustainability, Proceedings of the 2nd WaterEnergyNEXUS Conference, November 2018, Salerno, Italy (2020), in press.
4. R. M. Stirbescu, C. Radulescu, C. Stihi, I.D. Dulama, E.D. Chelarescu, I.A. Bucurica, G. Pehoiu, Spatial distribution of heavy metals in urban soils, Rom. Rep. Phys. 71, 705 (2019).
5. S. Voinea, G. Manolache, G. Iorga. S. Stefan, Relationships between PM10 mass concentrations and aerosol optical parameters over Magurele, Romania, Rom. Rep. Phys. 70, 705 (2018).
6. M. Falkenmark, Water Scarcity: Time for realism, Populi 20(6), 11–12 (1993). 7. P. Gleick, An introduction to global freshwater issues, P. Gleick (ed.), Water in crisis, Oxford
University Press, New York, 3–12, 1993. 8. R. Dugan, Biochemical Ecology of Water Pollution, Plenum Publishing Co. Ltd., New York, 1972. 9. CPCB ENVIS, ENVIS Centre on Control of Pollution Water, Air and Noise, 2018. http://
www.cpcbenvis.nic.in/water quality_ data.html (Accessed 12 February 2019). 10. A. K. Dwivedi, Researches in water pollution: A review, Int. Res. J. Nat. Appl. Sci. 4(1), 118–142
(2017). 11. R. Chalasani, Toxic foam pollutes India’s sacred Yamuna River, 2018. https:// abcnews.go.com/
International/toxic-foam-pollutes-indias-sacred-yamuna-river/story?id=57995346 12. GhaggarReport 2010. Report on pollution problem of River Ghaggar, www.indiaenvironmentportal.
org.in/files/file/GhaggarReport.pdf 13. M. M. Sahoo, K. C. Patra, J. B. Swain, K. K. Khatua, Evaluation of water quality with application
of Bayes’ rule and entropy weight method, European J. Environ. Civil Eng. 21(6), 730–752 (2017). 14. M. Bora, D. C. Goswami, Water quality assessment in terms of water quality index (WQI): case
study of the Kolong River, Assam, India, Appl. Water Sci. 7(6), 3125–3135 (2017). 15. A. Kaushik, H. R. Sharma, S. Jain, J. Dawra, C. P. Kaushik, Pesticide pollution of river Ghaggar
in Haryana, India, Environ. Monitor. Assess. 160(1–4), 61–69 (2010). 16. G. Singh, B. Kumari, G. Sinam, N. Kumar, S. Mallick, Fluoride distribution and contamination
in the water, soil and plants continuum and its remedial technologies, an Indian perspective – a review, Environ. Pollut. 239, 95–108 (2018).
17. H. B. Trivedi, S. D. Vediya, Assessment of nitrate contamination of the groundwater samples in Bhiloda Taluka of Sabarkantha district, Gujarat, Int. J. Pharma. Life Sci. 3(11), 2103–2106 (2012).
18. CPCB Polluted river stretches in India. Criteria and status. Central Pollution Control Board, https://www.cpcb.nic.in/wqm/RS-criteria-status.pdf
19. Water Act, 1974, https://pcbassam.org/rules/WaterAct.pdf.
Statistical analysis and classification of the water parameters of Beas River Article no. 716
13
20. A. S. Prasad, B. W. Pandey, W. Leimgruber, R. M. Kunwar, Mountain hazard susceptibility and livelihood security in the upper catchment area of the river Beas, Kullu Valley, Himachal Pradesh, India, Geoenviron. Disasters 3, 3 (2016).
21. W. H. Kruskal, W. A. Wallis, Use of ranks in one – criterion variance analysis, J. Am. Stat. Assoc. 47(260), 583–621 (1952).
22. W. J. Conover, Practical Nonparametric Statistics, Wiley, Hoboken (1999). 23. R. Xu, D. C. II. Wunsch, Survey of Clustering Algorithms, IEEE T. Neural Networ. 16(3), 645–678
(2005). 24. I. Paun, L. V. Cruceru, L. F. Chiriac, M. Niculescu, G. Vasile, N. M. Marin, Water Quality
Indices-methods for evaluating the quality of drinking water, Proceedings Book of INCD ECOIND – International Symposium SIMI 2016, pp. 395–402 (2016).
25. C. Machuca, M. V. Vettore, M. Krasuska, S. R. Baker, P. G. Robinson, Using classification and regression tree modelling to investigate response shift patterns in dentine hypersensitivity, BMC Med. Res. Methodol. 17:120 (2017).
26. P. Berkhin, A survey of clustering data mining techniques, in: J. Kogan, C. Nicholas, M. Teboulle (eds.), Grouping multidimensional data, Springer, Berlin–Heidelberg, Germany, pp. 25–71 (2006).
27. Y. Y. Song, L. U. Ying, Decision tree methods: applications for classification and prediction, Shanghai Arch. Psych. 27(2), 130–135 (2015).

Article no. 716 Alina Barbulescu, Anita Dani
14