
STATEOF MICHIGANINVESTMENT BOARD MEETING March …
105
STATE OF MICHIGAN INVESTMENT BOARD MEETING March 7, 2019 State of Michigan Retirement System Quarterly Investment Review Rachael Eubanks, State Treasurer Prepared by Bureau of Investments Michigan Department of Treasury
Transcript of STATEOF MICHIGANINVESTMENT BOARD MEETING March …

STATE OF MICHIGAN INVESTMENT BOARD MEETING
March 7, 2019 State of Michigan Retirement System
Quarterly Investment Review
Rachael Eubanks, State Treasurer Prepared by Bureau of Investments Michigan Department of Treasury

STATE OF MICHIGAN INVESTMENT BOARD MEETING
MARCH 7, 2019
Agenda
9:30 a.m. Call to Order and Opening Remarks
9:40 a.m. Approval of the 12/11/18 SMIB Meeting Minutes
9:45 a.m. Executive Summary & Performance for Periods Ending 12/31/18
10:00 a.m. Current Asset Allocation Review
Markets Review and Outlook
10:15 a.m. Review of Investment Reports
Defined Contribution
Fixed Income
Real, Opportunistic, & Absolute Return
Domestic Equity
Private Equity – Receive and File
International Equity – Receive and File
Real Estate & Infrastructure – Receive and File
11:00 a.m. Public Comment
Closing Remarks ~ Adjournment
2019 Meeting Schedule
Thursday, June 6, 2019 Thursday, September 12, 2019 Thursday, December 12, 2019
All meetings start at 9:30 a.m.
www.michigan.gov/treasury

State of Michigan Retirement System
MINUTES State of Michigan Investment Board Meeting
March 7, 2019
Jon M. BraeutigamChief Investment OfficerBureau of Investments

STATE OF MICHIGAN INVESTMENT BOARD December 11, 2018 Meeting Minutes
Members Present: Chair – Treasurer Nick Khouri Budget Director John Walsh (arrived 10:30 am) Ms. Dina Richard Mr. Reginald Sanders
Members by Phone: Mr. James Nicholson
Members of the Public and Bureau of Investments Staff Present: Molly Jason Craig Sabin Jack Behar Karl Borgquist Paul Lerg Richard Holcomb Mary Pollock Anthony Estell Kerrie VandenBosch Dave Klauka Matt Hutson Pavel Stolarczyk Barb Becker Craig Coulter June Morse Ann Stange Mark Porrell Nick Whitman Lan Chen Todd Warstler Jennifer Yeung Jim Elkins Jon Braeutigam Robert Brackenbury Peter Woodford Woody Tyler Travis Haney Greg Parker Giles Feldpausch Ann Storberg Marge McPhee Annette Russell Todd Warstler Patrick Moraniec Janet Sudac Lori Barrett
Treasurer Khouri called the meeting to order at 9:30 am.
Opening Remarks: Brief discussion by Chair Treasurer Khouri explaining that this is his last meeting as he will be retiring at the end of this month. He wished the State of Michigan Retirement System continued success.
Approval of the November 27, 2018 SMIB Special Meeting Minutes – Motion to approve: Reginald Sanders. Seconded: Dina Richard. The vote was unanimous to approve.
AGENDA
Executive Summary Jon Braeutigam, Chief Investment Officer for the Bureau of Investments, discussed the plans returns over the past one, three, five, seven, and ten years. For each time period the plan had higher returns than the peer median. He believes that market returns will be lower going forward, and this view is shared by industry consultants in general.
Asset Allocation Review, Markets Review and Outlook Gregory Parker, Director of Investments - Public Markets for the Bureau of Investments discussed that quality decision making is the foundation to obtain the returns that SMRS has experienced. He also discussed the overwhelming consensus view of lower returns going forward.
1
Review of Investment Reports – Public
Woody Tyler, Senior Investment Manager of Defined Contribution, Trusts & Agencies presented a brief overview of the defined contribution plan noting that a more comprehensive look at defined contribution will ensue at the March meeting.
Daniel Quigley, Senior Investment Manager of the Fixed Income Division discussed that the fixed income portfolio outperformed its benchmark and peer group across all time periods.
Jack Behar, Senior Investment Manager of the Domestic Equity Division explained that they had a very strong year and experienced excellent performance on the growth side of the portfolio.
Patrick Moraniec, Senior Investment Manager of the International Equity Division stated that the portfolio slightly outperformed the benchmark over the last twelve months. This was driven by developed market exposure.
Review of Investment Reports – Private
Peter Woodford, Senior Investment Manager of Private Equity explained that returns have been strong relative to peer median returns, ranking in the top 7% of peers over the past ten years. The outperformance to peers is attributed to fund selectivity and strategy.
Jennifer Yeung, Senior Investment Manager of Real, Opportunistic, & Absolute Return explained that the division experienced a 6% return for the year with outperformance of the benchmark in the third quarter. This outperformance was driven by overweight exposure to credit strategies as well as manager selection.
Todd Warstler, Senior Investment Manager of Real Estate & Infrastructure stated that outperformance relative to the one-year benchmark resulted from the divisions strategy. No big changes in this strategy are anticipated at this time.
Public Comment Treasurer Khouri asked that any attendees wishing to address the Board come forward. No public comment.
Treasurer Khouri adjourned the meeting at 11:02 am. Motion to adjourn by Dina Richard. Seconded: Reginald Sanders. The vote was unanimous to adjourn.
Approved:
_________________________________ Rachael Eubanks, Chairman
2

State of Michigan Retirement System
EXECUTIVE SUMMARY State of Michigan Investment Board Meeting
March 7, 2019
Gregory J. Parker, CFA Director of Investments – Public Markets
Director of Asset Allocation Bureau of Investments
EXECUTIVE SUMMARY December 2018
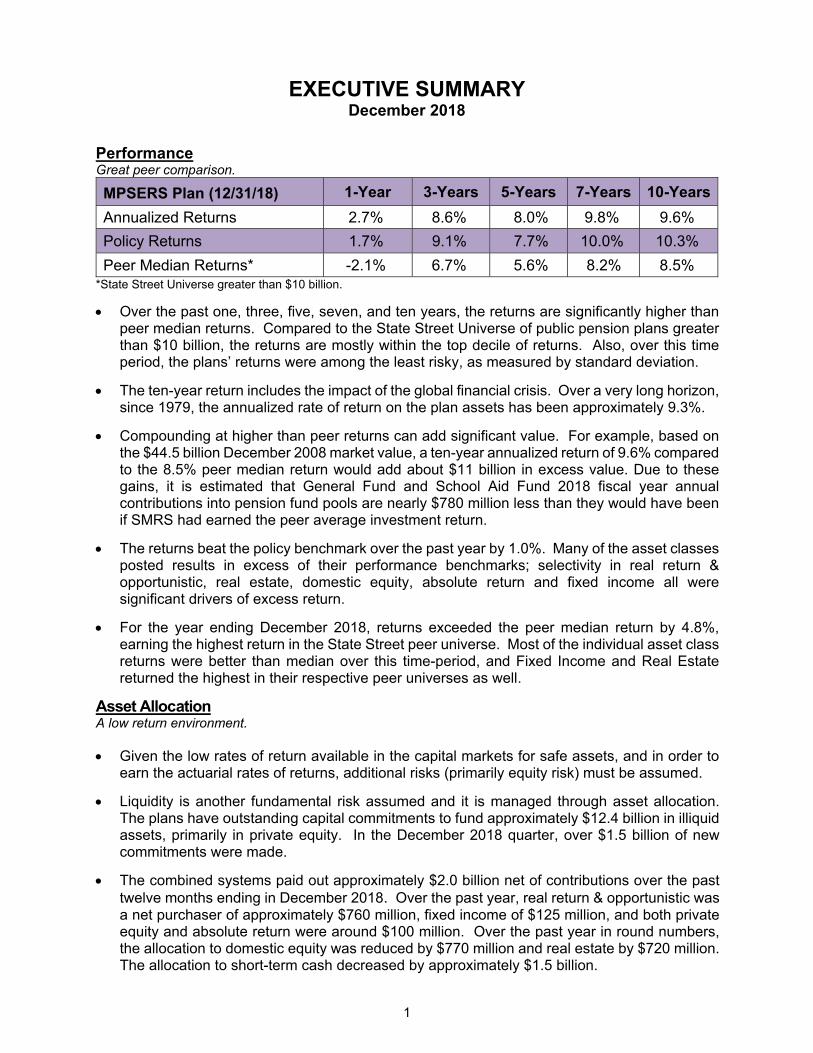
Performance Great peer comparison.
MPSERS Plan (12/31/18) 1-Year 3-Years 5-Years 7-Years 10-Years
Annualized Returns 2.7% 8.6% 8.0% 9.8% 9.6%
Policy Returns 1.7% 9.1% 7.7% 10.0% 10.3%
Peer Median Returns* -2.1% 6.7% 5.6% 8.2% 8.5% *State Street Universe greater than $10 billion.
Over the past one, three, five, seven, and ten years, the returns are significantly higher than peer median returns. Compared to the State Street Universe of public pension plans greater than $10 billion, the returns are mostly within the top decile of returns. Also, over this time period, the plans’ returns were among the least risky, as measured by standard deviation.
The ten-year return includes the impact of the global financial crisis. Over a very long horizon, since 1979, the annualized rate of return on the plan assets has been approximately 9.3%.
Compounding at higher than peer returns can add significant value. For example, based on the $44.5 billion December 2008 market value, a ten-year annualized return of 9.6% compared to the 8.5% peer median return would add about $11 billion in excess value. Due to these gains, it is estimated that General Fund and School Aid Fund 2018 fiscal year annual contributions into pension fund pools are nearly $780 million less than they would have been if SMRS had earned the peer average investment return.
The returns beat the policy benchmark over the past year by 1.0%. Many of the asset classes posted results in excess of their performance benchmarks; selectivity in real return & opportunistic, real estate, domestic equity, absolute return and fixed income all were significant drivers of excess return.
For the year ending December 2018, returns exceeded the peer median return by 4.8%, earning the highest return in the State Street peer universe. Most of the individual asset class returns were better than median over this time-period, and Fixed Income and Real Estate returned the highest in their respective peer universes as well.
Asset Allocation A low return environment.
Given the low rates of return available in the capital markets for safe assets, and in order to earn the actuarial rates of returns, additional risks (primarily equity risk) must be assumed.
Liquidity is another fundamental risk assumed and it is managed through asset allocation. The plans have outstanding capital commitments to fund approximately $12.4 billion in illiquid assets, primarily in private equity. In the December 2018 quarter, over $1.5 billion of new commitments were made.
The combined systems paid out approximately $2.0 billion net of contributions over the past twelve months ending in December 2018. Over the past year, real return & opportunistic was a net purchaser of approximately $760 million, fixed income of $125 million, and both private equity and absolute return were around $100 million. Over the past year in round numbers, the allocation to domestic equity was reduced by $770 million and real estate by $720 million. The allocation to short-term cash decreased by approximately $1.5 billion.
1

Capital Markets Risk assets in focus.
Capital market assumptions used for determining strategic asset allocations are being reduced across the board, and especially for safer, publicly traded fixed income securities. This is the general opinion for most consultants, investment banks, and other market participants. The reason for this phenomenon is the low interest rate environment caused by the policies of the Federal Reserve and other central banks, as well as the run-up in prices for most risk assets over the past several years since the depths of the Great Recession.
Private real estate was the best performing asset class for 2018, returning approximately 6.7%. Publicly traded REITs fell in value by -4.1% including dividend returns.
Fundamentals supporting domestic equities are still strong. Year-over-year growth in analyst estimated earnings for the next year are close to 12%. Since June 2007, the growth style has returned over 50% more than value style. Perhaps even more surprising, since December 2000 growth and value have earned nearly the same return.
Defined as a pullback of 20% or more on the closing value of the S&P 500, the U.S. equity market has not hit a correction since the Global Financial Crisis.
In 2018, both credit spreads and long-term interest rates increased making it difficult for bond managers to earn extra return. With the yield curve at its flattest levels since the summer of 2007 and credit spreads at fairly normal levels, securitized credit and floating rate assets are attractive alternatives.
The most recent reading of the annualized U.S. GDP growth was 3.4%, slightly below the consensus estimate of 3.5%. Current estimates for 2019 GDP growth for the U.S. is around 2.5%. Coincidental economic indicators such as the Institute for Supply Management’s Manufacturing and Non-Manufacturing PMI Indexes are well above 50, indicating that the U.S. economy is likely to continue to grow.
2

Investment Update
Highlighting the quarter.
($ Millions)
NEW COMMITMENTS
September 30 – December 31, 2018
Asset class Fund Name / (Managed By) Commitment
Private Equity
TSG 8, L.P. (TSG Consumer Partners) $150
Warburg Pincus Global Growth, L.P. (Warburg Pincus Global Growth GP, LP) 150
KKR European Fund V (USD) SCSp (KKR Associates Europe V SCSp) 125
Greenspring Master G, L.P. (Greenspring Associates, Inc.) 100
Flagship Pioneering Special Opportunities Fund II, L.P. (Flagship Opp. Fund II GP, LLC) 100
FS Equity Partners VIII, L.P. (FS Capital Partners VIII, LLC) 75
5AM Opportunities I, L.P. (5AM Partners VI, LLC) 30
Greenspring Micro II, L.P. (Greenspring Associates, Inc.) 25
5AM Ventures VI, L.P. (5AM Partners VI, LLC) 20
Real Estate and Infrastructure Division
Blackstone Real Estate Partners IX, LP (Blackstone Real Estate Advisors) 200
Lone Star Fund XI, LP (Lone Star) 200
Real, Opportunistic, & Absolute Return Division
TSSP Capital Solutions Fund I, L.P. (TSSP Capital Solutions Management I, LLC) 300
Flywheel Energy Co-Invest, LLC (Kayne Anderson) 35
TOTAL $1,510
3

State of Michigan Retirement System
PERFORMANCE State of Michigan Investment Board Meeting
March 7, 2019
Jon M. Braeutigam Chief Investment Officer Bureau of Investments

Bureau of Investments Mission Statement
The Bureau of Investments continually strives to provide quality
investment management services, broad professional expertise, and
independent advice to the State of Michigan Investment Board
as fiduciary of the State of Michigan Retirement System, and
independent of the Board, to the State Treasurer for various Michigan
trust funds and the State’s common cash, for which the State Treasurer
is the fiduciary.
SMRS Goals Maintain sufficient liquidity to pay benefits.
Meet or exceed the actuarial assumption over the long term.
Perform in the top half of the public plan universe over the long term.
Diversify assets to reduce risk.
Exceed individual asset class benchmarks over the long term.
1

MP
SE
RS
PE
NS
ION
Tim
e-W
eig
hte
d R
ates
of
Ret
urn
Per
iod
s E
nd
ing
Dec
emb
er 3
1, 2
018
% o
f T
enS
even
Fiv
eT
hre
eO
ne
Cu
rren
tP
ort
folio
12/3
1/18
Rat
eR
ank
Rat
eR
ank
Rat
eR
ank
Rat
eR
ank
Rat
eR
ank
Rat
eR
ank
TO
TA
L P
LA
N10
0.0
9.6
99.
85
8.0
48.
613
2.7
5-4
.215
M
ed
ian
- G
rea
ter
than
$10
Bill
ion
28.
58.
25.
66.
7-2
.1-5
.9
MP
SE
RS
To
tal P
lan
Pol
icy
10.3
10.0
7.7
9.1
1.7
-3.9
DO
ME
ST
IC E
QU
ITIE
S22
.613
.330
12.9
188.
322
9.5
18-3
.817
-15.
086
M
edia
n 2
13.0
12.4
7.6
8.3
-5.9
-13.
5
S
&P
150
0 In
dex
13.2
12.6
8.3
9.2
-5.0
-14.
0
INT
ER
NA
TIO
NA
L E
QU
ITIE
S15
.97.
553
6.1
572.
032
4.8
23-1
4.3
54-1
1.7
29
Med
ian
27.
66.
31.
34.
1-1
4.2
-12.
1
Int
erna
tiona
l Ble
nded
Ben
chm
ark
35.
85.
00.
74.
5-1
4.2
-11.
5
PR
IVA
TE
EQ
UIT
IES
18.0
13.5
714
.910
14.6
1414
.811
18.2
73.
912
M
edia
n 2
8.9
10.3
9.3
9.5
7.7
1.0
Alte
rnat
ive
Ble
nded
Ben
chm
ark
419
.120
.117
.220
.721
.48.
5
BO
ND
S12
.85.
229
3.5
203.
914
4.1
191.
24
0.8
41
Med
ian
24.
42.
62.
72.
5-0
.30.
7
B
arcl
ays
Agg
rega
te3.
52.
12.
52.
10.
01.
6
RE
AL
ES
TA
TE
& I
NF
RA
ST
RU
CT
UR
E10
.15.
651
11.5
2712
.021
10.4
2912
.24
2.3
23
Med
ian
25.
710
.210
.58.
78.
91.
6
NC
RE
IF -
Pro
pert
y B
lend
ed I
ndex
56.
18.
37.
95.
85.
41.
1
NC
RE
IF O
pen
Fun
d In
dex
Net
6.0
10.0
9.4
7.3
7.4
1.5
RE
AL
RE
TU
RN
AN
D O
PP
OR
TU
NIS
TIC
11.5
11.5
13.6
12.4
19.5
6.6
50%
(C
PI
+50
0 bp
s) +
50%
(6.
8% a
ctua
rial
rat
e)7.
37.
27.
57.
31.
2
AB
SO
LU
TE
RE
TU
RN
6.2
6.1
5.7
4.0
4.4
4.3
0.2
HF
RI
FO
F C
ons
1 m
onth
lagg
ed2.
93.
02.
11.
80.
6-2
.0
CA
SH
EQ
UIV
AL
EN
TS
2.8
0.8
0.8
1.0
1.4
2.2
0.6
1 M
onth
T-B
ill0.
30.
40.
60.
91.
80.
6
1 A
nnua
lized
Ret
urns
and
Per
cent
ile R
ank.
2 C
ompa
rison
uni
vers
e is
the
Sta
te S
tree
t Uni
vers
e co
mpr
ised
of P
ublic
Fun
ds g
reat
er th
an $
10 b
illio
n on
the
tota
l pla
n le
vel a
nd g
reat
er th
an $
1 bi
llion
for
asse
t cla
sses
.3
Inte
rnat
iona
l ble
nded
ben
chm
ark
is S
&P
Dev
elop
ed B
MI-
EP
AC
50/
50 p
rior
to 1
/1/1
0. S
&P
Dev
elop
ed B
MI-
EP
AC
75
US
D /
25 L
ocal
, 1/1
/10
to 9
/30/
10.
MS
CI A
CW
I ex
US
A G
ross
10/
1/10
to p
rese
nt.
4 S
P 5
00 +
300
bps
thru
12/
31/0
6. E
ndin
g m
arke
t val
ue (
EM
V)
wei
ghte
d bl
end
of 1
0 yr
yie
ld +
300
bps
and
SP
500
+ 3
00 b
ps 1
2/31
/06
to 9
/30/
09.
EM
V w
eigh
ted
blen
d of
10
yr y
ield
+ 3
00 b
ps a
nd S
P 5
00 +
300
bps
3-m
onth
lagg
ed 9
/30/
09 to
pre
sent
.5
NC
RE
IF -
Pro
pert
y B
lend
ed In
dex
is N
PI m
inus
75
bps
prio
r to
Oct
ober
200
5, N
PI m
inus
130
bps
cur
rent
.
So
urc
e:
Sta
te S
tre
et
An
aly
tics;
th
e N
CR
EIF
- N
PI (
Pro
pe
rty
Ind
ex)
so
urc
e is
NC
RE
IF; t
he
S&
P B
MI-
EP
AC
Ind
ex
sou
rce
is S
&P
.
Yea
rs 1
Yea
rs 1
Yea
rQ
uar
ter
Yea
rs 1
Yea
rs 1
2

Tota
l Fun
d Pe
rfor
man
ce 0.0%
0.9%
1.8%
2.7%
3.6%
4.5%
Tota
l Fun
d
Tota
l Fun
d Be
nchm
ark
Tota
l Val
ue A
dded
2.7%
1.7%
1.0%
Tota
l Val
ue A
dded
:1.0
%
0.0%
1.0%
2.0%
3.0%
-1.0
%-2
.0 %
Oth
er
Man
ager
Val
ue A
dded
Asse
t Allo
catio
n
0.0%
1.5%
-0.5
%
Tota
l Ass
et A
lloca
tion:
-0.5
%
Aver
age
Activ
e W
eigh
t
0.0%
3.0%
6.0%
-3.0
%-6
.0 %
Tota
l Rea
l Ret
urn
and
Opp
ortu
nist
ic
Tota
l Rea
l Est
ate
and
Infra
stru
ctur
e
Tota
l Priv
ate
Equi
ty
Tota
l Sho
rt Te
rm
Tota
l Abs
olut
e R
etur
n
Tota
l Fix
ed In
com
e
Tota
l Int
erna
tiona
l Equ
ity
Tota
l Dom
estic
Equ
ity
Weight (%)
-0.4
%
0.9%
-2.0
%
1.1%
-0.2
%
1.7%
1.8%
-2.9
%
Asse
t Allo
catio
n Va
lue
Adde
d
0.0%
0.3%
0.6%
-0.3
%-0
.6 %
0.0%
0.0%
-0.3
%
-0.1
%0.0%
0.0%
-0.3
%
0.1%
Tota
l Man
ager
Val
ue A
dded
:1.5
%
Man
ager
Val
ue A
dded
0.0%
0.8%
1.6%
-0.8
%-1
.6 %
1.0%
0.7%
-0.5
%
0.0%
-0.1
%
0.1%
-0.1
%
0.3%
Tota
l Fun
d A
ttrib
utio
n1
Year
End
ing
Dec
embe
r 31,
201
8
Tota
l Mic
higa
n vs
. Tot
al F
und
Ben
chm
ark
3

1 Y
ear
2 Y
ear
3 Y
ear
4 Y
ear
5 Y
ear
6 Y
ear
7 Y
ear
8 Y
ear
9 Y
ear
10 Y
ear
MP
SE
RS
2.7
9.2
8.6
7.2
8.0
9.3
9.8
9.0
9.4
9.6
Pu
bli
c P
lan
- M
ed
ian
(>
$1
0 b
illi
on
)*-2
.16
.36
.75
.25
.67
.28
.27
.27
.88
.5
Ra
nk
55
13
94
45
55
9
bp
Dif
fere
nc
e -
Me
dia
n4
78
29
41
90
19
82
34
21
01
58
17
51
56
11
3
12/1
812
/17
12/1
612
/15
12/1
412
/13
12/1
212
/11
12/1
012
/09
MP
SE
RS
2.7
16
.27
.42
.81
1.3
16
.41
2.6
3.3
12
.71
2.1
Pu
bli
c P
lan
- M
ed
ian
(>
$1
0 b
illi
on
)*-2
.11
5.3
7.9
0.4
7.1
15
.71
3.2
1.7
12
.71
7.4
Ra
nk
53
96
84
53
76
51
25
38
0
bp
Dif
fere
nc
e -
Me
dia
n4
78
86
-45
23
84
21
73
-53
16
5-4
-53
0
1 Y
ear
2 Y
ear
3 Y
ear
4 Y
ear
5 Y
ear
6 Y
ear
7 Y
ear
8 Y
ear
9 Y
ear
10 Y
ear
MS
ER
S2
.79
.38
.77
.28
.09
.39
.88
.99
.39
.6
Pu
bli
c P
lan
- M
ed
ian
(>
$1
bil
lio
n)*
-2.9
6.3
6.7
5.1
5.3
7.2
8.0
7.1
7.8
8.5
Ra
nk
43
86
34
44
42
0
bp
Dif
fere
nc
e -
Me
dia
n5
62
29
91
95
20
22
63
21
61
76
18
71
51
11
0
12/1
812
/17
12/1
612
/15
12/1
412
/13
12/1
212
/11
12/1
012
/09
MS
ER
S2
.71
6.2
7.5
2.8
11
.31
6.3
12
.63
.21
2.5
11
.9
Pu
bli
c P
lan
- M
ed
ian
(>
$1
bil
lio
n)*
-2.9
15
.07
.90
.36
.91
5.9
13
.01
.31
2.9
18
.4
Ra
nk
43
56
32
34
46
61
56
18
5
bp
Dif
fere
nc
e -
Me
dia
n5
62
11
7-3
92
49
44
04
0-4
51
89
-36
-64
8
*Sta
te S
tree
t Pub
lic F
unds
Uni
vers
e
Cu
mu
lati
ve a
nd
Co
nse
cuti
ve
MP
SE
RS
To
tal
Fu
nd
Ret
urn
s
Cu
mu
lati
ve
Fo
r Y
ea
rs E
nd
ing
12
/31
/18
Co
ns
ec
uti
ve
Fo
r Y
ea
rs E
nd
ing
MS
ER
SC
um
ula
tiv
e F
or
Ye
ars
En
din
g 1
2/3
1/2
01
8
Co
ns
ec
uti
ve
Fo
r Y
ea
rs E
nd
ing
4

1 Y
ear
2 Y
ear
3 Y
ear
4 Y
ear
5 Y
ear
6 Y
ear
7 Y
ear
8 Y
ear
9 Y
ear
10 Y
ear
MS
PR
S2
.79
.38
.67
.28
.09
.39
.78
.99
.39
.5
Pu
bli
c P
lan
- M
ed
ian
(>
$1
bil
lio
n)*
-2.9
6.3
6.7
5.1
5.3
7.2
8.0
7.1
7.8
8.5
Ra
nk
43
86
44
44
42
0
bp
Dif
fere
nc
e -
Me
dia
n5
61
29
91
94
20
12
62
21
31
72
18
61
51
10
6
12/1
812
/17
12/1
612
/15
12/1
412
/13
12/1
212
/11
12/1
012
/09
MS
PR
S2
.71
6.2
7.5
2.8
11
.31
6.2
12
.53
.31
2.6
11
.5
Pu
bli
c P
lan
- M
ed
ian
(>
$1
bil
lio
n)*
-2.9
15
.07
.90
.36
.91
5.9
13
.01
.31
2.9
18
.4
Ra
nk
43
56
43
34
46
91
36
08
8
bp
Dif
fere
nc
e -
Me
dia
n5
61
11
7-4
22
48
43
63
2-5
22
04
-29
-68
6
1 Y
ear
2 Y
ear
3 Y
ear
4 Y
ear
5 Y
ear
6 Y
ear
7 Y
ear
8 Y
ear
9 Y
ear
10 Y
ear
MJ
RS
2.7
9.3
8.7
7.2
7.9
9.2
9.6
8.8
9.2
9.2
Pu
bli
c P
lan
- M
ed
ian
(>
$1
bil
lio
n)*
-2.9
6.3
6.7
5.1
5.3
7.2
8.0
7.1
7.8
8.5
Ra
nk
43
86
44
55
62
5
bp
Dif
fere
nc
e -
Me
dia
n5
58
30
11
96
20
22
58
20
11
62
17
31
36
76
12/1
812
/17
12/1
612
/15
12/1
412
/13
12/1
212
/11
12/1
012
/09
MJ
RS
2.7
16
.37
.42
.81
1.0
15
.61
2.5
3.1
12
.29
.9
Pu
bli
c P
lan
- M
ed
ian
(>
$1
bil
lio
n)*
-2.9
15
.07
.90
.36
.91
5.9
13
.01
.31
2.9
18
.4
Ra
nk
43
36
53
35
37
01
56
99
0
bp
Dif
fere
nc
e -
Me
dia
n5
58
12
6-4
32
48
41
3-2
5-5
61
78
-66
-84
7
Cu
mu
lati
ve a
nd
Co
nse
cuti
veT
ota
l F
un
d R
etu
rns
MS
PR
SC
um
ula
tiv
e F
or
Ye
ars
En
din
g 1
2/3
1/1
8
Co
ns
ec
uti
ve
Fo
r Y
ea
rs E
nd
ing
MJR
SC
um
ula
tiv
e F
or
Ye
ars
En
din
g 1
2/3
1/1
8
Co
ns
ec
uti
ve
Fo
r Y
ea
rs E
nd
ing
*Sta
te S
tree
t Pub
lic F
unds
Uni
vers
e
5

State of Michigan Retirement System
ASSET ALLOCATION REVIEW State of Michigan Investment Board Meeting
March 7, 2019
Jon M. Braeutigam Chief Investment Officer Bureau of Investments

ST
AT
E O
F M
ICH
IGA
N R
ET
IRE
ME
NT
SY
ST
EM
PR
OF
ILE
- D
EC
EM
BE
R 2
018
Ass
et A
lloca
tion
By
Mar
ket V
alue
(In M
illio
ns)
12/3
1/20
1812
/31/
2017
D
om
es
tic
Eq
uit
y$
15
,693
22.6
%$1
7,05
124
.4%
P
riva
te E
qu
ity
12,5
4018
.0%
10,6
2915
.2%
Pen
sio
n P
lan
OP
EB
**C
om
bin
ed
In
tern
atio
nal
Eq
uit
y11
,084
16.0
%12
,990
18.6
%M
kt.
Val
ue
Mkt
. V
alu
eM
kt.
Val
ue
%
Fix
ed I
nco
me
8,89
412
.8%
8,67
512
.4%
8,01
711
.5%
6,10
38.
7%
MP
SE
RS
$47,
472
$6,0
22$5
3,49
476
.9%
7,04
510
.1%
6,96
410
.0%
M
SE
RS
- (
clo
se
d)
11,6
752,
475
14,1
5020
.4%
A
bso
lute
Ret
urn
4,28
06.
2%4,
002
5.7%
M
SP
RS
1,41
218
51,
597
2.3%
S
ho
rt T
erm
***
1,94
32.
8%3,
520
5.0%
M
JRS
- (c
los
ed
)25
41
255
0.4%
T
OT
AL
$69,
496
100.
0%$6
9,93
410
0.0%
T
OT
AL
$60,
813
$8,6
83$6
9,49
610
0.0%
MS
ER
S in
clud
es th
e M
ilita
ry P
ensi
on F
und
Sh
ort
Ter
m S
trat
egy*
**$1
.9
S
ho
rt T
erm
in
Oth
er I
nv.
Str
ateg
ies
0.6
TO
TA
L S
HO
RT
TE
RM
$2.5
3.6%
of
To
tal
Fu
nd
s
*Th
e co
mbi
ned
net p
ayou
t for
the
plan
s fo
r FY
201
7 w
as $
2.2
billio
n w
ith $
24.2
billi
on p
aid
out s
ince
FY
200
8 th
ru F
Y 2
017
(SO
MC
AFR
). T
his
repr
esen
ts th
e am
ount
pai
d to
ben
efic
iarie
s in
exc
ess
of e
mpl
oyer
and
em
ploy
ee c
ontri
butio
ns.
**O
PE
B -
Oth
er P
ost E
mpl
oym
ent B
enef
its
18th
Lar
gest
DB
Pub
lic P
ensi
on F
und
in th
e U
.S.
Pens
ions
& In
vest
men
ts S
urve
y - F
ebru
ary
4, 2
019
issu
e
Inve
stm
ent
Str
ateg
ies
Mar
ket V
alue
By
Plan
~ 1
2/31
/18
(in M
illio
ns)
R
eal
Est
ate
& I
nfr
a. Shor
t Ter
m E
quiv
alen
ts (i
n B
illio
ns)
R
ea
l R
etu
rn &
Op
po
rt.
Pri
vate
Eq
uit
y18
.0%
Inte
rnat
ion
al E
qu
ity
16.0
%
Rea
l R
etu
rn &
O
pp
ort
un
isti
c 11
.5% Fix
ed In
com
e 12
.8%
Ab
solu
te
Ret
urn
6.2%
Sh
ort
Ter
m2.
8%
Do
mes
tic
Eq
uit
y22
.6%
Rea
l E
stat
e &
In
fras
tru
ctu
re10
.1%
Ass
et A
lloca
tion
12/3
1/18
$44.5
$47.1
$49.7
$48.1
$51.0
$56.6
$60.7
$60.1
$62.2
$6
9.9$6
9.5
$0
$10
$20
$30
$40
$50
$60
$70
$80
Mar
ket V
alue
*(B
illio
ns o
f Dol
lars
)
1

A n
egat
ive
num
ber
in a
n as
set c
ateg
ory
indi
cate
s a
use
of c
ash,
a p
ositi
ve n
umbe
r in
dica
tes
a so
urce
of
cash
.D
olla
rs in
mill
ions
-$10
9-$
103
$769
$0
-$62
$723
-$76
4
-$2,
032
So
urc
es a
nd
Use
s o
f C
ash
Ja
nu
ary
20
18
~ D
ec
em
be
r 2
01
8
Ab
solu
teR
etu
rn
Fix
ed
Inco
me
Pri
vat
eE
qu
ity
Do
mes
tic
Eq
uit
y
Inte
rnat
ion
alE
qu
ity
Rea
l E
stat
e &
Infr
astr
uct
ure
Rea
l R
etu
rn &
Op
po
rtu
nis
tic
Net
Ben
efit
Pay
men
ts
1/01
/18
Bal
ance
of
Sh
ort
-Ter
m C
ash
:
$ 3
,521
12/3
1/18
Bal
ance
of
Sh
ort
-Ter
m C
ash
:
1,94
3
Net
Sh
ort
-Ter
m C
ash
Dec
reas
e:
$
1,57
8
2

SM
RS
Ass
et C
lass
12/3
1/18
Targ
et*
12/3
1/18
Targ
et*
12/3
1/18
Targ
et*
12/3
1/18
Targ
et*
Ran
ges
Do
mes
tic
Eq
uit
y22
.6%
28.0
%22
.6%
28.0
%22
.6%
28.0
%22
.6%
28.0
%20
% -
35%
Pri
vat
e E
qu
ity
18.0
%18
.0%
18.0
%18
.0%
18.0
%18
.0%
18.0
%18
.0%
10%
- 2
0%
Inte
rnat
ion
al E
qu
ity
15.9
%16
.0%
15.9
%16
.0%
15.9
%16
.0%
15.9
%16
.0%
15%
- 2
5%
Lo
ng
Ter
m F
ixed
In
com
e12
.8%
10.5
%12
.8%
10.5
%12
.8%
10.5
%12
.8%
10.5
%10
% -
20%
Ab
solu
te R
etu
rn6.
2%6.
0%6.
2%6.
0%6.
2%6.
0%6.
2%6.
0%3%
- 9
%
Sh
ort
Ter
m F
ixed
In
com
e2.
8%2.
0%2.
8%2.
0%2.
8%2.
0%2.
8%2.
0%1%
- 6
%
TO
TA
L10
0.0%
100.
0%10
0.0%
100.
0%10
0.0%
100.
0%10
0.0%
100.
0%
*Co
mp
lies
wit
h b
aske
t cl
ause
an
d i
nte
rnat
ion
al r
estr
icti
on
s.
As
of
12/3
1/18
MJ
RS
5% -
15%
Ass
et A
llo
cati
on
Tar
get
s
11.5
%9.
5%11
.5%
9.5%
11.5
%9.
5%11
.5%
9.5%
MS
PR
S
Rea
l Ret
urn
&
Op
po
rtu
nis
tic
MP
SE
RS
MS
ER
S
Rea
l Est
ate
&
Infr
astr
uct
ure
10.1
%10
.0%
10.1
%10
.0%
10.1
%5%
- 1
5%10
.0%
10.1
%10
.0%
3

State of Michigan Retirement System
MARKETS REVIEW AND OUTLOOK State of Michigan Investment Board Meeting
March 7, 2019
Gregory J. Parker, CFA Director of Investments – Public Markets
Director of Asset Allocation Bureau of Investments
CAPITAL MARKETS
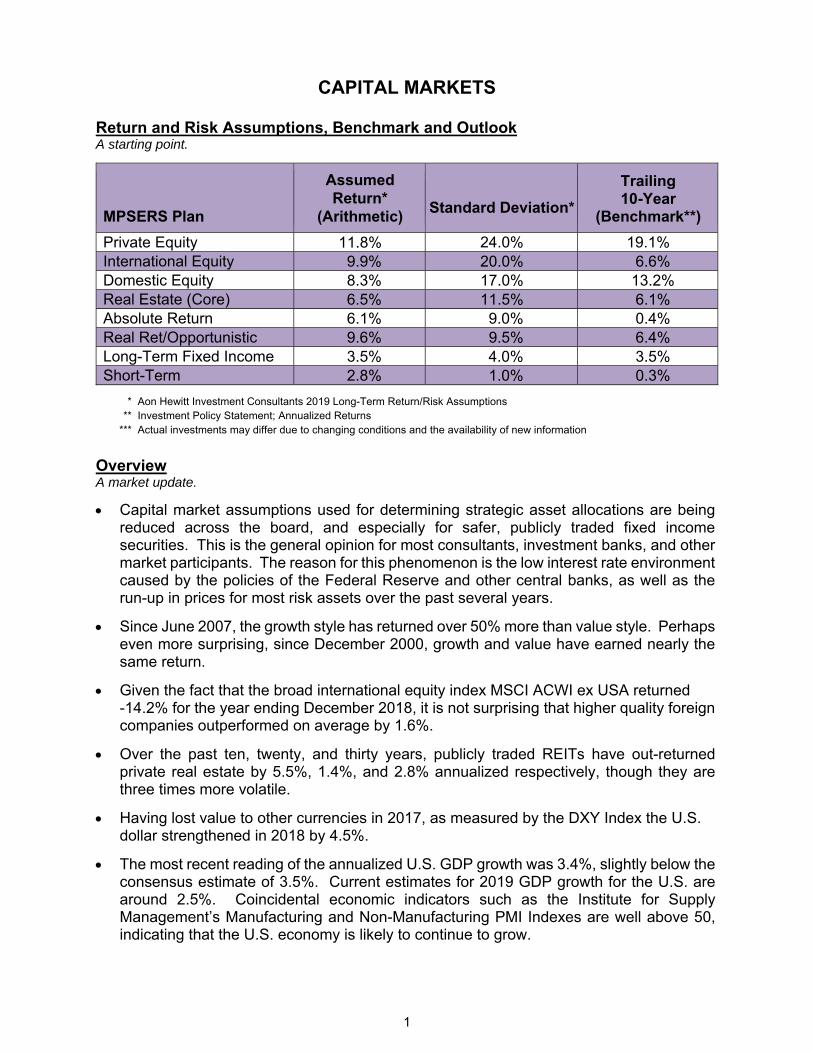
Return and Risk Assumptions, Benchmark and Outlook A starting point.
MPSERS Plan
Assumed Return*
(Arithmetic) Standard Deviation*
Trailing 10-Year
(Benchmark**)
Private Equity 11.8% 24.0% 19.1% International Equity 9.9% 20.0% 6.6% Domestic Equity 8.3% 17.0% 13.2% Real Estate (Core) 6.5% 11.5% 6.1% Absolute Return 6.1% 9.0% 0.4% Real Ret/Opportunistic 9.6% 9.5% 6.4% Long-Term Fixed Income 3.5% 4.0% 3.5% Short-Term 2.8% 1.0% 0.3%
* Aon Hewitt Investment Consultants 2019 Long-Term Return/Risk Assumptions** Investment Policy Statement; Annualized Returns
*** Actual investments may differ due to changing conditions and the availability of new information
Overview A market update.
Capital market assumptions used for determining strategic asset allocations are beingreduced across the board, and especially for safer, publicly traded fixed incomesecurities. This is the general opinion for most consultants, investment banks, and othermarket participants. The reason for this phenomenon is the low interest rate environmentcaused by the policies of the Federal Reserve and other central banks, as well as therun-up in prices for most risk assets over the past several years.
Since June 2007, the growth style has returned over 50% more than value style. Perhapseven more surprising, since December 2000, growth and value have earned nearly thesame return.
Given the fact that the broad international equity index MSCI ACWI ex USA returned-14.2% for the year ending December 2018, it is not surprising that higher quality foreigncompanies outperformed on average by 1.6%.
Over the past ten, twenty, and thirty years, publicly traded REITs have out-returnedprivate real estate by 5.5%, 1.4%, and 2.8% annualized respectively, though they arethree times more volatile.
Having lost value to other currencies in 2017, as measured by the DXY Index the U.S.dollar strengthened in 2018 by 4.5%.
The most recent reading of the annualized U.S. GDP growth was 3.4%, slightly below theconsensus estimate of 3.5%. Current estimates for 2019 GDP growth for the U.S. arearound 2.5%. Coincidental economic indicators such as the Institute for SupplyManagement’s Manufacturing and Non-Manufacturing PMI Indexes are well above 50,indicating that the U.S. economy is likely to continue to grow.
1

International Equity A compelling case.
International equities continue to underperform domestic equities. Over the year ending December 2018, the international market index, MSCI ACWI ex USA, underperformed the S&P 1500 index by -9.2%. Over the past three, five, seven, and ten years, international underperformed domestic by -4.7%, -7.6%, -7.7, and -6.6% annualized, respectively.
Based on a forward estimated price-to-earnings valuation multiple, developed international markets trade at approximately a 20% discount to U.S. counterparts while emerging markets are at a 25% discount.
Year-over-year earnings growth for international markets is estimated to be roughly 9.8% for the year. Earnings in international markets can grow around 30% just to get back to all-time highs, suggesting that there could be a runway for earnings to grow at a high rate for some time. Trading at a valuation multiple discount, international equity represents a leveraged play on continued global growth.
Within international equities, emerging markets underperformed developed markets last year by -0.5%. Over the past three and five years, emerging beat developed by 6.1% and 1.3% annualized, respectively. The plan is overweight emerging markets, with a weight of 30.8% compared to the benchmark weight of 25.7%.
Given the fact that the broad international equity index MSCI ACWI ex USA returned -14.2% for the year ending December 2018, it is not surprising that higher quality foreign companies outperformed on average by 1.6%.
The plan is underweight international equity against a global benchmark (approximately 41% versus 45% of total public equity) though at a higher allocation than the peer median allocation; 16.0% versus peer median of 14.6%.
Domestic Equity High earnings growth.
The broad U.S. stock market return for the one year ending December 2018 was -4.4%. Small caps have underperformed larger caps over the past decade. Over the past one, three, five, seven, and ten years, small caps have underperformed large caps by -6.6%, -1.9%, -4.1%, -2.3% and -1.2% annualized, respectively.
Meanwhile, growth extended its dominance over value stocks in the U.S., having outperformed by 8.5%, 3.3%, 4.2%, 2.8% and 3.5% annualized over the past one, three, five, seven and ten years, respectively. Since June 2007, the growth style has returned over 50% more than value style. Perhaps even more surprising, since December 2000, growth and value have earned nearly the same return.
Analysts are estimating year-over-year growth in earnings for the next year to be nearly 12%, which is about half the rate of the trailing twelve months, but almost twice as fast as the cumulative average growth rate of the past 40 years.
Many valuation metrics are near historical averages. However, the absolute returns over the next cycle may not be as strong as the historical average of 11 – 12% year-over-year total returns. One reason for this is the fact that market EPS is above trend as is returns on equity. However, the largest securities in the market today are less cyclical (economically sensitive) as past market leaders.
2

Interest Rates The Fed on pause?
At the end of December 2018, the U.S. 10-year Treasury was yielding only 17 basis points more than the 2-year Treasury. That is the narrowest spread between the two rates since June 2007 and the dawning of the global financial crisis.
Flat yield curves are often viewed as worrisome. One material difference between the environment of today’s flat yield curve and the one in 2007 is the fact that the current Fed Fund’s rate is accommodative by historical standards, yielding a real yield of close to 0.5% while in the summer of 2007 the real yield was close to 2.5%.
At its December 2018 meeting, the Federal Reserve Board voted to raise its key interest rate by an additional 25 basis points, the ninth of this tightening cycle. At the beginning of 2019, the market has priced in very low odds of a tenth tightening, and in fact is now saying that there is a slight chance of a Fed cut in late 2019.
Spreads on investment-grade fixed income are just slightly above its average level of 1.1%. Spreads on riskier high-yield assets are slightly tighter at around 30 basis points below average. The plan has reduced its credit exposure and has instead allocated towards securitized assets which now represent 36.0% of the fixed income portfolio. Over the past year ending December 2018, the Structured Fixed Income portfolio returned 3.2% while the benchmark Aggregate index was essentially flat.
Real Estate REIT market adjustment.
Over the one year ending December 2018, the REIT market, as measured by the NAREIT index, fell -4.1% including its dividend yield.
Dividend yields on REITs are around 3.9% which is 1.25% higher than the yield of the ten-year U.S. Treasury and at its historical average spread.
Although investing in similar assets, the returns of publicly traded REITs (measured by NAREIT) and private real estate (measured by the NCREIF-ODCE Index), have historically been lowly (and at times are anti) correlated to one another. Over the past ten, twenty, and thirty years, publicly traded REITs have out-returned private real estate by 5.5%, 1.4%, and 2.8% annualized, respectively, though they are three times more volatile.
Commodities Falling prices.
Over the past ten years, commodities prices broadly have been falling, as measured by the Thomson Reuters CRB Commodity Index, down more than 60% from the peak in 2008 and, since their lows in 2016, prices are up less than 10%.
The price for crude oil has decreased over the past year ending December 2018, down 25% year-over-year to approximately $45.40 per barrel.
Having lost value to other currencies in 2017, as measured by the DXY Index the U.S. dollar strengthened in 2018 by 4.5%.
3

1999
2000
2001
2002
2003
2004
2005
2006
2007
2008
2009
2010
2011
2012
2013
2014
2015
2016
2017
2018
Bes
tIn
t'l
Gov
'tC
orp.
Gov
'tIn
t'l
Int'
lR
eal
Int'
lIn
t'l
Gov
'tIn
t'l
U.S
.R
eal
Int'
lU
.S.
U.S
.R
eal
U.S
.In
t'l
Rea
lB
est
Equ
ity
Bon
dsB
onds
Bon
dsE
quit
yE
quit
yE
stat
eE
quit
yE
quit
yB
onds
Equ
ity
Equ
ity
Est
ate
Equ
ity
Equ
ity
Equ
ity
Est
ate
Equ
ity
Equ
ity
Est
ate
26.9
7%13
.23%
10.4
0%11
.50%
40.8
2%20
.90%
20.0
6%26
.65%
16.6
5%12
.38%
41.4
4%16
.38%
14.2
6%16
.83%
32.8
0%13
.08%
13.3
2%11
.93%
27.1
9%6.
71%
U.S
.R
eal
Rea
lC
orp.
U.S
.R
eal
Int'
lR
eal
Rea
lC
ash
U.S
.R
eal
Gov
'tU
.S.
Int'
lR
eal
U.S
.R
eal
U.S
.In
fla-
Equ
ity
Est
ate
Est
ate
Bon
dsE
quit
yE
stat
eE
quit
yE
stat
eE
stat
eE
quit
yE
stat
eB
onds
Equ
ity
Equ
ity
Est
ate
Equ
ity
Est
ate
Equ
ity
tion
20.2
7%12
.24%
7.28
%10
.52%
29.5
8%14
.48%
16.6
2%16
.59%
15.8
4%2.
05%
27.2
4%13
.11%
9.02
%16
.17%
15.2
9%11
.81%
1.01
%7.
97%
21.1
3%1.
91%
Hed
geC
orp.
Gov
'tR
eal
Hed
geU
.S.
U.S
.U
.S.
Gov
'tIn
fla-
Cor
p.In
t'l
Cor
p.R
eal
Rea
lC
orp.
Gov
'tC
orp.
Rea
lC
ash
Fund
sB
onds
Bon
dsE
stat
eFu
nds
Equ
ity
Equ
ity
Equ
ity
Bon
dsti
onB
onds
Equ
ity
Bon
dsE
stat
eE
stat
eB
onds
Bon
dsB
onds
Est
ate
18.9
3%9.
40%
7.24
%6.
74%
9.01
%11
.78%
5.65
%15
.34%
8.67
%0.
10%
16.0
5%11
.15%
8.35
%10
.54%
10.9
9%7.
53%
0.86
%5.
63%
6.96
%1.
88%
Rea
lC
ash
Cas
hH
edge
Rea
lH
edge
Hed
geH
edge
Hed
geC
orp.
Hed
geC
orp.
Infl
a-C
orp.
Hed
geG
ov't
Infl
a-In
t'l
Cor
p.G
ov't
Est
ate
Fund
sE
stat
eFu
nds
Fund
sFu
nds
Fund
sB
onds
Fund
sB
onds
tion
Bon
dsFu
nds
Bon
dsti
onE
quit
yB
onds
Bon
ds
11.3
6%6.
16%
4.43
%3.
57%
8.99
%5.
83%
5.13
%9.
21%
7.68
%-3
.07%
9.65
%8.
46%
2.96
%9.
37%
7.70
%4.
92%
0.66
%4.
50%
6.42
%0.
88%
Cas
hH
edge
Hed
geIn
fla-
Cor
p.C
orp.
Infl
a-C
ash
U.S
.R
eal
Infl
a-G
ov't
U.S
.H
edge
Infl
a-H
edge
Hed
geIn
fla-
Hed
geH
edge
Fund
sFu
nds
tion
Bon
dsB
onds
tion
Equ
ity
Est
ate
tion
Bon
dsE
quit
yFu
nds
tion
Fund
sFu
nds
tion
Fund
sFu
nds
4.83
%5.
77%
3.11
%2.
39%
7.69
%5.
25%
3.42
%4.
81%
5.47
%-6
.46%
2.72
%5.
52%
1.75
%4.
22%
1.49
%3.
14%
0.37
%2.
09%
3.88
%-1
.05%
Infl
a-In
fla-
Infl
a-C
ash
Gov
'tG
ov't
Cas
hC
orp.
Cor
p.H
edge
Cas
hH
edge
Cas
hG
ov't
Cas
hIn
fla-
Cas
hH
edge
Gov
'tC
orp.
tion
tion
tion
Bon
dsB
onds
Bon
dsB
onds
Fund
sFu
nds
Bon
dsti
onFu
nds
Bon
dsB
onds
2.68
%3.
39%
1.55
%1.
79%
2.36
%3.
48%
3.06
%4.
27%
5.10
%-1
9.86
%0.
19%
5.07
%0.
10%
2.02
%0.
07%
0.68
%0.
01%
1.89
%2.
30%
-2.5
1%C
orp.
U.S
.U
.S.
Int'
lIn
fla-
Infl
a-G
ov't
Gov
'tC
ash
U.S
.G
ov't
Infl
a-H
edge
Infl
a-C
orp.
Cas
hC
orp.
Gov
'tIn
fla-
U.S
.B
onds
Equ
ity
Equ
ity
Equ
ity
tion
tion
Bon
dsB
onds
Equ
ity
Bon
dsti
onFu
nds
tion
Bon
dsB
onds
Bon
dsti
onE
quit
y
-1.9
4%-6
.98%
-10.
64%
-14.
95%
1.88
%3.
25%
2.65
%3.
46%
5.03
%-3
6.72
%-2
.19%
1.50
%-3
.55%
1.70
%-2
.01%
0.04
%-0
.77%
1.05
%2.
12%
-4.9
6%G
ov't
Int'
lIn
t'l
U.S
.C
ash
Cas
hC
orp.
Infl
a-In
fla-
Int'
lR
eal
Cas
hIn
t'l
Cas
hG
ov't
Int'
lIn
t'l
Cas
hC
ash
Int'
lB
onds
Equ
ity
Equ
ity
Equ
ity
Bon
dsti
onti
onE
quit
yE
stat
eE
quit
yB
onds
Equ
ity
Equ
ity
Equ
ity
Wo
rst
-2.2
5%-1
5.31
%-1
9.74
%-2
1.30
%1.
16%
1.33
%1.
95%
2.55
%4.
06%
-45.
52%
-16.
86%
0.13
%-1
3.71
%0.
11%
-2.6
0%-3
.87%
-5.6
7%0.
27%
0.84
%-1
4.20
%W
ors
t
An
nu
aliz
ed R
etu
rns
1999
- 2
018
Cas
hIn
fl.
Hed
geG
ov't
.C
orp.
Int'
l.U
S E
q.R
.E.
Ret
urn
1.90
%2.
17%
3.73
%4.
12%
5.24
%4.
64%
5.99
%8.
97%
Ret
urn
Ris
k1.
01%
1.34
%5.
14%
4.46
%5.
18%
18.8
5%16
.06%
4.55
%R
isk
- H
edge
Fun
ds a
re r
epre
sent
ed b
y th
e H
FR
I FO
F C
onse
rvat
ive
Inde
x-
U.S
. Equ
ity is
rep
rese
nted
by
the
S&
P 1
500
- In
flatio
n is
rep
rese
nted
by
the
U.S
. Con
sum
er P
rice
Inde
x-
Rea
l Est
ate
is r
epre
sent
ed b
y th
e N
PI
- In
tern
atio
nal E
quity
is r
epre
sent
ed b
y th
e M
SC
I - A
C W
orld
EX
-US
A In
dex
- C
orpo
rate
Bon
ds a
re r
epre
sent
ed b
y th
e B
arcl
ays
Cap
ital -
Cre
dit I
ndex
- C
ash
is r
epre
sent
ed b
y 30
-day
T-B
ills
- G
over
nmen
t Bon
ds a
re r
epre
sent
ed b
y th
e B
arcl
ays
Cap
ital U
.S. G
over
nmen
t
An
nu
al
To
tal
Ret
urn
s o
f K
ey A
sset
Cla
sses
199
9 -
2018
4

State of Michigan Retirement System
DEFINED CONTRIBUTION REVIEW
State of Michigan Investment Board Meeting March 7, 2019
Woodrow S. TylerSenior Investment Manager
Defined Contribution, Trusts & Agencies Division

EXECUTIVE SUMMARY
Overview
The State of Michigan’s Defined Contribution (DC) plan has over 177,590 participants across four constituent bases as shown below. The State’s DC program initially started as a supplemental retirement plan, but for many of the plans it is now participants’ primary retirement vehicle.
DC plans are participant led investments. The role of the Bureau of Investments is to offer a sufficient range of investment options to allow the Participants to diversify their individual retirement accounts and construct portfolios that reasonably span the risk/return spectrum. To this end, the Plans may be comprised of at least one investment option from the categories below.
SOM Plans
(12-31-18)
Number of
Participants
Combined 401k & 457
State Employees 74,611 $6,979
School Employees 101,326 585
Judges 686 253
State Police 968 23
Total 177,591 $7,841 ($ in millions)
Investments Options
Tier I: Target Date Funds and Passively Managed Index Funds Target Date Funds (TDFs) are the default option for plan participants. Each TDF seeks
to achieve its objective by investing in a set of underlying index funds representing various asset classes. Over time, the allocation to asset classes and funds change according to a predetermined "glide path" and will become more conservative as it approaches the target retirement date.
Passively Managed Index Funds are comprised of low-cost index funds which seek to replicate the performance of a variety of cash, bond and stock indices with very little tracking error and at a low fee.
Tier II: Actively Managed Funds These are funds actively managed by investment managers in an attempt to
outperform various cash, bond and stock indices over long periods of time.
Tier III: Self Directed Brokerage Account – Non-Core Options TD Ameritrade provides access to a broad range of investment choices including
individual stocks, bonds, CDs, over 100 commission-free ETFs, and more than 13,000 mutual funds—including more than 2,100 no-load, no-transaction-fee (NTF) mutual funds.
1

Investment Selection The selection of each investment option for the Plans is to be based on the prudence
standards set by the Governing Documents and applicable law, with flexibility built-in to allow a search to take full advantage of strategic opportunities. The search will focus on finding opportunities which are tailored to the Plans’ specific needs. The BOI, in consultation with the Office of Retirement Services (ORS), will establish search criteria that aligns with the purpose and objective an investment option is seeking to attain. Due diligence will be completed with the goal of selecting a plan that, in the totality of circumstances, offers fair and reasonable investment options for the Plan participants.
With respect to Tier III investments, the universe of available options is extensive. Since the selection of investments is directed solely by the Participants which elect the Tier III option, the State does not provide any criteria for selecting or monitoring these non-core investment options.
Investment Monitoring The ORS and the BOI may examine each investment option as circumstances require,
to ensure that a particular investment option’s investment style and other relevant investment criteria, such as performance, fee and expense levels or the occurrence of a significant change are acceptable, given the purpose of each investment option.
Market Environment and Outlook Structural changes in the U.S. retirement system are supporting growth in the DC
industry: o Rapid decline of employer funded pensions o Potential erosion of Social Security benefits o Workforce aging o New regulations, specifically, the Pension Protection Act of 2006;
Automatically enroll employees into the DC plan Establish safe harbor investments known as QDIA
In an effort to simplify the investment process for participants, industry trend has been to
reduce the number of investment options offered in a DC plan. Based on the recent CEM benchmark report, the average number of investments offered by similarly sized plans is 13 options. The State of Michigan currently offers 20 investment options. The desired outcome of streamlining would be to benefit from economies of scale and ease the burden of asset allocation at the participant level.
Another trend in the industry is the focus on retirement income. As fewer individuals have access to pension plans and DC plans have become the primary retirement vehicle for many Americans, more plan sponsors are exploring the ability to generate sustainable income in retirement.
2

Target Date Funds The Pension Protection Act of 2006 established safe harbor investments known as Qualified Default Investment Alternative (QDIA). To qualify as a QDIA, the investment must offer; “a mix of investments which take into account the individual’s age or retirement date.” Target Date Funds (TDFs) are an example of this. Over time, the allocation to asset classes and funds change according to a predetermined "glide path" and will become more conservative as it approaches the target retirement date. The allocations in the glide path are not due to tactical decisions to overweight or underweight a particular asset class based on its market outlook. Because index funds are used, each Fund attempts to closely match the characteristics and returns of its custom benchmark as opposed to any attempts to outperform this benchmark.
Ret. Income
TDF 2015
TDF 2020TDF 2025
TDF 2030
TDF 2035TDF 2040
TDF 2045
TDF 2050
TDF 2055
TDF 2060
0.0
2.0
4.0
6.0
8.0
10.0
12.0
0 0.2 0.4 0.6 0.8 1 1.2 1.4
Return %
Beta
Return vs Beta 2015 ‐ 2018
3

Index Funds Tier I is comprised of low-cost funds which seek to replicate the performance of a variety of bond and stock market indices.
Actively Managed FundsTier II is comprised of actively managed funds which attempt to outperform various bond and stock indices.
Non-Core Options Tier III is a Self Directed Brokerage Account.
Short Term Investments
SSgA Bond Fund
S&P 500 Index
S&P Midcap
Global Equities Fund
Emerging Markets Fund
0.0
2.0
4.0
6.0
8.0
10.0
12.0
0 0.2 0.4 0.6 0.8 1 1.2 1.4
Return %
Beta
Return vs Beta 2015 ‐ 2018
Stable Value
PIMCO Total ReturnPrudential High Yield
Oakmark
Dodge & CoxT. Rowe Price Mid Cap
Value
Artisan Mid‐Cap Growth
Virtus Small Cap Value
VoyaSmall Cap Growth
American Funds EuroPacific Growth
Jennison Large Cap Growth
0.0
2.0
4.0
6.0
8.0
10.0
12.0
0 0.2 0.4 0.6 0.8 1 1.2 1.4
Return %
Beta
Return vs Beta 2015 ‐ 2018
4

Plan Awards and Recognitions 2014-2018 2018 2018 Signature Award
ORS tied for third place in the Retirement Readiness category of the 2018 Signature Awards, presentedby the Plan Sponsor Council of America (PSCA) during its 71st annual National Conference inScottsdale, Arizona. The Signature Award recognizes excellence in retirement plan communications toboth plan sponsors and plan participants. ORS and Voya Financial received the award for the Women'sGuide to Retirement. The guide was developed after focus group and survey results showed thatwomen had significant concerns about retirement. The 16-page guide breaks planning for retirementdown into achievable steps and provides web and phone resources.
Two NAGDCA Leadership AwardsORS received two 2017 Leadership Recognition Awards through the National Association ofGovernment Defined Contribution Administrators (NAGDCA). These awards recognize DC plans fortheir outstanding achievements. The Road to Retirement campaign won the award for outstandingachievement in Technology and Social Media. The Small Steps campaign won the award foroutstanding achievement in Plan Design.
2016 State of Michigan and Voya Financial® win Plan Sponsor Council of America (PSCA) Signature
AwardFor the second consecutive year, ORS received a Signature Award from PSCA. The NearingRetirement Guide from The State of Michigan and Voya® took second place in PSCA's PlanPublications for Participants category. The guide is handed out during ORS's Pre-RetirementOrientations and at Voya's Get Ready to Retire seminars.
2015 ORS and Voya share Eddy Award
ORS won second place as the plan sponsor in the Special Projects category for public plans at theEddy Awards. The Eddy Award is the annual recognition by Pensions & Investments (P&I) of bestpractices by defined contribution plans in providing investment education to participants. VoyaFinancial™, which designed the award-winning campaign, shares the award with ORS. The winningentry was the “Mix It Up” campaign, designed to give state employee 401(k) participants a simple wayto improve their investment mix.
ORS recognized with two industry awardsNAGDCA, the National Association of Government Defined Contribution Administrators, Inc., selectedORS to receive two 2014 Leadership Awards. The first award was in the EffectiveCommunication/Participant Education category, while the second award was in the Plan Designcategory. Plan design covers how the DC plan functions – what features are offered to plan participants,investment portfolio options, loan or withdrawal provisions, and other aspects covering how the DCplan work.
2014 NAGDCA Award
ORS has been chosen as a recipient of the 2013 Leadership Recognition Award through the NationalAssociation of Government Defined Contribution Administrators' (NAGDCA). This award recognizesdefined contribution plans for outstanding achievements in Participant Education and EffectiveCommunication. Only the top five projects in each category receive a Leadership Award, and this is thethird year in a row ORS has been recognized.
Best in Show AwardThe State of Michigan 401(k) & 457 Plans have won a Best in Show award from the Insurance andFinancial Communicators Association. Chosen from 650 submissions, the award recognizes thecreativity, design, and writing in the State of Michigan Match Campaign.
Plan Sponsor AwardORS was awarded as a finalist for the 2014 PLAN SPONSOR Plan Sponsor of the Year award in thePublic DC category for our 457 Plan. The finalists were featured in the March 2014 issue ofPLANSPONSOR Magazine.
5
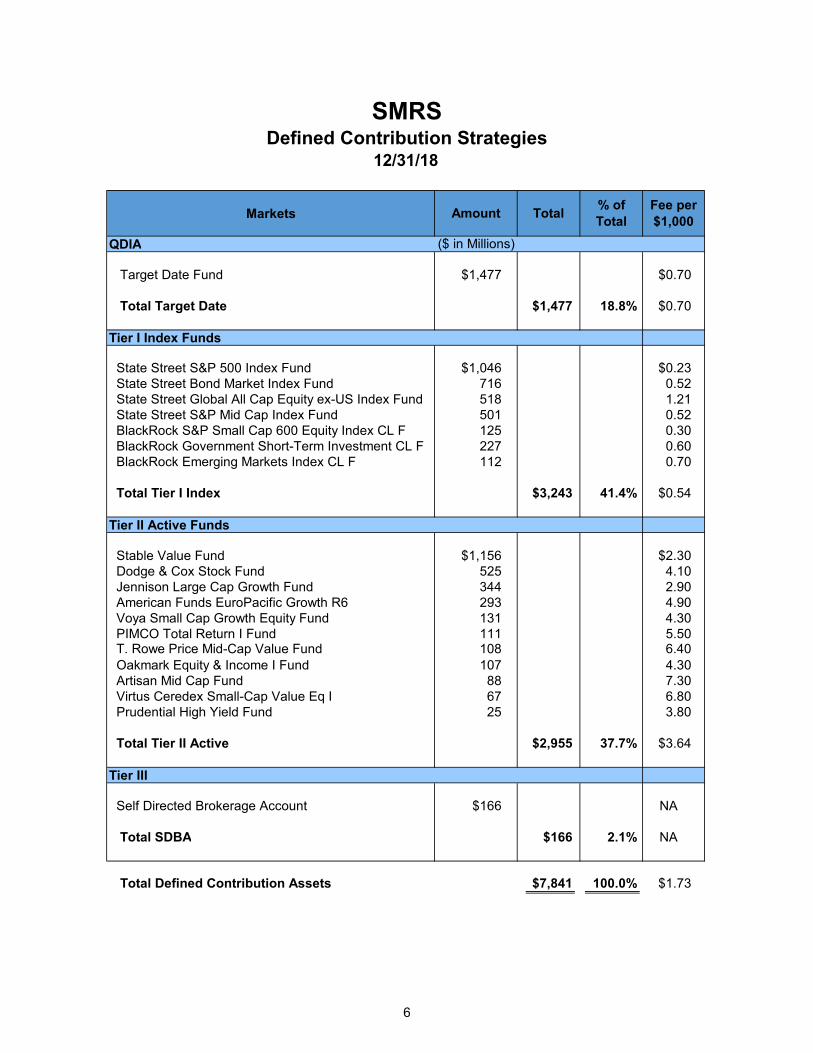
SMRSDefined Contribution Strategies
Markets
QDIA
Target Date Fund $1,477 $0.70
Total Target Date $1,477 18.8% $0.70
Tier I Index Funds
State Street S&P 500 Index Fund $1,046 $0.23 State Street Bond Market Index Fund 716 0.52 State Street Global All Cap Equity ex-US Index Fund 518 1.21 State Street S&P Mid Cap Index Fund 501 0.52 BlackRock S&P Small Cap 600 Equity Index CL F 125 0.30 BlackRock Government Short-Term Investment CL F 227 0.60 BlackRock Emerging Markets Index CL F 112 0.70
Total Tier I Index $3,243 41.4% $0.54
Tier II Active Funds
Stable Value Fund $1,156 $2.30 Dodge & Cox Stock Fund 525 4.10 Jennison Large Cap Growth Fund 344 2.90 American Funds EuroPacific Growth R6 293 4.90 Voya Small Cap Growth Equity Fund 131 4.30 PIMCO Total Return I Fund 111 5.50 T. Rowe Price Mid-Cap Value Fund 108 6.40 Oakmark Equity & Income I Fund 107 4.30 Artisan Mid Cap Fund 88 7.30 Virtus Ceredex Small-Cap Value Eq I 67 6.80 Prudential High Yield Fund 25 3.80
Total Tier II Active $2,955 37.7% $3.64
Tier III
Self Directed Brokerage Account $166 NA
Total SDBA $166 2.1% NA
Total Defined Contribution Assets $7,841 100.0% $1.73
12/31/18
Amount Total
($ in Millions)
% of Total
Fee per $1,000
6

SMRSDefined Contribution by Investment Strategy
12/31/18
Market Value in Millions
12/31/18 12/31/17Passive Strategies $3,243 41.4% $4,548 55.2%Active Strategies 2,955 37.7% 2,123 25.8%Target Date Retirement Fund 1,477 18.8% 1,382 16.8%Self Managed Account 166 2.1% 184 2.2%
Total Investments $7,841 100.0% $8,237 100.0%
*Loan Fund $192M as of 12/31/18
Passive Strategies
41.4%
Active Strategies37.7%
Target Date Retirement Fund
18.8%
Self Managed Account
2.1%
7

Fund Name Market Value 1-Year 3-Years 5-Years 10-Years
State Street Target Retirement Income Fund $36,495,096 -2.8% 3.7% 2.7% 5.6%State Street Income Custom Index -2.8% 3.7% 2.7% 5.8%Morningstar Target-Date Retirement -3.2% 3.4% 2.5% 5.7%Variance State Street Income Custom Index 0.0% 0.0% 0.0% -0.2%Variance Morningstar Target-Date Retirement 0.4% 0.2% 0.1% -0.1%
State Street Target Retirement 2015 Fund 51,679,117 -3.1% 4.4% 3.3% 7.5%State Street 2015 Custom Index -3.2% 4.3% 3.3% 7.6%Morningstar Target-Date 2015 -3.9% 4.3% 3.2% 6.9%Variance State Street 2015 Custom Index 0.0% 0.0% 0.0% -0.1%Variance Morningstar Target-Date 2015 0.8% 0.1% 0.2% 0.6%
State Street Target Retirement 2020 Fund 122,746,583 -4.5% 5.2% 3.9% 8.5%State Street 2020 Custom Index -4.5% 5.1% 3.9% 8.5%Morningstar Target-Date 2020 -4.6% 4.4% 3.2% 7.3%Variance State Street 2020 Custom Index 0.0% 0.1% 0.0% 0.0%Variance Morningstar Target-Date 2020 0.1% 0.8% 0.6% 1.1%
State Street Target Retirement 2025 Fund 151,640,528 -5.9% 5.8% 4.3% 9.1%State Street 2025 Custom Index -5.9% 5.8% 4.3% 9.2%Morningstar Target-Date 2025 -5.4% 5.0% 3.7% 8.3%Variance State Street 2025 Custom Index 0.0% 0.0% 0.0% -0.1%Variance Morningstar Target-Date 2025 -0.5% 0.8% 0.7% 0.8%
State Street Target Retirement 2030 Fund 165,505,713 -6.7% 6.1% 4.5% 9.6%State Street 2030 Custom Index -6.7% 6.0% 4.5% 9.7%Morningstar Target-Date 2030 -6.3% 5.4% 3.8% 8.6%Variance State Street 2030 Custom Index 0.0% 0.0% 0.0% -0.1%Variance Morningstar Target-Date 2030 -0.4% 0.7% 0.6% 1.1%
State Street Target Retirement 2035 Fund 176,168,615 -7.3% 6.3% 4.6% 9.9%State Street 2035 Custom Index -7.3% 6.3% 4.6% 10.0%Morningstar Target-Date 2035 -7.1% 5.8% 4.1% 9.2%Variance State Street 2035 Custom Index 0.0% 0.1% 0.0% -0.1%Variance Morningstar Target-Date 2035 -0.3% 0.5% 0.5% 0.7%
State Street Target Retirement 2040 Fund 169,494,516 -7.9% 6.6% 4.7% 10.0%State Street 2040 Custom Index -7.9% 6.5% 4.7% 10.1%Morningstar Target-Date 2040 -7.8% 5.9% 4.2% 9.3%Variance State Street 2040 Custom Index 0.0% 0.1% 0.0% -0.1%Variance Morningstar Target-Date 2040 -0.1% 0.7% 0.5% 0.8%
State Street Target Retirement 2045 Fund 169,012,014 -8.4% 6.7% 4.7% 10.1%State Street 2045 Custom Index -8.5% 6.6% 4.7% 10.1%Morningstar Target-Date 2045 -8.1% 6.1% 4.3% 9.6%Variance State Street 2045 Custom Index 0.0% 0.1% 0.0% -0.1%Variance Morningstar Target-Date 2045 -0.3% 0.6% 0.4% 0.4%
State Street Target Retirement 2050 Fund 207,969,361 -8.6% 6.7% 4.7% 10.1%State Street 2050 Custom Index -8.6% 6.6% 4.7% 10.1%Morningstar Target-Date 2050 -8.4% 6.1% 4.3% 9.5%Variance State Street 2050 Custom Index 0.0% 0.1% 0.0% -0.1%Variance Morningstar Target-Date 2050 -0.1% 0.6% 0.4% 0.5%
State Street Target Retirement 2055 Fund 189,330,185 -8.6% 6.7% 4.7% N/AState Street 2055 Custom Index -8.6% 6.6% 4.7% N/AMorningstar Target-Date 2055 -8.4% 6.2% 4.4% N/AVariance State Street 2055 Custom Index 0.0% 0.1% 0.0% N/AVariance Morningstar Target-Date 2055 -0.1% 0.5% 0.3% N/A
Defined Contribution Performance by Fund12/31/18
8

Fund Name Market Value 1-Year 3-Years 5-Years 10-Years
State Street Target Retirement 2060 Fund $37,126,336 -8.5% 6.7% N/A N/AState Street 2060 Custom Index -8.6% 6.6% N/A N/AMorningstar Target-Date 2060+ -8.5% 6.2% N/A N/AVariance State Street 2060 Custom Index 0.0% 0.1% N/A N/AVariance Morningstar Target-Date 2060+ 0.0% 0.5% N/A N/A
TIER I
State Street S&P 500 Index Fund 1,045,641,904 -4.4% 9.2% 8.5% 13.1%S&P 500 Index -4.4% 9.3% 8.5% 13.1%Morningstar Large Blend -6.2% 7.5% 6.3% 11.4%Variance S&P 500 Index 0.0% 0.0% 0.0% 0.0%Variance Morningstar Large Blend 1.8% 1.7% 2.2% 1.6%
State Street Bond Market Index Fund 715,603,370 0.0% 2.0% 2.5% 3.4%Bloomberg Barclays U.S. Aggregate Index 0.0% 2.1% 2.5% 3.5%Morningstar Intermediate-Term Bond -0.5% 2.1% 2.2% 4.3%Variance Bloomberg Barclays U.S. Aggregate Index 0.0% -0.1% 0.0% -0.1%Variance Morningstar Intermediate-Term Bond 0.5% -0.1% 0.2% -0.9%
State Street Global All Cap Equity ex-U.S. Index Fund 517,884,681 -14.6% 4.8% 1.0% N/AMSCI ACWI ex USA IMI (Net) -14.8% 4.4% 0.9% N/AMorningstar Foreign Large Blend -14.6% 2.5% 0.1% N/AVariance MSCI ACWI ex USA IMI (Net) 0.2% 0.4% 0.2% N/AVariance Morningstar Foreign Large Blend 0.0% 2.3% 0.9% N/A
State Street S&P Mid Cap Index Fund 501,266,011 -11.1% 7.6% 6.0% 13.6%S&P 400 Index -11.1% 7.7% 6.0% 13.7%Morningstar Mid-Cap Blend -11.3% 5.3% 3.8% 11.7%Variance S&P 400 Index 0.0% 0.0% -0.1% -0.1%Variance Morningstar Mid-Cap Blend 0.2% 2.3% 2.2% 1.9%
BlackRock Government Short-Term Investment CL F 226,745,077 1.8% 1.0% 0.6% N/ABofA Merill Lynch US 3-Month Treasury Bill Index 1.9% 1.0% 0.6% N/AVariance BofA Merill Lynch US 3-Month Treasury Bill Index 0.0% 0.0% 0.0% N/A
BlackRock S&P Small Cap 600 Equity Index CL F 124,519,131 -8.5% N/A N/A N/ARussell 2000 Index -11.0% N/A N/A N/AMorningstar Small Blend -12.7% N/A N/A N/AVariance Russell 2000 Index 2.5% N/A N/A N/AVariance Morningstar Small Blend 4.2% N/A N/A N/A
BlackRock Emerging Markets Index CL F 111,538,819 -14.6% 9.4% 1.6% N/AMSCI Emerging Market (Net) -14.6% 9.3% 1.7% N/AMorningstar Diversified Emerging Mkts -16.1% 6.9% 0.4% N/AVariance MSCI Emerging Market (Net) 0.0% 0.2% -0.1% N/AVariance Morningstar Diversified Emerging Mkts 1.5% 2.5% 1.1% N/A
TIER II
Stable Value Fund 1,155,620,948 2.1% 2.1% 2.1% 2.2%Barclays Int Gov/Credit A or Higher Index 1.2% 1.4% 1.7% 2.4%Hueler Universe 2.2% 2.0% 1.9% 2.2%Variance Barclays Int. Gov Credit A or Better Index 0.9% 0.7% 0.5% -0.2%Variance Hueler Universe -0.2% 0.1% 0.3% 0.0%
Dodge & Cox Stock Fund 525,248,803 -7.6% 9.9% 7.0% 13.1%Russell 1000 Value Index -8.3% 7.0% 6.0% 11.2%Morningstar Large Value -8.6% 6.7% 5.1% 10.5%Variance Russell 1000 Value Index 0.7% 2.9% 1.0% 1.9%Variance Morningstar Large Value 1.0% 3.1% 1.8% 2.7%
9

Fund Name Market Value 1-Year 3-Years 5-Years 10-Years
Jennison Large Cap Growth Fund $344,316,131 0.2% 11.5% N/A N/ARussell 1000 Growth Index -1.5% 11.2% N/A N/AMorningstar Large Growth -2.2% 8.9% N/A N/AVariance Russell 1000 Growth Index 1.7% 0.3% N/A N/AVariance Morningstar Large Growth 2.4% 2.6% N/A N/A
American Funds EuroPacific Growth R6 292,594,522 -14.9% 4.1% 1.9% 7.7%MSCI EAFE Index - Net Div -13.8% 2.9% 0.5% 6.3%Morningstar Foreign Large Blend -14.6% 2.5% 0.1% 5.8%Variance MSCI EAFE Index - Net Div -1.1% 1.2% 1.3% 1.4%Variance Morningstar Foreign Large Blend -0.3% 1.5% 1.7% 1.8%
Voya Small Cap Growth Equity Fund 131,176,290 -15.4% 4.7% 3.9% N/ARussell 2000 Growth Index -9.3% 7.2% 5.1% N/AMorningstar Small Growth -6.0% 8.3% 4.9% N/AVariance Russell 2000 Growth Index -6.1% -2.6% -1.3% N/AVariance Morningstar Small Growth -9.5% -3.7% -1.1% N/A
PIMCO Total Return I Fund 110,482,561 -0.3% 2.5% 2.6% 4.7%Bloomberg Barclays U.S. Aggregate Index 0.0% 2.1% 2.5% 3.5%Morningstar Intermediate-Term Bond -0.5% 2.1% 2.2% 4.3%Variance Bloomberg Barclays U.S. Aggregate Index -0.3% 0.4% 0.0% 1.2%Variance Morningstar Intermediate-Term Bond 0.3% 0.3% 0.3% 0.4%
T. Rowe Price Mid-Cap Value Fund 108,437,988 -10.4% 7.7% 6.0% 13.1%Russell Midcap Value Index -12.3% 6.1% 5.4% 13.0%Morningstar Mid-Cap Value -12.9% 5.2% 3.8% 11.5%Variance Russell Midcap Value Index 1.9% 1.6% 0.6% 0.1%Variance Morningstar Mid-Cap Value 2.4% 2.5% 2.2% 1.6%
Oakmark Equity & Income I Fund 107,168,884 -8.0% 5.6% 3.9% 8.0%60% S&P 500/40% Barclays U.S. Gov/Credit Index -2.5% 6.6% 6.2% 9.4%Morningstar Allocation--50% to 70% Equity -5.9% 4.6% 3.5% 7.8%Variance 60% S&P 500/40% Barclays U.S. Gov/Credit Index -5.5% -1.0% -2.4% -1.4%Variance Morningstar Allocation--50% to 70% Equity -2.1% 1.0% 0.4% 0.2%
Artisan Mid Cap Fund 87,916,458 -3.2% 5.3% 4.9% 15.0%Russell Midcap Growth Index -4.8% 8.6% 7.4% 15.1%Morningstar Mid-Cap Growth -6.6% 7.1% 5.4% 12.7%Variance Russell Midcap Growth Index 1.5% -3.3% -2.5% -0.1%Variance Morningstar Mid-Cap Growth 3.4% -1.8% -0.5% 2.2%
Virtus Ceredex Small-Cap Value Eq I 66,581,171 -12.0% 8.2% 4.2% 12.6%Russell 2000 Value Index -12.9% 7.4% 3.6% 10.4%Morningstar Small Value -15.4% 5.1% 2.2% 10.7%Variance Russell 2000 Value Index 0.9% 0.8% 0.6% 2.2%Variance Morningstar Small Value 3.4% 3.1% 2.0% 1.9%
Prudential High Yield Fund 25,107,398 -1.3% 5.9% N/A N/ABloomberg Barclays U.S. Corp. HY 1% Issuer Cap Index -2.2% 7.2% N/A N/AMorningstar High Yield Bond -2.8% 5.4% N/A N/AVariance Bloomberg Barclays U.S. Corp. HY 1% Issuer Cap Index 0.9% -1.3% N/A N/AVariance Morningstar High Yield Bond 1.5% 0.6% N/A N/A
TIER III
Self Directed 165,646,585
TOTAL $7,840,664,797
Loan Fund: $192,085,265
10

State of Michigan Retirement System
FIXED INCOME REVIEWState of Michigan Investment Board Meeting
March 7, 2019
Daniel J. Quigley Senior Investment Manager
Fixed Income Division

EXECUTIVE SUMMARY
Performance
MPSERS Plan (12/31/18) 1-Year 3-Years 5-Years 7-Years 10-Years
Annualized Returns 1.2% 4.1% 3.9% 3.5% 5.2%
Bloomberg Barclays US Agg 0.0% 2.1% 2.5% 2.1% 3.5%
Peer Median Returns -0.3% 2.5% 2.7% 2.6% 4.4%
Percentile Rank vs. Peers* 4 19 14 20 29 *State Street Universe greater than $1 billion
The fixed income portfolio outperformed its benchmark and peer group across all time periods. This year-over-year (YOY) outperformance was due to an overweight to securitized assets as ABS and MBS outperformed U.S. Treasuries and Corporate Bonds during the year. Security selection has also contributed to outperformance within the corporate bond portfolio.
The duration positioning of the portfolio helped the annual performance due to an overweight to floating-rate securities in a rising short-term interest rate environment. An underweight to long duration securities also assisted performance as short and intermediate duration securities outperformed longer maturity bonds due to interest rate increases.
Investment Grade and High Yield Credit experienced negative performance for the year. This
was primarily driven by a market selloff in the fourth quarter of 2018. Investment Grade returned -2.5% and High Yield returned -2.1% for the year. The Structured Fixed Income portion of the portfolio provided an offset to this negative performance as it returned 3.2% on a YOY basis.
Strategy Update The goal of the Long-Term Fixed Income Division portfolio is to meet or exceed the returns of
the Bloomberg Barclays U.S. Aggregate Bond Index while satisfying the overall characteristics of a core fixed income portfolio. These characteristics are: income, liquidity, principal preservation, and diversification from equity market risk. The portfolio has a higher yield than the benchmark without having meaningfully more risk than the U.S. Aggregate Index. The yield-to-maturity of the portfolio is currently 4.3% versus a benchmark yield of 3.3%. In addition to this, the portfolio has an equity beta of 0.0, in line with the U.S. Aggregate Index.
The Core-plus strategy implemented to achieve this goal includes:
o Core: As of December 31, 2018, the allocation to U.S. Treasuries, investment-grade corporate bonds, government-guaranteed U.S. Agency Debentures, RMBS, and Commercial Mortgage Backed Securities (CMBS) was 70.1%. This includes a 24.3% allocation to U.S. Treasuries, TIPS, and cash.
o Plus: The portfolio maintains a strategic, out-of-benchmark allocation to high-yield
corporate debt, securitized credit, and global fixed income strategies as market opportunities allow. This allocation increases the portfolio yield and total return potential, but will result in lower liquidity and higher volatility. The allocation to the Plus portfolio was 29.9% as of December 31, 2018.
1

Tactical Update The allocation to securitized credit, primarily in CMBS, ABS, non-agency RMBS, and CLO
securities, was 20.9% of the portfolio at the end of the quarter. The combination of low interest rate duration and high coupon income (often floating rate) is attractive at this point in the interest rate cycle.
The allocation to high-yield strategies was 5.3% at the end of the quarter, at the low end of its range over recent years. Reducing this allocation benefitted the portfolio as credit spreads widened during the quarter, causing corporate bonds to underperform.
The portfolio has an increased allocation to floating rate securities, including AAA CLO
investments and investment-grade floating rate corporate bonds. This allocation accounts for approximately 20% of portfolio assets and should position the portfolio to outperform in a rising interest rate environment.
The allocation to U.S. TIPS increased during the quarter to 4.3% of the fixed income portfolio.
The TIPS allocation underperformed nominal U.S. Treasuries by roughly 200 bps on a YOY basis. We believe that this allocation has the potential to outperform nominal U.S. Treasuries going forward due to the fact that current inflation expectations are lower than the long-term inflation target of the Federal Reserve.
Market Environment and Outlook The yield curve for U.S. Treasury securities flattened for the year with short-term interest rates
increasing by more than long-term rates. The yield on the thirty-year Treasury increased by 28 bps on a YOY basis to 3.02% while two-year Treasury yields increased by 60 bps to 2.49%. The two-year trend of rising interest rates experienced a reversal in recent months as investors bid up the price of U.S. Treasuries during the fourth quarter sell-off. The yield on the ten-year U.S. Treasury decreased by 38 bp during the quarter while the yield on the two-year Treasury declined by 33 bp. The markets currently expect the FOMC to take a pause on their monetary tightening campaign due to lower economic growth expectations.
Inflation expectations declined during the quarter with ten-year breakeven inflation
expectations ending December at 1.8%. This was a 30 bp decline in expectations on a quarter-over-quarter basis. The portfolio has slightly increased its allocation to U.S. TIPS and believes that owning these securities offers value should inflation indices rebound.
Credit markets underperformed with high-yield spreads ending December at 526 bps. This
represented a 210 bp increase in spreads for the quarter. These spread levels are roughly 90 bp wider than their five-year average. Investment grade credit spreads widened by 47 bp for the quarter to 153 bp, roughly 25 bp wider than the 125 bp five-year average.
Global markets also experienced a sell-off with the Emerging Markets Debt (EMD) Index
returning -0.18% for the quarter. This still represented roughly 400 bp of outperformance vs U.S. High Yield Credit as EMD continued to recover on a relative basis from a sell-off earlier in the year. EMD had a return of -2.46% on a one-year basis and EM spreads ended the year at 343 bp.
Securitized assets such as CMBS and CLO bonds also experienced spread widening during
the recent market correction. The overall spread movement was more muted than the widening in corporate credit. Spreads on BBB CMBS securities ended the quarter at 301 bps, 49 bp wider for the quarter. Spreads have decreased by 29 bp on a YOY basis.
2

Developed market interest rates declined across most major markets during the quarter as
investors increased their weighting in safe-haven government bonds. The yield on the ten-year German Bund ended the year at 0.2%, down 23 bp for the quarter. The Japanese JGB ended the year with a ten-year yield of -0.01%. Italian sovereign debt also had strong performance during the quarter after selling off earlier in the year. The Italian ten-year bond’s spread to German Bunds tightened by 17 bp during the quarter and ended the year with a yield of 2.7%.
Conclusion The portfolio remains defensively positioned for rising interest rates. The duration remains
short of the benchmark and the portfolio maintains an underweight to long-term debt. This position is offset through a larger allocation to structured and corporate debt securities which increase the income of the portfolio. The portfolio will continue to look for attractive risk-adjusted opportunities within the fixed income opportunity set.
3

SMRSLong-Term Fixed Income by Strategy
12/31/18
Amount Total % of Total
Core ($ in Millions)
LTFID Internal $4,990 PIMCO Mortgage Fund 252 Dodge & Cox 243 PGIM Investment Grade Credit 228 Total Core $5,713 64.2%
Tactical
Pyramis $298 Loomis Core Plus 226 Total Tactical $524 5.9%
Securitized Debt
Met West Securitized Ops $462 Principal CMBS 393 Napier Park CLO Debt 258 TICP CLO Debt 254 Napier Park ABS Income 407 Napier Park Strategic Loan 83 Total Securitized Debt $1,856 20.9%
High Yield
Columbia Management $244 PGIM High Yield 210 Crescent Direct Lending 18 Total High Yield $472 5.3%
Global
T. Rowe Global Multi-Sector $228 PGIM Global Liquid Relative Value 101 Total Global $329 3.7%
TOTAL $8,894 100.0%
NOTE: Totals may not be exact due to rounding.
4

Characteristic Portfolio Benchmark
Average Maturity (Yrs) 7.5 8.2
Duration (Yrs) 4.7 5.9
Spread Duration (Yrs) 5.6 6.0
Coupon (%) 3.7 3.2
Yield to Maturity (%) 4.3 3.3
Credit Rating A AA
VaR (%) 3.6 4.2
Tracking Error 1.27 NA
Beta (vs S&P 500) 0.02 -0.04
Objectives
Income:
Liquidity:
Principal Preservation:
Diversification:
The coupon of the portfolio is approximately 50 bps higherthan the benchmark. Roughly 20% of the portfolio is investedin floating-rate securities, allowing coupon income toincrease relative to the benchmark if the yield curvecontinues to flatten.
24.3% of the portfolio is invested in cash, U.S. Treasuries,and TIPS. These investments can be liquidated via same-day trading.
The portfolio has a large allocation to U.S. Treasuries andcarries an investment-grade credit rating.
The equity beta of the portfolio is roughly 0.0 meaning thatthe portfolio returns are uncorrelated with equity marketmovements, and in line with the benchmark bond index.
Commentary
Highlights
SMRS Fixed Income Holdings
Portfolio Characteristics
Benchmark: Barclays Aggregate
12/31/18
5

SMRSFixed Income By Rating
12/31/18
Market Value in Millions
Assets Percent Benchmark Difference
AAA $4,292 48.2% 71.6% -23.4%AA 488 5.5% 3.3% 2.2%A 1,476 16.6% 10.1% 6.5%BBB 1,606 18.1% 12.5% 5.6%Not Rated 100 1.1% 1.9% -0.8%
* Below Investment Grade 932 10.5% 0.6% 9.9%
Total Investments $8,894 100.0% 100.0%
* Comprised of approximately 7.7% High Yield Credit and 2.8% High Yield RMBS/ABS
Benchmark: Barclays US Aggregate
12/31/18
AAA48.2%
BBB18.1%
A16.6%
Below Investment Grade10.5%
AA5.5%
Not Rated1.1%
6

SMRSFixed Income By Asset Type
12/31/18
Market Value in Millions
Assets Percent Benchmark Difference
Securitized $3,198 36.0% 30.7% 5.3%Corporate 3,196 35.9% 24.6% 11.3%U.S. Treasuries 1,576 17.7% 38.6% -20.9%U.S. TIPS 380 4.3% 0.0% 4.3%Government Related 239 2.7% 6.1% -3.4%Unassigned 110 1.2% 0.0% 1.2%Cash 195 2.2% 0.0% 2.2%
Total Investments $8,894 100.0% 100.0%
Benchmark: Barclays US Aggregate
12/31/18
Securitized36.0%
Corporate35.9%
U.S. Treasuries17.7%
U.S. TIPS4.3%
Government Related
2.7%
Unassigned1.2%
Cash2.2%
7

SMRSDuration Distribution
Fixed Income Composite Versus Benchmark12/31/18
Source: Factset
Portfolio Benchmark Portfolio BenchmarkWeight Weight Duration* Duration*
<1 $1,494 16.8% 0.9% 0.1 1.01 to 3 1,428 16.1% 23.8% 1.8 2.03 to 5 1,768 19.9% 31.1% 4.1 4.15 to 7 1,808 20.3% 22.6% 5.9 5.77 to 10 1,440 16.2% 7.2% 8.0 7.8>10 435 4.9% 14.4% 17.4 15.5NA 521 5.8% 0.0% 0.0 0.0
Total $8,894 100.0% 100.0% 4.6 5.8
* Effective Duration
Benchmark: Barclays US Aggregate
Assets
Market Value in Millions
Duration
16.8% 16.1%
19.9% 20.3%
16.2%
4.9%5.8%
0.9%
23.8%
31.1%
22.6%
7.2%
14.4%
0.0%0%
10%
20%
30%
40%
<1 1 to 3 3 to 5 5 to 7 7 to 10 >10 NA
Portfolio % Benchmark
# of Years
8

SMRS Internal/External Manager Performance – Net of Fees
12/31/18 Total Fixed Income Performance, Net of Fees
(MPSERS)
Market Value 1‐Year 3‐Years 5‐Years 7‐Years 10‐Years
Total Fixed Income $8,893,868,844 1.04% 3.93% 3.73% 3.36% 5.03%
Bloomberg/Barclays Aggregate Bond Index N/A 0.01% 2.06% 2.52% 2.10% 3.48%
Internal Core Fixed Income $4,990,060,787 0.95% 3.23% 3.47% 2.91% 4.56%
Externally Managed Core Fixed Income $495,096,139 0.62% 3.38% 3.04% 3.00% 4.76%
Dodge & Cox Core 242,622,267 0.37% 3.35% 3.13% 3.40% 5.02%
PIMCO Mortgage Fund 252,473,872 0.86% Bloomberg/Barclays Aggregate Bond Index N/A 0.01% 2.06% 2.52% 2.10% 3.48%
Investment Grade Credit $227,983,352 ‐2.50% 3.58% 3.53% 3.78% 6.29%
PGIM Investment Grade 227,983,352 ‐2.50% 3.58% 3.53% 3.89% 6.38%
Bloomberg/Barclays Credit Index N/A ‐2.11% 3.16% 3.22% 3.30% 5.52%
Tactical Fixed Income $523,677,442 ‐0.50% 3.52% 3.43%
Loomis Sayles CorePlus 225,777,186 ‐0.53% 3.96% 3.01% N/A N/A
Fidelity Tactical Bond Fund 297,900,256 ‐0.55% 5.12% N/A N/A N/A
Bloomberg/Barclays Aggregate Bond Index N/A 0.01% 2.06% 2.52% 2.10% 3.48%
High Yield Fixed Income $471,681,824 ‐2.52% 5.40% 3.97% N/A N/A
Columbia Management High Yield 244,098,334 ‐3.06% 4.92% 3.83% N/A N/A
PGIM High Yield 209,948,654 ‐1.88% 6.02% 4.14% N/A N/A
Crescent Direct Lending 17,634,836 N/A N/A N/A N/A N/A
Bloomberg/Barclays US HY BA/B 2% Cap N/A ‐1.88% 6.18% 3.79% Structured Fixed Income $1,856,416,606 3.23% N/A N/A N/A N/A
Principal CMBS 392,966,565 3.68% 4.50% 4.82% 8.18% 17.61%
MetWest Securitized Opportunities 461,841,078 2.89% 4.73% 3.71% N/A N/A
Napier Park ABS Income 406,811,189 7.24% 10.28% N/A N/A N/A
Napier Park Strategic Loan LP 83,209,498 7.95% N/A N/A N/A N/A
Napier Park CLO Debt 257,841,002 0.90% N/A N/A N/A N/A
TICP CLO Debt 253,747,273 ‐0.09% N/A N/A N/A N/A
Bloomberg/Barclays Aggregate Bond Index N/A 0.01% 2.06% 2.52% 2.10% 3.48%
Blended CMBS Benchmark N/A 1.01% 3.21% 4.24% 4.21% 9.29%
Global Fixed Income $328,952,694 0.18% N/A N/A N/A N/A
T. Rowe Global Multi‐Sector 227,812,693 ‐0.24% N/A N/A N/A N/A
PGIM GLRV 101,140,000 1.14% N/A N/A N/A N/A
Custom GMS Benchmark N/A 0.34% N/A N/A N/A
9

State of Michigan Retirement System
REAL, OPPORTUNISTIC, & ABSOLUTE RETURN REVIEW State of Michigan Investment Board Meeting
March 7, 2019
Jennifer Yeung Senior Investment Manager
Real, Opportunistic, & Absolute Return Division

EXECUTIVE SUMMARY
Performance
The value of the Absolute Return portfolio is $4.3 billion with a one-year return of 4.3%
and 0.2% for the current quarter. Exposure to diversifying and credit strategies as well as manager selection helped to mitigate broad negative performance in the market.
Performance from diversifying managers contributed positive returns during the fourth quarter. Outperformance in this sector was largely driven by quantitative strategies. These gains were partially offset by losses from managers that had short U.S. Fixed Income strategies.
During the quarter, credit strategies outperformed on a relative basis versus both credit
indices as well as broader markets. Structured credit and residential mortgage managers protected capital and, in some cases, contributed positive returns during the quarter.
Strategy Update The objective of the Absolute Return portfolio is to diversify the total plans’ holdings,
targeting returns above investment-grade fixed income with lower volatility than the equity portfolio. The portfolio utilizes a diverse mix of managers that invest both long and short to target specific exposures and seek to hedge out unwanted risk.
No new commitments for the quarter.
We remain cautious on directional risks and have continued to shift towards diversifying strategies. We have been increasing allocations to special situations and co-investments, which have more idiosyncratic risk and are implemented on a market neutral basis. We also believe that allocations to opportunities in macro and quantitative strategies could be well positioned to take advantage of a rising interest rate and higher volatility environment. Higher interest rates may have caused recent equity market losses due to general risk off behavior, but we do not believe this is a direct risk of the Absolute Return program. The portfolio has low direct correlation and sensitivity to an upward movement in interest rates.
Overall, we will continue to focus on opportunities that seek to provide diversification, protect the downside and deliver absolute return.
MPSERS Plan (12/31/18) 1-Year 3-Years 5-Years 7-Years 10-Years
Absolute Return 4.3% 4.4% 4.0% 5.7% 6.1%
HFRI FOF Conservative 0.6% 1.8% 2.1% 3.0% 2.9%
1

Performance
Total Real Return and Opportunistic portfolio value is $8.0 billion with a total one-year
return of 19.5%. Performance for the year was driven by strong income from private credit, natural resource strategies, and media and entertainment holdings, as well as capital appreciation of transportation and media and entertainment assets.
Strategy Update The objective of the Real Return & Opportunistic portfolio is to provide an inflation
hedge and/or to gain exposure to attractive opportunities that may not fit in another plan portfolio.
The Real Return & Opportunistic portfolio has approximately $3.5 billion of unfunded
commitments. New commitments closed during the quarter include: o $300 million to TSSP Capital Solutions, L.P, a commingled fund that will provide
structured credit and equity financing solutions to late-stage growth companies.
o $35 million to Flywheel Energy LLC, an energy company that owns and operates natural gas assets and midstream systems in the U.S.
We remain focused on finding differentiated strategies that are additive to the current
portfolio mix. o We continue to like private energy opportunities, niche strategies with some
scalability, and contractual cash flow.
o Also, we like opportunities in the opportunistic credit space. These strategies have defensible cash flows, are backed by high quality collateral and offer structural downside protection. We continue to be selective and favor investment teams that are disciplined and have experience investing over multiple cycles.
MPSERS Plan (12/31/18) 1-Year 3-Years 5-Years 7-Years 10-Years
Real Return and Opport. 19.5% 12.4% 13.6% 11.5% N/A
Custom Benchmark 7.3% 7.5% 7.2% 7.3% N/A
2

SMRSReal, Opportunistic, & Absolute Return
12/31/18
Market Value in Millions
12/31/18 12/31/17
Real Return & Opportunistic $7,917 64.4% $6,028 59.7%Absolute Return 4,254 34.6% 3,992 39.5%Cash/Other 126 1.0% 85 0.8%
Total Investments $12,297 100.0% $10,105 100.0%
Real Return & Opportunistic
64.4%
Absolute Return34.6%
Cash/Other1.0%
3

Net Market Value
Drawbridge Opportunities Fund 241,926,741$
* EnTrust White Pine Partners, LP 38,895,784
JM IV, LP 73,934,114
MP Securitized Credit Master Fund, LP 78,413,778
Riverside Credit Solutions Fund I, LP 3,378,680
SJC Direct Lending Revolver Fund III, LP 38,766,956
* Tahquamenon Fund, LP 3,778,517,313
Visium Balanced Fund, LP 299,800
Total Absolute Return 4,254,133,166$
Short-Term Investments & Other 25,750,734
Grand Total 4,279,883,900$
* Fund of Funds
Absolute ReturnSMRS
12/31/18
Net Market Values by Entity
4

Underlying Funds: 79 Median Position Size: 0.5%
Strategies: 4 Average Position Size: 1.3%
Relationships: 8 Largest Position Size: 6.3%
SMRS
Strategy Breakdown
Investments By Strategy
Absolute Return12/31/18
Credit32.4%
Multi-Strategy / Event31.7%
Equity21.0%
Diversifying14.9%
5

SMRS
Absolute Return
12/31/18
Liquidity Analysis
Redeemable
Marginal Allocation (% each period)
Aggregate Allocation (% since Analysis Date)
By 4/1/19 36.9% 36.9%
By 7/1/19 23.2.% 60.1%
By 1/1/20 13.0% 73.1%
By 7/1/20 5.3% 78.4%
By 7/1/21 6.0% 84.4%
After 7/1/21 9.6% 94.0%
Illiquid 6.0% 100.0%
Total 100.0% N/A
36.9%
60.1%
73.1%
78.4%
84.4%
0%
10%
20%
30%
40%
50%
60%
70%
80%
90%
100%
Jan 20
19
Mar 2
01
9M
ay 201
9Ju
l 20
19
Sep
20
19
No
v 20
19
Jan 20
20
Mar 2
02
0M
ay 202
0Ju
l 20
20
Sep
20
20
No
v 20
20
Jan 20
21
Mar 2
02
1M
ay 202
1Ju
l 20
21
Sep
20
21
No
v 20
21
Jan 20
22
Mar 2
02
2M
ay 202
2Ju
l 20
22
Sep
20
22
No
v 20
22
Jan 20
23
Mar 2
02
3M
ay 202
3Ju
l 20
23
Sep
20
23
No
v 20
23
Jan 20
24
Mar 2
02
4M
ay 202
4Ju
l 20
24
Sep
20
24
Monthly % Period
6
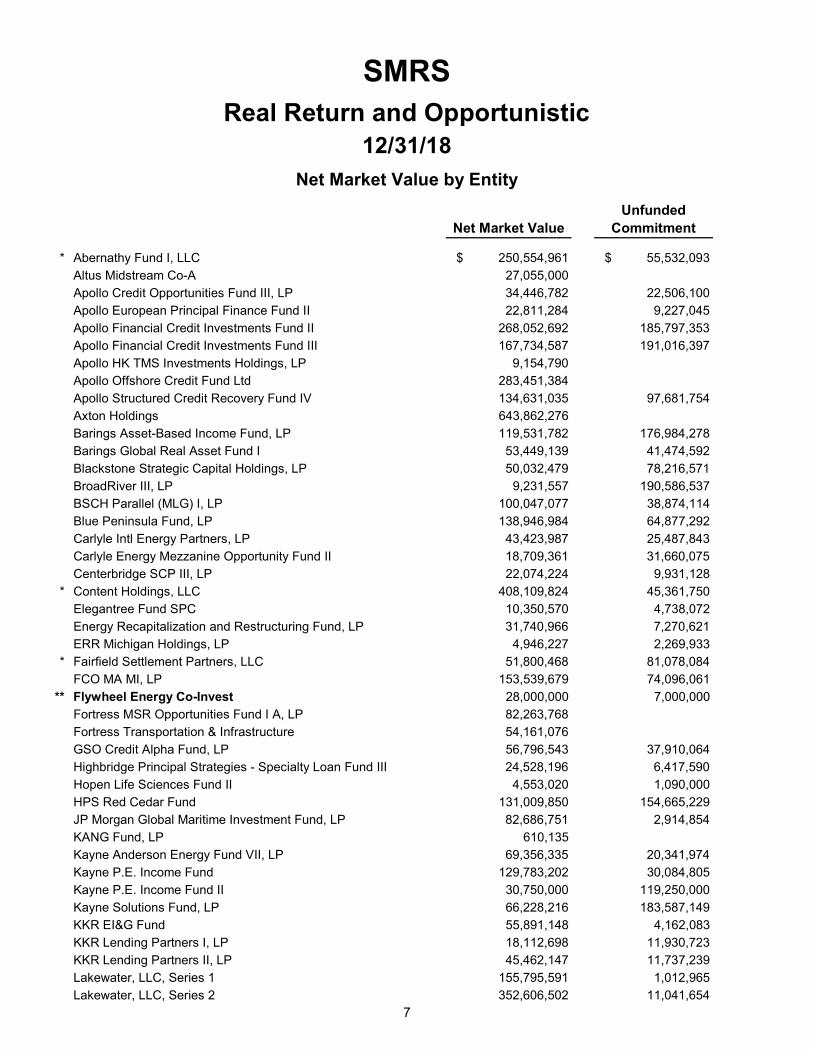
Net Market ValueUnfunded
Commitment
* Abernathy Fund I, LLC $ 250,554,961 $ 55,532,093
Altus Midstream Co-A 27,055,000
Apollo Credit Opportunities Fund III, LP 34,446,782 22,506,100
Apollo European Principal Finance Fund II 22,811,284 9,227,045
Apollo Financial Credit Investments Fund II 268,052,692 185,797,353
Apollo Financial Credit Investments Fund III 167,734,587 191,016,397
Apollo HK TMS Investments Holdings, LP 9,154,790
Apollo Offshore Credit Fund Ltd 283,451,384
Apollo Structured Credit Recovery Fund IV 134,631,035 97,681,754
Axton Holdings 643,862,276
Barings Asset-Based Income Fund, LP 119,531,782 176,984,278
Barings Global Real Asset Fund I 53,449,139 41,474,592
Blackstone Strategic Capital Holdings, LP 50,032,479 78,216,571
BroadRiver III, LP 9,231,557 190,586,537
BSCH Parallel (MLG) I, LP 100,047,077 38,874,114
Blue Peninsula Fund, LP 138,946,984 64,877,292
Carlyle Intl Energy Partners, LP 43,423,987 25,487,843
Carlyle Energy Mezzanine Opportunity Fund II 18,709,361 31,660,075
Centerbridge SCP III, LP 22,074,224 9,931,128
* Content Holdings, LLC 408,109,824 45,361,750
Elegantree Fund SPC 10,350,570 4,738,072
Energy Recapitalization and Restructuring Fund, LP 31,740,966 7,270,621
ERR Michigan Holdings, LP 4,946,227 2,269,933
* Fairfield Settlement Partners, LLC 51,800,468 81,078,084
FCO MA MI, LP 153,539,679 74,096,061
** Flywheel Energy Co-Invest 28,000,000 7,000,000
Fortress MSR Opportunities Fund I A, LP 82,263,768
Fortress Transportation & Infrastructure 54,161,076
GSO Credit Alpha Fund, LP 56,796,543 37,910,064
Highbridge Principal Strategies - Specialty Loan Fund III 24,528,196 6,417,590
Hopen Life Sciences Fund II 4,553,020 1,090,000
HPS Red Cedar Fund 131,009,850 154,665,229
JP Morgan Global Maritime Investment Fund, LP 82,686,751 2,914,854
KANG Fund, LP 610,135
Kayne Anderson Energy Fund VII, LP 69,356,335 20,341,974
Kayne P.E. Income Fund 129,783,202 30,084,805
Kayne P.E. Income Fund II 30,750,000 119,250,000
Kayne Solutions Fund, LP 66,228,216 183,587,149
KKR EI&G Fund 55,891,148 4,162,083
KKR Lending Partners I, LP 18,112,698 11,930,723
KKR Lending Partners II, LP 45,462,147 11,737,239
Lakewater, LLC, Series 1 155,795,591 1,012,965
Lakewater, LLC, Series 2 352,606,502 11,041,654
SMRSReal Return and Opportunistic
12/31/18
Net Market Value by Entity
7

Net Market ValueUnfunded
Commitment
Lakewater, LLC, Series 3 773,095,801 1,538,559
Lakewater, LLC, Series 4 31,610,594 2,196,174
Lakewater, LLC, Series 5 321,907,885 4,453,900
Marathon CLO Equity Fund, LP 12,927,284 12,045,000
Merit Energy Partners, LP 34,120,821 3,711,963
MidCap FinCo Holdings LTD 302,900,997 966,079
Napier Park Aircraft Leasing Vehicle I, LLC 37,360,060 16,594,142
Napier Park Aircraft Leasing Rollover Fund I, LLC 8,808,611 71,051,135
Nash Co-Investment 17,888,123 94,259New Fortress Energy HLDGS 503,936,000
NGP Natural Resources XII 49,103,703 100,699,455
Orion Coinvest III, LP 8,591,680 2,236,552
Orion Mine Finance Fund 1A, LP 54,820,327 5,016,470
Orion Mine Finance Fund I, LP 102,468,837 7,376,051
Orion Mine Finance II, LP 69,665,860 39,612,107
Orion Mine Finance Co-Fund II, LP 15,506,455 34,927,191
Redding Ridge Holdings, LP 53,916,708 48,579,545
* Renaissance Venture Cap Fund II, LP 24,882,196 4,000,000
* Renaissance Venture Cap Fund III, LP 2,966,776 21,750,000
REOG Fund II Coinvest, LP 33,257,467 7,552,384
Ridgewood Energy Oil & Gas II 125,181,227 23,737,082
Ridgewood Energy Oil & Gas III 63,831,794 176,408,916
RPEP Energy Opp Inst Partner 19,501,564 24,100,819
SJC Direct Lending Fund I, LP 550,492 15,088,120
SJC Direct Lending Fund IA, LP 193,597 3,764,486
SJC Direct Lending Fund II, LP 43,038,774 38,261,315
SJC Direct Lending Fund III, LP 115,446,270 117,918,021
SJC Direct Lending Fund III Co-Invest G-III 20,000,000
* Social Network Holdings, LLC 110,029,928 19,540,969
Specialty Equity Strategy, LP 267,077 19,647,000
Sprott PRL (M), LP 5,892,678 19,057,857
Sprott PRL (M-Co-Invest) 7,971,194 17,137,500
Sprott Private Resource Lending Fund (US), LP 62,432,157 60,713,685
Terra Co-Investment, LLC 33,018,201 14,000,000
TICP CLO Partners II, LP 39,678,441 10,404,525
TSSP Adjacent Opp Partners, LP 124,373,636 189,430,788
** TSSP Capital Solutions 48,507,052 250,095,649
TSSP Opportunities Partners IV, LP 100,000,000
Varo Coinvestment, LP 15,707,507 892,702
Vida Insurance Credit Opportunity Fund II, LP 89,221,118 10,116,433
Warwick Energy Partners III 54,588,554 7,454,932
Warwick (SMRS) Co-Invest, LP 31,255,040 2,732,720
Total Real Return and Opportunistic $ 7,916,706,776 $ 3,542,718,506Short-Term Investments & Other 100,500,991 - Grand Total $ 8,017,207,767 $ 3,542,718,506Grand Total
* Fund of Funds** New Commitment
8

Multi-Strategy
Energy
Opportunistic Credit
Direct Lending
Insurance Linked Securities 586,040,422
Metals & Mining 327,349,187
Opportunistic Equity 292,511,475
Transportation
Short-Term Investments & Other
Total Market Value 8,017,207,767$
701,243,021
100,768,068
Investment Strategy
SMRSReal Return and Opportunistic
12/31/18
Investments By Strategy
1,145,996,605
1,430,811,152
3,303,632,415$
128,855,422
Multi-Strategy41.1%
Energy17.8%
Opportunistic Credit14.3%
Direct Lending8.7%
Insurance Linked Securities
7.3%
Metals & Mining4.2%
Opportunistic Equity3.6%
Transportation1.6%
Short-Term Investments &
Other1.4%
9

SMRS Real Return and Opportunistic
12/31/2018
9/30/18Reported Value
Capital Calls Cash Dist.Received
Reported ValueChange
Short TermInvestments
12/31/18Reported Value
($238 )$6,519
$1,215 $420 $101 $8,017
$ Millions Invested Commitmentsaa
9/30/18Outstanding
Commitments
New Deals Capital Calls Recallable ReturnedCapital and Other
12/31/18Outstanding
Commitments
($1,215)
$3,687 $335
$736 $3,543
$ Millions Outstanding Commitments
10

($ in Millions)
Advisor or Entity Market Value
Barings Alternative Investments 2,452$ Apollo Global Management 1,277 Domain Capital Advisors 820 Fortress Investment Group 740 Kayne Anderson Capital Partners 385 Orion Resource Partners 251 Ridgewood Energy 242 TPG Sixth Street Partners 213 Czech Asset Management 179 HPS Investment Partners 156
Total Market Value 6,715$
Top Ten Advisors or Entities
SMRSReal Return and Opportunistic
12/31/18
11
State of Michigan Retirement System
DOMESTIC EQUITY REVIEW State of Michigan Investment Board Meeting
March 7, 2019
Jack A. Behar, CFA Senior Investment Manager
Domestic Equity Division
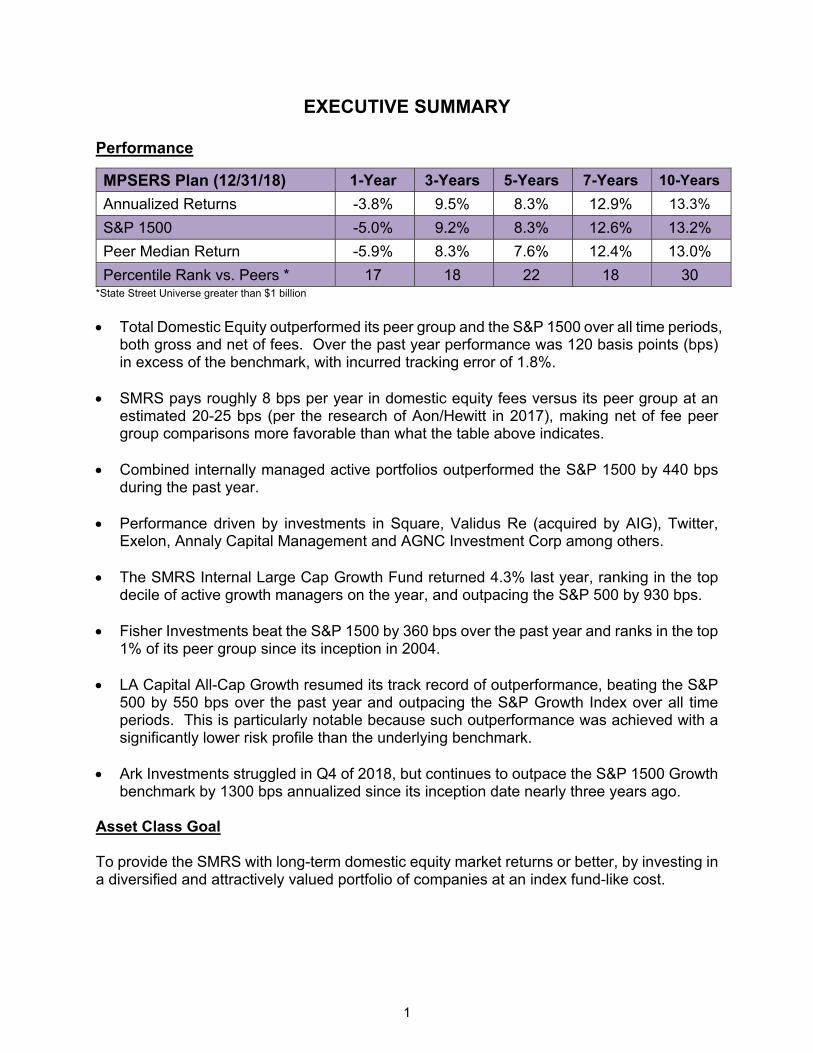
EXECUTIVE SUMMARY
Performance
MPSERS Plan (12/31/18) 1-Year 3-Years 5-Years 7-Years 10-Years
Annualized Returns -3.8% 9.5% 8.3% 12.9% 13.3%
S&P 1500 -5.0% 9.2% 8.3% 12.6% 13.2%
Peer Median Return -5.9% 8.3% 7.6% 12.4% 13.0%
Percentile Rank vs. Peers * 17 18 22 18 30 *State Street Universe greater than $1 billion
Total Domestic Equity outperformed its peer group and the S&P 1500 over all time periods,both gross and net of fees. Over the past year performance was 120 basis points (bps)in excess of the benchmark, with incurred tracking error of 1.8%.
SMRS pays roughly 8 bps per year in domestic equity fees versus its peer group at anestimated 20-25 bps (per the research of Aon/Hewitt in 2017), making net of fee peergroup comparisons more favorable than what the table above indicates.
Combined internally managed active portfolios outperformed the S&P 1500 by 440 bpsduring the past year.
Performance driven by investments in Square, Validus Re (acquired by AIG), Twitter,Exelon, Annaly Capital Management and AGNC Investment Corp among others.
The SMRS Internal Large Cap Growth Fund returned 4.3% last year, ranking in the topdecile of active growth managers on the year, and outpacing the S&P 500 by 930 bps.
Fisher Investments beat the S&P 1500 by 360 bps over the past year and ranks in the top1% of its peer group since its inception in 2004.
LA Capital All-Cap Growth resumed its track record of outperformance, beating the S&P500 by 550 bps over the past year and outpacing the S&P Growth Index over all timeperiods. This is particularly notable because such outperformance was achieved with asignificantly lower risk profile than the underlying benchmark.
Ark Investments struggled in Q4 of 2018, but continues to outpace the S&P 1500 Growthbenchmark by 1300 bps annualized since its inception date nearly three years ago.
Asset Class Goal
To provide the SMRS with long-term domestic equity market returns or better, by investing in a diversified and attractively valued portfolio of companies at an index fund-like cost.
1

Strategy Update The Domestic Equity Portfolio remains overweight the financial sector and defensive
stocks while remaining underweight the consumer discretionary, materials and energy sectors. The estimated portfolio beta is 1.1, so a significant market correction would present a modest headwind to performance. o Total Domestic Equity’s portfolio would outperform the S&P 1500 by ~20% were it to
appreciate to the market multiple of 15.3x from where it stands now at 12.7x, or if multiples between it and the benchmark were otherwise to converge.
o The potential for multiple convergence is driven by active exposures in Berkshire Hathaway, AGNC, Facebook, Gilead Sciences, Annaly Capital Management, and Ally Financial among others. All trade at forward PE ratios of 15x or less, with the exception of Facebook, which we believe to be undervalued despite its higher multiple.
o In the event that multiples do not converge, the division remains in a position to outperform based on its higher level of dividend yield, coupled with faster earnings per share growth than the S&P 1500.
o At the broader portfolio level, allocations to attractively valued financial and defensive
stocks offset each other from an interest rate risk standpoint, paving the way for potential outperformance in most rate environments.
Market Environment and Outlook
At ~15.3x forward earnings, equity markets trade roughly in line with their historical average of 15.7x and 15% below their twenty-five-year historical average of 18x, albeit with higher levels of profitability, which may prove to be cyclical.
Factoring in the existing low level of interest rates, stocks are attractively priced for an environment where long-term bond yields are 4% or lower.
The market is currently paying out 2.2% of its earnings in dividends and reducing shares outstanding by 3.1% by way of share buybacks, for a 5.4% total shareholder yield.
It is also growing shareholders’ equity at a rate of 3.2% by reinvesting roughly 20% of its
earnings back into its underlying businesses.
The market is thus poised to earn roughly 8.6% (shareholder yield of 5.4% + reinvestment rate of 3.2%) in an environment where stock multiples and returns on equity are stable.
This compares favorably to the 30-year U.S. Treasury at 3.0%, and unfavorably to the
historical compound annual return for the S&P 500 from 1928 – 2017 of 9.5%.
2

SMRSDomestic Equity Strategies
12/31/18
Markets
Internal Indexed
Indexed Portfolios $7,038
Total Indexed $7,038 44.9%
Internal Active
Active Portfolios $4,572
Total Internal Active $4,572 29.1%
External Active
Los Angeles Capital $1,081 Mellon Capital 670 Fisher Investments 607 Seizert Capital Partners 515 Clarkston Capital Partners 441 ARK Investments 383 Attucks Asset Management 133 Bivium Capital 128 Ancora 86 Munder Capital Management 20 Northpointe Capital 19
Total External Active $4,083 26.0%
Total Domestic Equity $15,693 100.0%
Amount % of TotalTotal
($ in Millions)
3
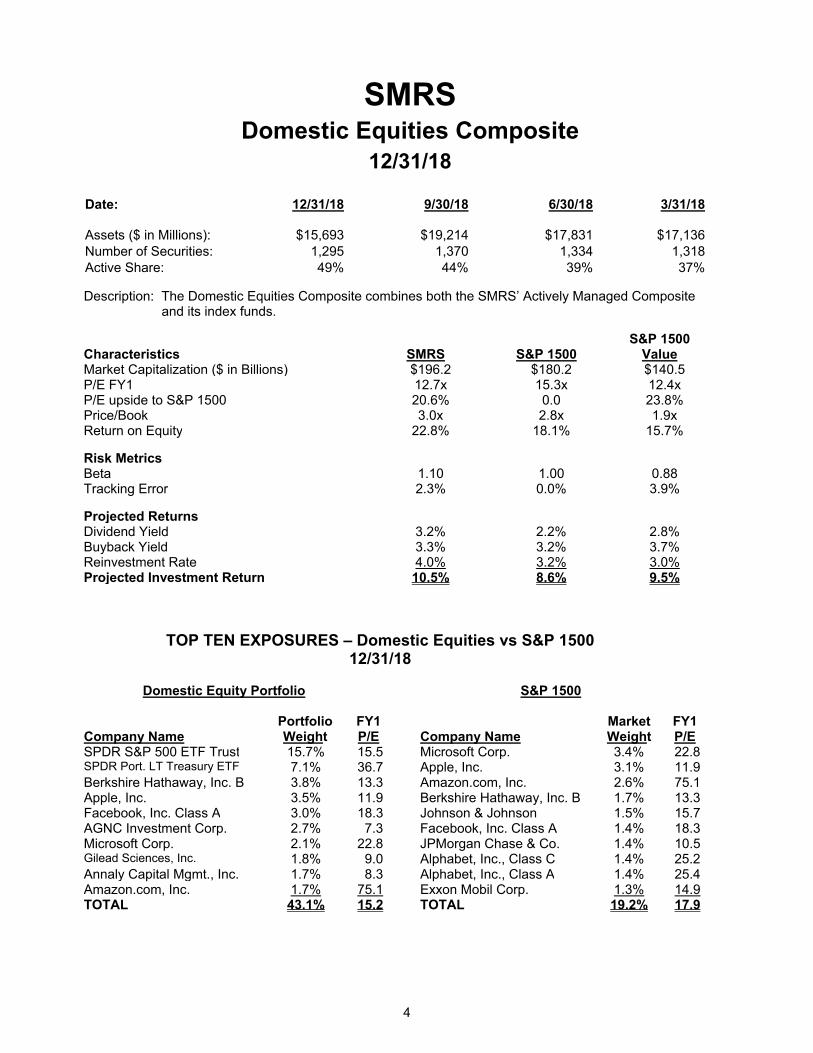
SMRS Domestic Equities Composite
12/31/18
Date: 12/31/18
9/30/18 6/30/18 3/31/18
Assets ($ in Millions): $15,693 $19,214 $17,831 $17,136 Number of Securities: 1,295 1,370 1,334 1,318 Active Share: 49% 44% 39% 37%
Description: The Domestic Equities Composite combines both the SMRS’ Actively Managed Composite
and its index funds.
Characteristics
SMRS
S&P 1500 S&P 1500
Value Market Capitalization ($ in Billions) $196.2 $180.2 $140.5 P/E FY1 12.7x 15.3x 12.4x P/E upside to S&P 1500 20.6% 0.0 23.8% Price/Book 3.0x 2.8x 1.9x Return on Equity 22.8% 18.1% 15.7%
Risk Metrics Beta 1.10 1.00 0.88 Tracking Error 2.3% 0.0% 3.9%
Projected Returns Dividend Yield 3.2% 2.2% 2.8% Buyback Yield 3.3% 3.2% 3.7% Reinvestment Rate 4.0% 3.2% 3.0% Projected Investment Return 10.5% 8.6% 9.5%
TOP TEN EXPOSURES – Domestic Equities vs S&P 1500 12/31/18
Domestic Equity Portfolio S&P 1500
Company Name
Portfolio Weight
FY1 P/E
Company Name
Market Weight
FY1 P/E
SPDR S&P 500 ETF Trust 15.7% 15.5 Microsoft Corp. 3.4% 22.8 SPDR Port. LT Treasury ETF 7.1% 36.7 Apple, Inc. 3.1% 11.9 Berkshire Hathaway, Inc. B 3.8% 13.3 Amazon.com, Inc. 2.6% 75.1 Apple, Inc. 3.5% 11.9 Berkshire Hathaway, Inc. B 1.7% 13.3 Facebook, Inc. Class A 3.0% 18.3 Johnson & Johnson 1.5% 15.7 AGNC Investment Corp. 2.7% 7.3 Facebook, Inc. Class A 1.4% 18.3 Microsoft Corp. 2.1% 22.8 JPMorgan Chase & Co. 1.4% 10.5 Gilead Sciences, Inc. 1.8% 9.0 Alphabet, Inc., Class C 1.4% 25.2 Annaly Capital Mgmt., Inc. 1.7% 8.3 Alphabet, Inc., Class A 1.4% 25.4 Amazon.com, Inc. 1.7% 75.1 Exxon Mobil Corp. 1.3% 14.9 TOTAL 43.1% 15.2 TOTAL 19.2% 17.9
4

SMRS
12/31/18
Market Value in Millions
Assets Percent Benchmark Difference
Financials $4,043 25.8% 13.7% 12.1%Information Technology 2,954 18.8% 19.6% -0.8%Health Care 2,130 13.6% 15.1% -1.5%Communication Services 1,535 9.8% 9.4% 0.4%Industrials 1,282 8.2% 9.9% -1.7%Consumer Discretionary 1,259 8.0% 10.2% -2.2%Consumer Staples 820 5.2% 7.0% -1.8%Energy 518 3.3% 5.1% -1.8%Utilities 411 2.6% 3.5% -0.9%Real Estate 405 2.6% 3.5% -0.9%Materials 336 2.1% 3.0% -0.9%
Total $15,693 100.0% 100.0%
Benchmark: S&P 1500
Domestic Equity By Sector
12/31/18
Financials25.8%
Information Technology
18.8%
Health Care13.6%
Communication Services
9.8%
Industrials8.2%
Consumer Discretionary
8.0%
Consumer Staples
5.2%
Energy3.3%
Util.2.6%
RE2.6%
Materials2.1%
5

SMRS Actively Managed Composite
12/31/18
Date: 12/31/18
9/30/18 6/30/18 3/31/18
Assets ($ in Millions): $8,655 $10,696 $9,879 $9,431
Number of Securities: 1,021 1,073 1,053 1,106
Active Share: 85% 77% 68% 65%
Description: The Actively Managed Composite is designed to add consistent alpha by investing in managers with value-added, but diverse strategies. While the expectation is that most will outperform over time, the composite is designed such that they do so during differing parts of the business cycle.
Characteristics
SMRS
S&P 1500 S&P 1500
Value Market Capitalization ($ in Billions) $164.0 $180.2 $140.5 P/E FY1 11.1x 15.3x 12.4x P/E upside to S&P 1500 37.7% 0.0 23.8% Price/Book 2.9x 2.8x 1.9x Return on Equity 26.1% 18.1% 15.7%
Risk Metrics Beta 1.18 1.00 0.88 Tracking Error 4.0% 0.0% 3.9%
Projected Returns Dividend Yield 4.1% 2.2% 2.8% Buyback Yield 3.4% 3.2% 3.7% Reinvestment Rate 4.3% 3.2% 3.0% Projected Investment Return 11.8% 8.6% 9.5%
TOP TEN EXPOSURES – Actively Managed Equities vs S&P 1500 12/31/18
Actively Managed Equity Portfolio S&P 1500
Company Name
Portfolio Weight
FY1 P/E
Company Name
Market Weight
FY1 P/E
SPDR S&P 500 ETF Trust 23.8% 15.5 Microsoft Corp. 3.4% 22.8 SPDR Port. LT Treasury ETF 12.9% 36.7 Apple, Inc. 3.1% 11.9 Berkshire Hathaway, Inc. B 6.0% 13.3 Amazon.com, Inc. 2.6% 75.1 AGNC Investment Corp. 4.9% 7.3 Berkshire Hathaway, Inc. B 1.7% 13.3 Facebook, Inc. Class A 4.4% 18.3 Johnson & Johnson 1.5% 15.7 Apple, Inc. 3.9% 11.9 Facebook, Inc. Class A 1.4% 18.3 Annaly Capital Mgmt., Inc. 3.1% 8.3 JPMorgan Chase & Co. 1.4% 10.5 Gilead Sciences, Inc. 3.0% 9.0 Alphabet, Inc., Class C 1.4% 25.2 Ally Financial, Inc. 2.2% 7.0 Alphabet, Inc., Class A 1.4% 25.4 Wells Fargo & Co. 2.0% 10.7 Exxon Mobil Corp. 1.3% 14.9 TOTAL 66.2% 13.8 TOTAL 19.2% 17.9
6

SMRS
12/31/18
Market Value in Millions
Assets Percent Benchmark Difference
Financials $3,004 34.7% 13.7% 21.0%Information Technology 1,577 18.2% 19.6% -1.4%Health Care 1,085 12.5% 15.1% -2.6%Communication Services 865 10.0% 9.4% 0.6%Industrials 636 7.4% 9.9% -2.5%Consumer Discretionary 541 6.3% 10.2% -3.9%Consumer Staples 341 3.9% 7.0% -3.1%Utilities 168 1.9% 3.5% -1.6%Energy 168 1.9% 5.1% -3.2%Real Estate 161 1.9% 3.5% -1.6%Materials 109 1.3% 3.0% -1.7%
Total $8,655 100.0% 100.0%
Benchmark: S&P 1500
Active Equity By Sector
12/31/18
Financials34.7%
Information Technology
18.2%
Health Care12.5%
Communication Services
10.0%
Industrials7.4%
Consumer Discretionary
6.3%
Consumer Staples
3.9%
Utilities1.9%
Energy1.9%
RE1.9%
Materials1.3%
7

InceptionFund Name Market Value 3-Years 5-Years 7-Years Date
SMRS S&P 500 Index $6,440,444,086 -4.3% 9.4% 8.6% 12.9% -- N/AS&P 500 -4.4% 9.3% 8.5% 12.7% --Style & Risk Adjusted Benchmark -4.4% 9.2% 8.5% 12.7% --Lipper Large-Cap Core -5.4% 8.1% 7.1% 11.5% --Excess Return 0.1% 0.2% 0.1% 0.2% --Alpha 0.0% 0.2% 0.2% 0.3% --Pct. Rank vs. Lipper Large-Cap Core 33 21 13 12 --
SMRS Large-Cap Core 2,114,150,415 1.4% 10.7% 8.7% 13.8% 7.5% 8/31/07S&P 500 -4.4% 9.3% 8.5% 12.7% 7.1%Style & Risk Adjusted Benchmark -0.5% 11.1% 8.4% 12.9% 7.5%Lipper Large-Cap Core -5.4% 8.1% 7.1% 11.5% 6.4%Excess Return 5.7% 1.4% 0.2% 1.1% 0.4%Alpha 1.8% -0.4% 0.3% 0.8% 0.0%Pct Rank vs Lipper Large-Cap Core 2 8 13 6 12
SMRS All-Cap Garp 1,447,372,850 -7.5% 6.9% 7.1% 12.6% 11.5% 4/30/11S&P 1500 Super Composite -5.0% 9.2% 8.2% 12.6% 10.7%Style & Risk Adjusted Benchmark -4.7% 9.5% 8.5% 12.9% 10.8%Lipper Multi-Cap Core -7.9% 6.8% 5.6% 10.6% 8.5%Excess Return -2.6% -2.3% -1.2% 0.0% 0.8%Alpha -2.9% -2.7% -1.4% -0.3% 0.7%Pct. Rank vs. Lipper Multi-Cap Core 54 60 27 10 1
Mellon US Equity Enhanced 669,922,312 -8.2% -- -- -- 13.5% 3/1/17S&P 500 -4.4% -- -- -- 5.3%Style & Risk Adjusted Benchmark -2.0% -- -- -- 12.9%Lipper Large-Cap Core -5.4% -- -- -- 4.5%Excess Return -3.8% -- -- -- 8.2%Alpha -6.2% -- -- -- 0.6%Pct. Rank vs. Lipper Large-Cap Core 87 -- -- -- 1
LA Capital Deep Value 646,602,510 -10.8% 6.0% -- -- 3.7% 4/1/15S&P 1500 Value -9.3% 7.3% -- -- 4.9%Style & Risk Adjusted Benchmark -9.4% 7.4% -- -- 5.0%Lipper Multi-Cap Value -11.4% 5.6% -- -- 2.9%Excess Return -1.6% -1.3% -- -- -1.2%Alpha -1.4% -1.4% -- -- -1.3%Pct. Rank vs. Lipper Multi-Cap Value 49 43 -- -- 34
Fisher All-Cap 606,768,840 -1.4% 11.1% 10.2% 13.1% 10.2% 10/31/04S&P 1500 -5.0% 9.2% 8.2% 12.6% 8.2%Style & Risk Adjusted Benchmark 0.1% 9.9% 9.1% 13.8% 9.9%Lipper Multi-Cap Core -7.9% 6.8% 5.6% 10.6% 7.0%Excess Return 3.5% 1.9% 2.0% 0.5% 2.0%Alpha -1.5% 1.2% 1.1% -0.7% 0.4%Pct. Rank vs. Lipper Multi-Cap Core 5 1 1 5 1
SMRS Mid-Cap Index 597,932,465 -10.7% 8.4% 6.7% 12.0% -- N/AS&P 400 -11.1% 7.7% 6.0% 11.2% --Style & Risk Adjusted Benchmark -11.1% 7.6% 6.0% 11.2% --Lipper Mid-Cap Core -11.0% 5.9% 4.2% 9.7% --Excess Return 0.4% 0.7% 0.6% 0.7% --Alpha 0.4% 0.7% 0.7% 0.8% --Pct. Rank vs. Lipper Mid-Cap Core 40 19 12 4 --
12/31/18
1-Year Inception
Manager Performance - Net of Fees
8

InceptionFund Name Market Value 3-Years 5-Years 7-Years Date1-Year Inception
SMRS Large-Cap Growth 585,318,853 4.3% 9.0% 9.9% 14.2% 9.1% 5/31/05S&P 500 Growth 0.0% 10.9% 10.6% 14.1% 9.3%Style & Risk Adjusted Benchmark -1.1% 11.8% 11.1% 15.0% 9.5%Lipper Large-Cap Growth -0.8% 9.7% 9.2% 13.5% 8.9%Excess Return 4.3% -1.9% -0.7% 0.2% -0.2%Alpha 5.4% -2.8% -1.3% -0.8% -0.3%Pct Rank vs Lipper Large-Cap Growth 7 69 35 27 36
Seizert Capital Partners 515,154,883 -7.2% 8.4% 5.5% 11.8% 12.1% 11/30/09S&P 1500 Value -9.3% 7.3% 6.0% 11.1% 11.0%Style & Risk Adjusted Benchmark -4.1% 9.3% 6.1% 11.6% 11.2%Lipper Multi-Cap Value -11.4% 5.6% 4.2% 9.6% 9.5%Excess Return 2.1% 1.1% -0.5% 0.7% 1.1%Alpha -3.0% -0.9% -0.6% 0.2% 0.9%Pct. Rank vs. Lipper Multi-Cap Value 11 5 24 4 3
LA Capital All-Cap Growth 434,631,192 0.5% 10.8% 10.6% 14.9% 11.2% 5/31/05S&P 1500 Growth -0.8% 10.6% 10.2% 13.9% 9.3%Style & Risk Adjusted Benchmark -0.5% 9.3% 8.8% 12.6% 8.8%Lipper Multi-Cap Growth -2.9% 8.4% 7.2% 12.2% 8.6%Excess Return 1.4% 0.1% 0.5% 1.1% 1.8%Alpha 1.1% 1.5% 1.8% 2.3% 2.4%Pct. Rank vs. Lipper Multi-Cap Growth 17 18 11 12 5
Large-Cap Consistent Growth 416,259,539 0.7% 9.5% -- -- 8.7% 3/1/15S&P 500 -4.4% 9.3% -- -- 6.8%Style & Risk Adjusted Benchmark 0.2% 9.7% -- -- 7.8%Lipper Large-Cap Core -5.4% 8.1% -- -- 5.6%Excess Return 5.1% 0.2% -- -- 1.9%Alpha 0.6% -0.2% -- -- 0.9%Pct. Rank vs. Lipper Large-Cap Core 2 20 -- -- 4
Ark Investments 383,043,849 -3.9% -- -- -- 26.9% 3/1/16S&P 1500 Growth -0.8% -- -- -- 13.6%Style & Risk Adjusted Benchmark -2.6% -- -- -- 22.3%Lipper Multi-Cap Growth -2.9% -- -- -- 12.4%Excess Return -3.1% -- -- -- 13.2%Alpha -1.4% -- -- -- 4.5%Pct. Rank vs. Lipper Multi-Cap Growth 53 -- -- -- 1
Clarkston Capital Large-Cap 246,423,781 -7.7% 6.3% -- -- 5.8% 4/1/15S&P 500 Value -9.0% 7.2% -- -- 5.0%Style & Risk Adjusted Benchmark -7.2% 5.7% -- -- 4.0%Lipper Large-Cap Value -8.0% 7.2% -- -- 4.8%Excess Return 1.3% -0.9% -- -- 0.8%Alpha -0.5% 0.6% -- -- 1.9%Pct. Rank vs. Lipper Large-Cap Value 36 69 -- -- 24
Clarkston Capital Small/Mid-Cap 194,154,506 -6.8% 7.3% 8.8% -- 8.8% 1/1/14S&P 400 -10.3% 8.2% 6.1% -- 6.1%Style & Risk Adjusted Benchmark -2.7% 5.7% 4.6% -- 4.6%Lipper Mid-Cap Core -11.0% 5.9% 4.2% -- 4.2%Excess Return 3.5% -0.9% 2.7% -- 2.7%Alpha -4.0% 1.5% 4.2% -- 4.2%Pct. Rank vs. Lipper Mid-Cap Core 13 35 1 -- 1
Bivium Capital Partners 127,827,347 -12.2% 5.7% 4.3% 9.6% 4.9% 11/30/07S&P 1500 Value -9.3% 7.3% 6.0% 11.1% 4.8%Style & Risk Adjusted Benchmark -9.9% 7.8% 6.3% 11.5% 7.0%Lipper Multi-Cap Value -11.4% 5.6% 4.2% 9.6% 4.2%Excess Return -2.9% -1.6% -1.6% -1.5% 0.1%Alpha -2.3% -2.1% -2.0% -2.0% -2.0%Pct. Rank vs. Lipper Multi-Cap Value 58 52 53 61 26
9

InceptionFund Name Market Value 3-Years 5-Years 7-Years Date1-Year Inception
Attucks Asset Management 132,454,422 -7.3% 6.5% 5.1% 10.1% 5.5% 11/30/07S&P 1500 -5.0% 9.2% 8.2% 12.6% 6.8%Style & Risk Adjusted Benchmark -4.3% 9.0% 8.2% 12.8% 6.8%Lipper Multi-Cap Core -7.9% 6.8% 5.6% 10.6% 5.2%Excess Return -2.4% -2.7% -3.2% -2.5% -1.2%Alpha -3.0% -2.5% -3.1% -2.7% -1.2%Pct. Rank vs. Lipper Multi-Cap Core 51 63 67 68 50
Ancora 86,411,512 -12.4% -- -- -- -7.4% 10/1/17S&P 1000 -10.3% -- -- -- -4.3%Style & Risk Adjusted Benchmark -8.4% -- -- -- -3.3%Lipper Mid-Cap Core -11.0% -- -- -- -5.0%Excess Return -2.1% -- -- -- -3.2%Alpha -4.0% -- -- -- -4.2%Pct. Rank vs. Lipper Mid-Cap Core 69 -- -- -- 77
Munder Concentrated SMID Cap 20,082,572 -17.6% 0.6% 1.2% 7.5% 11.6% 4/30/09S&P 1000 -10.3% 8.2% 6.1% 11.5% 15.4%Style & Risk Adjusted Benchmark -11.8% 8.9% 6.6% 12.1% 14.5%Lipper Mid-Cap Core -11.0% 5.9% 4.2% 9.7% 13.3%Excess Return -7.3% -7.6% -4.9% -4.1% -3.8%Alpha -5.8% -8.3% -5.4% -4.7% -2.8%Pct. Rank vs. Lipper Mid-Cap Core 93 94 92 90 83
NorthPointe All-Cap Core 19,258,989 -9.7% 4.8% 3.1% 9.8% 6.3% 10/31/04S&P 1500 Value -9.3% 7.3% 6.0% 11.1% 7.1%Style & Risk Adjusted Benchmark -7.6% 6.8% 5.4% 11.1% 9.1%Lipper Multi-Cap Value -11.4% 5.6% 4.2% 9.6% 6.1%Excess Return -0.4% -2.5% -2.8% -1.3% -0.8%Alpha -2.1% -2.0% -2.2% -1.3% -2.8%Pct. Rank vs. Lipper Multi-Cap Value 38 74 75 55 41
10
State of Michigan Retirement System
PRIVATE EQUITY REVIEW State of Michigan Investment Board Meeting
March 7, 2019
Peter A. Woodford Senior Investment Manager
Private Equity Division

EXECUTIVE SUMMARY
Performance
MPSERS Plan (12/31/18) 1-Year 3-Years 5-Years 7-Years 10-Years
Annualized Returns 18.2% 14.8% 14.6% 14.9% 13.5%
PE Benchmark Returns 21.4% 20.7% 17.2% 20.1% 19.1%
Peer Median Returns 7.7% 9.5% 9.3% 10.3% 8.9%
Percentile Rank vs. Peers* 7 11 14 10 7 *State Street Universe greater than $1 billion
Private Equity returns have been strong relative to peer median returns, ranking in the top 7% of peers over the past ten years. Outperformance to peers is attributable to fund selectivity and strategy. Given the nearly 10-year expansion and corresponding runup in U.S equities, it is not surprising that the Private Equity Division returns have lagged the benchmark somewhat. General Partners are slow to increase portfolio company valuations and even then, do so conservatively.
For the twelve months ending December 31, 2018, the Private Equity Division made contributions of approximately $103 million, net of distributions. Although the pace of distributions continues to slow, distribution activity should remain healthy for as long as the economic expansion continues. General Partners are incentivized to exit investments at current valuations.
Commitments closed during the quarter include:
o $150 million to TSG 8, L.P., a branded consumer products buyout fund.
o $150 million to Warburg Pincus Global Growth, L.P., a multi-strategy, global growth fund.
o $125 million to KKR European Fund V (USD) SCSp, a Western Europe focused buyout fund.
o $100 million to Greenspring Master G, L.P., a venture focused separately managed account.
o $100 million to Flagship Pioneering Special Opportunities Fund II, L.P., a life sciences focused VC fund.
o $75 million to FS Equity Partners VIII, L.P., a consumer and distribution focused middle-market buyout fund.
o $30 million to 5AM Opportunities I, L.P., a late-stage life sciences VC fund.
o $25 million to Greenspring Micro II, L.P., a micro-VC fund-of-funds.
o $20 million to 5AM Ventures VI, L.P., an early-stage life sciences VC fund. Strategy Update
The strategy for the next twelve months will focus on new sponsors raising capital and existing sponsors raising successor funds. This may be a combination of buyout, venture capital, secondary, and growth equity funds seeking new commitments. The Private Equity Division continues to tilt slightly toward the middle and lower-middle market to diversify its exposure to large funds. Co-investments continue to play an important role in both averaging down costs and targeting specific investments with attractive risk/return characteristics.
1

SMRS Private Equity
12/31/18
Cash/ Mezzanine Other Funds 1.6% Liquidation 1.9%
Venture CapitalFunds 12.0%
Buyout Funds45.1%
Special Situation Funds 14.8%
Portfolio 9.1%
Fund of Funds 15.5%
Market Value in Millions
12/31/18 12/31/17 Buyout Funds $5,662 45.1% $4,872 45.8% Fund of Funds 1,939 15.5% 1,196 11.3% Special Situation Funds 1,850 14.8% 1,704 16.0% Venture Capital Funds 1,511 12.0% 1,162 10.9% Liquidation Portfolio 1,136 9.1% 1,249 11.7% Mezzanine Funds 238 1.9% 197 1.9% Cash/Other 204 1.6% 249 2.4%
Total $12,540 100.0% $10,629 100.0%
2

12/31/18Outstanding
Commitments
OtherRecallableReturnedCapital
FXChange
CapitalCalls
New Deals
9/30/18Outstanding
Commitments
$7,320
$40$17
($5)
($834)
$775$7,327
($ in Millions)
12/31/18Reported
Value
CashBalanceChange
ReportedValue
Change
StockDist.
Received
Cash Dist.
Received
Capital Calls
9/30/18Reported
Value
$12,540
($220)
$455
($18) ($482)
$834
$11,971
($ in Millions)
SMRSPrivate Equity
12/31/18
3
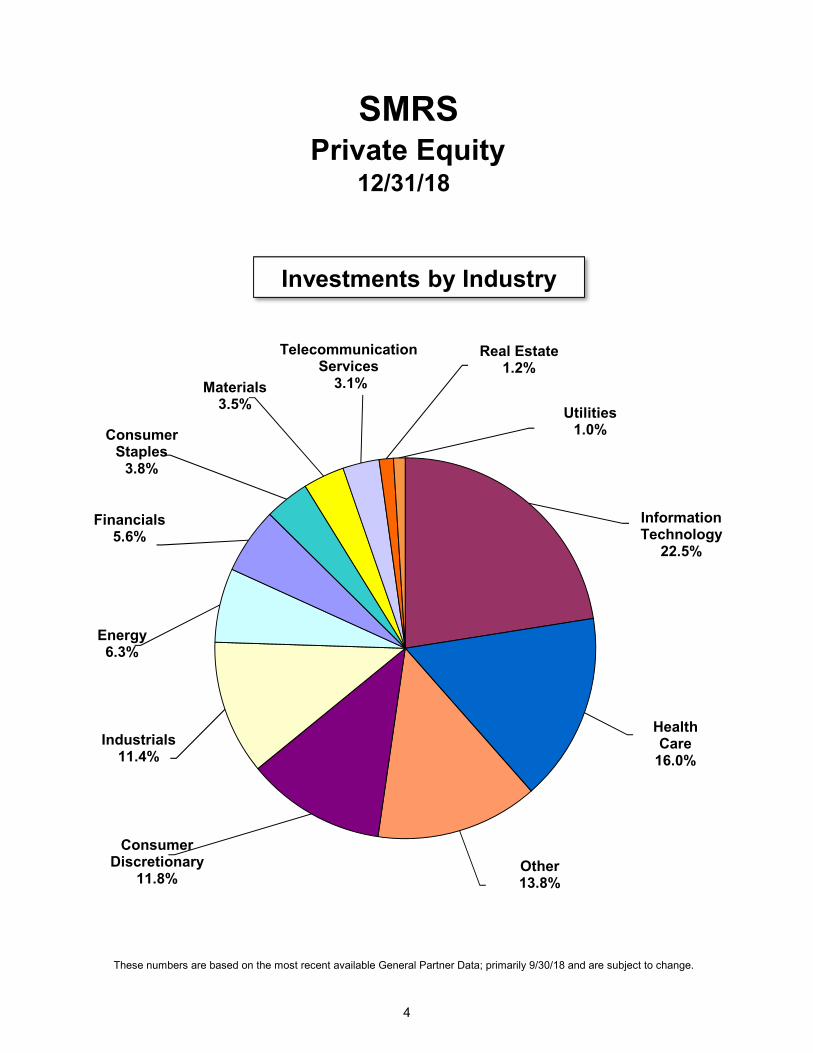
SMRS Private Equity
12/31/18
These numbers are based on the most recent available General Partner Data; primarily 9/30/18 and are subject to change.
Investments by Industry
Information Technology
22.5%
Health Care
16.0%
Other13.8%
Consumer Discretionary
11.8%
Industrials11.4%
Energy6.3%
Financials5.6%
Consumer Staples
3.8%
Materials3.5%
Telecommunication Services
3.1%
Real Estate1.2%
Utilities1.0%
4
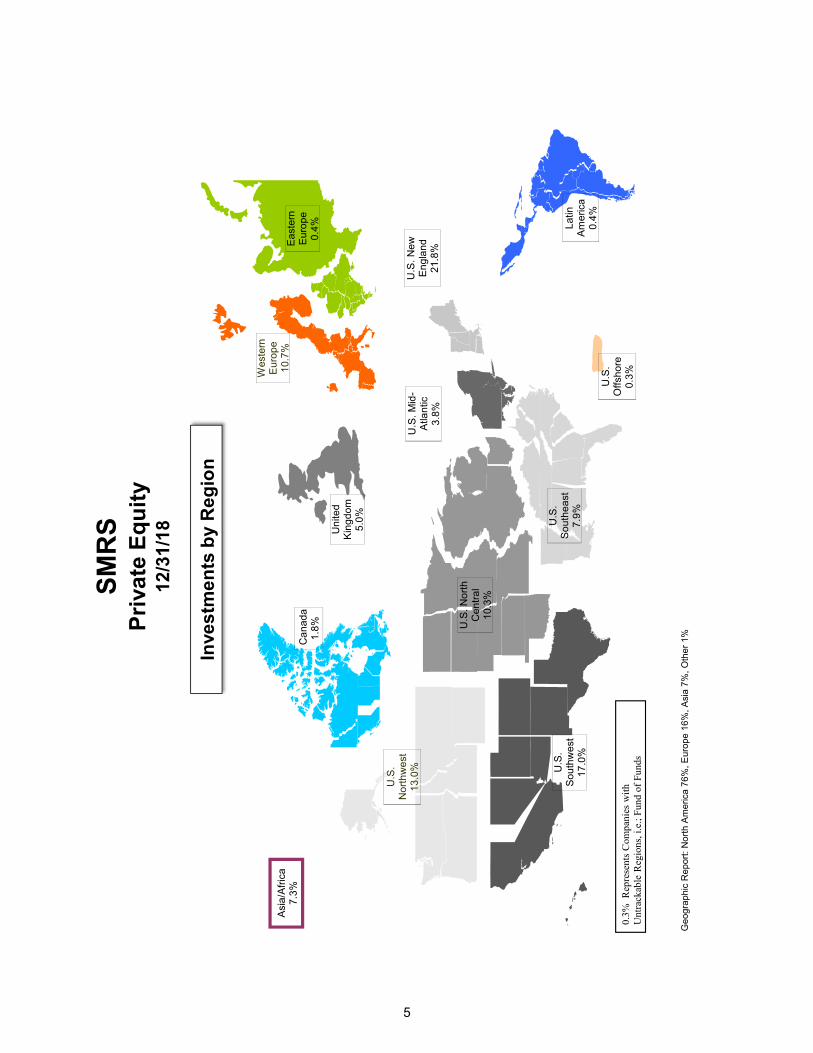
Geo
grap
hic
Rep
ort:
Nor
th A
mer
ica
76%
, Eur
ope
16%
, Asi
a 7%
, Oth
er 1
%
12
/31
/18
Pri
vate
Eq
uit
yS
MR
S
Asi
a/A
fric
a
7.3
%
Un
ited
K
ing
do
m
5.0
%
Wes
tern
E
uro
pe
1
0.7
%E
ast
ern
E
uro
pe
0
.4% La
tin
Am
eric
a
0.4
%
U.S
. N
ort
hw
est
1
3.0
% U.S
. S
ou
thw
est
1
7.0
%
U.S
. N
ort
h
Ce
ntr
al
10
.3%
U.S
. S
ou
the
ast
7
.9%
U.S
. M
id-
Atla
ntic
3
.8%
U.S
. N
ew
E
ng
lan
d
21
.8%
Ca
na
da
1
.8%
U.S
. O
ffsh
ore
0
.3%
0.3%
Rep
rese
nts
Com
pani
es w
ith
U
ntra
ckab
le R
egio
ns, i
.e.;
Fund
of
Fund
s
Inve
stm
en
ts b
y R
eg
ion
5

($ in Millions)
Asset Vintage
1986-98 2$ 2$ 4$ 1999 6 5 112000 47 23 702001 117 60 1772002 6 4 102003 6 13 192004 93 35 1282005 220 24 2442006* 582 171 7532007 513 131 6442008 661 100 7612009 44 1 452010 256 4 2602011 697 107 8042012 1,376 117 1,4932013 408 120 5282014 1,446 349 1,7952015 4,074 1,247 5,3212016 1,222 1,067 2,2892017 339 1,321 1,6602018 222 2,419 2,641Income Accruals 1 0 1Cash 194 0 194Act. Small Cap - Stock Dist 8 0 8
Total 12,540$ 7,320$ 19,860$
*Liquidation portfolio is 2006 vintage
($ in Millions)
Reported Value
Euro ($1.14/ €) € 396 $855€ 748€ 352
Outstanding Commitment
Total Exposure
Total (USD)
12/31/18
SMRSPrivate Equity
Reported Value
Outstanding Commitment
Total Exposure
Portfolio by Vintage Year
FX Exposure
6

($ in Millions)
HarbourVest PartnersKKRWarburg Pincus CapitalBlackstone Capital PartnersThe Carlyle GroupGrosvenor Capital ManagementAdvent InternationalLeonard Green & PartnersTPGThe Riverside Company
Top 10 Total Value
BuyoutFund of FundsMezzanineSpecial SituationsVenture Capital
*These numbers are based on most recent available General Partner reported data; primarily 9/30/18 and are subject to change.
555
Asset Type Total
2,626$ 614$ 3,240$ 401 956
Outstanding Commitment
Reported Value
621 538 366 595 464
303 329 493 121
578
924 867 859 716
573 257 223
6,669$
114 149 424
477 461
9,651$
(Net IRR) Current Qtr. 1-Year 3-Year 5-Year 10-Year
220 238
2,982$
24.0%
13.8%19.5%10.8%9.1%
16.0%16.4%11.1%11.2%14.6%
17.0%11.1%
-0.2%2.0%0.4%-0.1%0.2%
11.9%13.3%20.7%
14.2%13.7%7.6%9.3%
16.4%
SMRSPrivate Equity
12/31/18
Top 10 Sponsors
Cash Weighted Rates of Return*
7

** 5AM Opportunities I, L.P. 2,175,000$ 27,825,000$ ** 5AM Ventures VI, L.P. 200,000 19,800,000
Accel Europe I, L.P. 3,230,543 1 Accel Europe II 16,023,485 3,300,000 Accel Growth Fund II, L.P. 18,298,227 240,000 Accel Growth Fund III, L.P. 16,476,498 1,120,000 Accel Growth Fund IV L.P. 17,924,420 3,740,000 Accel IX, L.P. 5,066,074 3,000,000 Accel Leaders Fund L.P. 6,126,498 330,000 Accel London V L.P. 8,639,969 4,320,000 Accel VI-S 2,232,087 652,611 Accel VI, L.P. 1,004,899 - Accel VIII, L.P. 290,145 4,782,499 Accel X, L.P. 17,775,124 - Accel XI, L.P. 8,208,482 1,680,000 Accel XII, L.P. 6,129,563 1,190,000 Accel XIII, L.P. 5,188,032 4,800,000 Advent Global Private Equity V 7,551,796 8,700,000 Advent International GPE VI-A LP 50,888,223 - Advent International GPE VII-B, L.P. 217,355,650 12,000,000 Advent International GPE VIII-B, L.P. 169,388,119 78,975,000 Advent Latin American Private Equity Fund VI, L.P. 18,869,423 14,140,000 Affinity Asia Pacific Fund III, L.P. 42,134,680 10,687,479 Affinity Asia Pacific Fund IV, L.P. 112,039,187 19,149,634 Affinity Asia Pacific Fund V L.P. 10,008,170 164,991,830 Apax Digital, L.P. 4,777,620 45,108,993 Apax Europe Fund VI 19,319,637 2,417,531 Apax Europe VII, L.P. 27,717,495 1,702,585 Apax IX, L.P. 79,559,519 85,005,421 Apax US VII 10,812,628 417,509 Apax VIII - B, L.P. 99,008,004 7,322,257 Apollo Investment Fund IX, L.P. - 100,000,000 Apollo Investment Fund VIII L.P. 92,627,734 18,356,765 Arboretum Ventures II 2,168,444 - Arboretum Ventures III, L.P. 15,512,680 - Arboretum Ventures IV, L.P. 20,794,312 14,040,000 Ares Corporate Opportunities Fund II 7,210,466 11,423,773 Ares Corporate Opportunities Fund III, LP 76,782,705 8,551,001
Reported ValueUnfunded
CommitmentAdjusted
SMRSPrivate Equity
12/31/18
Net Market Values by Ownership Entity
8

Reported ValueUnfunded
CommitmentAdjusted
Ares Corporate Opportunities Fund IV, L.P. 93,985,523 18,229,028 ASF VIII B 15,000 149,985,000 AXA ASF Miller Co-Investment 480,418 6,656,684 Axiom Asia Co-Investment Fund I, L.P. 3,727,576 46,248,591 Axiom Asia IV, L.P. 33,964,382 19,447,811 Axiom Asia Private Capital Fund III, L.P. 47,325,270 6,649,264 Axiom Asia V, L.P. 1,423,532 48,500,000 BC European Capital IX 74,781,732 1,925,447 BC European Capital VII, L.P. 558,669 - BC European Capital VIII, L.P. 24,595,003 8,912,507 Berkshire Fund IX Coinvestment Fund, L.P. 6,838,046 42,932,166 Berkshire Fund IX, L.P. 68,859,965 99,994,192 Berkshire Fund VI, L.P. 36,911,573 7,600,677 Berkshire Fund VII, L.P. 30,961,009 2,449,845 Berkshire Fund VIII, L.P. 70,470,178 9,463,285 Blackstone Capital Partners IV 17,599,511 4,729,676 Blackstone Capital Partners V 23,937,353 13,069,148 Blackstone Capital Partners V-S 1,646,467 712,476 Blackstone Capital Partners VI, LP 290,278,001 43,877,598 Blackstone Capital Partners VII, L.P. 137,271,668 158,963,185 Bridgepoint Europe IV 34,348,544 6,103,612 Carlyle Europe Partners II 894,509 4,227,306 Carlyle Europe Partners III 13,412,700 6,078,167 Carlyle Europe Partners IV, L.P. 120,698,931 13,106,304 Carlyle Europe Partners V, S.C.SP. - 142,893,747 Carlyle Partners IV, L.P. 5,639,952 16,009,296 Carlyle Partners V L.P. 53,774,966 54,261,025 Carlyle Partners VI, L.P. 163,469,662 14,218,009 Carlyle Partners VII, L.P. 8,066,219 241,933,781 Centerbridge Capital Partners III, LP 39,410,896 46,875,089 Cerberus SMRS Partners, L.P. 50,800,547 23,304,657 Charlesbank Equity Fund IX, L.P. 14,607,854 85,515,021 Charlesbank Fund IX Overage Allocation Program 14,438,323 35,696,334 CM Liquidity Fund, L.P. - 25,000,000 Coller International Partners V, L.P. 21,207,615 43,600,000 Coller International Partners VI, L.P. 34,699,293 29,723,267 Coller International Partners VII, L.P. 104,182,644 63,040,960 Crescent Mezzanine Partners VI, L.P. 31,623,003 8,496,178 Crescent Mezzanine Partners VII 18,448,246 132,247,053 CVC Capital Partners VII, L.P. 27,097,662 144,374,834 DLJ Investment Partners III - 764,960 Dover Street IX, L.P. 55,889,254 47,000,000 EnCap Energy Capital Fund X, L.P. 34,797,417 11,099,951 Entertainment IP Fund, L.P. 16,149,474 33,767,382 FIMI Opportunity 6, L.P. 16,297,637 34,681,820 FirstMark Capital I, L.P. 79,390,642 196,596
9

Reported ValueUnfunded
CommitmentAdjusted
FirstMark Capital IV, L.P. 11,205,791 24,150,000 FirstMark Capital OF I, L.P. 26,417,035 - FirstMark Capital OF II, L.P. 17,389,766 17,500,000 FirstMark Capital P2, L.P. 168,082,451 -
** Flagship Pioneering Special Opportunities Fund II, L.P. - 100,000,000 Flagship Pioneering VI 20,009,033 56,250,000 Flagship Ventures Fund 2004 8,738,655 - Flagship Ventures Fund 2007, L.P. 16,475,524 - Flagship Ventures Fund IV, L.P. 146,703,193 - Flagship Ventures Fund V 78,656,222 1,925,000 Flagship Ventures Opportunities Fund I, L.P. 35,561,524 23,250,000 Fox Paine Capital Fund II, LP 29,904,001 15,382,699 FS Equity Partners VII, L.P. 92,400,054 22,793,183
** FS Equity Partners VIII, L.P. - 75,000,000 G-IV Acquisition Holdings, LLC 13,521,776 - GCM Grosvenor Fund Investment Program I, L.P. 9,699,624 1,330,800 GCM Grosvenor Fund Investment Program II, L.P. 40,298,267 13,896,317 GCM Grosvenor Fund Investment Program III - 2004 46,157,767 4,536,596 GCM Grosvenor Fund Investment Program III - 2006 51,027,846 7,021,779 GCM Grosvenor Fund Investment Program V, L.P. 58,988,375 10,248,911 GCM Grosvenor Fund Investment Program VI, L.P. 24,271,490 8,093,934 GCM Grosvenor Fund Investment Program VIII, L.P. 71,903,730 27,812,528 GCM Grosvenor SeasPriFIP LP (PIS06-10) 59,415,887 16,989,604 GCM Grosvenor SeasPriFIP LP (PIS14) 197,352,451 17,238,325 GCM Grosvenor SeasPriFIP LP (Seed) 36,139,814 13,769,012 Genstar Capital Partners VIII, L.P. 32,764,283 23,431,443 Genstar VIII Opportunities Fund I, L.P. 47,396,093 7,055,029 Green Equity Investors IV 4,554,598 1,136,036 Green Equity Investors V 196,143,730 25,966,435 Green Equity Investors VI, L.P. 130,710,292 13,451,824 Green Equity Investors VII, L.P. 91,935,935 108,856,779
** Greenspring Master G, L.P. - 100,000,000 ** Greenspring Micro II, L.P. 2,783,737 22,216,263
GSO Capital Opportunities Fund II, L.P. 15,530,781 11,316,595 GSO Capital Opportunities Fund III, L.P. 39,394,382 59,131,802 GSO COF III Co-Investment Fund, L.P. 12,816,567 36,775,532 HarbourVest Dover Street VIII, L.P. 28,333,774 6,750,000 HarbourVest Int'l III Partnership 165,353 1,200,000 Harbourvest Partners Co-Investment Fund IV L.P 83,187,591 25,893,830 HarbourVest Partners Mezzanine Income Fund 66,763,587 39,810,000 HarbourVest V Partnership 167,309 300,000 HarbourVest VI - Direct Fund LP 2,916,478 750,000 HarbourVest VI Partnership 1,071,677 2,000,000 Harvest Partners VII, L.P. 43,358,335 34,449,033 HPS Mezzanine Partners III, L.P. 37,019,752 14,365,364 Insight Venture Partners Growth-Buyout Coinvestment Fund 77,951,487 9,343,979
10
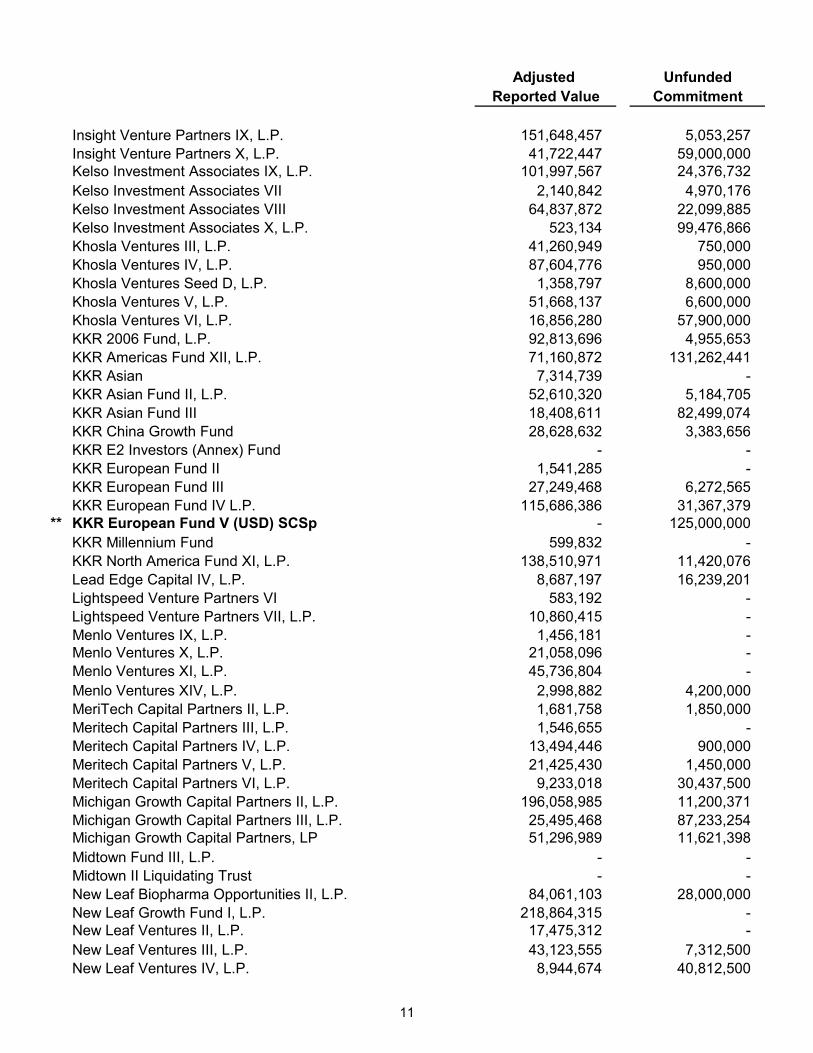
Reported ValueUnfunded
CommitmentAdjusted
Insight Venture Partners IX, L.P. 151,648,457 5,053,257 Insight Venture Partners X, L.P. 41,722,447 59,000,000 Kelso Investment Associates IX, L.P. 101,997,567 24,376,732 Kelso Investment Associates VII 2,140,842 4,970,176 Kelso Investment Associates VIII 64,837,872 22,099,885 Kelso Investment Associates X, L.P. 523,134 99,476,866 Khosla Ventures III, L.P. 41,260,949 750,000 Khosla Ventures IV, L.P. 87,604,776 950,000 Khosla Ventures Seed D, L.P. 1,358,797 8,600,000 Khosla Ventures V, L.P. 51,668,137 6,600,000 Khosla Ventures VI, L.P. 16,856,280 57,900,000 KKR 2006 Fund, L.P. 92,813,696 4,955,653 KKR Americas Fund XII, L.P. 71,160,872 131,262,441 KKR Asian 7,314,739 - KKR Asian Fund II, L.P. 52,610,320 5,184,705 KKR Asian Fund III 18,408,611 82,499,074 KKR China Growth Fund 28,628,632 3,383,656 KKR E2 Investors (Annex) Fund - - KKR European Fund II 1,541,285 - KKR European Fund III 27,249,468 6,272,565 KKR European Fund IV L.P. 115,686,386 31,367,379
** KKR European Fund V (USD) SCSp - 125,000,000 KKR Millennium Fund 599,832 - KKR North America Fund XI, L.P. 138,510,971 11,420,076 Lead Edge Capital IV, L.P. 8,687,197 16,239,201 Lightspeed Venture Partners VI 583,192 - Lightspeed Venture Partners VII, L.P. 10,860,415 - Menlo Ventures IX, L.P. 1,456,181 - Menlo Ventures X, L.P. 21,058,096 - Menlo Ventures XI, L.P. 45,736,804 - Menlo Ventures XIV, L.P. 2,998,882 4,200,000 MeriTech Capital Partners II, L.P. 1,681,758 1,850,000 Meritech Capital Partners III, L.P. 1,546,655 - Meritech Capital Partners IV, L.P. 13,494,446 900,000 Meritech Capital Partners V, L.P. 21,425,430 1,450,000 Meritech Capital Partners VI, L.P. 9,233,018 30,437,500 Michigan Growth Capital Partners II, L.P. 196,058,985 11,200,371 Michigan Growth Capital Partners III, L.P. 25,495,468 87,233,254 Michigan Growth Capital Partners, LP 51,296,989 11,621,398 Midtown Fund III, L.P. - - Midtown II Liquidating Trust - - New Leaf Biopharma Opportunities II, L.P. 84,061,103 28,000,000 New Leaf Growth Fund I, L.P. 218,864,315 - New Leaf Ventures II, L.P. 17,475,312 - New Leaf Ventures III, L.P. 43,123,555 7,312,500 New Leaf Ventures IV, L.P. 8,944,674 40,812,500
11

Reported ValueUnfunded
CommitmentAdjusted
Nordic Capital VI, L.P. 855,732 1 Nordic Capital VII 5,134,095 3,147,252 Nordic Capital VIII, L.P. (Alpha) 38,428,437 12,195,042 Oak Investment Partners X, L.P. 7,061,059 - Oak Investments Partners IX, L.P. 797,717 - Oaktree Opportunities Fund X, L.P. 31,400,440 5,100,000 Oaktree Opportunities Fund Xb, L.P. 8,683,924 61,250,000 OCM Opportunities Fund IX, L.P. 60,551,892 - OCM Opportunities Fund VII (B), L.P. 1,511,481 5,000,000 OCM Opportunities Fund VII, L.P. 2,446,868 - OCM Opportunities Fund VIII B, L.P. 21,301,682 - OCM Opportunities Fund VIII, L.P. 2,684,459 - OCM Principal Opportunities Fund IV 1,341,165 5,002,377 Ocqueoc Holdings, LLC 13,602,380 49,650,991 Parthenon Investors II 1,027,745 3,186,779 Parthenon Investors III 30,060,306 2,732,182 Parthenon Investors IV, L.P. 57,250,180 3,901,540 Peninsula Capital Fund IV 1,056,949 2,201,026 Peninsula Fund VI, L.P. 26,213,805 14,703,844 Permira Growth Opportunities I, L.P.1 - 50,000,000 PPC Fund II 20,517,088 54,786,949 Public Pension Capital, LLC 49,694,030 64,901,099 Rhone Partners V, L.P. 64,960,149 55,251,559 Riverside Capital Appreciation Fund VI, LP 62,941,073 11,792,789 Riverside Capital Appreciation Fund VII, L.P. - 100,000,000 Riverside Micro Cap Fund I, LP 17,923,710 5,782,975 Riverside Micro-Cap Fund II, L.P. 39,154,173 2,735,834 Riverside Micro-Cap Fund III, L.P. 57,786,956 7,261,513 Riverside Micro-Cap Fund IV 45,233,435 10,639,880 Riverside Micro-Cap Fund V, L.P. - 100,000,000 Science Ventures Fund II, L.P. 11,308,668 8,600,000 Shamrock Growth Capital Fund IV, L.P. 15,211,575 32,333,432 Silver Lake Partners II 486,982 3,531,586 Silver Lake Partners III 75,744,827 13,199,137 Silver Lake Partners IV, L.P. 65,837,922 5,175,296 Silver Lake Partners V, L.P. 15,265,007 51,459,240 SK Capital Partners V, L.P. 6,579,842 40,448,640 SM/TCP L.P. 38,248,041 1,615,217 SMRS - TOPE LLC 1,526,798,259 216,520,315 SMRS-CAPP LLC 17,161,137 83,300,000 SMRS-NCRP LLC 843,450,913 190,958,521 Sycamore Partners III, L.P. 10,266,597 87,547,283 TCW/Crescent Mezzanine Partners III Secondary 29,860 - TCW/Crescent Mezzanine Partners III, L.P. 154,406 29,733,856 TCW/Crescent Mezzanine Partners IV, L.P. 252,867 13,660,773 TCW/Crescent Mezzanine Partners IVB Secondary 223,555 -
12
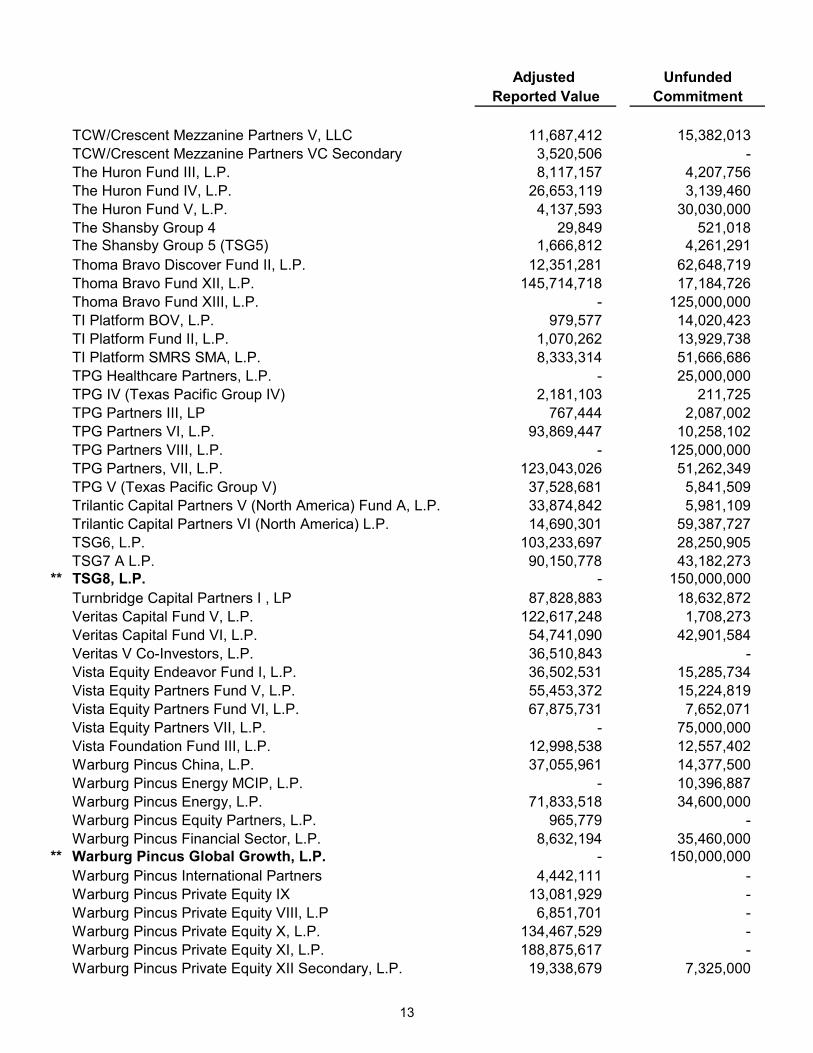
Reported ValueUnfunded
CommitmentAdjusted
TCW/Crescent Mezzanine Partners V, LLC 11,687,412 15,382,013 TCW/Crescent Mezzanine Partners VC Secondary 3,520,506 - The Huron Fund III, L.P. 8,117,157 4,207,756 The Huron Fund IV, L.P. 26,653,119 3,139,460 The Huron Fund V, L.P. 4,137,593 30,030,000 The Shansby Group 4 29,849 521,018 The Shansby Group 5 (TSG5) 1,666,812 4,261,291 Thoma Bravo Discover Fund II, L.P. 12,351,281 62,648,719 Thoma Bravo Fund XII, L.P. 145,714,718 17,184,726 Thoma Bravo Fund XIII, L.P. - 125,000,000 TI Platform BOV, L.P. 979,577 14,020,423 TI Platform Fund II, L.P. 1,070,262 13,929,738 TI Platform SMRS SMA, L.P. 8,333,314 51,666,686 TPG Healthcare Partners, L.P. - 25,000,000 TPG IV (Texas Pacific Group IV) 2,181,103 211,725 TPG Partners III, LP 767,444 2,087,002 TPG Partners VI, L.P. 93,869,447 10,258,102 TPG Partners VIII, L.P. - 125,000,000 TPG Partners, VII, L.P. 123,043,026 51,262,349 TPG V (Texas Pacific Group V) 37,528,681 5,841,509 Trilantic Capital Partners V (North America) Fund A, L.P. 33,874,842 5,981,109 Trilantic Capital Partners VI (North America) L.P. 14,690,301 59,387,727 TSG6, L.P. 103,233,697 28,250,905 TSG7 A L.P. 90,150,778 43,182,273
** TSG8, L.P. - 150,000,000 Turnbridge Capital Partners I , LP 87,828,883 18,632,872 Veritas Capital Fund V, L.P. 122,617,248 1,708,273 Veritas Capital Fund VI, L.P. 54,741,090 42,901,584 Veritas V Co-Investors, L.P. 36,510,843 - Vista Equity Endeavor Fund I, L.P. 36,502,531 15,285,734 Vista Equity Partners Fund V, L.P. 55,453,372 15,224,819 Vista Equity Partners Fund VI, L.P. 67,875,731 7,652,071 Vista Equity Partners VII, L.P. - 75,000,000 Vista Foundation Fund III, L.P. 12,998,538 12,557,402 Warburg Pincus China, L.P. 37,055,961 14,377,500 Warburg Pincus Energy MCIP, L.P. - 10,396,887 Warburg Pincus Energy, L.P. 71,833,518 34,600,000 Warburg Pincus Equity Partners, L.P. 965,779 - Warburg Pincus Financial Sector, L.P. 8,632,194 35,460,000
** Warburg Pincus Global Growth, L.P. - 150,000,000 Warburg Pincus International Partners 4,442,111 - Warburg Pincus Private Equity IX 13,081,929 - Warburg Pincus Private Equity VIII, L.P 6,851,701 - Warburg Pincus Private Equity X, L.P. 134,467,529 - Warburg Pincus Private Equity XI, L.P. 188,875,617 - Warburg Pincus Private Equity XII Secondary, L.P. 19,338,679 7,325,000
13

Reported ValueUnfunded
CommitmentAdjusted
Warburg Pincus Private Equity XII, L.P. 135,569,871 51,275,000 WestAm COREplus Private Equity QP 368,709 2,086,719
Total Private Equity 12,336,259,107$ 7,320,344,959$
Cash 179,337,693 - Active Small Cap Cash 15,020,396 - Active Small Cap 7,996,784 - Income Accruals 1,176,841 -
Grand Total 12,539,790,821$ 7,320,344,959$
** New Commitments made during quarter reported
Total Private Equity amounts do not include Cash and Active Small Cap
14

State of Michigan Retirement System
INTERNATIONAL EQUITY REVIEWState of Michigan Investment Board Meeting
March 7, 2019
Patrick M. Moraniec, CFASenior Investment ManagerInternational Equity Division

EXECUTIVE SUMMARY
Performance
MPSERS Plan (12/31/18) 1-Year 3-Years 5-Years 7-Years 10-Years
Annualized Returns -14.3% 4.7% 2.0% 6.1% 7.5%
MSCI ACWI ex USA Returns -14.2% 4.5% 0.7% 5.0% 5.8%
Peer Median Returns -14.2% 4.1% 1.3% 6.3% 7.6%
Percentile Rank vs. Peers* 54 23 32 57 53 *Source: State Street Universe greater than $1 billion
The International Equity Division (IED) portfolio underperformed the benchmark by 0.1% over the last twelve months primarily due to the underperformance of emerging markets and the information technology sector. Outperformance in the internal stock plus strategy (190 bps) helped to mitigate the division’s underperformance.
Asset Class Goals
Construct a non-U.S. equity-focused portfolio to generate, on a consistent basis, ten-year returns that exceed the MSCI ACWI ex USA by 1.0%.
Perform in the top half of the public plan peer universe percentile rankings.
Advance people, processes, and systems to continuously improve investment decisions.
Strategy
The International Equity Division has three distinct portfolio strategies. o Active investments, 36.5% of assets, to gain specific international stock market
exposures.
o Stock plus investments, 34.9% of assets, to implement a portable alpha strategy onto high-level strategic tilts.
o Index investments, 28.6% of assets, to gain broad international stock market exposure with minimal tracking risk.
Current portfolio drivers of risk and return.
o Tracking error of the portfolio is approximately 0.7% which is below the division’s risk
budget of 3.0%.
o Emerging markets, a large contributor to tracking error, is one-fifth of the total tracking error indicating the portfolio is not materially exposed to any one single risk.
o Future portfolio returns will be driven by the performance of the quality factor, value factor, momentum factor, and emerging markets overweight.
1

Quarterly changes to International Equity Division allocation.
o Rebalanced $1.2 billion of maturing equity swaps to MSCI factor indexes increasing the portfolio’s exposure to the quality, value and momentum factors. The combined allocation has an estimated information ratio of 0.6.
o Allocated $825.0 million to the BlackRock MSCI Systematic Return strategy. IED designed this multi-factor custom index strategy to improve the consistency of the division’s excess returns at low cost of 6 bps. Over long investment horizons IED estimates the strategy should produce excess returns of approximately 170 bps with an information ratio of around 1.0.
Market Environment and Outlook
Last calendar year represented the worst annual performance for international stock
markets since the Great Financial Crisis of 2008. The MSCI ACWI ex USA index was down -14.2% in 2018 with events in China, Turkey, South Africa, United Kingdom and Italy weighing on markets.
Emerging markets were volatile in 2018. From the January 2018 high to October low the peak-to-trough drawdown was approximately 26.0%. Since October, emerging markets have outperformed the MSCI ACWI ex USA by 460 bps drawing almost even with broader international market for 2018. IED has been overweight emerging markets the past two years which has outperformed the MSCI ACWI ex USA by 540 bps through January of 2019.
In 2018, analysts continuously revised downward their forward-looking estimates for earnings-per-share. Over the next twelve months analysts expect earnings-per-share to grow approximately 10.0%. Expectations for growth have not been this low since 2015. Low expectations potentially represent a catalyst for positive international stock returns in 2019.
Lower analyst expectations were driven from below average realized growth. International stock markets’ top line continued to grow, albeit at a slower pace than the first half of the year. Sales grew 2.1% year-over-year through early February 2019 for the MSCI ACWI ex USA which is below the 5.4% twenty-year average.
Manufacturing PMIs serve as proxy for forward-looking economic activity. Country by country analysis of the top 80% of the index market capitalization weights shows most country manufacturing PMIs still contracting.
World trade volumes, another economic growth proxy, grew year-over-year at 2.8%. The rate of growth is below the twenty-year average of approximately 5.0%. On-going trade disputes between US, Europe and China may explain the subdued growth.
U.S. and China trade discussions, which are now over a year old, continue to evolve. The November G-20 meeting between President Trump and President Xi bought China four extra months of negotiating time. If a deal can’t be reached by March 2019 President Trump plans to move forward with increasing tariffs to 25% on the $200 billion of additional goods announced in 2018 plus potential tariffs on all remaining Chinese imports of approximately $267 billion.
2

Stock prices may reflect much of this slower economic reality. For example, the MSCI ACWI ex USA trailing twelve-month normalized price-to-earnings ratio is 16.8 well below the twenty-year average of 22.3 implying return upside should earnings growth pick-up.
International stock market breadth indicates a bottom developed in December 2018. Incrementally less negative economic indicators would further support a market bottom.
In 2018, the ECB discussed tightening monetary policy in 2019. More recently the ECB appears less certain this will be a 2019 event. The global slowdown in growth and the pause in U.S. Federal Reserve policy indicates central banks will remain accommodative through 2019.
Go-forward annualized returns for the MSCI ACWI ex USA index are estimated at 9.1%. This rate is based on the current price and actual fundamentals over multiple periods to remove fundamental variability, better estimating the earnings power of the index.
A ten-year blended international government yield of 1.6% implies an international equity risk premium of 7.5%. The premium expanded primarily due to a fall in global government interest rates over the last year. Lower government bond interest rates should support the recent softer global growth.
Conclusion International stock market returns in 2018 were the worst since the Great Financial Crisis of 2008. Earnings-per-share however was flat leading to further contraction of an already attractive earnings multiple. The slowdown in growth from 2017 to 2018 resulted in downward revisions to analyst estimates, which are now the most pessimistic since 2015. With no multiple expansion the analysts are indicating 2019 international stock market returns of about 10%. IED believes continued accommodation from central banks will backstop any further slowdown in global economy. A potential resolution on trade could lead to a pick-up in economic activity and a rerating of international multiples which would be additive to the earnings growth projections for 2019.
3

SMRSInternational Equity Strategies
12/31/18
Markets
Active
Los Angeles Capital Management $1,193 Wellington 887 BlackRock MSCI 826 Marathon-London 267 Effissimo Capital Management 222 SSGA 218 Lazard 218 Martin Currie 211
Total Active $4,043 36.5%
Stock Plus
Internal Stock Plus $2,311 PIMCO 1,557
Total Stock Plus $3,868 34.9%
Indexed
SSGA $1,994 BlackRock 1,179
Total Indexed $3,173 28.6%
TOTAL $11,084 100.0%
Amount % of TotalTotal
($ in Millions)
4
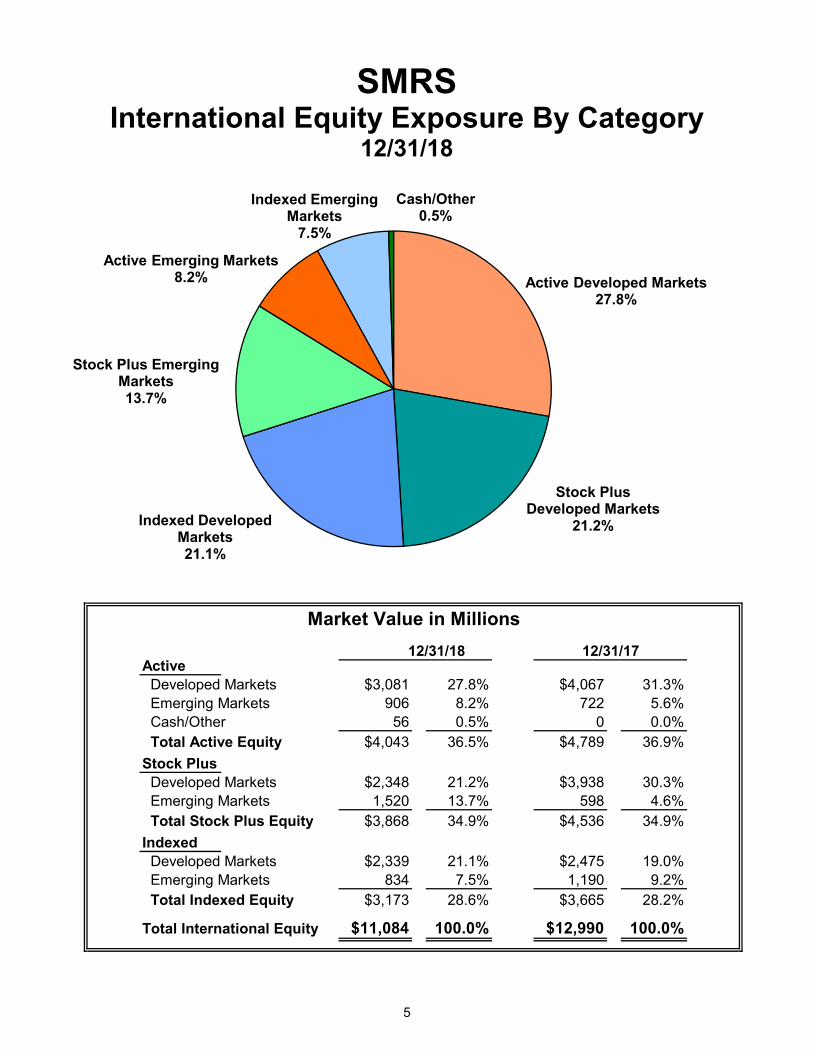
SMRSInternational Equity Exposure By Category
12/31/18
Market Value in Millions
12/31/18 12/31/17Active Developed Markets $3,081 27.8% $4,067 31.3% Emerging Markets 906 8.2% 722 5.6% Cash/Other 56 0.5% 0 0.0% Total Active Equity $4,043 36.5% $4,789 36.9%
Stock Plus Developed Markets $2,348 21.2% $3,938 30.3% Emerging Markets 1,520 13.7% 598 4.6% Total Stock Plus Equity $3,868 34.9% $4,536 34.9%
Indexed Developed Markets $2,339 21.1% $2,475 19.0% Emerging Markets 834 7.5% 1,190 9.2% Total Indexed Equity $3,173 28.6% $3,665 28.2%
Total International Equity $11,084 100.0% $12,990 100.0%
Active Developed Markets27.8%
Stock Plus Developed Markets
21.2%Indexed Developed Markets21.1%
Stock Plus Emerging Markets13.7%
Active Emerging Markets8.2%
Indexed Emerging Markets
7.5%
Cash/Other0.5%
5

SMRS International Equities
12/31/18
Date: 12/31/18
9/30/18 6/30/18 3/31/18
Assets ($ in Millions): $11,084 $12,558 $12,491 $12,901 Number of Securities: 2,646 2,669 2,644 2,376 Active Share: 22% 22% 24% 24%
Benchmark: MSCI ACWI ex USA Description: The International Equities Composite represents all International Equity Division investments. Portfolio Characteristics: SMRS MSCI ACWI ex USA LTM Normalized LTM Normalized Return: Annualized Compound Rate 11.1% 9.8% 9.8% 9.1% Sustainable Growth Rate 7.7% 6.9% 6.9% 6.8% Dividend Yield 2.6% 2.4% 2.7% 2.4% Buyback Yield 0.1% -0.1% 0.3% -0.1% Overlay Yield 0.6% 0.6% -- -- Risk: Beta 1.0 -- 1.0 -- Volatility 14.3% -- 14.4% -- Tracking Error 0.7% -- 0.0% -- Information Ratio 1.8 0.9 -- -- Fundamental: Average Capitalization ($ in Billions) 58.8 -- 61.7 -- Price/Earnings 13.2 16.7 13.9 16.8 Price/Book 1.6 1.9 1.6 1.9 ROE 12.1% 11.2% 11.6% 11.2%
TOP TEN HOLDINGS
($ in Billions* - $ in Millions**)
Portfolio Weight
Market Capitalization*
FY1 P/E
Market Value**
Tencent Holdings Ltd. 1.7% $381.8 31.9 $182.9
Samsung Electronics Co., Ltd. 1.4% 230.5 5.7 158.2
Taiwan Semiconductor Manufacturing Co., Ltd. 1.1% 190.2 16.7 127.1
Roche Holding Ltd. Genusssch 1.1% 212.3 13.8 122.6
Novartis AG 1.1% 217.4 16.4 118.7
Nestle S.A. 1.0% 247.9 20.6 116.0
Alibaba Group Holding Ltd. Sponsored ADR 0.9% 355.3 26.1 100.5
Toshiba Corporation 0.9% 16.6 1.8 96.1
Dai-ichi Life Holdings, Inc. 0.7% 18.8 8.8 74.7
China Construction Bank Co. 0.6% 207.3 5.6 66.2
TOTAL 10.5% $2,078.1
$1,163.1
6
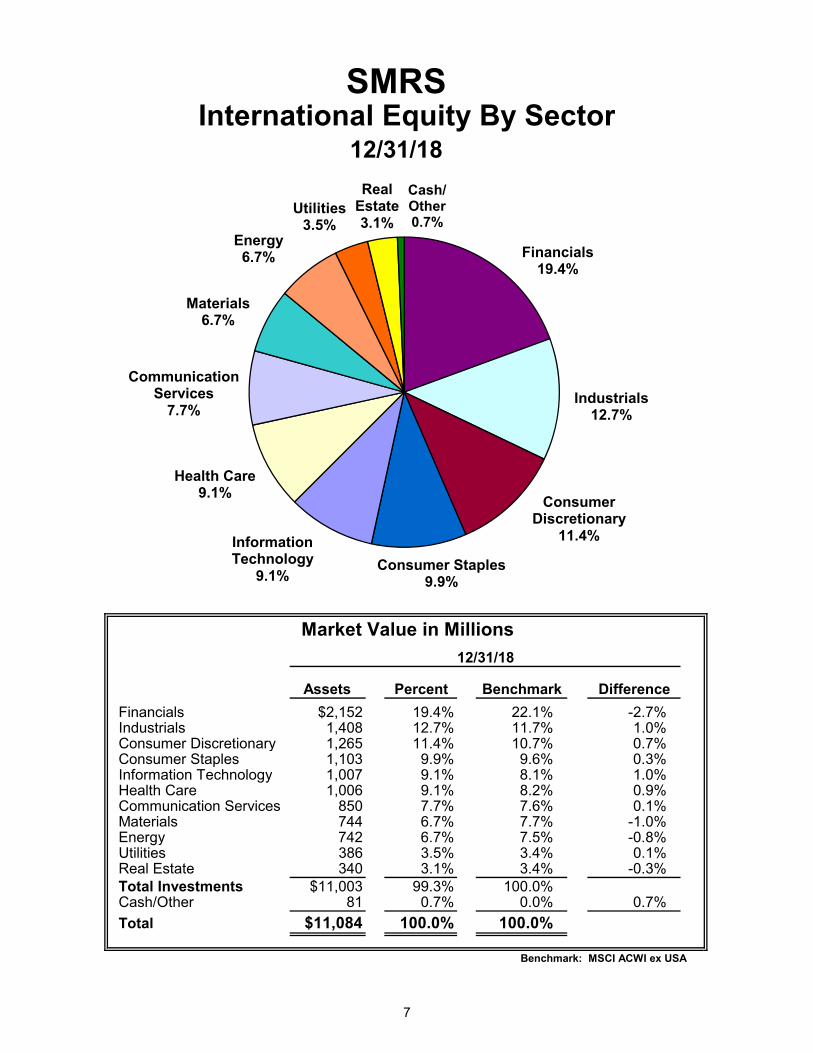
SMRS
12/31/18
Market Value in Millions
Assets Percent Benchmark Difference
Financials $2,152 19.4% 22.1% -2.7%Industrials 1,408 12.7% 11.7% 1.0%Consumer Discretionary 1,265 11.4% 10.7% 0.7%Consumer Staples 1,103 9.9% 9.6% 0.3%Information Technology 1,007 9.1% 8.1% 1.0%Health Care 1,006 9.1% 8.2% 0.9%Communication Services 850 7.7% 7.6% 0.1%Materials 744 6.7% 7.7% -1.0%Energy 742 6.7% 7.5% -0.8%Utilities 386 3.5% 3.4% 0.1%Real Estate 340 3.1% 3.4% -0.3%Total Investments $11,003 99.3% 100.0%Cash/Other 81 0.7% 0.0% 0.7%
Total $11,084 100.0% 100.0%
Benchmark: MSCI ACWI ex USA
International Equity By Sector
12/31/18
Financials19.4%
Industrials12.7%
Consumer Discretionary
11.4%
Consumer Staples9.9%
Information Technology
9.1%
Health Care9.1%
Communication Services
7.7%
Materials6.7%
Energy6.7%
Utilities3.5%
Real Estate3.1%
Cash/ Other0.7%
7

InceptionFund Name Market Value 1-Year 3-Years 5-Years 7-Years Inception Date
Total International Equity $11,084,104,024 -14.4% 4.6% 1.8% 5.9% 5.0% 1/1/04MSCI ACWI ex USA -14.2% 4.5% 0.7% 4.8% 5.2%Lipper International Multi-Cap Core -14.4% 3.0% 0.3% 5.3% 4.7%Excess Return -0.2% 0.1% 1.1% 1.1% -0.3%Pct Rank vs. Lipper International Multi-Cap Core 54 18 14 29 31
Total International Active Strategy $4,043,569,979 -15.5% 3.1% 1.2% 5.8% 4.1% 5/1/05MSCI ACWI ex USA -14.2% 4.5% 0.7% 4.8% 4.5%Lipper International Multi-Cap Core -14.4% 3.0% 0.3% 5.3% 3.9%Excess Return -1.3% -1.4% 0.5% 0.9% -0.4%Pct Rank vs. Lipper International Multi-Cap Core 67 52 21 37 43
LACM World ex USA 853,785,725 -16.8% 1.5% -- -- 1.2% 12/1/15MSCI World ex USA -14.1% 3.1% -- -- 2.4%Lipper International Multi-Cap Core -14.4% -14.4% -- -- 2.3%Excess Return -2.7% -1.6% -- -- -1.2%Pct Rank vs. Lipper International Multi-Cap Core 80 83 -- -- 78
BlackRock MSCI Systematic Return 825,729,125 -- -- -- -- -3.1% 12/1/18MSCI ACWI ex USA -- -- -- -- -4.5%Lipper International Multi-cap Core -- -- -- -- -5.0%Excess Return -- -- -- -- 1.4%Pct Rank vs. Lipper International Multi-Cap Core -- -- -- -- 3
Wellington IRE Fund 629,595,025 -13.5% 3.1% 1.1% 6.3% 3.6% 12/1/05MSCI World ex USA -14.1% 3.1% 0.3% 5.3% 3.3%Lipper International Multi-Cap Core -14.4% 3.0% 0.3% 5.3% 3.1%Excess Return 0.6% -0.1% 0.8% 1.0% 0.3%Pct Rank vs. Lipper International Multi-Cap Core 29 53 21 22 18
LACM Emerging Markets Fund 339,491,753 -16.3% 8.3% 1.3% 2.9% 3.2% 12/1/09MSCI Emerging Markets -14.6% 9.3% 1.7% 3.2% 2.6%Lipper Emerging Markets -15.8% 7.0% 0.3% 2.9% 2.4%Excess Return -1.7% -1.0% -0.5% -0.3% 0.7%Pct Rank vs. Lipper Emerging Markets 55 37 42 56 31
Marathon-London International Fund 267,499,358 -14.0% 2.4% 1.8% -- 6.7% 2/1/12MSCI World ex USA -14.1% 3.1% 0.3% -- 4.5%Lipper International Multi-Cap Core -14.4% 3.0% 0.3% -- 4.4%Excess Return 0.1% -0.7% 1.5% -- 2.1%Pct Rank vs. Lipper International Multi-Cap Core 46 72 14 -- 6
Wellington Emerging Markets Local Equity 257,480,257 -18.8% 7.7% 3.2% 6.1% 5.4% 12/1/11MSCI Emerging Markets -14.6% 9.3% 1.7% 3.2% 3.0%Lipper Emerging Markets -15.8% 7.0% 0.3% 2.9% 2.5%Excess Return -4.2% -1.6% 1.4% 2.9% 2.4%Pct Rank vs. Lipper Emerging Markets 78 46 8 8 8
Effissimo Capital Management Japan 222,424,393 -19.1% 3.0% -- -- 3.0% 12/1/15MSCI Japan -12.9% 3.4% -- -- 3.4%Lipper International Small/Mid-Cap Value -19.5% 3.1% -- -- 2.6%Excess Return -6.2% -0.4% -- -- -0.4%Pct Rank vs. Lipper International Small/Mid-Cap Value 26 63 -- -- 51
SSGA International Alpha Small Cap 218,234,345 -18.6% 1.8% 2.1% 8.6% 2.6% 5/1/07MSCI World ex USA Small Cap -18.1% 3.9% 2.3% 7.4% 2.0%Lipper International Small/Mid-Cap Core -18.6% 2.4% 0.9% 6.0% 1.2%Excess Return -0.5% -2.0% -0.1% 1.2% 0.6%Pct Rank vs. Lipper International Small/Mid-Cap Core 41 67 27 8 1
Lazard/Wilmington International Equity 218,025,000 -13.5% 0.7% -- -- -0.7% 6/1/14MSCI World ex USA -14.1% 3.1% -- -- -0.5%Lipper International Large-Cap Core -14.4% 3.0% -- -- -0.4%Excess Return 0.6% -2.4% -- -- -0.2%Pct Rank vs. Lipper International Large-Cap Core 29 92 -- -- 77
Martin Currie International Long-term Unconstrained 211,301,807 -11.3% -- -- -- 3.9% 2/1/17MSCI ACWI ex USA -14.1% -- -- -- 1.9%Lipper International Multi-Cap Core -14.4% -- -- -- 1.7%Excess Return 2.8% -- -- -- 2.1%Pct Rank vs. Lipper International Multi-Cap Core 15 -- -- -- 7
International Equity Performance - Net of Fees12/31/18
8

InceptionFund Name Market Value 1-Year 3-Years 5-Years 7-Years Inception Date
Total International Stock Plus Strategy $3,867,460,721 -13.6% 5.8% 2.4% 6.7% 6.3% 1/1/09MSCI ACWI ex USA -14.2% 4.5% 0.7% 4.8% 6.6%Lipper International Multi-Cap Core -14.4% 3.0% 0.3% 5.3% 6.3%Excess Return 0.6% 1.4% 1.8% 1.9% -0.3%Pct Rank vs. Lipper International Multi-Cap Core 32 3 9 12 46
Internal Stock Plus 2,310,747,835 -12.4% 4.7% 2.3% 4.7% 4.0% 9/1/11MSCI ACWI ex USA -14.2% 4.5% 0.7% 4.8% 3.5%Lipper International Multi-Cap Core -14.4% 3.0% 0.3% 5.3% 3.9%Excess Return 1.8% 0.2% 1.6% -0.2% 0.5%Pct Rank vs. Lipper International Multi-Cap Core 21 15 8 83 57
PIMCO StockPLUS International TR Fund 1,054,605,425 -15.1% 3.9% 0.4% 6.8% 4.8% 10/1/10MSCI World ex USA -14.1% 3.1% 0.3% 5.3% 3.7%Lipper International Large-Cap Core -14.4% 3.0% 0.3% 5.3% 3.5%Excess Return -1.0% 0.7% 0.1% 1.6% 1.1%Pct Rank vs. Lipper International Large-Cap Core 64 32 61 9 12
PIMCO Emerging Markets StockPLUS AR Fund 502,107,462 -16.0% 10.4% -- -- 1.9% 4/1/15MSCI Emerging Markets -14.6% 9.3% -- -- 2.2%Lipper Emerging Markets -15.8% 7.0% -- -- 1.1%Excess Return -1.5% 1.1% -- -- -0.3%Pct Rank vs. Lipper Emerging Markets 52 13 -- -- 26
Total International Index Strategy $3,173,073,324 -12.0% 5.7% 2.3% 5.7% 6.8% 7/1/09MSCI ACWI ex USA -14.2% 4.5% 0.7% 4.8% 5.5%Lipper International Multi-Cap Core -14.4% 3.0% 0.3% 5.3% 5.6%Excess Return 2.2% 1.2% 1.6% 0.9% 1.3%Pct Rank vs. Lipper International Multi-Cap Core 20 3 9 31 11
SSGA MSCI ACWI ex USA Index 1,994,110,712 -14.0% -- -- -- -9.7% 11/1/17MSCI ACWI ex USA -14.2% -- -- -- -10.0%Lipper International Large-Cap Core -14.4% -- -- -- -10.6%Excess Return 0.2% 0.3%Pct Rank vs. Lipper International Large-Cap Core 43 -- -- -- 25
BlackRock MSCI ACWI ex USA Index 1,178,962,613 -- -- -- -- -14.5% 3/1/18MSCI ACWI ex USA -- -- -- -- -14.7%Lipper International Large-Cap Core -- -- -- -- -14.1%Excess Return -- -- -- -- 0.2%Pct Rank vs. Lipper International Large-Cap Core -- -- -- -- 58
9
State of Michigan Retirement System
REAL ESTATE ANDINFRASTRUCTURE REVIEW State of Michigan Investment Board Meeting
March 7, 2019
Todd A. WarstlerSenior Investment Manager
Real Estate and Infrastructure Division

EXECUTIVE SUMMARY
Performance
MPSERS Plan (12/31/18) 1-Year 3-Years 5-Years 7-Years 10-Years
Annualized Returns 12.2% 10.4% 12.0% 11.5% 5.6%
NCREIF NPI 5.4% 5.8% 7.9% 8.3% 6.1%
Peer Median Returns 8.9% 8.7% 10.5% 10.2% 5.7%
Percentile Rank vs. Peers* 4 29 21 27 51 *State Street Universe greater than $1 billion
Outperformance relative to the one-year benchmark resulted from the Real Estate and Infrastructure Division’s (REID) strategy of being underweight in retail, overweight in hotels, team selectivity within the apartment sector, several favorable sale executions in the real estate portfolio, and appreciation and gains in the infrastructure portfolio.
Strategy Update
The REID is focusing on sourcing off-market opportunities through its extensive network and reducing risk in the portfolio through early income-generating investments including credit strategies that are higher in the capital stack with a shorter projected hold period. The REID has selectively acquired properties where it can add value through management and leasing and has continued to develop properties at attractive risk-adjusted returns. The REID will continue its strategy of assembling portfolios in both traditional and non-traditional real estate sectors that REID believes will become institutional property types, providing above market appreciation and total returns.
The REID has been actively managing the portfolio with dispositions resulting in capital returned in excess of $2.1 billion, and funding new investments of nearly $1.9 billion over the past 12 months. The REID is working with its advisors in executing the disposition of properties and realizing gains from the sale of assets at historically low capitalization rates where these opportunities exist.
The REID has approximately $1.5 billion in unfunded commitments. New commitments during the quarter include:
o $200 million in Blackstone Real Estate Partners IX, LP, a commingled fund
specializing in large, global, opportunistic real estate transactions, managed by Blackstone Real Estate Advisors.
o $200 million in Lone Star Fund XI, LP, a commingled fund specializing in global opportunistic real estate credit strategies, managed by Lone Star.
Market Environment
Fund flows to the real estate sector remain strong, the average allocation to real estate globally is 10%, up significantly from last year (8.9%) and below the average target of 10.4%. Retail properties continue to be less attractive to investors as e-commerce sales continue to grow with investors instead favoring warehouse (as a retail substitute in
1

some cases) and apartments. Senior housing, student housing, data centers and medical office once considered niche are attracting more investor attention. Supply of new buildings in all property types, except retail, has increased in many markets and is beginning to raise concern from investors. However, a strong economy has so far kept demand for space high enough to absorb new supply. Additionally, lenders have become more selective in quality and location of the collateral and have been disciplined in their underwriting standards for construction lending. The cost of new construction in land, labor and materials has steadily increased, making it more difficult for developers to meet return thresholds.
The passage of the U.S. tax reform bill is generally viewed as favorable to the real estate
industry. Economic growth from companies increasing investment in their U.S. business operations would increase demand for office labor and industrial space. Real estate developers will benefit from a lower pass-through tax rate. The increase in the standard deduction could further delay apartment renters from purchasing a home.
Fund flows to the infrastructure sector also remain strong, as investor interest in the asset class continues to grow. Opportunities include North American energy, power generation, European transportation, and emerging market fundamental infrastructure projects. The industry has gained attention from the Federal Administration’s intent on rebuilding U.S. infrastructure; however, details on legal and financial framework of Public Private Partnerships (P3) are limited and will take time to develop. A tight labor market for construction workers and political gridlock in Washington could inhibit timing of funding and completions.
Tightening lending standards combined with heightened bank regulations after the global financial crisis have worked to constrain lending activity in many instances. Demand for private credit from non-traditional capital providers, particularly when a financial sponsor requires speed and certainty of execution is expected to continue to grow. Real estate credit in the U.S., Europe and Asia in various forms should continue to present opportunities.
2

SMRSReal Estate and Infrastructure
12/31/18
Market Value in Millions
12/31/18 12/31/17Apartment $2,747 39.0% $2,302 33.1%Hotel 927 13.2% 936 13.4%Office 857 12.2% 1,131 16.3%Infrastructure 826 11.7% 822 11.8%Industrial 610 8.7% 538 7.7%Retail 346 4.9% 315 4.5%For Rent Homes 315 4.5% 353 5.1%For Sale Homes 249 3.5% 321 4.6%Land 108 1.5% 106 1.5%
$6,985 99.2% $6,824 98.0%Cash/Other 60 0.8% 140 2.0%
Total Investments $7,045 100.0% $6,964 100.0%
Apartment39.0%
Hotel13.2%
Office12.2%
Infrastructure11.7%
Industrial8.7%
Retail4.9%
FR Homes
4.5%
FS Homes
3.5%
Land1.5%
Cash/ Other0.8%
3

Pac
ific
21.1
%
Sou
thw
est
13.4
%
Sou
thea
st
12.7
%
Mid
east
13.3
%
Nor
thea
st
13.5
%E
ast N
. Cen
tral
7.6%
Wes
t N. C
entr
al
1.9%
Mou
ntai
n
9.6%
Inte
rnat
iona
lco
mpr
ises
6.9
%
SM
RS
Rea
l E
stat
e b
y R
egio
nB
ased
on
Mar
ket
Val
ue
(exc
lud
es c
ash
& c
ash
eq
uiv
alen
ts)
12/3
1/18
Geo
grap
hic
regi
ons
defi
ned
by N
CR
EIF
, who
se p
rope
rty
inde
x co
mpo
siti
on is
: Pac
ific
33.
0%, M
ount
ain
6.4%
,W
est N
. Cen
tral
1.2
%, S
outh
wes
t 10.
4%, E
ast N
. Cen
tral
7.3
%, S
outh
east
9.7
%, N
orth
east
20.
4%, M
idea
st 1
1.6%
4

Top TenAdvisors or Entity
Advisor or Entity Market Value
MWT Holdings LLC Clarion Partners Blackstone Group Five Star Realty Partners LLCRialto Capital Management LLCPrincipal Real Estate InvestorsDomain Capital Advisors IncCIM Investment Advisors LLCTranswestern Investment ManagementL&B Realty Advisors
Occupancyby Property Type
Apartment Office Industrial Retail Hotel
SMRS Portfolio 95.6% 86.8% 93.2% 90.7% 74.7%
National Average N/A* 87.4% 93.0% 95.6% 61.9%
*Note: 4Q18 Data not published due to Federal Government shutdown.
12/31/18Real Estate and Infrastructure
SMRS
2,125,983,103$
5,187,215,197$
256,590,994
665,084,656 538,060,255
271,989,670
164,969,786
316,182,901
184,762,083
307,871,264
355,720,485
5

Unfunded Market Value Commitment
801 Grand Avenue Capital, LLC 69,912,156$ 0$ AEW Senior Housing III 2,824,251 1,868,411 Apollo Asia Real Estate Fund 22,545,374 51,116,044 Asana Partners Fund I 20,717,029 6,916,828Avanath Affordable Housing I, LLC 23,900,166 0Avanath Affordable Housing II, LLC 33,491,618 0Avanath II SMRS Co-Investment Fund LLC 15,076,524 0Avanath Affordable Housing III 32,663,628 33,820,867Blackstone R/E IH3 Co-Inv Partners 314,634,650 0Blackstone R/E Partners V, LP 5,882,881 0Blackstone R/E Partners VI, LP 7,761,334 3,680,930Blackstone R/E Partners VIII, LP 57,976,052 28,067,648
* Blackstone R/E Partners IX, LP 0 200,000,000Capri Select Income II 59,874 0Capri Urban Investors, LLC 8,514,703 0CIM Fund III, LP 39,965,807 0CIM Fund VIII, L.P. 101,272,166 16,336,387CIM Urban REIT, LLC 43,067,986 0CIM VI (Urban REIT), LLC 30,451,331 0Clarion Gables Multifamily Trust, LP 30,906,357 0Columbus Circle Holdings, LLC 163,522,140 139,272,720Crown Small Cap Real Estate 16,602,572 8,375,000Domain GVA-1, LLC 39,887,441 2,487,251Domain Hotel Properties, LLC 415,742,465 0Gateway Capital Real Estate Fund II, LP 36,055,707 0Great Lakes Property Group Trust 68,269,447 10,000,000Heitman Credit 50,007,811 0IMRF II CoInvest Spiga LP 13,474,402 4,265,944Invesco Mortgage Recovery Feeder Fund 5,362,102 0Invesco Mortgage Recovery Fund II, L.P. 36,073,034 40,985,873IPF II Co-Invest Cayman LP 27,543,845 2,495,897JBC Funds North LaSalle LLC 19,305,175 0JBC Opportunity Fund III, LP 495,673 0JP Morgan India Property Fund II, LLC 31,472,624 3,576,116KBS/SM Fund III, LP 48,579,637 0KBS/SM Fund IV 317,619 0L-A Saturn Acquisition 31,153,031 0Landmark Real Estate Partners V, LP 9,007,931 0LaSalle Asia Opportunity Fund II, LP 277,310 0LaSalle Asia Opportunity Fund III, LP 1,678,375 0Lion Industrial Trust 211,905,329 0Lion Mexico Fund, LP 6,530,505 0Lombard GVA0016 (former AGL Annuity) 360,153,510 0
SMRS Market Values by Ownership Entity
12/31/18
REAL ESTATE
6
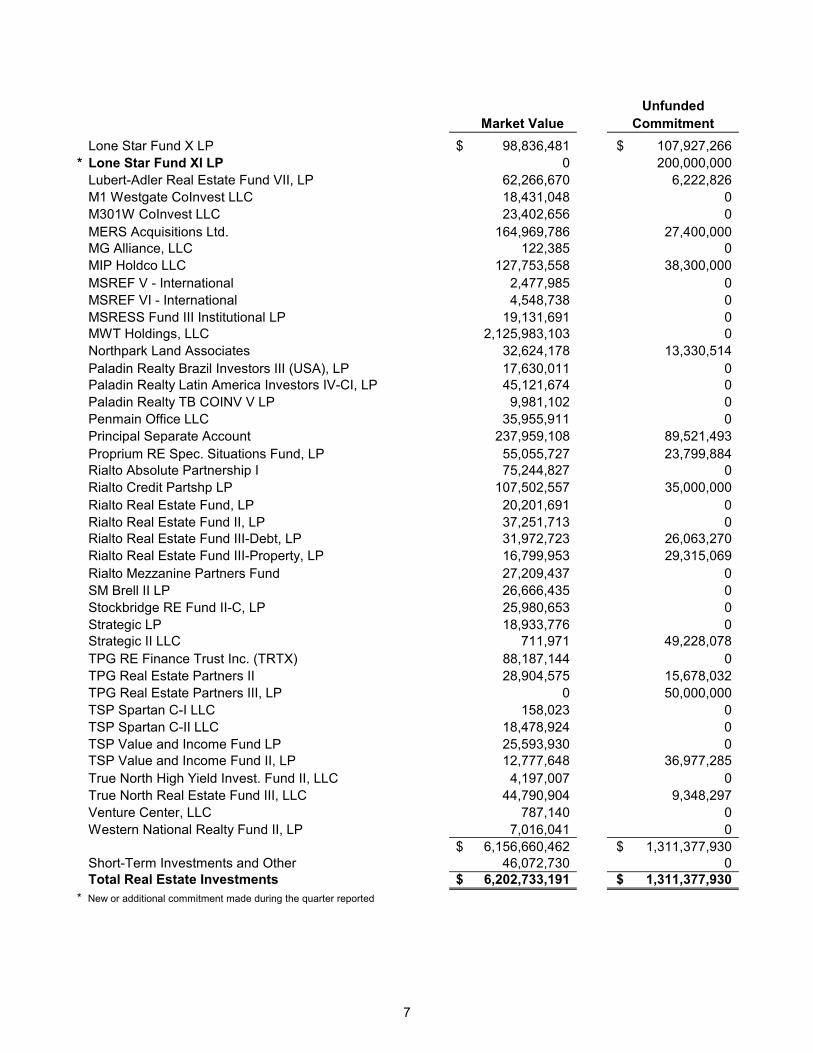
Unfunded Market Value Commitment
Lone Star Fund X LP 98,836,481$ 107,927,266$ * Lone Star Fund XI LP 0 200,000,000
Lubert-Adler Real Estate Fund VII, LP 62,266,670 6,222,826M1 Westgate CoInvest LLC 18,431,048 0M301W CoInvest LLC 23,402,656 0MERS Acquisitions Ltd. 164,969,786 27,400,000MG Alliance, LLC 122,385 0MIP Holdco LLC 127,753,558 38,300,000MSREF V - International 2,477,985 0MSREF VI - International 4,548,738 0MSRESS Fund III Institutional LP 19,131,691 0MWT Holdings, LLC 2,125,983,103 0Northpark Land Associates 32,624,178 13,330,514Paladin Realty Brazil Investors III (USA), LP 17,630,011 0Paladin Realty Latin America Investors IV-CI, LP 45,121,674 0Paladin Realty TB COINV V LP 9,981,102 0Penmain Office LLC 35,955,911 0Principal Separate Account 237,959,108 89,521,493Proprium RE Spec. Situations Fund, LP 55,055,727 23,799,884Rialto Absolute Partnership I 75,244,827 0Rialto Credit Partshp LP 107,502,557 35,000,000Rialto Real Estate Fund, LP 20,201,691 0Rialto Real Estate Fund II, LP 37,251,713 0Rialto Real Estate Fund III-Debt, LP 31,972,723 26,063,270Rialto Real Estate Fund III-Property, LP 16,799,953 29,315,069Rialto Mezzanine Partners Fund 27,209,437 0SM Brell II LP 26,666,435 0Stockbridge RE Fund II-C, LP 25,980,653 0Strategic LP 18,933,776 0Strategic II LLC 711,971 49,228,078TPG RE Finance Trust Inc. (TRTX) 88,187,144 0TPG Real Estate Partners II 28,904,575 15,678,032TPG Real Estate Partners III, LP 0 50,000,000TSP Spartan C-I LLC 158,023 0TSP Spartan C-II LLC 18,478,924 0TSP Value and Income Fund LP 25,593,930 0TSP Value and Income Fund II, LP 12,777,648 36,977,285True North High Yield Invest. Fund II, LLC 4,197,007 0True North Real Estate Fund III, LLC 44,790,904 9,348,297Venture Center, LLC 787,140 0Western National Realty Fund II, LP 7,016,041 0
6,156,660,462$ 1,311,377,930$ Short-Term Investments and Other 46,072,730 0Total Real Estate Investments 6,202,733,191$ 1,311,377,930$
* New or additional commitment made during the quarter reported
7

Unfunded
Market Value CommitmentArclight Energy Partners VI, LP 45,116,960$ 9,081,559$ ASF VI Infrastructure B LP 19,097,962 14,864,229ASF VII Infrastructure Fund B L.P. 3,031,690 27,892,271 ASF Como Co-Investment LP 6,953,500 3,004,353 Basalt Infrastructure Partners, LP (Balfour Beatty) 46,954,403 2,219,045 Blackstone Energy Partners, LP 53,393,225 4,702,610 Blackstone Energy Partners II, LP 68,152,775 30,275,244 Brookfield Infrastructure Fund II-B, L.P. 53,070,559 5,036,523Customized Infrastructure Strategies, LP 45,184,246 5,661,912 Dalmore Capital Fund 64,366,859 0GCM Grosvenor Infrastructure Investment Program, L.P. (CSG) 77,017,048 0GCM Grosvenor Customized Infrastructure Strategies II, L.P. 36,042,469 19,238,579Global E&P Infrastructure Fund II L.P. (formerly First Reserve) 51,671,170 17,588,817 GSO Energy Select Opportunities Fund LP 30,259,338 25,684,982 JPMorgan AIRRO India SideCar Fund US, LLC 78,978,353 3,187,421 JPMorgan Asian Infra. & Rel. Res. Opp Fund II 10,794,994 7,440,094 KKR Eagle CoInvest L.P. 35,913,836 1,853,268 KKR Global Infrastructure Investors, LP 38,778,953 4,182,224 Ridgewood Water & Strategic Infrastructure Fund LP 4,767,046 45,200,000 RPEP SMRS Infra II, LLC 2,250,565 500,000StonePeak Infrastructure Fund LP 54,218,653 11,387,841
826,014,603$ 239,000,972$ Short-Term Investments and Other 16,264,971 0Total Infrastructure Investments 842,279,574$ 239,000,972$
TOTAL INVESTMENTS 7,045,012,765$ 1,550,378,902$
Market Values by Ownership Entity12/31/18
INFRASTRUCTURE
SMRS
8

State of Michigan Retirement System
BASKET CLAUSE REVIEW State of Michigan Investment Board Meeting
March 7, 2019
Karen M. Stout, CPA, CGFM Administrator
Trust Accounting Division

Asset Class
Total Absolute Return
Total Real Return and Opportunistic
Total International Equity
Total Fixed Income
Total Basket Clause Investments
The Public Employees Retirement System Investment Act, 1965, PA 314, MCL38.1132 et seq , authorizes the State Treasurer to invest up to 30% of the system'sassets in investments "not otherwise qualified under the act." MCL 38.1140d (1).Commonly referred to as Section 20d (after the authorizing section of PA 314) orBasket Clause investments, this provision gives the State Treasurer the flexibility totake advantage of market opportunites not specifically aurhorized in PA 314 whileconserving protections against imprudent investment.
SMRSBasket Clause Investments
12/31/18
Value
4,211,987,530$
951,755,573
222,424,394
56,081,035
5,442,248,532$
The basket clause investments at December 31, 2018, were $5.4 billion or 7.8% ofthe total portfolio value of $69.5 billion.

Disclaimer
This presentation was given solely for the purpose
of explaining the structure, investment process,
and returns for the State of Michigan Retirement
System. It should not be interpreted in any way as
financial advice.


![Outcome of Board Meeting [Board Meeting]](https://static.fdocuments.us/doc/165x107/577c87971a28abe054c4a936/outcome-of-board-meeting-board-meeting.jpg)

