Statement on Monetary Policy - Reserve Bank of … on Monetary Policy ... spare capacity in the...
64
Statement on Monetary Policy MAY 2017
Transcript of Statement on Monetary Policy - Reserve Bank of … on Monetary Policy ... spare capacity in the...

Statement on Monetary
Policy
MAY 2017

Contents
Overview 1
1. International Economic Developments 5
2. International and Foreign Exchange Markets 13 Box A: Australia’s Real Exchange Rate 25
3. Domestic Economic Conditions 29
4. Domestic Financial Markets 39
5. Inflation 49
6. Economic Outlook 53
Statement on Monetary Policy
MAY 2017

The material in this Statement on Monetary Policy was finalised on 4 May 2017. The next Statement is due for release on 4 August 2017.
The Statement is published quarterly in February, May, August and November each year. All the Statements are available at www.rba.gov.au when released. Expected release dates are advised ahead of time on the website. For copyright and disclaimer notices relating to data in the Statement, see the Bank’s website.
The graphs in this publication were generated using Mathematica.
Statement on Monetary Policy enquiries
Secretary’s DepartmentTel: +61 2 9551 8111Fax: +61 2 9551 8033Email: [email protected]
ISSN 1448–5133 (Print) ISSN 1448–5141 (Online)

S TAT E M E N T O N M O N E TA R Y P O L I C Y | M AY 2017 1
The Bank has been expecting for some time that inflation will increase gradually over the period ahead, to be above 2 per cent. Recent data have been consistent with this expectation. Headline inflation in the March quarter was a little above 2 per cent and is now expected to be between 2 and 3 per cent throughout the forecast period. Underlying inflation increased in the March quarter, to around 1¾ per cent. It is expected to increase further, to be around 2 per cent in early 2018. These forecasts are little changed from the previous Statement on Monetary Policy.
A number of other factors have afforded increased confidence in the central forecast that inflation will increase gradually. The December quarter national accounts confirmed that the period of weakness in the middle of 2016 was only temporary. The stronger near-term global outlook now seems fairly well in train and the terms of trade have held up for a bit longer than earlier expected, which will provide a boost to national incomes.
The expected increase in underlying inflation over the next year or two is still quite gradual, because a number of forces are continuing to hold inflation down. In particular, wage growth is low. Although it seems unlikely that wage growth will slow much further, wage pressures are expected to pick up only gradually, as the effects of structural adjustment after the mining investment boom – which have weighed on wage growth – continue to wane. The forecast for the unemployment rate implies ongoing spare capacity in the labour market; this is likely to constrain wage outcomes in the period ahead.
Overview
In addition, wage outcomes have been weaker than would be suggested by a straightforward assessment of spare capacity based on the unemployment rate. The underemployment rate has been higher than its past relationship with the unemployment rate would imply, and might be exerting further downward pressure on wage growth.
Other forces on inflation are working in opposing directions. Heightened competitive pressures in the retail sector appear to have been keeping retail inflation low. Growth in rents is around its lowest rate in over 20 years. The appreciation of the exchange rate over the past year is also likely to have added some downward pressure on prices recently, though this follows a larger depreciation over the previous couple of years. Against this, the cost of new dwelling construction, which is a large component of the consumer price index, picked up noticeably in the March quarter, as did tobacco and utilities prices. Tobacco and utilities price inflation are expected to remain high in the period ahead.
The forecasts for the Australian economy have not substantively changed since the previous Statement, but the recent run of both domestic and international data has provided some assurance about the domestic outlook. The Australian economy grew by 2½ per cent over 2016; growth is expected to pick up to 2¾−3¾ per cent by early 2018. The period of adjustment that has followed the end of the mining investment boom now appears to be well advanced. The drag from the fall in mining investment, and the negative spillover effects on non-mining

R E S E R V E B A N K O F AU S T R A L I A2
investment and other aspects of non-mining activity, continues to ease. Consistent with this, further signs are emerging that the slowdowns in the Queensland and Western Australian economies are coming to an end.
The expansion in liquefied natural gas (LNG) exports is expected to contribute about ½ percentage point to growth in each of 2017 and 2018. As has been noted previously, LNG production requires little employment, which means that spare capacity in the labour market will be absorbed more slowly than the forecast for GDP growth would typically imply.
Consumption growth picked up a little late last year. Given low wage growth, household income growth is likely to remain quite weak, though not as weak as the December quarter national accounts data would suggest. This makes it hard to be certain about the future pace of consumption growth, particularly in the context of ongoing high levels of household debt. Recent indicators suggest that consumption growth might have eased again in the March quarter, but the expectation is that consumption growth will broadly track income growth in the period ahead.
It is difficult to know if and when a stronger and durable recovery in non-mining business investment might take hold. Non-mining business investment has shown some signs of recovery in New South Wales and Victoria but has been relatively weak in Queensland and Western Australia. Some forward-looking indicators suggest non-mining business investment is unlikely to pick up substantially in the near term, though these indicators do not capture all industries. The level of residential investment is likely to remain high, because of low interest rates and the large pipeline of construction projects to be worked off. However, it will contribute less to growth in the period ahead than it did in the recent past.
Conditions in the established housing market have been mixed. Housing price inflation and other indicators have remained strong in Sydney and Melbourne, but weak in Perth. Increases in apartment supply in Brisbane, and to a lesser extent in Melbourne, have led to noticeable differences in the growth rates of apartment prices and prices of detached houses in those cities. Greater supply has also weighed on rental growth in these cities; falling rents in Perth instead reflect weaker economic conditions and slower population growth.
The Board has continued to monitor risks posed to household balance sheets, given the context of high and rising household debt. In the past couple of months, both the Australian Prudential Regulation Authority and the Australian Securities and Investments Commission have announced further measures to reinforce sound lending practices that are appropriate to borrowers’ circumstances. These measures can be expected to mitigate risks that have been building in household balance sheets. Along with the recent increases in interest rates for some types of housing loans, including those announced in March and April, these measures are likely to lead to some slowing in housing credit growth. Increases in interest rates late last year that were focused on investor lending are likely to have dampened demand for credit, after growth in investor credit picked up in the second half of 2016. Housing credit growth overall has been relatively steady over the past few months.
The Board has also been monitoring the labour market closely. Although the unemployment rate increased in the past couple of months, a gradual decline from here remains the most likely outcome. Employment growth strengthened a little in recent months; this is consistent with the signal from forward-looking indicators, which have been pointing to moderate employment growth for a while.

S TAT E M E N T O N M O N E TA R Y P O L I C Y | M AY 2017 3
There have been some minor changes in the near-term outlook for GDP growth to account for the effects of Cyclone Debbie. Coking coal exports are expected to be lower, while coking coal prices will be temporarily higher. Beyond the next couple of quarters, prices of bulk commodities are expected to decline, unwinding much of the recent increase in the terms of trade; prices are nonetheless expected to remain above the lows of early 2016. Consistent with previous forecasts, iron ore prices have already fallen significantly in the past few weeks. At this stage, higher commodity prices are not expected to add materially to domestic demand, given their temporary nature and because some of the income accrues to foreign shareholders. But if commodity prices do not fall as far as currently anticipated, the impact on growth and employment could be greater than currently assumed in the forecasts.
Strong Chinese demand for steel has helped support iron ore and coal prices, although the sustainability of this demand is uncertain. Conditions in China improved during 2016, largely because of domestic factors; economic growth in China appears to have retained its momentum in early 2017. Property construction and government spending on infrastructure have been significant drivers of growth; how conditions in the property market evolve will help determine how much of this momentum will be sustained. The Chinese authorities continue to use a range of policies to achieve their economic targets. While financial conditions remain accommodative, they have tightened slightly, consistent with actions by the authorities to address high and rising leverage. It remains to be seen how the authorities will balance their objectives for economic growth and financial stability.
More broadly, the outlook for major trading partner growth was revised up late last year, and recent data have generally confirmed the stronger
outlook. The improvement appears to have begun in the second half of 2016; it was first evident in commodity prices and various measures of business and consumer confidence but subsequently became apparent in a broad-based pick-up in global merchandise trade late last year, as well as industrial production. More recently, there have been signs of stronger business investment in a selection of countries. The pick-up in global trade has been particularly important for the more trade-dependent economies in the Asian region. Outside Australia’s major trading partners, the growth outlook for some larger emerging economies has recovered somewhat after a period of declining output.
The major advanced economies are all expanding at rates that are fast enough to continue absorbing spare capacity. Unemployment rates have declined and in the United States, Japan and Germany they have reached low levels. Although weak growth in consumption detracted from growth in the United States in the March quarter, business investment appears to be picking up. The US administration is yet to announce detailed tax reform proposals, but any fiscal stimulus will add to demand; given that the economy is already close to full employment, this would add to inflationary pressures. Growth is also expected to continue to exceed potential growth rates in the euro area and Japan in 2017. Core inflation in the major advanced economies generally remains low, however, and headline inflation rates are starting to decline, as the earlier effects of higher oil prices diminish. Nonetheless, underlying inflationary pressures should pick up gradually over coming quarters as spare capacity continues to decline.
International financial markets have been relatively quiet in recent months. The main source of volatility has been market reactions to various political risks and events, and even these

R E S E R V E B A N K O F AU S T R A L I A4
reactions have been relatively small. Volatility and bond spreads in some euro area markets have fallen back since the first round of the French presidential election. Funding conditions globally remain very accommodative. Consistent with the generally stronger tone in economic indicators and the inflation outlook in some economies, market participants are pricing in further tightening in monetary policy in the United States and are also no longer expecting further monetary easing in other major advanced economies. Developments in domestic financial markets have broadly mirrored those in markets overseas. Domestic funding conditions remain accommodative.
Overall, developments over the past three months have tended to be consistent with the forecasts published in the previous Statement, in which inflation and output growth were both expected to increase gradually. Taking account of the available information and having eased monetary policy in 2016, the Board has judged that holding the stance of policy unchanged at recent meetings would be consistent with sustainable growth in the economy and achieving the medium-term inflation target. R

S TAT E M E N T O N M O N E TA R Y P O L I C Y | M AY 2017 5
1. International Economic Developments
Global economic conditions have picked up since the middle of 2016 and appear to be stronger in early 2017 than they have been in recent years (Graph 1.1). Major trading partner growth is forecast to be around its long-run average this year before easing slightly in 2018.
The strengthening in economic activity has been broad based. Economic growth in China has retained its earlier momentum in 2017, supported by accommodative financial conditions and fiscal policy. Growth in the major advanced economies picked up throughout 2016, to be around or above their potential growth rates; accommodative monetary policies and less contractionary fiscal policies should support growth being above potential in these economies over the period ahead. Growth in east Asia increased in late 2016 supported by stronger conditions in China and the major advanced economies, and the associated increase in global trade.
Global Economic Activity*MTP GDP growthMTP GDP growth
20122007 2017
0
4
8
%
0
4
8
%
Year-ended
Quarterly
Sentiment**
-2
0
2
%
Consumer
Business
Industrial production growth
20122007 2017-20
-10
0
10
%
Year-ended
PMI
20122007 201730
40
50
60
index
Manufacturing
Services
* Major trading partners (MTP) GDP is export-weighted; sentiment isPPP GDP-weighted; industrial production is weighted by world IPshares at market exchange rates
** Deviation from post-2005 averageSources: ABS; Bloomberg; CEIC Data; IMF; Markit Economics; OECD;
RBA; Thomson Reuters
Graph 1.1Merchandise Trade Volumes*
Contributions to quarterly-average year-ended growth
2014201120082005 2017
-10
0
10
ppt
-10
0
10
pptImports
2014201120082005 2017-20
-10
0
10
ppt
-20
-10
0
10
pptExports
Advanced economies China Other Asia** Other* March quarter 2017 is an estimate** Excludes Japan and ChinaSources: CBP Netherlands; CEIC Data; RBA
Graph 1.2
Consumer sentiment and survey measures of business conditions have both increased sharply since late 2016. Growth in industrial production has also edged higher, especially in Asia. Consumption growth in Australia’s major trading partners has been relatively stable and investment growth has picked up in some economies.
Merchandise trade growth has increased further in 2017. The pick-up in both exports and imports has been broad based (Graph 1.2). China has been an important source of increased demand, while imports by commodity-exporting emerging economies have stabilised recently after having declined for several years. This expansion in global trade could be derailed, however, if protectionist policies are introduced.
Headline inflation in the advanced economies rose sharply in late 2016 and early 2017,
R E S E R V E B A N K O F AU S T R A L I A6
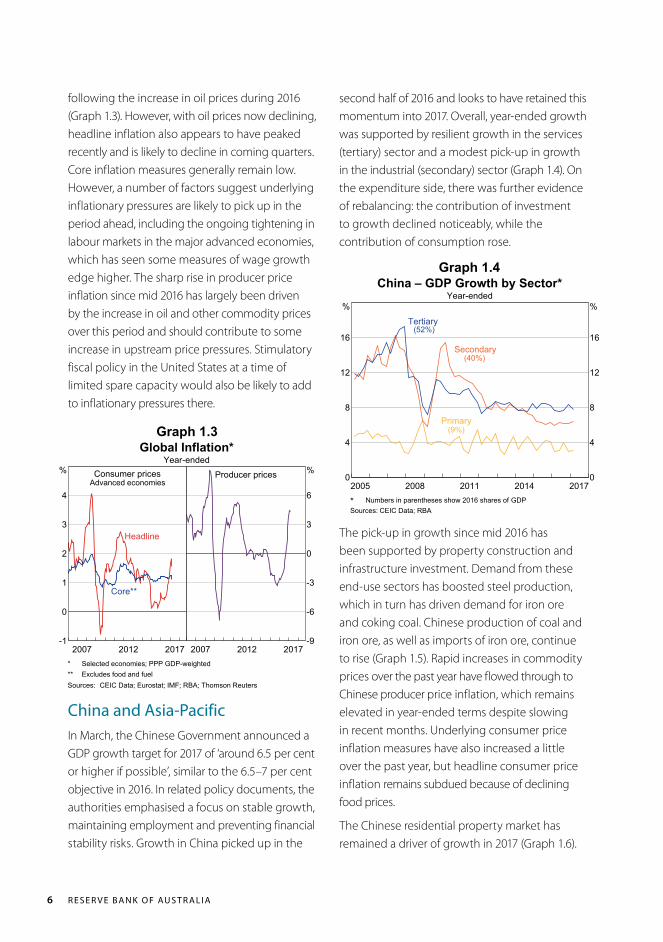
following the increase in oil prices during 2016 (Graph 1.3). However, with oil prices now declining, headline inflation also appears to have peaked recently and is likely to decline in coming quarters. Core inflation measures generally remain low. However, a number of factors suggest underlying inflationary pressures are likely to pick up in the period ahead, including the ongoing tightening in labour markets in the major advanced economies, which has seen some measures of wage growth edge higher. The sharp rise in producer price inflation since mid 2016 has largely been driven by the increase in oil and other commodity prices over this period and should contribute to some increase in upstream price pressures. Stimulatory fiscal policy in the United States at a time of limited spare capacity would also be likely to add to inflationary pressures there.
second half of 2016 and looks to have retained this momentum into 2017. Overall, year-ended growth was supported by resilient growth in the services (tertiary) sector and a modest pick-up in growth in the industrial (secondary) sector (Graph 1.4). On the expenditure side, there was further evidence of rebalancing: the contribution of investment to growth declined noticeably, while the contribution of consumption rose.
2014201120082005 20170
4
8
12
16
%
0
4
8
12
16
%
China – GDP Growth by Sector*Year-ended
Primary(9%)
Secondary
Tertiary(52%)
(40%)
* Numbers in parentheses show 2016 shares of GDPSources: CEIC Data; RBA
Global Inflation*Year-ended
Consumer pricesAdvanced economies
20122007 2017-1
0
1
2
3
4
%
Core**
Headline
Producer prices
20122007 2017-9
-6
-3
0
3
6
%
* Selected economies; PPP GDP-weighted** Excludes food and fuelSources: CEIC Data; Eurostat; IMF; RBA; Thomson Reuters
Graph 1.3
Graph 1.4
The pick-up in growth since mid 2016 has been supported by property construction and infrastructure investment. Demand from these end-use sectors has boosted steel production, which in turn has driven demand for iron ore and coking coal. Chinese production of coal and iron ore, as well as imports of iron ore, continue to rise (Graph 1.5). Rapid increases in commodity prices over the past year have flowed through to Chinese producer price inflation, which remains elevated in year-ended terms despite slowing in recent months. Underlying consumer price inflation measures have also increased a little over the past year, but headline consumer price inflation remains subdued because of declining food prices.
The Chinese residential property market has remained a driver of growth in 2017 (Graph 1.6).
China and Asia-PacificIn March, the Chinese Government announced a GDP growth target for 2017 of ‘around 6.5 per cent or higher if possible’, similar to the 6.5–7 per cent objective in 2016. In related policy documents, the authorities emphasised a focus on stable growth, maintaining employment and preventing financial stability risks. Growth in China picked up in the

S TAT E M E N T O N M O N E TA R Y P O L I C Y | M AY 2017 7
China – Residential Property IndicatorsNew property pricesSix-month-ended growth
0
10
20
%
Tightening cities
Investment*Year-ended growth
0
20
40
%
Floor space sold*Year-ended growth
20142011 2017-50
0
50
100
%
Non-tightening cities
InventoryYear-ended growth
20142011 2017-25
0
25
50
%
* SmoothedSources: CEIC Data; CRIC; RBA
China – Iron Ore and CoalProduction
20122007 20170
80
160
240
320
Mt
Coal
Imports
20122007 20170
20
40
60
80
Mt
Iron ore
Sources: CEIC Data; RBA; WIND Information
Graph 1.5
Graph 1.6
Financial conditions in China remain accommodative. Total social financing (TSF) continues to grow at a rapid pace, despite some easing recently. Growth in bank lending to households (mainly mortgages) has increased further, while growth in corporate credit has fallen (Graph 1.7). A target of 12 per cent for TSF growth in 2017 has been announced, which is slightly below the target of 13 per cent growth for 2016.
Business creditHousehold creditOff-balance sheet financingNon-intermediated financingDebt swap adjustment**
2015201320112009 20170
10
20
30
ppt
0
10
20
30
ppt
China – Total Social Financing*Contribution to year-ended growth
* Seasonally adjusted by RBA** Upper bound estimate of year-ended growth adjusting for the impactof local government bond issuance to pay off debt previously includedin TSF
Sources: CEIC Data; RBA
Graph 1.7
In November 2016, the Indian Government replaced its two highest-denomination banknotes in an effort to combat counterfeiting and the use of ‘black money’. The demonetisation scheme caused some temporary cash shortages and was widely expected to detract from growth in the December quarter. However, the impact was lower than anticipated (Graph 1.8). Falling food prices have weighed on consumer price inflation since mid 2016, which remains below the Reserve Bank of India’s medium-term inflation target of 4 per cent.
The pick-up in global trade since late 2016 has supported stronger growth in the east Asia region, particularly in the more trade-dependent high-income economies; consistent with this,
Following rapid increases in property prices in 2016, more cities have introduced tightening measures (such as restrictions on purchase and reduced loan-to-value ratios) and others have tightened existing policies further to dampen speculative activity and slow growth in property prices. While price growth had been slowing sharply in cities with tightening measures, there was a broad-based rise in property price growth in March. The area of floor space sold has remained at a high level in recent months and inventory levels have declined further. This has reduced inventory-to-sales ratios in most regions, which could provide scope for further residential construction.

R E S E R V E B A N K O F AU S T R A L I A8
New Zealand – Economic IndicatorsYear-ended
GDP growth
20122007 2017-3
0
3
% Inflation and wage growth
20122007 20170
2
4
%
Trimmed meaninflation
Wage growth
Sources: RBA; Thomson Reuters
industrial production has increased noticeably in these economies since late 2016. While the increase in the region’s exports has been broad based by destination, it has been especially pronounced in exports to China (Graph 1.9). This increase in activity brings growth in the high-income east Asian economies to around estimates of potential, following below-trend growth over recent years. Growth in domestic final demand has improved recently, as a result of higher investment, although consumption growth remains weak and employment growth has slowed. In the middle-income east Asian economies, growth has been stable over recent years, supported by resilient domestic demand. Monetary and fiscal policies across the region remain accommodative, which is also expected to continue to support economic activity.
The New Zealand economy grew at an above-average pace in 2016, driven by record-high immigration and accommodative monetary policy (Graph 1.10). Growth slowed in the second half of 2016 because of a temporary fall in exports following adverse weather conditions and an easing in growth in residential investment. Employment growth remains strong and the unemployment rate is low. Despite this, the
Graph 1.8
Graph 1.10
East Asia – Economic IndicatorsYear-ended growth
GDP*
0
6
%
High-income**
Industrial productionSmoothed
0
25
%
Middle-income***Merchandise exports****Merchandise exports****
20122007 2017-25
0
25
%
-25
0
25
%
Other
China
Total
EmploymentSmoothed
20122007 2017-2
0
2
%
* Estimate for March quarter 2017** Hong Kong, Singapore, South Korea and Taiwan*** Indonesia, Malaysia, Philippines and Thailand**** Values; excludes intraregional trade; estimate for March quarter 2017Sources: CEIC Data; IMF; RBA; UN
Graph 1.9India – GDP Growth and Inflation
Year-endedGDP growth*GDP growth*
20122007 2017-4
0
4
8
12
%
-4
0
4
8
12
%
Quarterly
Inflation
20122007 2017-5
0
5
10
15
%
* Seasonally adjusted by RBASources: CEIC Data; RBA
additional labour supply from rising participation and record-high net immigration are keeping wage pressures contained. Inflation has been increasing since early 2016, reflecting higher oil prices and capacity pressures in some parts of the economy and it returned to the Reserve Bank of New Zealand’s target band in late 2016.
Major Advanced EconomiesGDP growth in the major advanced economies has been at or above estimates of potential

S TAT E M E N T O N M O N E TA R Y P O L I C Y | M AY 2017 9
Major Advanced Economies –GDP and Components
Year-ended growthGDP
-5
0
5
%
Euro area*
Private consumption
-4
0
4
%
Business investment
20132009 2017-20
-10
0
10
%
US
Residential investment
20132009 2017-30
-15
0
15
%
Japan
* For euro area, business investment is public and privatenon-residential investment; data exclude Ireland due to measurementissues
Sources: RBA; Thomson Reuters
Graph 1.11
Surveyed business confidence and conditions have been very strong in recent months in the major advanced economies and business investment is showing signs of recovery, following several years of weak growth (Graph 1.12). In the March quarter, US business investment increased strongly, with much of this increase concentrated in the energy sector. US corporate investment intentions have increased since late 2016, which has been largely attributed to an expectation of tax reforms and a roll-back of regulations, as well as the expected recovery in the energy sector. In the euro area, business investment has grown a little since early 2015, driven by growth in machinery and equipment investment. While this marks the first period of sustained growth since the global financial crisis, both residential and business investment remain well below pre-crisis levels and muted investment intentions suggest investment will continue to grow only modestly. Japanese business investment is only a touch above its pre-crisis level. The Japanese economy has been supported by the increase in global trade, and has recorded its largest merchandise trade surplus in seven years.
Major Advanced Economies – CapexIntentions and Business Investment*United StatesUnited States
2007 2017-8
-6
-4
-2
0
2
4
%
-8
-6
-4
-2
0
2
4
%
Investmentintentions
Euro areaEuro area
2007 2017-8
-6
-4
-2
0
2
4
%
-8
-6
-4
-2
0
2
4
% JapanJapan
2007 2017-8
-6
-4
-2
0
2
4
%
-8
-6
-4
-2
0
2
4
%
Businessinvestment**
* Investment intentions mapped to national accounts investment growth** Quarterly growth; euro area excludes Ireland due to measurement
issues; smoothed for JapanSources: RBA; Thomson Reuters
Graph 1.12
growth over recent years, supported by accommodative monetary policy and, more recently, less contractionary fiscal policies (Graph 1.11). That said, potential growth rates across most advanced economies have declined relative to previous decades because of population ageing, lower productivity growth and slower capital accumulation. During 2016 there was a further gradual absorption of spare capacity; as a result, the United States, Japan and some euro area countries are now around estimates of full employment.
Private consumption has been a key driver of growth in the United States and the euro area over recent years, despite temporary weakness in US consumption growth in the March quarter. Consumption growth has been supported by robust employment growth, low borrowing costs, recovering housing prices and above-average consumer confidence. In Japan, private consumption growth has been generally subdued. Consumer confidence has increased in all three economies in recent months, to be above average. Residential investment growth has also picked up across the major advanced economies.

R E S E R V E B A N K O F AU S T R A L I A1 0
Major Advanced Economies – Credit GrowthYear-ended
United States
2009 2017-10
-5
0
5
10
15
%
Business*
Euro area**
2009 2017
Japan
2009 2017-10
-5
0
5
10
15
%
Household
* Private non-financial corporations** Adjusted for loan sales and securitisationSources: ECB; RBA; Thomson Reuters
Household and business sector credit growth has generally increased in the major advanced economies in recent years, consistent with the increasing durability of the recovery (Graph 1.13). In 2016, credit to euro area non-financial corporations saw its first full year of growth since the height of the euro area sovereign debt crisis. Japanese household credit has grown at its fastest pace in around two decades.
Graph 1.13
Major Advanced Economies –Labour Markets
Employment growthYear-ended
-3
0
3
%
Euro area
US
Unemployment rate
4
8
12
%
Wage growth*Year-ended
20132009 2017-2
0
2
4
%
Japan**
Unit labour costsYear-ended growth, smoothed
20132009 2017-10
-5
0
5
%
* Average hourly earnings for the US; compensation per employee forthe euro area; full-time base wages for Japan** Smoothed for employment growth and wage growth
Sources: ECB; Eurostat; RBA; Thomson Reuters
Graph 1.14
been more gradual, but unemployment has still declined to its lowest rate in nearly eight years.
As discussed above, headline inflation in the United States and the euro area and, to a lesser extent, Japan, increased in late 2016 reflecting higher oil prices, though with oil prices now declining, the effect on headline inflation is starting to dissipate (Graph 1.15). Core inflation has remained low, particularly in the euro area and Japan; idiosyncratic factors appear to have contributed to some volatility in the latest figures. Market-based measures of inflation expectations rebounded in the United States and the euro area in 2016, reflecting the rise in oil prices and prospects of stimulatory fiscal policy in the United States. Economists’ longer-term measures of inflation expectations have been more stable at levels close to each central bank’s inflation target, suggesting they are relatively well anchored. In Japan, inflation expectations remain low; short-term expectations are around levels that prevailed before the Bank of Japan started its quantitative easing and announced its inflation target in 2013, although long-term market expectations have moved a little higher since late 2016.
Labour markets in the major advanced economies continue to improve; employment growth has been robust and there have been some increases in labour force participation (Graph 1.14). There has been some moderate pick-up in wage growth in the United States and Japan; this includes part-time wages in Japan, where tighter labour market conditions are likely to manifest first given the greater flexibility of that sector. Survey data in the United States and recent negotiations between labour unions and large employers in Japan suggest that wage growth is not expected to increase much further over the coming year. Unit labour costs, on the other hand, have grown at above-average rates in the United States and Japan in line with low productivity growth. The improvement in the euro area labour market has
S TAT E M E N T O N M O N E TA R Y P O L I C Y | M AY 2017 1 1
Major Advanced Economies –Inflation and Long-run Expectations
Year-endedHeadline inflation*
0
3
%
Euro area
Core inflation*
0
3
%
US**
Consensus expectations***
20122007 2017-2
0
2
%
Japan
Market expectations****
20122007 2017-2
0
2
%
* PCE inflation for the US; CPI for the euro area and Japan; Japan dataexclude the effects of the consumption tax increase in April 2014
** US expectations adjusted to reference PCE inflation*** Euro area series is from the Survey of Professional Forecasters**** Monthly average of inflation expectations from five and ten-year
inflation swaps; latest observation is an average of the month to dateSources: Bloomberg; Consensus Economics; ECB; RBA; Thomson Reuters
Graph 1.15
In the United Kingdom, growth since the mid-2016 vote to leave the European Union has been more resilient than expected. While investment growth has slowed somewhat, consumption growth has picked up and net exports have made a strong positive contribution. Surveyed business conditions and consumer confidence are at or above average, suggesting continued moderate growth. The sharp depreciation of the sterling
has put upward pressure on inflation and is expected to continue to do so for a while. Formal negotiations on the terms of the withdrawal from the European Union began in late March.
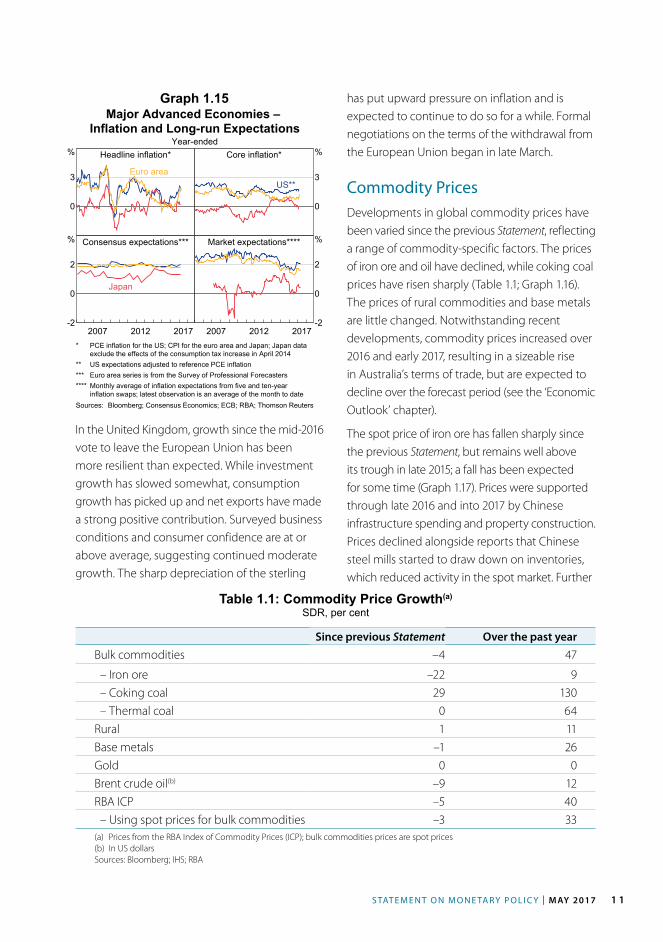
Commodity PricesDevelopments in global commodity prices have been varied since the previous Statement, reflecting a range of commodity-specific factors. The prices of iron ore and oil have declined, while coking coal prices have risen sharply (Table 1.1; Graph 1.16). The prices of rural commodities and base metals are little changed. Notwithstanding recent developments, commodity prices increased over 2016 and early 2017, resulting in a sizeable rise in Australia’s terms of trade, but are expected to decline over the forecast period (see the ‘Economic Outlook’ chapter).
The spot price of iron ore has fallen sharply since the previous Statement, but remains well above its trough in late 2015; a fall has been expected for some time (Graph 1.17). Prices were supported through late 2016 and into 2017 by Chinese infrastructure spending and property construction. Prices declined alongside reports that Chinese steel mills started to draw down on inventories, which reduced activity in the spot market. Further
Table 1.1: Commodity Price Growth(a)
SDR, per cent
Since previous Statement Over the past yearBulk commodities –4 47
– Iron ore –22 9 – Coking coal 29 130 – Thermal coal 0 64Rural 1 11Base metals –1 26Gold 0 0Brent crude oil(b) –9 12RBA ICP –5 40 – Using spot prices for bulk commodities –3 33(a) Prices from the RBA Index of Commodity Prices (ICP); bulk commodities prices are spot prices(b) In US dollarsSources: Bloomberg; IHS; RBA

R E S E R V E B A N K O F AU S T R A L I A1 2
2015201320112009 20170
50
100
150
US$/t
0
200
400
600
US$/tChinese Steel and Iron Ore Spot Prices
Iron ore**
Chinese steel*(RHS)
(LHS, fines)
* Average of hot rolled steel sheet and steel rebar prices** Free on board basisSources: Bloomberg; RBA
Coal PricesFree on board basis
Thermal coal
2013 20170
50
100
150
US$/t
Contract
Spot
Hard coking coal
2013 20170
100
200
300
US$/t
Sources: Department of Industry, Innovation and Science; IHS; RBA
Graph 1.17
Graph 1.18
declines in the iron ore price are widely expected as low-cost global supply continues to come online over the next year or so and because demand from China is expected to wane.
The spot price of premium hard coking coal has been volatile over the past six months (Graph 1.18). Earlier this year, prices declined from their mid-November peak as seaborne supply returned to more normal levels following supply disruptions in late 2016. More recently, prices increased sharply after Cyclone Debbie damaged key railway networks and shut down coal shipping ports in the Bowen Basin in Queensland, although trading in the spot market at that time was very limited. The region is estimated to account for more than half of the global seaborne coking coal market and around one-third of Australia’s coal exports. Coking coal contract negotiations for the June quarter have been delayed, as producers wanted to assess the impact of the cyclone before agreeing to a price.
The spot price of thermal coal has been relatively stable in the year to date. In March, Chinese authorities announced that the ‘276 working day policy’ would not be reintroduced, but that they would still target a reduction in overcapacity in the Chinese coal industry. Thermal coal exports are expected to be less affected by Cyclone
Debbie. A benchmark price for the 2017 Japanese fiscal year contract is yet to be agreed. However, the majority of Australia’s thermal coal exports are understood to be sold on the spot market.
Oil prices are lower since the previous Statement, but remain well above their low level in early 2016 (Graph 1.16). Since the start of the year, members of both the Organization of the Petroleum Exporting Countries (OPEC) and non-OPEC countries have been generally implementing the agreed production cap. However, increases in US crude oil production have weighed on oil prices. R
Commodity PricesJanuary 2010 average = 100
2013 201725
50
75
100
125
150
index
(spot prices)
Rural*
Base metals*
Bulk*
2013 201720
40
60
80
100
120
US$/b
Brent crude oil
* RBA Index of Commodity Prices (ICP) sub-indices; SDRSources: Bloomberg; RBA
Graph 1.16

S TAT E M E N T O N M O N E TA R Y P O L I C Y | M AY 2017 1 3
2. International and Foreign Exchange Markets
Financial market sentiment remains generally buoyant, supported by expectations of a sustained pick-up in economic growth globally and receding concerns of disruptive political developments. Against the backdrop of the more favourable economic outlook, the US Federal Reserve raised its policy rate in March and market expectations for further monetary stimulus from other central banks have been scaled back. Nonetheless, policy rates remain very low historically and some central banks continue to purchase large quantities of assets. Moreover, financial conditions remain very favourable. Yields across a range of markets are low and credit spreads are narrow, equity market valuations are at relatively high levels and measures of market volatility are generally low.
Central Bank PolicyThe Federal Open Market Committee (FOMC) has continued to gradually increase its policy rate. In March, it voted to raise its target range for the federal funds rate by 25 basis points to 0.75–1 per cent, citing a strengthening labour market and inflation having moved closer to its 2 per cent goal. The median projection of FOMC members is for two more increases in interest rates (of 25 basis points) this year, which is a somewhat faster pace of tightening than that anticipated by the market (Graph 2.1). Minutes from the March FOMC meeting indicated that, if the economy evolves as expected, the Federal Reserve is likely to start reducing its balance sheet in late 2017 by ceasing or at least limiting the reinvestment of maturing securities. The Federal Reserve currently
holds around US$4.5 trillion in assets, of which an estimated US$600 billion matures or will be otherwise repaid within a year (Graph 2.2).
The European Central Bank (ECB) has left its policy settings unchanged since announcing an extension of its asset purchase program in December. Since then it has noted that the
Graph 2.1
20162012200820042000 20200
2
4
6
%
0
2
4
6
%US – Policy Rate
Federal fundstarget range
FOMC median projectionsMarch 2017
Federal funds target rate*
* Dashed line shows current market expectationsSources: Bloomberg; Board of Governors of the Federal Reserve System
Graph 2.2
TreasuriesMortgage-backed securitiesOther
20152013201120092007 20170
1 000
2 000
3 000
4 000
US$b
0
1 000
2 000
3 000
4 000
US$bUS Federal Reserve Balance Sheet
Source: Thomson Reuters

R E S E R V E B A N K O F AU S T R A L I A1 4
economic recovery has gained momentum and that the risk of deflation has receded. However, it has also noted that underlying inflation has remained subdued and a substantial degree of monetary accommodation is still appropriate. Market prices suggest that the ECB is likely to keep the deposit rate at its current level over the coming year or so, which stands in contrast to the likelihood of a further reduction suggested by market pricing during much of 2016. The final targeted long-term refinancing operation took place in March. Banks borrowed a net €215 billion from the ECB, the largest take-up since the program began, increasing the outstanding amount borrowed by around 40 per cent (Graph 2.3).
The Bank of England (BoE) has left policy unchanged since August last year and, while it has reiterated that the next move in interest rates could be in either direction, its current economic forecasts imply a modest withdrawal of stimulus in the coming years. The BoE has almost completed its scheduled purchases of UK government and corporate bonds and the program is not expected to be extended.
The Bank of Japan (BoJ) has left both its deposit rate and its 10-year Japanese government bond yield target of around zero per cent unchanged since September and has continued to purchase
Graph 2.3European Central Bank Balance Sheet
2013 20171 500
2 000
2 500
3 000
3 500
4 000
€b
Total
2013 20170
500
1 000
1 500
2 000
2 500
€b
Lending to banks
Holdings of securities
Sources: European Central Bank; Thomson Reuters
assets at close to the pace seen last year. The BoJ has noted that the domestic economy continues to recover and reiterated its view that inflation will increase steadily towards its target. However, it has said that risks to the outlook – particularly from global developments – remain skewed to the downside and that very accommodative monetary policy remains appropriate. The BoJ has also noted that it does not believe that higher US Treasury yields compel it to increase its target for Japanese yields.
In China, money market interest rates have increased in 2017 (Graph 2.4). The rise has been accompanied by two 10 basis point increases to the interest rates on a number of the People’s Bank of China’s (PBC’s) lending facilities, which reflect the PBC’s desire to reduce leverage in the financial system. In March, money market rates rose noticeably for a time following news that some small financial institutions had defaulted on money market loans. These were the first defaults in this market and followed reports that larger banks have become more hesitant to provide funding to smaller institutions because of regulators’ increasing scrutiny of banks’ balance sheet growth.
Graph 2.4
201520132011 20170
2
4
6
8
10
%
0
2
4
6
8
10
%Chinese Money Market Rates
7-day repo
PBC 7-day dealing rate
3-monthSHIBOR
Source: CEIC Data
Elsewhere, the Bank of Mexico increased its policy rate, citing the need to keep inflation expectations anchored (Table 2.1). Conversely, the Swedish Riksbank extended its asset purchase program,

S TAT E M E N T O N M O N E TA R Y P O L I C Y | M AY 2017 1 5
Table 2.1: Monetary Policy
Policy ratePer cent
Most recent
change
Euro area(a) –0.40 ↓ Mar 16
Japan(a) –0.10 ↓ Jan 16
United States(b) 0.875 ↑ Mar 17
Australia 1.50 ↓ Aug 16
Brazil 11.25 ↓ Apr 17
Canada 0.50 ↓ Jul 15
Chile 2.75 ↓ Apr 17
India 6.25 ↓ Oct 16
Indonesia 4.75 ↓ Oct 16
Israel 0.10 ↓ Feb 15
Malaysia 3.00 ↓ July 16
Mexico 6.50 ↑ Mar 17
New Zealand 1.75 ↓ Nov 16
Norway 0.50 ↓ Mar 16
Russia 9.25 ↓ Apr 17
South Africa 7.00 ↑ Mar 16
South Korea 1.25 ↓ Jun 16
Sweden –0.50 ↓ Feb 16
Switzerland(b) –0.75 ↓ Jan 15
Thailand 1.50 ↓ Apr 15
Turkey 8.00 ↑ Nov 16
United Kingdom 0.25 ↓ Aug 16(a) Marginal rate paid on deposits at the central bank(b) Midpoint of target rangeSources: Central banks; RBA; Thomson Reuters
Sovereign Debt MarketsWith economic data and central bank policy evolving largely as expected, movements in major market sovereign bond yields have been modest, on balance, since late 2016 (Graph 2.5). Measures of bond market volatility remain low (Graph 2.6).
Graph 2.6
2013200920052001 20170
100
200
bps
0
100
200
bps
US Bond Market VolatilityImplied from one-month options, annualised
Average
Source: Bloomberg
Graph 2.5
201620152014 2017-0.5
0.0
0.5
1.0
1.5
2.0
2.5
3.0
%
-0.5
0.0
0.5
1.0
1.5
2.0
2.5
3.0
%10-year Government Bond Yields
Germany
Japan
US
UK
Source: Bloomberg
In the United States, 10-year Treasury yields have declined a little from their early 2017 levels. This may in part reflect waning expectations for fiscal stimulus. Nonetheless, yields remain close to the levels established following the US election. While long-term yields have declined, short-term yields have risen alongside the increase in the US Federal Reserve policy rate, resulting in a flatter yield curve.
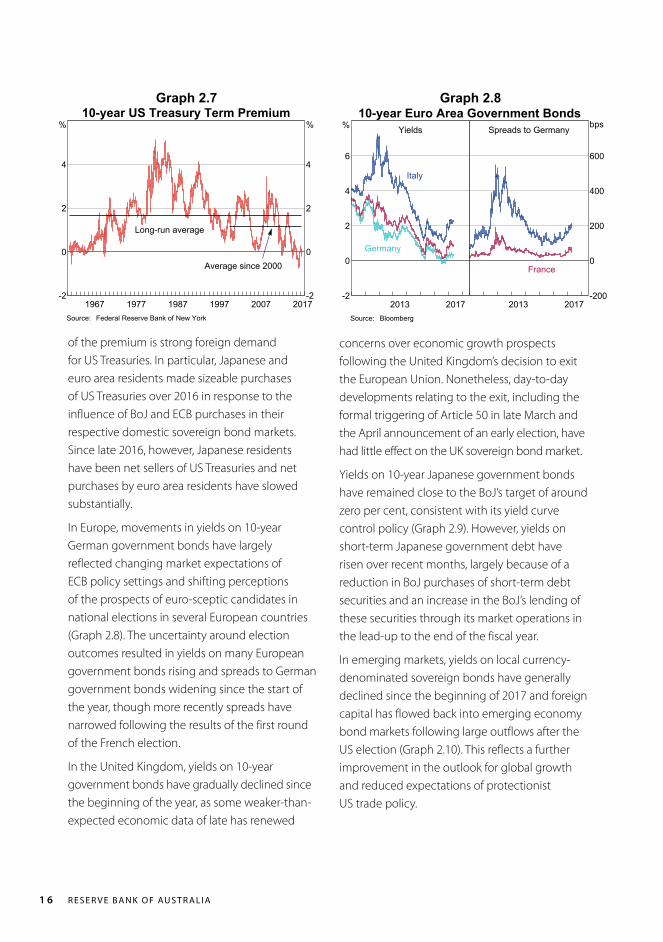
Estimates of the US term premium – the additional compensation investors require for holding long-term bonds – have remained around zero this year after rising a little from the lows reached in mid 2016 (Graph 2.7). One factor that has contributed to this low level
and several emerging market central banks eased monetary policy, including the central banks of Brazil, Chile and Russia, which all reduced their policy rates in response to softer domestic activity and a decline in rates of inflation.
R E S E R V E B A N K O F AU S T R A L I A1 6
of the premium is strong foreign demand for US Treasuries. In particular, Japanese and euro area residents made sizeable purchases of US Treasuries over 2016 in response to the influence of BoJ and ECB purchases in their respective domestic sovereign bond markets. Since late 2016, however, Japanese residents have been net sellers of US Treasuries and net purchases by euro area residents have slowed substantially.
In Europe, movements in yields on 10-year German government bonds have largely reflected changing market expectations of ECB policy settings and shifting perceptions of the prospects of euro-sceptic candidates in national elections in several European countries (Graph 2.8). The uncertainty around election outcomes resulted in yields on many European government bonds rising and spreads to German government bonds widening since the start of the year, though more recently spreads have narrowed following the results of the first round of the French election.
In the United Kingdom, yields on 10-year government bonds have gradually declined since the beginning of the year, as some weaker-than-expected economic data of late has renewed
concerns over economic growth prospects following the United Kingdom’s decision to exit the European Union. Nonetheless, day-to-day developments relating to the exit, including the formal triggering of Article 50 in late March and the April announcement of an early election, have had little effect on the UK sovereign bond market.
Yields on 10-year Japanese government bonds have remained close to the BoJ’s target of around zero per cent, consistent with its yield curve control policy (Graph 2.9). However, yields on short-term Japanese government debt have risen over recent months, largely because of a reduction in BoJ purchases of short-term debt securities and an increase in the BoJ’s lending of these securities through its market operations in the lead-up to the end of the fiscal year.
In emerging markets, yields on local currency-denominated sovereign bonds have generally declined since the beginning of 2017 and foreign capital has flowed back into emerging economy bond markets following large outflows after the US election (Graph 2.10). This reflects a further improvement in the outlook for global growth and reduced expectations of protectionist US trade policy.
Graph 2.7
20071997198719771967 2017-2
0
2
4
%
-2
0
2
4
%10-year US Treasury Term Premium
Long-run average
Average since 2000
Source: Federal Reserve Bank of New York
Graph 2.810-year Euro Area Government Bonds
Yields
2013 2017-2
0
2
4
6
%
Germany
Italy
Spreads to Germany
2013 2017-200
0
200
400
600
bps
France
Source: Bloomberg

S TAT E M E N T O N M O N E TA R Y P O L I C Y | M AY 2017 1 7
extended to US dollar-denominated bonds issued by emerging market corporations, for which yields have declined and spreads have narrowed since the beginning of 2017. The favourable conditions are due to a range of factors, including the positive outlook for growth and the gradual approach to monetary tightening by the US Federal Reserve. Reflecting these factors, corporate bond issuance has been strong, particularly in the United States where 2017 issuance by US corporations has been the highest on record (Graph 2.12). Issuance by euro area and emerging market firms has also increased relative to late 2016. Conversely, credit market conditions have tightened somewhat in China. Yields on Chinese corporate bonds have been rising since the start of the year and corporate bond issuance has been weak compared with 2016, partly as a result of tighter interbank funding conditions and regulatory measures aimed at reducing leverage and speculative activity in financial markets.
Funding conditions in other markets have also become more accommodative this year. The cost of borrowing US dollars in exchange for other currencies has fallen considerably from its peak in late 2016, particularly in exchange
Credit MarketsInvestor appetite for corporate fixed income securities has remained robust in 2017 and borrowing conditions in credit markets continue to be very favourable, despite the rise in the US policy rate and a scaling back of expectations for further monetary stimulus elsewhere. Yields on US dollar- and euro-denominated investment grade bonds remain at low levels by historical standards and spreads to government bonds have narrowed (Graph 2.11). Yields on non-investment grade bonds – having declined sharply in 2016 – have declined further over the year to date. The positive sentiment has
2015201320112009 2017-0.6
0.0
0.6
1.2
%
-0.6
0.0
0.6
1.2
%Japanese Interest Rates
Interest on marginal reserves
3-month governmentbill yield
10-year governmentbond yield
Sources: Bank of Japan; Bloomberg
Graph 2.9
Graph 2.10Emerging Market Government Bond Yields
Local currency-denominated 10-year bonds
2015 20170
5
10
15
%
Russia
Indonesia
Turkey
China
2015 20170
5
10
15
%
Mexico
South Africa
Chile
Brazil
Sources: Bloomberg; Thomson Reuters
Graph 2.11Corporate Bond Yields and Spreads
Yields
2014 20170.0
2.5
5.0
7.5
10.0
%
US – non-IG*
Euro – IG*
Spreads**
2014 20170
200
400
600
800
bps
Euro – non-IG*
US – IG*
* IG refers to investment grade** To equivalent government bondsSource: Bloomberg

R E S E R V E B A N K O F AU S T R A L I A1 8
for Japanese yen (Graph 2.13). This reflects both demand and supply factors. There has been a reduction in the demand for US dollar-denominated assets from non-US investors and a reduction in demand for funding such assets via the foreign exchange swap market. On the supply side, investors have been more willing to lend US dollars due to a reduction in US Treasury bill issuance after the temporary
Graph 2.12Corporate Bond Issuance
Gross IssuanceUSFinancial
Non-financial
200
400
US$b
200
400
US$b
Euro area
300
600
US$b
300
600
US$b
Emerging MarketsChinaOther EMs
2014201120082005 20170
150
300
US$b
0
150
300
US$b
Sources: Dealogic; RBA
US Dollar Funding Costs3-month maturity
Cross-currency basis*
2013 2017-225
-150
-75
0
bps
Euro
Japanese yen
LIBOR-OIS spread**
2013 20170
15
30
45
bps
* Negative value represents an additional cost to borrow US dollars** Difference between the London Interbank Offered Rate and theOvernight Index Swap rate
Source: Bloomberg
Graph 2.13
suspension of the debt ceiling expired.1 The cost of borrowing US dollars in money markets relative to risk-free rates has also declined, as has the cost of borrowing US dollars in repo markets that use Treasury securities as collateral.
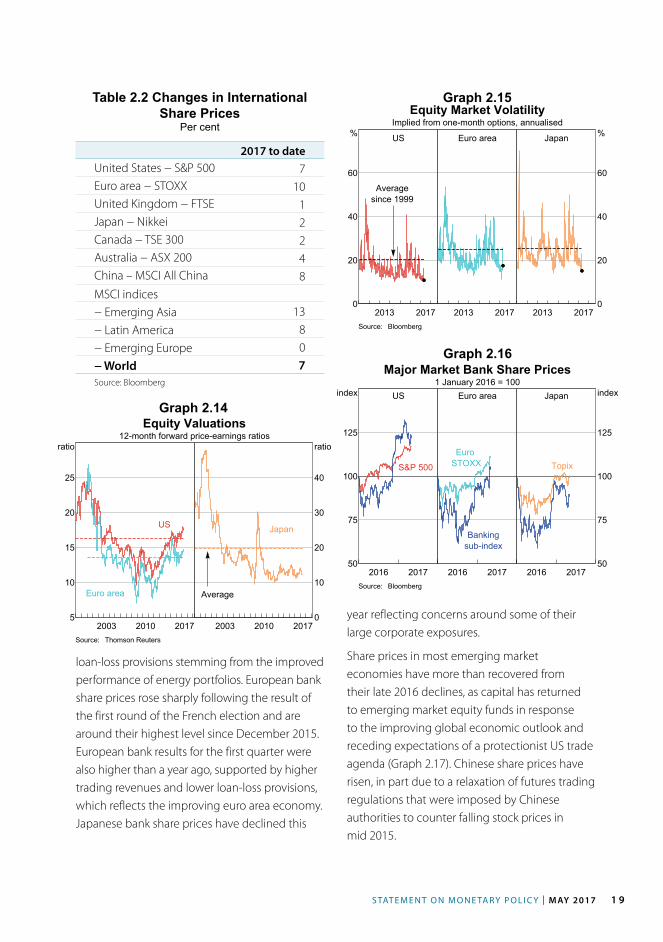
EquitiesSentiment in global equity markets has remained buoyant in recent months, supported by the positive outlook for economic growth, which in turn has supported earnings expectations. Despite waning somewhat recently, expectations for corporate tax reform and infrastructure spending in the United States, as well as low interest rates more generally, have also helped to support equity prices (Table 2.2). According to a range of measures, valuations are elevated on a historical basis and, like other financial markets, equity markets have proved resilient in the face of rising geopolitical tensions (Graph 2.14). While measures of equity market volatility, like those for bond markets, have picked up at times, they remain at very low levels (Graph 2.15).
US bank share prices are little changed since the start of the year but valuations still suggest that the US financial sector will ultimately benefit from the administration’s deregulatory agenda (Graph 2.16). March quarter earnings for the largest US banks were generally higher than a year ago. Earnings were supported by a rise in net interest income, fixed income trading revenue (due to increased client activity) and investment banking revenue, as well as lower
1 The US Government must regularly pass appropriations bills in order to fund many of its activities. If appropriation bills are not passed, many government functions and departments are shut down. In order to borrow to fund its appropriations bills, the US Government regularly raises the debt ceiling (which otherwise would be a binding constraint on the gross amount of federal debt outstanding). The debt ceiling was last suspended in November 2015. This suspension expired on 15 March 2017 and the debt ceiling is once again binding. The US Treasury is currently employing ‘extraordinary measures’ to fund existing government expenditure without increasing the level of federal debt outstanding.
S TAT E M E N T O N M O N E TA R Y P O L I C Y | M AY 2017 1 9
Table 2.2 Changes in International Share Prices
Per cent
2017 to dateUnited States − S&P 500 7Euro area − STOXX 10United Kingdom − FTSE 1Japan − Nikkei 2Canada − TSE 300 2Australia − ASX 200 4China – MSCI All China 8MSCI indices− Emerging Asia 13− Latin America 8− Emerging Europe 0− World 7Source: Bloomberg
loan-loss provisions stemming from the improved performance of energy portfolios. European bank share prices rose sharply following the result of the first round of the French election and are around their highest level since December 2015. European bank results for the first quarter were also higher than a year ago, supported by higher trading revenues and lower loan-loss provisions, which reflects the improving euro area economy. Japanese bank share prices have declined this
Equity Valuations12-month forward price-earnings ratios
20102003 20175
10
15
20
25
ratio
US
Euro area
20102003 20170
10
20
30
40
ratio
Japan
Average
Source: Thomson Reuters
Equity Market VolatilityImplied from one-month options, annualised
US
2013 20170
20
40
60
%
Averagesince 1999
Euro area
2013 2017
Japan
2013 20170
20
40
60
%
Source: Bloomberg
Graph 2.14
Graph 2.15
Major Market Bank Share Prices1 January 2016 = 100
US
2016 201750
75
100
125
index
S&P 500
Euro area
2016 2017
Bankingsub-index
EuroSTOXX
Japan
2016 201750
75
100
125
index
Topix
Source: Bloomberg
Graph 2.16
year reflecting concerns around some of their large corporate exposures.
Share prices in most emerging market economies have more than recovered from their late 2016 declines, as capital has returned to emerging market equity funds in response to the improving global economic outlook and receding expectations of a protectionist US trade agenda (Graph 2.17). Chinese share prices have risen, in part due to a relaxation of futures trading regulations that were imposed by Chinese authorities to counter falling stock prices in mid 2015.

R E S E R V E B A N K O F AU S T R A L I A2 0
Table 2.3: Changes in the US Dollar against Selected Currencies
Per cent
Over 2016
2017 to date
Canadian dollar –3 2Philippine peso 6 1New Zealand dollar –1 1Chinese renminbi 7 –1Indonesian rupiah –2 –1Swiss franc 2 –2Brazilian real –18 –3Swedish krona 8 –3Australian dollar 1 –3European euro 3 –3Singapore dollar 2 –3Thai baht –1 –4Japanese yen –3 –4Malaysian ringgit 5 –4UK pound sterling 19 –4Indian rupee 3 –5South Korean won 3 –6Russian rouble –14 –7New Taiwan dollar –1 –7Mexican peso 21 –9Trade-weighted index 4 –3Sources: Bloomberg; Board of Governors of the Federal Reserve System
against the currencies of economies likely to be particularly affected by any changes to US trade policies (Table 2.3). Indeed, the Mexican peso has appreciated by around 15 per cent against the US dollar since its trough in mid January, retracing its post-election depreciation.
The US dollar has also depreciated against the Japanese yen since the start of the year, reflecting a narrowing in the differential between the yields on US sovereign bonds and those in Japan (consistent with the BoJ’s policy of yield curve control, which has limited the movements in longer-term Japanese sovereign bond yields). Notwithstanding its recent depreciation, the
Foreign ExchangeThe US dollar has depreciated since the start of the year on a trade-weighted (TWI) basis, as market participants have pared back expectations that the US administration will be able to enact their proposed fiscal stimulus in a timely manner and have come to believe that the administration may not pursue protectionist trade measures as much as earlier anticipated (Graph 2.18). The US dollar is now around its level immediately prior to the US election. The depreciation has been most pronounced
Graph 2.17
M MJ JS D2016 2017
80
90
100
110
index
80
90
100
110
index
Developed and Emerging Market Share Prices30 December 2016 = 100
MSCI Developed Markets
MSCI Emerging Markets
Source: Bloomberg
Graph 2.18
201620152014 201790
100
110
120
index,yen
1.45
1.30
1.15
1.00
US$US Dollar
(LHS)Yen per US$
US$ per euro(RHS, inverted scale)
TWI*(LHS)
* 1 January 2014 = 100Sources: Bloomberg; Board of Governors of the Federal Reserve System

S TAT E M E N T O N M O N E TA R Y P O L I C Y | M AY 2017 2 1
US dollar has appreciated significantly over the past few years alongside divergent paths for monetary policy in the United States and other advanced economies. The US dollar remains around its highest level in over a decade on a trade-weighted basis.
The Chinese renminbi (RMB) has appreciated modestly against the US dollar over 2017 to date (Graph 2.19). However, since the appreciations of the currencies of many of its major trading partners against the US dollar have been more pronounced, the RMB has depreciated noticeably on a trade-weighted basis. These moves are in contrast to those in the second half of 2016 when the RMB depreciated against the US dollar – reflecting the broad-based US dollar appreciation over that period – but was broadly unchanged on a trade-weighted basis.
Graph 2.19
201620152014 201790
95
100
105
110
index
7.0
6.8
6.6
6.4
6.2
yuanChinese Exchange Rates
(RHS, inverted scale)Yuan per US$
(LHS)TWI*
* Indexed to 1 January 2014 = 100Sources: BIS; Bloomberg; RBA
Graph 2.20Asian and Emerging Market Currencies
Against the US dollar, 1 July 2016 = 100
M JS D2016 2017
70
80
90
100
110
index
Indonesia
MalaysiaSouthKorea
South Africa
M JS D2016 2017
70
80
90
100
110
index
Mexico
Turkey
Russia
Brazil
Source: Bloomberg
The euro appreciated following the outcome of the first round of voting in the French presidential election. Over the past few months the euro has fluctuated alongside evolving expectations for European election outcomes and the path of monetary policy in the euro area. The currency is little changed on a trade-weighted basis since the start of the year. Emerging European currencies have moved
broadly in line with the euro, including the Czech koruna, which appreciated only a little against the euro following the removal of its exchange rate cap of CZK 27/euro in early April. The UK pound appreciated a little following the announcement of the early UK general election, but remains noticeably lower than its level prior to the referendum on leaving the euro area.
Outside of the currencies exposed to US trade policy developments and emerging European currencies, other emerging market currencies have been mixed (Graph 2.20). Commodity prices have generally stabilised or declined in recent months, which has weighed on the currencies of some commodity exporters. Political developments have also been important. The South African rand has depreciated noticeably against the US dollar since its peak in late March following the removal of the country’s finance minister (by the President) and the associated downgrade to its credit rating.
Consistent with bond and equity market volatility, observed and forward-looking measures of volatility have generally fallen since the start of the year for both major and emerging market currencies (Graph 2.21).

R E S E R V E B A N K O F AU S T R A L I A2 2
Foreign Exchange Commission aimed at reducing volatility in the peso has not affected the Bank of Mexico’s level of foreign currency reserves because the instrument is settled in pesos.
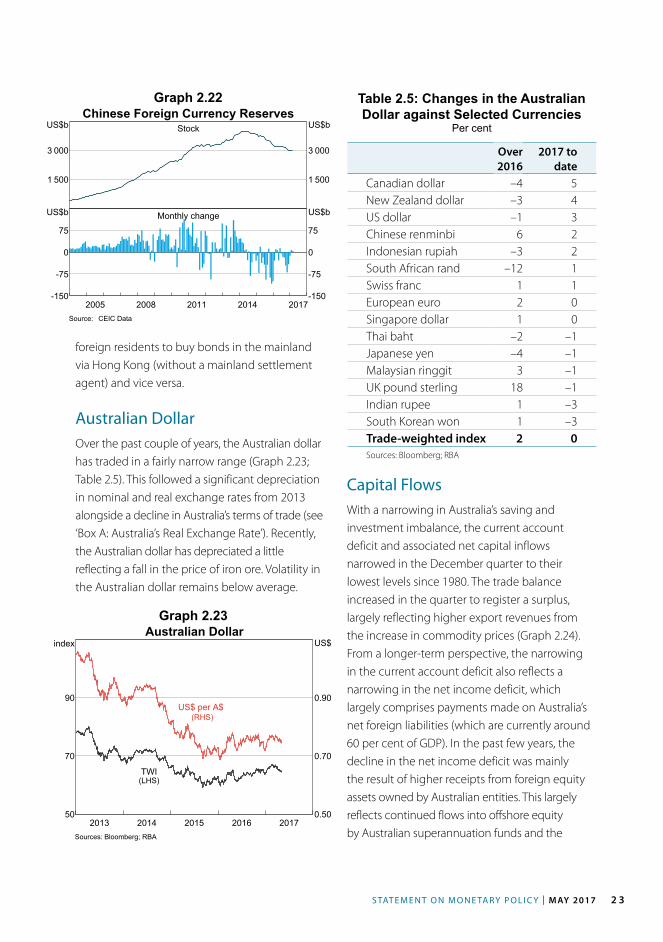
The value of the PBC’s foreign currency reserves has been broadly unchanged over 2017 at around US$3 trillion (27 per cent of GDP; Graph 2.22). Partial data indicate that the pace of net private capital outflows has declined, consistent with the greater scrutiny of capital outflows by the Chinese authorities over the past few months and the depreciation of the US dollar. The Chinese authorities have given foreign financial institutions access to the onshore foreign exchange derivative market to hedge the foreign currency exposure associated with their purchases of Chinese bonds. The authorities have also announced their intention to start a ‘Bond Connect’ scheme with Hong Kong this year, which would allow
Table 2.4: Gross Foreign Currency Reserves(a)
Percentage change: Level
End March 2016 to latest
End December 2016 to latest
US$ equivalent (billions)
China –6 0 3 009Saudi Arabia –13 –5 499Taiwan(b) 1 1 438Hong Kong 10 3 385South Korea 1 1 365Brazil 4 1 359India 3 3 347Russia 2 5 323Singapore 5 5 257Thailand 3 5 172Mexico –1 1 170Indonesia 14 5 116Malaysia 0 2 89Turkey –11 –7 84(a) Data to end March for China, Hong Kong, Indonesia, Mexico, Saudi Arabia, Singapore, South Korea, Taiwan, and Thailand;
to 14 April for Malaysia; to 21 April for India, Russia and Turkey; to end April for Brazil(b) Foreign exchange reserves (includes foreign currency and other reserve assets)Sources: Bloomberg; CEIC Data; central banks; IMF; RBA
Graph 2.21
201320092005 20170
10
20
30
ppt
0
10
20
30
ppt
Foreign Exchange Market VolatilityImplied by three-month options, annualised*
Emerging marketcurrencies (EM-VXY)
Developed marketcurrencies (CVIX)
* Selected currencies, weighted by turnoverSource: Bloomberg
The gross foreign currency reserves of most emerging market economies have increased since the end of December 2016 (Table 2.4), alongside US dollar weakness in the March quarter. The introduction of a new foreign exchange hedging instrument by the Mexican
S TAT E M E N T O N M O N E TA R Y P O L I C Y | M AY 2017 2 3
foreign residents to buy bonds in the mainland via Hong Kong (without a mainland settlement agent) and vice versa.
Australian DollarOver the past couple of years, the Australian dollar has traded in a fairly narrow range (Graph 2.23; Table 2.5). This followed a significant depreciation in nominal and real exchange rates from 2013 alongside a decline in Australia’s terms of trade (see ‘Box A: Australia’s Real Exchange Rate’). Recently, the Australian dollar has depreciated a little reflecting a fall in the price of iron ore. Volatility in the Australian dollar remains below average.
Graph 2.22
Graph 2.23
Chinese Foreign Currency ReservesStock
1 500
3 000
US$b
1 500
3 000
US$b
Monthly change
2014201120082005 2017-150
-75
0
75
US$b
-150
-75
0
75
US$b
Source: CEIC Data
2016201520142013 201750
70
90
index
0.50
0.70
0.90
US$Australian Dollar
(RHS)US$ per A$
(LHS)TWI
Sources: Bloomberg; RBA
Table 2.5: Changes in the Australian Dollar against Selected Currencies
Per cent
Over 2016
2017 to date
Canadian dollar –4 5New Zealand dollar –3 4US dollar –1 3Chinese renminbi 6 2Indonesian rupiah –3 2South African rand –12 1Swiss franc 1 1European euro 2 0Singapore dollar 1 0Thai baht –2 –1Japanese yen –4 –1Malaysian ringgit 3 –1UK pound sterling 18 –1Indian rupee 1 –3South Korean won 1 –3Trade-weighted index 2 0Sources: Bloomberg; RBA
Capital FlowsWith a narrowing in Australia’s saving and investment imbalance, the current account deficit and associated net capital inflows narrowed in the December quarter to their lowest levels since 1980. The trade balance increased in the quarter to register a surplus, largely reflecting higher export revenues from the increase in commodity prices (Graph 2.24). From a longer-term perspective, the narrowing in the current account deficit also reflects a narrowing in the net income deficit, which largely comprises payments made on Australia’s net foreign liabilities (which are currently around 60 per cent of GDP). In the past few years, the decline in the net income deficit was mainly the result of higher receipts from foreign equity assets owned by Australian entities. This largely reflects continued flows into offshore equity by Australian superannuation funds and the

R E S E R V E B A N K O F AU S T R A L I A2 4
Current Account BalancePer cent of nominal GDP
-4
0
%
-4
0
%Trade balance
Net income balance
2005199319811969 2017-8
-4
0
%
-8
-4
0
%Current account balance
Sources: ABS; RBA
Banks*Mining sector**
Other corporatesPublic sector***
Other financial
201220082004 2016-10
-5
0
5
10
%
-10
-5
0
5
10
%
Net Capital FlowsPer cent of GDP
Net capital flows
* Adjusted for the US dollar swap facility in 2008 and 2009** Available from 2007 onwards*** Excludes RBASources: ABS; RBA
Graph 2.24
Graph 2.25
depreciation of the exchange rate, which increases the Australian dollar value of dividend receipts.
The narrowing in net capital inflows to Australia has largely reflected a reduction in net capital inflows to the mining sector (Graph 2.25). This follows the gradual transition of a number of large liquefied natural gas projects from the investment phase (which had been largely funded offshore) to the production and export phase. R

S TAT E M E N T O N M O N E TA R Y P O L I C Y | M AY 2017 25
Box A
Australia’s Real Exchange Rate
Over the past 15 years or so, the mining boom and its aftermath have led to large movements in Australia’s real exchange rate. As has been widely documented, the significant rise in global commodity prices over the decade or so to 2011 resulted in both a significant appreciation of the Australian dollar and a pick-up in general price and wage inflation (Graph A1).1 This increased the prices of the goods and services the country produced compared with those in other countries. It also increased Australia’s relative labour costs, reducing the attractiveness of Australia as a place to invest in productive capacity. In other words, there was a reduction in Australia’s international competitiveness. This encouraged resources to move from the non- mining sector to the mining sector, which was benefiting from the higher global commodity prices. So, while the non-mining trade-exposed industries were adversely affected, the real appreciation contributed to more stable macroeconomic outcomes – output growth closer to potential and inflation closer to target – than would have been the case otherwise. Since commodity prices peaked in 2011 and the nominal exchange rate started to depreciate in 2013, Australia’s competitiveness has improved. The extent of these swings in the real exchange rate depends on the different measures used.
1 See, for example, Davis K, M McCarthy and J Bridges (2016), ‘The Labour Market during and after the Terms of Trade Boom’, RBA Bulletin, March, pp 1–10.
Real exchange rates are often based on the relative prices of a basket of goods and services across countries (expressed in a common currency); measures of consumer price indices or GDP deflators are frequently used for this purpose. Most real exchange rates are measured as a (geometric) average of real bilateral exchange rates for the country’s major trading partners, weighted by their trade shares (real effective exchange rates).2 The measure most commonly used by the Reserve Bank is based on core CPIs and is referred to as the real trade-weighted index, or real TWI.
For Australia, the real TWI peaked in March 2013. Since then, Australia’s real TWI has depreciated by as much as 20 per cent, reversing up to one-third of the move over the previous decade (Graph A2). Although inflation in Australia has
2 Australia’s real effective exchange rate based on unit labour costs includes a newly constructed estimate of Chinese unit labour costs.
Graph A1Australian Prices and the Exchange Rate
Price growth*
2
4
%
2
4
%
Wage price index
Trimmed mean CPI
Nominal TWI**
20132009200520011997 201775
100
125
index
75
100
125
index
* Year-ended** Post-float average = 100Sources: ABS; RBA

R E S E R V E B A N K O F AU S T R A L I A26
been relatively low since 2013, inflation has also been low in most of Australia’s trading partners, as a number of advanced economies have been slowly absorbing the spare capacity created by the global financial crisis (Graph A3). Hence, all of the real depreciation in this measure has occurred via the depreciation in the nominal exchange rate. The real exchange rate based on GDP deflators has depreciated by a little more than the real TWI over this period (consistent with the large fall in prices of Australia’s commodity exports).
Another way to measure the real exchange rate is to base it on the relative cost of labour required to produce a unit of output, that is, unit labour costs. In contrast to the broadly similar rates of inflation in goods and services prices in Australia’s major trading partners over the past few years, trends in unit labour costs have diverged somewhat (Graph A4). Unit labour costs in Australia have been little changed since the terms of trade peaked in 2011, largely reflecting historically low wage growth since that time. In contrast, unit labour costs in most of our major trading partners have risen since then, and Chinese unit labour costs have increased noticeably. This is consistent with continued
strong growth in Chinese labour income, which has more than doubled on a per employee basis since 2010 (compared with productivity growth of about 50 per cent over the same period).
These differences in the growth rates of Australia’s unit labour costs versus those of its trading partners have led to a more marked improvement in Australia’s labour market competitiveness than in the competitiveness of the prices of its goods and services. Australia’s real effective exchange rate based on unit labour costs has depreciated by around 25 per cent since March 2013. The latest observation
Graph A2 Graph A3
Graph A4
Core Consumer Price IndicesMarch 2013 = 100
Level
75
100
index
75
100
index
Australia
Japan
China
United States
RatioAustralia vs trading partners
2013200920052001 20170.8
0.9
1.0
ratio
0.8
0.9
1.0
ratio
Sources: ABS; CEIC Data; RBA; Thomson Reuters
Nominal Unit Labour CostsMarch 2013 = 100
Level
75
100
index
75
100
index
AustraliaUnited States
Japan
China
RatioAustralia vs trading partners
2013200920052001 20170.8
0.9
1.0
ratio
0.8
0.9
1.0
ratio
Sources: CEIC Data; OECD; RBA
20112005199919931987 201760
80
100
120
index
60
80
100
120
index
Australian Real Exchange RatesPost-float average = 100
Real exchange rate (ULCs)
Real TWI (CPIs)
Real exchange rate (GDP deflators)
Sources: CEIC Data; OECD; RBA; Thomson Reuters

S TAT E M E N T O N M O N E TA R Y P O L I C Y | M AY 2017 27
(December quarter 2016) was around its average since the Australian dollar floated in 1983 and at a level last seen in early 2005 (excluding the global financial crisis period). In contrast, the real TWI is noticeably above its post-float average and in the December quarter 2016 was at a level last seen in late 2007.
By any measure, Australia’s real exchange rate has depreciated since the end of the terms of trade boom. This has helped the economy adjust to the significant reduction in income from the terms of trade decline and the associated fall in mining investment by boosting activity in the tradeable sector. An appreciating real exchange rate would complicate that adjustment. R

R E S E R V E B A N K O F AU S T R A L I A28

S TAT E M E N T O N M O N E TA R Y P O L I C Y | M AY 2017 2 9
3. Domestic Economic Conditions
The Australian economy grew by 2½ per cent over 2016, which is a bit below central estimates of potential growth (Table 3.1; Graph 3.1). GDP growth rebounded to 1.1 per cent in the December quarter, confirming that the weak outcome in the September quarter largely reflected temporary factors. Recent data are consistent with moderate growth in early 2017. Employment growth was fairly subdued over 2016, but picked up to be around average in early 2017. Looking ahead, economic growth is expected to pick up gradually to be a bit above potential growth, supported by the low level of interest rates and the ongoing recovery in the global economy.
Table 3.1: Demand and Output GrowthPer cent
December quarter 2016
September quarter 2016
Year to December quarter 2016
GDP 1.1 –0.5 2.4Domestic final demand 1.2 –0.4 2.1 – Consumption 0.9 0.4 2.6 – Dwelling investment 1.2 –1.3 5.6 – Mining investment 2.5 –11.3 –24.0 – Non-mining investment 1.7 –0.9 3.6 – Public demand 1.4 0.0 4.9Change in inventories(a) –0.2 0.1 0.2Exports 2.2 1.0 8.9Imports 1.4 1.2 3.3Mining activity(b) 1.3 –1.4 3.4Non-mining activity(b) 1.0 –0.4 2.3Nominal GDP 3.0 0.7 6.1Real gross domestic income 2.9 0.5 5.4Terms of trade 9.1 5.1 15.6(a) Contribution to GDP growth(b) RBA estimates Sources: ABS; RBA
Graph 3.1
2012200820042000 2016-2
0
2
4
%
-2
0
2
4
%GDP Growth
Year-ended
Quarterly
Source: ABS
The economic adjustment to the end of the mining investment boom is well advanced. Activity in the mining sector (net of

R E S E R V E B A N K O F AU S T R A L I A3 0
2012200820042000 2016-15
-10
-5
0
5
10
15
%
-15
-10
-5
0
5
10
15
%
State Final DemandYear-ended growth
Rest of AustraliaNSW & Vic
WA
NSW and Vic
Sources: ABS; RBA
imports) contributed to growth over 2016, as the increase in resource exports more than offset the decline in mining investment. Outside the mining sector, household spending, business investment and dwelling investment have all contributed to growth, supported by low interest rates. Public demand has also been strong.
Economic conditions continue to vary across the states. Recently, growth in final demand has been strongest in New South Wales and Victoria, weakest in Western Australia and has picked up in the rest of the country (Graph 3.2). There are some signs that economic conditions are stabilising in the mining-exposed states. Final demand growth has picked up in Queensland over the past 18 months or so, and liaison suggests that business sentiment has improved recently in Western Australia. Labour market conditions across the states have generally been consistent with patterns in final demand, although employment growth in New South Wales has been subdued.
Graph 3.2
Mining and Non-mining ActivityYear-ended growth, RBA estimates
Mining*Mining*
20142012201020082006 2016
0
10
20
%
0
10
20
%
Resource exports
Mining investment
Non-mining
20142012201020082006 20160
2
4
6
%
0
2
4
6
%
* Net of mining-related imports; components are contributions toyear-ended mining activity growth; contribution from changes ininventories not shown
Sources: ABS; RBA
Graph 3.3
over 2016 as work on liquefied natural gas (LNG) facilities was completed and few new projects were commenced. However, most of the decline in mining investment looks to have occurred already, such that the drag on GDP growth will dissipate over the next couple of years. Both the ABS capital expenditure (Capex) survey of investment intentions and Bank liaison point to smaller declines in mining investment over this period. In addition, much of the remaining decline is expected to be in LNG investment, which is import intensive and uses relatively little labour. This suggests that the flow-on effects to the domestic economy are likely to be small.
The increase in commodity prices since late 2015 has boosted the profitability of firms in the mining sector. However, this has not led to a material increase in new investment or employment in the sector, partly because the increase in prices is not expected to be sustained. Information from the Bank’s liaison and company announcements have indicated that firms have used the additional income to pay down debt, pay out dividends and increase share buybacks. At the margin, some mining firms have reportedly been able to make small-scale
Mining ActivityMining activity (net of imports) increased in the December quarter, as resource exports increased further and mining investment rose unexpectedly (Graph 3.3). Despite the quarterly increase, mining investment continued to decline

S TAT E M E N T O N M O N E TA R Y P O L I C Y | M AY 2017 3 1
investments such as upgrades to machinery and equipment. Consistent with expectations, the prices of some commodities, including iron ore, have fallen noticeably over recent weeks.
Resource export volumes have increased strongly over the past year (Graph 3.4). The ramp-up in LNG production has been underway for the past year or so and LNG exports are expected to continue to grow strongly over the next few years. Iron ore export volumes are likely to be supported by increased production from Australia’s low-cost producers. Coal exports are likely to be lower in the next few quarters than had been expected, because of the effects of Cyclone Debbie in Queensland in late March. The cyclone damaged coal rail infrastructure in the Bowen Basin region, which is one of the largest coking coal producing regions in the world and accounts for around one-third of Australia’s coal exports.
Graph 3.4Resource Export Volumes*
20122008 20160
10
20
$b
Coke, coal and briquettes
Metal oresand mineral
20122008 20160
4
8
$b
Non-monetary gold
Metals
Other mineral fuels(incl LNG)
* Reference year is 2014/15Source: ABS
Graph 3.5Household Income, Consumption and Wealth*
Real, year-ended growth
0
5
10
%
0
5
10
%
Consumption
Disposable income
Saving ratio, net of depreciation
0
5
10
%
0
5
10
%
Net wealth**
20112006200119961991 2016350
450
550
650
%
350
450
550
650
%
* Household sector includes unincorporated enterprises; disposableincome is after tax and interest payments, and has been smoothedbetween March quarter 2000 and March quarter 2002** Per cent of annual household disposable income, before the deductionof interest payments
Sources: ABS; RBA
Household SectorHousehold consumption growth picked up in the December quarter, following a period of modest growth in mid 2016. A marked increase in goods consumption contributed to the pick-up. Low interest rates and ongoing growth in household net wealth have continued to support spending (Graph 3.5). However,
household income growth has remained weak, and there has been a further decline in the household saving ratio. Indicators in early 2017 suggest that consumption growth has moderated since late last year (Graph 3.6). The volume of retail sales is expected to be little changed after growth picked up in the December quarter.
Low growth in household disposable income continues to weigh on spending. In the December quarter, real household disposable income was unchanged, held down by the fall in labour income. Households’ perceptions of their personal finances have declined since late 2016. Surveys indicate that households believe that paying off debt is currently a wiser place for saving than investing in real estate (Graph 3.7); while this might seem consistent with more cautious behaviour, the

R E S E R V E B A N K O F AU S T R A L I A3 2
over recent months. If housing approvals remain at current levels, the pipeline will be worked off gradually to more normal levels. The decline in higher-density approvals has been concentrated in New South Wales (where housing activity has been quite strong of late) and Queensland (where conditions have been less favourable) (Graph 3.9).
Conditions in the established housing market continue to vary, both across cities and between different types of dwellings. Across the capital cities, housing conditions remain strongest in Sydney and Melbourne and weakest in Perth. This is true across a range of measures, from growth in housing prices and advertised rents to vendor
Consumption IndicatorsRetail sales growthRetail sales growth
0
4
8
%
0
4
8
%
Values
Volume
Values(monthly)
(year-ended)
(year-ended)
Household perceptions of personal finances*
2014201120082005 201770
85
100
115
index
70
85
100
115
index
* Average of the ANZ-Roy Morgan and Westpac-Melbourne Instituteconsumer sentiment measures of respondents’ perceptions of theirpersonal finances relative to the previous year; average since1980 = 100
Sources: ABS; ANZ-Roy Morgan; RBA; Westpac and Melbourne Institute
Graph 3.6
2013201020072004 20160
2
4
6
8
10
12
%
0
2
4
6
8
10
12
%
Residential Construction Pipeline*Private and public, per cent of GDP
Total
Higher-density
Detached
Alterations & additions
* Dwelling units under construction or approved but not yet commencedSources: ABS; RBA
Graph 3.8
Graph 3.9
Graph 3.7
Private Residential Building ApprovalsThree-month moving average
New South Wales
1 000
2 000
3 000
4 000no
Higher-density
Victoria
1 000
2 000
3 000
4 000no
Queensland
20132009 20170
600
1 200
1 800
2 400no Western Australia
20132009 20170
600
1 200
1 800
2 400no
Detached
Sources: ABS; RBA
overall household debt-to-income ratio has been on an upward trend for the past couple of years.
Private dwelling investment remained at a high level in the December quarter and is expected to continue to contribute to economic growth over the next year or so, particularly given the large volume of new apartment construction in the pipeline (Graph 3.8). However, the contribution to growth from dwelling investment is expected to decline gradually from mid 2017 because residential building approvals, especially higher-density dwelling approvals, have declined
Allocation of Household Savings*Percentage of total
10
20
30
40%
10
20
30
40%
Real estate
Pay debt
2008199919901981 20170
10
20
30
40%
0
10
20
30
40%
Banks
Shares
Superannuation
* Based on responses to survey on consumers’ perceived 'wisestplace for savings'
Source: Westpac and Melbourne Institute

S TAT E M E N T O N M O N E TA R Y P O L I C Y | M AY 2017 3 3
discounts and days on market (Graph 3.10). Across the types of dwellings, price growth for detached houses has outpaced that for apartments, most obviously in cities where the increase in the supply of apartments has been large relative to the existing stock, such as Brisbane and Melbourne (Graph 3.11). Rents continue to decline in Perth and the vacancy rate remains elevated. In the other capital cities, rent inflation remains subdued and vacancy rates have been stable around their long-run averages for some time.
Looking ahead, low interest rates should continue to provide support to housing demand. Total housing loan approvals remain around record highs, although new prudential measures are expected to lead to some tightening in lending standards and to slow the rate of growth in credit (see ‘Domestic Financial Markets’ chapter).
Government SectorPublic demand grew at an above-average rate in the December quarter, driven by a rise in public investment, while public consumption was little changed. Recent strong growth in the pipeline of public infrastructure projects is likely to support public investment growth over coming years (Graph 3.12).
Housing Market IndicatorsSeasonally adjusted
Housing price growth**
0
15
%
Sydney and Melbourne*
Other capitalcities*
Advertised rents growth**
0
15
%
Vendor discounts***
20132009 20174
6
8
%
PerthDays on market***
20132009 201720
45
70
days
* Capital city dwelling stock weighted; advertised rents exclude Hobartbefore August 2008 and Adelaide; vendor discounts exclude Hobartbefore March 2008; days on market exclude Hobart before June 2008** Year-ended*** Median for private treaty sales only
Sources: ABS; APM; CoreLogic; RBA
Graph 3.10
2015201320112009 2017-10
0
10
%
-10
0
10
%
National Housing Price Growthby Dwelling Type*
Six-month-ended annualised, seasonally adjusted
Apartments
Houses
* Capital cities only; excludes Darwin and HobartSources: APM; RBA
Graph 3.11
Graph 3.12Public SectorPer cent of GDPInvestment*
2
4
6
%
2
4
6
%
Infrastructure work yet to be done
20142012201020082006 20160
2
4
6
%
0
2
4
6
%
* Adjusted for second-hand asset transfers between the public andother sectors
Sources: ABS; RBA
Non-mining Business SectorNon-mining business investment increased by around 3½ per cent over 2016, although it has been subdued for several years and remains low as a share of GDP. Non-mining investment has picked up in New South Wales and Victoria, but has been relatively weak in Queensland and Western Australia over the past few years.
Looking ahead, indicators of non-mining business investment are somewhat mixed.
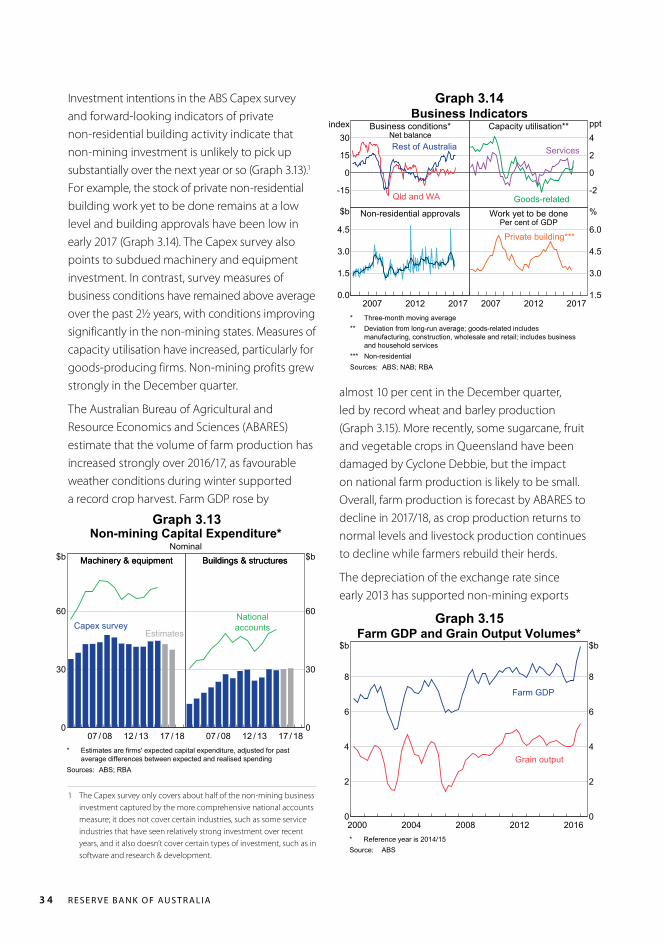
R E S E R V E B A N K O F AU S T R A L I A3 4
Graph 3.15
Graph 3.14Business Indicators
Business conditions*Net balance
-15
0
15
30index
Rest of Australia
Qld and WA
Capacity utilisation**
-2
0
2
4ppt
Services
Goods-relatedNon-residential approvals
20122007 20170.0
1.5
3.0
4.5
$b Work yet to be donePer cent of GDP
20122007 20171.5
3.0
4.5
6.0
%
Private building***
* Three-month moving average** Deviation from long-run average; goods-related includes
manufacturing, construction, wholesale and retail; includes businessand household services
*** Non-residentialSources: ABS; NAB; RBA
2012200820042000 20160
2
4
6
8
$b
0
2
4
6
8
$bFarm GDP and Grain Output Volumes*
Grain output
Farm GDP
* Reference year is 2014/15Source: ABS
Investment intentions in the ABS Capex survey and forward-looking indicators of private non-residential building activity indicate that non-mining investment is unlikely to pick up substantially over the next year or so (Graph 3.13).1 For example, the stock of private non-residential building work yet to be done remains at a low level and building approvals have been low in early 2017 (Graph 3.14). The Capex survey also points to subdued machinery and equipment investment. In contrast, survey measures of business conditions have remained above average over the past 2½ years, with conditions improving significantly in the non-mining states. Measures of capacity utilisation have increased, particularly for goods-producing firms. Non-mining profits grew strongly in the December quarter.
The Australian Bureau of Agricultural and Resource Economics and Sciences (ABARES) estimate that the volume of farm production has increased strongly over 2016/17, as favourable weather conditions during winter supported a record crop harvest. Farm GDP rose by
1 The Capex survey only covers about half of the non-mining business investment captured by the more comprehensive national accounts measure; it does not cover certain industries, such as some service industries that have seen relatively strong investment over recent years, and it also doesn’t cover certain types of investment, such as in software and research & development.
almost 10 per cent in the December quarter, led by record wheat and barley production (Graph 3.15). More recently, some sugarcane, fruit and vegetable crops in Queensland have been damaged by Cyclone Debbie, but the impact on national farm production is likely to be small. Overall, farm production is forecast by ABARES to decline in 2017/18, as crop production returns to normal levels and livestock production continues to decline while farmers rebuild their herds.
The depreciation of the exchange rate since early 2013 has supported non-mining exports
Graph 3.13Non-mining Capital Expenditure*
NominalMachinery & equipmentMachinery & equipment
12 / 1307 / 08 17 / 180
30
60
$b
0
30
60
$b
Capex surveyEstimates
Buildings & structuresBuildings & structures
12 / 1307 / 08 17 / 180
30
60
$b
0
30
60
$b
Nationalaccounts
* Estimates are firms' expected capital expenditure, adjusted for pastaverage differences between expected and realised spending
Sources: ABS; RBA

S TAT E M E N T O N M O N E TA R Y P O L I C Y | M AY 2017 3 5
Graph 3.16Non-mining Exports
Contributions to year-ended GDP growth
20122008 2016-1.0
-0.5
0.0
0.5
ppt
Net services
20122008 2016-1.0
-0.5
0.0
0.5
ppt
Rural
Manufactured
Sources: ABS; RBA
Labour MarketConditions in the labour market have been mixed recently. Employment growth picked up in the March quarter, but the unemployment rate has edged higher over recent months to 5.9 per cent (Graph 3.17). After declining over much of 2016, the level of full-time employment has increased over the past six months; growth in part-time employment nonetheless remains strong. Consequently, average hours worked remain at a historically low level. Measures of underemployment have edged higher, as a relatively high proportion of part-time workers would like and are able to work additional hours.
Labour market conditions continue to diverge across the states (Graph 3.18). Employment growth over the past year has been concentrated in Victoria due to solid demand and population growth. Victorian employment growth has been fairly broad based across household and business services industries, and in both Melbourne and
Graph 3.17Labour Market
EmploymentYear-ended growth
0
1
2
3
%
0
1
2
3
%
4.5
5.5
6.5
7.5
8.5%
4.5
5.5
6.5
7.5
8.5%
Underemployment rate
Unemployment rate
Participation rate
20152013201120092007 201764.0
64.5
65.0
65.5
66.0
%
64.0
64.5
65.0
65.5
66.0
%
Source: ABS
(Graph 3.16). Service exports, which include tourism, education and business services, have made a significant contribution to GDP growth over this period. Over 2016, manufactured exports increased and rural exports also rose following a record crop harvest.
Graph 3.18Employment by State
Contributions to year-ended growth, trendNew South WalesNew South Wales
0
2
4
ppt VictoriaVictoria
0
2
4
ppt
Capital city
QueenslandQueensland
20142011 2017-2
0
2
4
6ppt
Rest of state
Western AustraliaWestern Australia
20142011 2017-2
0
2
4
6ppt
Sources: ABS; RBA
regional areas. While employment in Sydney continues to trend higher, employment has fallen across the rest of New South Wales following particularly strong growth in 2015. The level of employment has picked up a little in Western Australia and Queensland since late 2016. Population growth has slowed sharply in these mining-exposed states following the end

R E S E R V E B A N K O F AU S T R A L I A3 6
of the mining investment boom, partly reflecting a net outflow of people from Western Australia to other states.
In trend terms, employment growth over the past year has been concentrated in services industries, while goods-related employment has been largely unchanged (Graph 3.19). Within household services, employment increased strongly in education and declined a little in health care, where it had expanded strongly in the previous couple of years. Within business services, there has been an increase in professional, scientific & technical employment and administrative & support employment; the latter covers labour hire firms and may be capturing demand across a range of industries. The unchanged level of goods-related employment over the past year masks divergences within the sector; growth in construction and manufacturing employment has been largely offset by weakness in the wholesale and retail industries.
Part-time employment is now around one-third of total employment (up from one-quarter two decades ago). Over time, Australian firms have shown a greater tendency to respond to changes in demand by adjusting the hours
Graph 3.19Employment by Sector*Change since February 2011
Household services
2013 2017-150
0
150
300
’000 Business services
2013 2017
Full-time
Goods-related
2013 2017-150
0
150
300
’000
Part-time
* Seasonally adjusted by RBA; does not remove the effects of changesin the timing of ABS supplementary surveys; four-quarter movingaverage
Sources: ABS; RBA
worked by their existing employees (compared with changing the number of employees).2 This could reflect increased labour market flexibility, possibly related to the shift towards a more service-based economy, labour market deregulation and technological change. Cyclical factors are likely to have been important in the concentration of employment growth in part-time jobs over the past year or so. For example, over that period, full-time employment declined in the mining-exposed states of Western Australia and Queensland and in the retail industry (which has been affected by heightened competitive pressures). Full-time youth employment also declined, which tends to occur in periods where there is spare capacity in the labour market. The participation rate for this group has fallen a little over the past year, and the youth unemployment rate remains high.
Analysis of the movement of individuals between different labour market categories can help to explain recent changes in the composition of employment growth between part-time and full-time employment. On average, there tends to be a net flow of workers moving from part-time work to full-time work. However, over the past two years, fewer part-time workers have moved to full-time work than normal. This is consistent with the higher level of underemployment as many part-time workers want to, and are available to, work additional hours. The net flow of workers from full-time employment to outside the labour force has also picked up; over the medium term, this trend will be partly driven by demographic changes, as more workers move into retirement age, but there also appears to be a cyclical component.
Forward-looking indicators of labour demand point to further moderate growth in employment over the next couple of quarters (Graph 3.20).
2 See Bishop J, L Gustafsson and M Plumb (2016), ‘Jobs or Hours? Cyclical Labour Market Adjustment in Australia’, RBA Research Discussion Paper, No 2016-06.

S TAT E M E N T O N M O N E TA R Y P O L I C Y | M AY 2017 3 7
20152013201120092007 20170.5
1.0
1.5
2.0
2.5
%
0.5
1.0
1.5
2.0
2.5
%
Job Vacancies and AdvertisementsShare of labour force
Vacancies**ABS
ANZ survey
Department of Employment*
* Count of internet job advertisements** Survey was suspended between May 2008 and November 2009Sources: ABS; ANZ; Department of Employment
has been evident across all industries, but is most pronounced in mining and mining-exposed industries including construction and professional services. Wage growth has been strongest in the health and education industries, where employment growth has been relatively strong. The public sector WPI increased by 2.3 per cent over 2016, but public sector wages in the Australian Capital Territory and Western Australian grew by less than 2 per cent over the year.
The amount of spare capacity in the labour market is an important determinant of wage growth, although spare capacity is difficult to measure. One measure is the unemployment ‘gap’; that is, the difference between the current unemployment rate and an estimate of the rate of unemployment associated with a stable rate of inflation (often referred to as the non-accelerating inflation rate of unemployment or NAIRU) (Graph 3.22). The current unemployment gap estimate suggests that there is spare capacity in the labour market, although less than there was in 2015. However, wage growth has continued to slow over this period. It may be the case that there is currently more spare capacity in the labour market than suggested by the unemployment gap, as the underemployment rate has edged higher. That is, part-time workers who want and are available to work additional hours could also be putting downward pressure on wage growth. It is also possible that the relationship between wage growth and spare capacity in the labour market may have been affected by structural changes in the economy; for example, due to new work arrangements enabled by technological change or increased competitive pressures from the internationalisation of services trade. However, any resulting changes to workers’ bargaining power is difficult to observe directly.
Recent analysis of the job-level WPI data suggests that the share of ‘large’ wage rises (more than 4 per cent) declined from over
Graph 3.20
Labour CostsWage growth remains low. A number of factors have contributed to low wage growth, including spare capacity in the labour market as well as lower inflation outcomes and inflation expectations. However, these factors cannot fully explain the recent weakness.3 Lower wage growth is also part of the adjustment in the economy to the earlier decline in the terms of trade and the end of the mining investment boom; the decline in wage growth has been most pronounced in mining and mining-exposed states and industries (see ‘Box A: Australia’s Real Exchange Rate’). Information from firms in the Bank’s liaison program as well as a survey of union officials suggests that wage growth is likely to remain unchanged over the next year.
The wage price index (WPI) increased by 1.9 per cent over 2016 (Graph 3.21). Private sector WPI growth was slightly softer at 1.8 per cent. The slowing in wage growth over recent years
3 See Bishop J and N Cassidy (2017), ‘Insights into Low Wage Growth in Australia’, RBA Bulletin, March, pp 13–20.
Vacancies data remain strongest for household services, in particular, in the health care industry, and in New South Wales and Victoria.
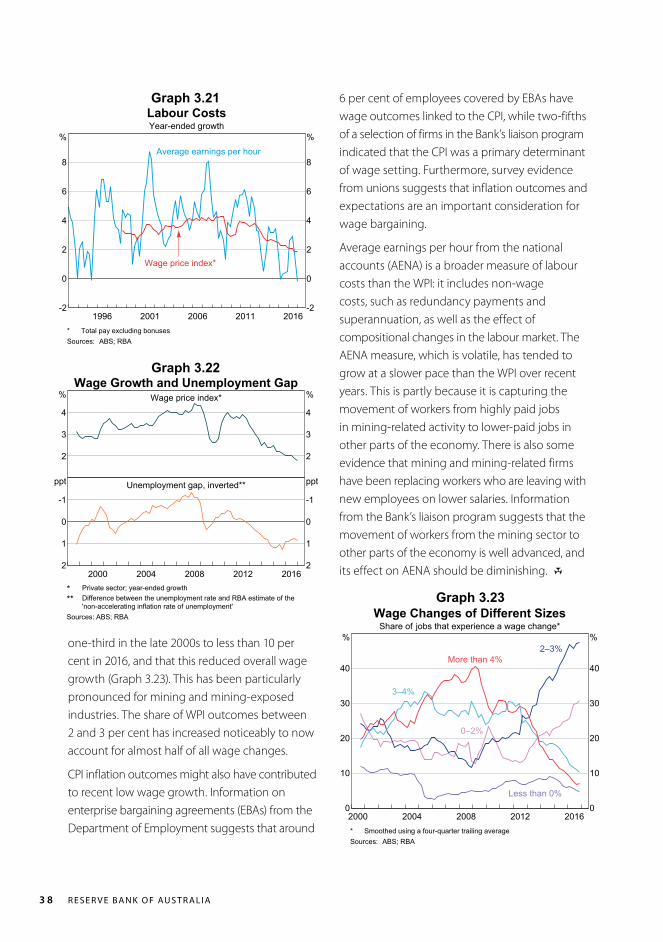
R E S E R V E B A N K O F AU S T R A L I A3 8
one-third in the late 2000s to less than 10 per cent in 2016, and that this reduced overall wage growth (Graph 3.23). This has been particularly pronounced for mining and mining-exposed industries. The share of WPI outcomes between 2 and 3 per cent has increased noticeably to now account for almost half of all wage changes.
CPI inflation outcomes might also have contributed to recent low wage growth. Information on enterprise bargaining agreements (EBAs) from the Department of Employment suggests that around
6 per cent of employees covered by EBAs have wage outcomes linked to the CPI, while two-fifths of a selection of firms in the Bank’s liaison program indicated that the CPI was a primary determinant of wage setting. Furthermore, survey evidence from unions suggests that inflation outcomes and expectations are an important consideration for wage bargaining.
Average earnings per hour from the national accounts (AENA) is a broader measure of labour costs than the WPI: it includes non-wage costs, such as redundancy payments and superannuation, as well as the effect of compositional changes in the labour market. The AENA measure, which is volatile, has tended to grow at a slower pace than the WPI over recent years. This is partly because it is capturing the movement of workers from highly paid jobs in mining-related activity to lower-paid jobs in other parts of the economy. There is also some evidence that mining and mining-related firms have been replacing workers who are leaving with new employees on lower salaries. Information from the Bank’s liaison program suggests that the movement of workers from the mining sector to other parts of the economy is well advanced, and its effect on AENA should be diminishing. R
Wage Growth and Unemployment GapWage price index*
2
3
4
%
2
3
4
%
Unemployment gap, inverted**
2012200820042000 20162
1
0
-1
ppt
2
1
0
-1
ppt
* Private sector; year-ended growth** Difference between the unemployment rate and RBA estimate of the'non-accelerating inflation rate of unemployment'
Sources: ABS; RBA
2012200820042000 20160
10
20
30
40
%
0
10
20
30
40
%
Wage Changes of Different SizesShare of jobs that experience a wage change*
2–3%
3–4%
0–2%
More than 4%
Less than 0%
* Smoothed using a four-quarter trailing averageSources: ABS; RBA
Graph 3.22
Graph 3.23
Graph 3.21
2011200620011996 2016-2
0
2
4
6
8
%
-2
0
2
4
6
8
%
Labour CostsYear-ended growth
Wage price index*
Average earnings per hour
* Total pay excluding bonusesSources: ABS; RBA

S TAT E M E N T O N M O N E TA R Y P O L I C Y | M AY 2017 3 9
4. Domestic Financial Markets
Australian financial markets have been relatively quiet in recent months. The cash rate target has remained at 1.5 per cent since last August and financial market prices suggest that it is likely to remain unchanged over the period ahead. In line with developments in global markets, Australian government bond yields have declined over recent months, partly reversing the increase observed during 2016. Conditions for obtaining funding remain favourable for banks and non-financial corporations, with spreads of corporate bond yields to government bonds narrowing to relatively low levels. Despite this, growth in credit extended to businesses has slowed and non-financial corporate bond issuance has remained low. This has been particularly the case for the resources sector, where corporations have been using increased cash flows from higher resource prices to reduce debt. Housing credit growth has been stable in recent months; investor credit growth steadied after accelerating late last year. The major banks and a number of smaller banks have announced increases to lending rates for housing investors and interest-only loans, largely associated with measures introduced by the financial regulators to reinforce sound housing lending practices. Equity prices have increased since the start of the year, reflecting both global developments and a positive reaction to domestic corporate profit announcements.
Money Markets and Bond YieldsThe Reserve Bank has maintained the cash rate target at 1.5 per cent since August last year. Rates on overnight indexed swaps (OIS) suggest that
Graph 4.1
2014201020062002 20181
2
3
4
5
6
7
%
1
2
3
4
5
6
7
%Cash Rate*
* Data from June 2017 onwards are expectations derived frominterbank cash rate futures
Sources: ASX; Bloomberg
the cash rate is likely to remain unchanged over the remainder of this year (Graph 4.1).
Short-term interest rates in the repurchase agreement (repo) market remain high relative to OIS rates. Over the past couple of years, the repo rates at which the Reserve Bank conducts its open market operations have moved from being close to OIS rates to around 30 basis points above OIS rates. The wider spreads reflect heightened demand for secured funding from market participants, particularly non-residents, and appear to be related to developments in the foreign exchange swap market and the bond futures market.1 In particular, in the foreign exchange swap market, Australian dollars can be lent against yen at a relatively high implied Australian dollar interest rate; as a result, some investors have been borrowing Australian dollars under repo to use them for such foreign exchange swap transactions.
1 For more information, see Becker C, A Fang and J C Wang (2016), ‘Developments in the Australian Repo Market’, RBA Bulletin, September, pp 41–46.

R E S E R V E B A N K O F AU S T R A L I A4 0
(‘Kangaroo’ issuance) since the beginning of the year. Issuance was mainly from supranational agencies and offshore banks and generally for longer maturities than in previous years, continuing the trend from 2016. By converting the Australian dollars they raise into foreign currency using the foreign exchange swap market, Kangaroo issuers indirectly assist Australian corporations looking to hedge funding raised offshore back into Australian dollars. Secondary market spreads of AAA-rated Kangaroo bonds to AGS have been stable over the past few years.
Financial IntermediariesThe funding composition of banks has been little changed in recent months (Graph 4.4). There has been a noticeable pick-up in the share of term deposits since 2015. These deposits are treated more favourably than other types of funding under the net stable funding ratio (NSFR), which will be introduced by the Australian Prudential Regulation Authority (APRA) in 2018. Banks have indicated that competition for funding continues to be focused on these deposits, although the major banks have all indicated that their NSFRs are at or above the regulatory minimum.
Graph 4.3Government Bond Yields
10-year
2
4
6
%
2
4
6
%Australia
United States
Differential
20152013201120092007 20170
1
2
3
ppt
0
1
2
3
ppt
Sources: Bloomberg; RBA
Graph 4.2
2014 20162015 20170
10
20
30
40
50
bps
0
10
20
30
40
50
bpsBank Bills to Overnight Index Swap
1-month
6-month
3-month
Sources: ASX; Tullett Prebon (Australia)
Despite the elevated repo rates, short-term interest rates more closely related to bank funding costs have remained low. In particular, the unsecured interbank overnight interest rate – the cash rate – has continued to trade at the Reserve Bank’s target and spreads on bank bill rates have narrowed (Graph 4.2).
Yields on 10-year Australian Government Securities (AGS) followed movements in US Treasury yields and have declined by 40 basis points since early March (Graph 4.3). The spread between 10-year AGS and US Treasury yields has been around 30 basis points, which is close to its lowest level since 2001.
Demand for AGS remains strong and recent bond tenders have generally been well received. In addition, the Australian Office of Financial Management (AOFM) issued $11 billion of a new 10-year bond in February, which was the largest AGS syndication to date.
The level of outstanding semi-government bonds has been stable at around $240 billion so far this year, with issuance by Western Australia and Queensland offset by maturities from New South Wales.
There has been a large volume of bonds issued by non-residents in the domestic market

S TAT E M E N T O N M O N E TA R Y P O L I C Y | M AY 2017 4 1
Graph 4.4
2014201120082005 20170
10
20
30
40
50
60
%
0
10
20
30
40
50
60
%
Funding Composition of Banks in Australia*Share of total funding
Securitisation
Long-term debt
Domestic deposits
Short-term debt**
Equity
* Adjusted for movements in foreign exchange rates; tenor of debt isestimated on a residual maturity basis** Includes deposits and intragroup funding from non-residents
Sources: APRA; RBA; Standard & Poor’s
Graph 4.5
Graph 4.6Bank Bond Issuance
Gross issuance
M J S D0
40
80
120
$b Net issuance
Range (2010–16)
M J S D-50
-25
0
25
$b
2016
Average (2010–16)
2017
Source: RBA
Major Banks’ Wholesale Debt Cost*Short-term
20132009 20170
2
4
6
8
%
Marginal
Outstanding
Long-term
20132009 20170
2
4
6
8
%
* RBA estimates; rates do not include interest rate hedgesSources: Bloomberg; RBA
Overall, deposit funding costs are also estimated to have been stable in recent months. The ongoing shift in the composition of deposits towards term deposits has added to funding costs, with the rates on term deposits remaining elevated in comparison to other deposit rates. This compositional effect has been offset by a decline in interest rates on some at-call and term deposit products. Furthermore, the average cost of term deposits has declined a little, reflecting maturities of deposits that were entered into at higher interest rates in mid 2016.
Estimates of the average cost of the major banks’ debt funding have been little changed over recent months. The cost of issuing new long-term wholesale debt has declined a little, and is back below the cost of outstanding issuance (Graph 4.5). Short-term wholesale debt costs have been relatively stable.
Bond issuance by Australian banks has continued in recent months at around the average pace seen over recent years (Graph 4.6). The total level of outstanding bonds is little changed since the start of the year, as issuance has roughly matched bond maturities over that period.
Secondary market yields on the major banks’ bonds have declined since the start of the year. Spreads to benchmark rates have also narrowed, to be around their lowest levels for a couple of years (Graph 4.7).
Issuance of asset-backed securities has been strong since late last year, with non-bank mortgage originators issuing a large volume of residential mortgage-backed securities (RMBS) (Graph 4.8). This includes a $1.7 billion single issuance, which was the largest RMBS by a non-bank mortgage originator since 2007. Overall, the characteristics of the mortgages underlying these securities have been of similar quality to previous RMBS deals issued in Australia.

R E S E R V E B A N K O F AU S T R A L I A4 2
Graph 4.8
Graph 4.9
Graph 4.10
Major Banks’ Bond Pricing3–5 year residual maturity, Australian dollar bonds
Yields
20132009 20171
4
7
%
AGS
Swap
Bank bond (unsecured)
Bank bond spreads
20132009 20170
100
200
bps
Spreadto AGS
Spread to swap
Sources: Bloomberg; UBS AG, Australia Branch
Australian RMBSIssuance Major banks
Other banksNon-banks
10
20
$b
10
20
$b
Primary market pricing*
2014201120082005 20170
100
200
300
bps
0
100
200
300
bps
Bank conforming deals
Non-conforming dealsNon-bank conforming deals
* Face-value weighted monthly average of the primary market spreadto bank bill swap rate
Source: RBA
There has also been sizable issuance backed by other types of loans, including car and credit card loans. Primary issuance spreads on RMBS are little changed since the start of the year.
Financial AggregatesTotal credit growth has slowed in recent months, largely due to a decline in business credit growth, while housing credit growth has remained stable (Graph 4.9). Broad money has grown faster than total credit over the past year (Table 4.1).
Graph 4.7
2013200920052001 2017-10
0
10
20
%
-10
0
10
20
%
Credit Growth by Sector*Six-month-ended annualised
Business
Housing
Total**
* Seasonally adjusted and break-adjusted; including securitisation** Includes housing, personal and business creditSources: ABS; APRA; RBA
Household FinancingHousing credit growth was stable in recent months at an annualised rate of around 6½ per cent. Growth in credit extended to investors has steadied at an annualised pace of around 8 per cent, after accelerating through the second half of 2016. This stabilisation in investor credit growth is consistent with the slight reduction in investor loan approvals and may have been partly driven by the increases in interest rates for investors in late 2016 along with further tightening in lending standards by lenders around that time (Graph 4.10).
Housing Loan Approvals*Share of housing credit outstanding; excludes refinancing
20132009 20170.00
0.25
0.50
0.75
1.00
1.25
%
Investor
Owner-occupier
20132009 20170.20
0.50
0.80
1.10
1.40
1.70
%
Credit growth
Total
* Seasonally adjusted and break adjustedSources: APRA; RBA

S TAT E M E N T O N M O N E TA R Y P O L I C Y | M AY 2017 4 3
2014201120082005 20170
1
2
3
4
5
$b
0
1
2
3
4
5
$b
Housing Finance Approvals for New DwellingsHousehold approvals for purchase & construction*
Total new dwellings
Construction
Purchase ofnew dwellings
* Investor shares are RBA estimateSources: APRA; RBA
Graph 4.11
Table 4.1: Financial AggregatesPercentage change(a)
Three-month ended Year-endedDec 2016 Mar 2017 Mar 2017
Total credit 1.7 0.8 5.0– Housing 1.6 1.7 6.5 – Owner-occupier 1.4 1.5 6.2 – Investor 2.2 2.0 7.1– Personal –0.3 –0.5 –1.5– Business 2.2 –0.5 3.4Broad money 2.2 1.9 6.7(a) Growth rates are break adjusted and seasonally adjustedSources: APRA; RBA
Graph 4.12
201320092005 20170
2
4
6
8
$b
0
2
4
6
8
$b
Housing Loan Approvals*Excluding refinancing
Vic
NSW
SA
WAQld
* Seasonally adjustedSources: APRA; RBA
The decline in loan approvals in recent months has been driven by a decline in approvals in Victoria, while loan approvals in New South Wales have remained near record highs (Graph 4.11). Housing finance for new dwellings has been little changed recently following rapid growth through 2016; housing finance for the construction of new homes has remained stable (Graph 4.12). Overall, loans for new dwellings or dwellings under construction are estimated to have contributed more than half of credit growth over the past year. This contribution is expected to rise, based on the pipeline of residential construction work under way.
The major banks’ share of housing loan approvals has fallen in recent months to its lowest level since 2008. Most of this reduction appears to have been absorbed by other Australian and foreign banks (Graph 4.13). Housing credit issued by entities that are not licensed by APRA as authorised deposit-taking institutions (ADIs) is estimated to have increased slightly in recent quarters, but at around 3 per cent remains a very small share of housing credit.
The further increases in housing interest rates announced by some lenders in March and April and prudential guidance from APRA and ASIC regarding interest-only lending can be expected to affect housing credit growth over the months ahead.

R E S E R V E B A N K O F AU S T R A L I A4 4
Graph 4.13
As outlined in the April Financial Stability Review, the Council of Financial Regulators (CFR) has been monitoring and evaluating the risks to household balance sheets. APRA announced further measures in March 2017 to reinforce sound housing lending practices. ADIs will be expected to limit new interest-only lending to 30 per cent of total new residential mortgage lending and, within that, to tightly manage new interest-only loans extended at loan-to-value ratios above 80 per cent. APRA also reinforced the importance of banks: managing their lending so as to comfortably meet the existing investor credit growth benchmark of 10 per cent; using appropriate loan serviceability assessments, including the size of net income buffers; and continuing to exercise restraint on lending growth in higher risk segments. APRA also announced that it would monitor the growth in warehouse facilities provided by ADIs. These facilities are used by non-bank mortgage originators for short-term funding of loans until they are securitised.
In addition, the Australian Securities and Investments Commission (ASIC) announced in April further steps to ensure that interest-only loans are appropriate for borrowers’ circumstances and that remediation can be provided to borrowers
who suffer financial distress as a consequence of shortcomings in past lending practices.
Since February, the major banks have announced an average cumulative increase to their standard variable rates of around 25 basis points for investors and a few basis points for owner-occupiers. Also, borrowers will pay an additional premium for interest-only loans of around 15 basis points for investors and 20 basis points for owner-occupiers (Graph 4.14).
Graph 4.14
Housing Loan Approvals*Share of total
20132009 201760
65
70
75
80
85
%
Major banks
20132009 20170
3
6
9
12
15
%
Other Australianbanks
CUBS
Foreign banks
RFCs
* Seasonally adjusted; CUBS are credit unions and building societies;RFCs are registered financial corporations
Sources: APRA; RBA
2014 20162015 20175.00
5.25
5.50
5.75
%
5.00
5.25
5.50
5.75
%
Variable Housing Interest RatesMajor banks’ standard variable reference rates
Interest-only
Interest-only
Owner-occupierPrincipal & interest
Principal& interest
Investor
Sources: Banks’ websites; RBA
The rates actually paid on new variable rate loans are likely to differ from the major banks’ standard variable rates. The major banks and other lenders offer discounts to their standard variable rates, which can vary through time particularly for new borrowers; for example, in 2015, increases in interest rates on existing borrowers were reportedly accompanied by larger unadvertised discounts for new borrowers.
Overall, the increases that have been announced to date by lenders are expected to raise the average variable rate paid on outstanding housing loans by around 15 basis points. The average outstanding rate on all housing loans is expected to increase by slightly less than the variable rate since interest rates on new fixed-rate loans remain below those on outstanding fixed-rate loans (Table 4.2).

S TAT E M E N T O N M O N E TA R Y P O L I C Y | M AY 2017 4 5
Table 4.2: Intermediaries’ Lending Rates
Interest
rateChange since
November 2016Change since
April 2016 Per cent Basis points Basis points
Housing loans – Variable principal-and-interest rate(a) (b)
– Owner-occupier 4.48 3 –30 – Investor 4.97 28 –4
– Variable interest-only rate(a) (b)
– Owner-occupier 4.66 10 –19 – Investor 5.12 35 3
– Average outstanding rate(d) 4.63 11 –22Personal loans– Variable rate(e) 11.62 17 25Small business– Term loans variable rate(f ) 6.43 4 –32– Overdraft variable rate(f ) 7.31 4 –32– Fixed rate(c) (f ) 5.27 –3 –15– Average outstanding rate(d) 5.34 –2 –35Large businessAverage outstanding rate(d) 3.50 0 –46(a) Includes announced changes to new lending to May 2017(b) Average of the major banks’ discounted package rates on new, $500 000 full-doc loans(c) Average of the major banks’ 3-year fixed rates (d) RBA estimates, includes variable and fixed rates (e) Weighted average of variable rate products(f ) Residentially secured, average of the major banks’ advertised ratesSources: ABS; APRA; Canstar; RBA
Business FinancingBusiness credit growth has slowed recently after a pick-up at the end of 2016 associated with the financing of several large infrastructure deals. The slowdown in business credit growth is partly due to maturities of large loans in recent months; meanwhile business loan approvals have increased recently (Graph 4.15).
The slowdown in business credit growth partly reflects deleveraging by the mining sector following strong cash flows in the second half of 2016. Resource companies have reduced their debt levels through this period, including by repaying debt and refinancing loans for smaller amounts. This has been reflected in a fall in the stock of syndicated lending to the materials sector
Graph 4.15
20122007200219971992 2017-20
0
20
40
%
-20
0
20
40
%
Business Loan Approvals and CreditSix-month-ended annualised
Business credit growth
Loan approvals*(per cent of business credit)
* Net of refinancing and reductionsSources: ABS; APRA; RBA
over the past six months equivalent to a decline in total business credit of ½ per cent (Graph 4.16).

R E S E R V E B A N K O F AU S T R A L I A4 6
Graph 4.17
Graph 4.18
Graph 4.16
201620152014201320122011 201730
40
50
60
70
$b
30
40
50
60
70
$b
Syndicated Lending to Materials Sector
Sources: RBA; Thomson Reuters
201320092005 20172
4
6
8
%
2
4
6
8
%
Average Business Lending Rates*Average interest rate on outstanding lending
Small business
Large business
* RBA estimatesSources: APRA; RBA
Outside of the mining sector, demand for credit is uneven across industries. Lending to the manufacturing sector has declined, while according to liaison with banks, there has been stronger demand for credit from the infrastructure, agriculture, health and tourism sectors. Loan approvals for the construction of residential property have declined, although this follows very strong growth through 2016. In contrast, loan approvals for the purchase or construction of commercial property have risen recently.
The major banks’ share of new business loan approvals has fallen to relatively low levels, partly reflecting their efforts to reduce exposures to selected industries and larger companies (Graph 4.17). At the same time, foreign banks have increased their share of approvals. Asian banks have lower funding costs than many Australian banks and their increased market share is likely to partly reflect this competitive advantage. To date, most of the lending by the Asian banks has been to large businesses.
The major banks have announced increases in small business variable interest rates of up to 8 basis points. Outside of this, business lending rates have been broadly steady (Graph 4.18).
There continues to be limited bond issuance by resource companies as they have sought to reduce
Gross Business Loan ApprovalsShare of total; six-month moving average
20122007 201755
60
65
70
75
%
Major banks
20122007 20170
5
10
15
20
%
RFCs
Foreign banks
Other Australian banks
Sources: APRA; RBA
debt levels further (Graph 4.19). Bond issuance by other non-financial corporations has continued at a steady pace. Secondary market corporate bond spreads have continued to tighten for both resource and non resource companies back towards levels last seen in 2014 (Graph 4.20).
Net equity raisings by non-financial corporations was subdued in the March quarter, with no sizeable transactions of note. Following a large pick-up towards the end of 2016, merger and acquisition activity has been more modest in the year to date, with activity concentrated in the consumer discretionary, resources and industrials sectors.

S TAT E M E N T O N M O N E TA R Y P O L I C Y | M AY 2017 4 7
Resource-related corporationsOther non-financial corporations
201620152014201320122011 20170
5
10
15
$b
0
5
10
15
$b
Australian Corporate Bond Issuance*Australian dollar equivalent
* Latest quarter issuance to dateSource: RBA
Graph 4.19
Graph 4.20
Graph 4.21
Australian Corporate Bond PricingInvestment grade bonds, 5-year target tenor
Yield
2012 20160
2
4
6
8
%
AGS
Othernon-financialcorporations
Spread to AGS
2012 20160
100
200
300
400
bps
Resource-relatedcorporations
Sources: Bloomberg; RBA; S&P Capital IQ
201620152014 201780
100
120
index
80
100
120
index
Share Price Accumulation IndicesEnd December 2013 = 100
S&P 500
ASX 200
MSCI Worldexcluding US
Sources: MSCI; Thomson Reuters
Equity MarketsAustralian equity prices have largely followed global developments in recent months to be around 4 per cent higher since the start of the year (Graph 4.21). There was also a positive reaction to domestic company profit results.
Resources sector share prices have fallen since the start of the year, alongside a large fall in iron ore and oil prices. Financial sector share prices have continued their upward trend to be around 5 per cent higher since the start of the year.
Equity prices for companies outside the financial and resources sectors have increased, reflecting large increases for the healthcare and utilities sectors. Telecommunication stocks declined after lower-than-expected profit results and with the prospect of increased competition in the mobile phone market.
Following the latest round of company profit results, analysts’ earnings expectations for coming years were again revised higher. The sharp increase in resources sector earnings expectations has seen valuations (measured by forward price-earnings ratios) fall back towards their long-term average (Graph 4.22).
Graph 4.22ASX 200 Price-earnings Ratios
12-month-ahead earnings forecastsResources
10
15
20
ratio Other
10
15
20
ratio
Averagesince 2003
Financials
20122007 20175
10
15
20
ratio ASX 200
20122007 20175
10
15
20
ratio
Source: Thomson Reuters

R E S E R V E B A N K O F AU S T R A L I A4 8
Graph 4.23
Graph 4.24
ASX 200 ProfitsSemi-annual
ResourcesHeadline profit
0
20
$b Financials*Headline profit
OtherHeadline profit
0
20
$b
2010 20160
10
20
30
$b Underlying profit
2010 2016
Underlying profit
2010 20160
10
20
30
$bUnderlying profit
* The results of the major banks and Macquarie Group that reportedin October/November are rolled forward.
Sources: Company reports; Morningstar; RBA
compared with the same period last year. Increased competition and margin pressure continued to adversely affect earnings for the major supermarket chains. Meanwhile, strong residential construction and tourism activity continued to support earnings for some companies.
Aggregate shareholder distributions increased by 10 per cent in the second half of 2016 compared with the same period last year driven by the major miners paying higher dividends. Overall, dividends paid by companies outside the resources sector rose slightly.
The assets of Australian listed non-financial corporations increased by 3 per cent over the second half of 2016 (Graph 4.24). The expansion reflected an increase in resources sector assets, partly due to higher cash holdings, as well as asset growth in the healthcare and real estate sectors reflecting externally financed acquisitions and positive asset revaluations. This overall expansion in assets, together with a reduction in debt, resulted in gearing (the ratio of total debt to equity based on book values) declining by 5 percentage points to 54 per cent. R
Profit ReportingAggregate headline profits for ASX 200 companies rose substantially over the second half of 2016 compared with the same period in 2015, largely reflecting fewer asset write-downs in the resources sector (Graph 4.23). Abstracting from these one-off items, aggregate underlying profits were 15 per cent higher compared with the same period a year earlier, driven by a sharp turnaround in resources sector profits.
Listed Non-financial Corporations’Gearing Ratio
Book value gearing*
20092002 20160
25
50
75
100
% Components
20092002 20160
300
600
900
1 200
$b
Assets
Equity
Debt**
* Ratio of gross debt to equity; excludes foreign-domiciled companies** Debt only includes short-term and long-term loans and bonds payable;not equivalent to total liabilities
Sources: Morningstar; RBA
Underlying profits in the resources sector more than tripled compared with the same period last year, largely due to higher commodity prices. A number of resource companies used the increased cash flows to pay down debt, boost their cash holdings and increase shareholder dividends.
Financial companies’ underlying profits declined, largely driven by profit declines for the major banks that reported in October/November. By contrast, banks that reported more recently have recorded more positive results. Profits for diversified financial companies declined, while insurers’ profits rose.
Underlying profits for companies outside the resources and financial sectors declined

S TAT E M E N T O N M O N E TA R Y P O L I C Y | M AY 2017 4 9
5. Inflation
The March quarter inflation data were in line with the forecasts in the February Statement. Measures of underlying inflation were steady at around ½ per cent in the quarter, and picked up to 1¾ per cent over the year (Graph 5.1; Table 5.1). Headline inflation was also unchanged in the quarter at 0.5 per cent, and increased to 2.1 per cent over the year (Graph 5.2).
Domestic cost pressures remain subdued. Growth in labour costs has remained low, competitive conditions in the retail sector continue to put downward pressure on consumer prices and rent inflation remains low. Some of this downward pressure has been offset by a pick-up in inflation in fuel and utilities prices and in the cost of new dwelling construction.
Graph 5.1
2012200720021997 20170
1
2
3
4
5
%
0
1
2
3
4
5
%Measures of Underlying Inflation*
Trimmed mean(quarterly)
Weighted median(year-ended)
Trimmed mean(year-ended)
* Excludes interest charges prior to the September quarter 1998;adjusted for the tax changes of 1999–2000
Sources: ABS; RBA
Table 5.1: Measures of Consumer Price InflationPer cent
Quarterly(a) Year-ended(b)
March quarter 2017
December quarter 2016
March quarter 2017
December quarter 2016
Consumer Price Index 0.5 0.5 2.1 1.5Seasonally adjusted CPI 0.5 0.5 – Tradables 0.5 0.0 1.3 0.1 – Tradables (excl volatile items)(c) –0.1 –0.6 –0.9 –0.5 – Non-tradables 0.7 0.8 2.6 2.1Selected underlying measures
Trimmed mean 0.5 0.5 1.9 1.6Weighted median 0.4 0.4 1.7 1.4CPI excl volatile items(c) 0.4 0.3 1.5 1.3(a) Except for the headline CPI, quarterly changes are based on seasonally adjusted data; those not published by the ABS are calculated
by the RBA using seasonal factors published by the ABS(b) Year-ended changes are based on non-seasonally adjusted data, except for the trimmed mean and weighted median(c) Volatile items are fruit, vegetables and automotive fuelSources: ABS; RBA
An increase in the tobacco excise also boosted headline inflation over the year.

R E S E R V E B A N K O F AU S T R A L I A5 0
Graph 5.3Tradable and Non-tradable Inflation*
Tradables excl volatilesTradables excl volatiles
0
2
4
%
0
2
4
%
Quarterly(seasonally adjusted)
Year-ended
Non-tradables**Non-tradables**
2012200720021997 2017-2
0
2
4
%
-2
0
2
4
%
* Adjusted for the tax changes of 1999–2000** Excludes interest charges and deposit & loan facilitiesSources: ABS; RBA
Non-tradable inflation was little changed at 0.7 per cent in the quarter and rose to 2.6 per cent over the year. Inflation in this group has been boosted by both higher tobacco and utilities prices over the year.1 Apart from these components, non-tradable inflation has been
1 Following an ABS review of the international trade exposure of CPI components, the December quarter 2016 CPI release contained a reclassification of a number of expenditure classes between tradables and non-tradables. The most notable was the reclassification of tobacco from tradable to non-tradable.
Graph 5.4Retail Inflation
Selected items, year-ended
0
5
% Furniture &household appliances
AVC*
-10
-5
%
Clothing & footwear
20122007 2017-6
-4
-2
0
2% Food & alcohol**
20122007 2017-2
0
2
4
6%
* Includes audio, visual and computing equipment & services** Excludes fruit and vegetablesSources: ABS; RBA
Prices of tradable items (excluding volatiles) fell a little in the March quarter to be almost 1 per cent lower over the year (Graph 5.3). The 7 per cent appreciation of the trade-weighted index over the year to the March quarter is likely to have contributed a little to the downward pressure on tradable prices. Inflation in prices for food and clothing & footwear has been low as a result of efforts from both established retail firms and new entrants to gain market share by competing on prices (Graph 5.4). Low growth in labour costs and retail rents has also contributed to weak inflationary pressure. Recent inflation outcomes suggest that some of these competitive forces may be increasing in some retail segments, such as furniture & household appliances. The arrival of further new foreign retailers will be an important influence on final retail prices over the next few years.
Fruit & vegetable prices increased in the March quarter and inflation for these items remains high over the year. There was little impact from Cyclone Debbie in the March quarter CPI because it occurred so late in the quarter. However, the cyclone caused damage to the crops of some specific fruit and vegetables, which will boost their prices in the next couple of quarters.
Graph 5.2
2012200720021997 2017-1
0
1
2
3
4
%
-1
0
1
2
3
4
%Consumer Price Inflation*
(seasonally adjusted)Quarterly
Year-ended
* Excludes interest charges prior to the September quarter 1998;adjusted for the tax changes of 1999–2000
Sources: ABS; RBA

S TAT E M E N T O N M O N E TA R Y P O L I C Y | M AY 2017 5 1
Graph 5.5
Graph 5.6
2013200920052001 2017-9
-6
-3
0
3
%
-9
-6
-3
0
3
%Telecommunication Inflation*
Year-ended
Quarterly(seasonally adjusted)
* Includes telecommunication equipment & servicesSources: ABS; RBA
New dwelling cost inflation increased in the March quarter (Graph 5.7). This was a result of higher materials costs; reports of wage pressure in the construction sector are mixed. For the first time, this component now includes the cost of building apartments (as well as detached houses). Inflation in the cost of building apartments has been slightly lower than for detached houses over the past year. Rent inflation remains low, particularly in Perth. The substantial increase in supply of apartments in other cities has contributed to low rental growth, although conditions vary across capital cities, reflecting differences in the amount of new supply, population growth and vacancy rates.
relatively subdued. Inflation in market services remains low, consistent with low growth in unit labour costs (Graph 5.5). Technology-driven price declines for telecommunication equipment & services also continues to put downward pressure on non-tradable inflation (Graph 5.6). Declines in prices in this component have subtracted an average of 0.2 percentage points from annual non-tradable inflation since the beginning of 2015. Nevertheless, deflation in this component has slowed over the past two quarters.
Housing Cost InflationRentsRents
20122007 2017-2
0
2
4
6
8
%
-2
0
2
4
6
8
%
Quarterly(seasonally adjusted)
Year-ended
New dwellingsNew dwellings
20122007 2017-2
0
2
4
6
8
%
-2
0
2
4
6
8
%
Sources: ABS; RBA
Graph 5.7
2012200720021997 2017-2
0
2
4
6
%
-2
0
2
4
6
%
Market Services InflationYear-ended
Market services*
Unit labour cost growth**
* Excludes telecommunications equipment & services; domestic travel,housing services, interest charges and deposit & loan facilities;adjusted for the tax changes of 1999–2000** Non-farm; moved forward by four quarters
Sources: ABS; RBA
Inflation in utilities prices picked up in the March quarter, and year-ended inflation for these items reached its fastest pace since 2014 (Graph 5.8). Wholesale gas and electricity prices have increased strongly over the past year, largely reflecting an increase in demand for gas for liquefied natural gas production. Furthermore, the recent closure of coal-powered electricity plants will continue to boost electricity prices in the near term. This has started to flow through to retail prices, and will also increase input costs for businesses. Previous Bank estimates suggest that

R E S E R V E B A N K O F AU S T R A L I A5 2
a 10 percentage point increase in utilities price inflation is associated with a 0.3–0.4 percentage point increase in underlying inflation, over and above the direct effects.2 Excluding utilities, inflation in administered prices slowed in the quarter, partly due to falls in education fees and public transport fares.
Measures of inflation expectations remain low, though most are a bit higher than the lows reached in 2016. Short-term union and consumer expectations have risen in recent months, while other short-term measures have been little changed (Graph 5.9). Long-term survey-based measures of inflation expectations are around 2.5 per cent (Graph 5.10). After increasing over the second half of 2016, financial market measures of inflation expectations have stabilised; both the bond and swap measures remain at higher levels than a year ago. R
2 See Plumb M and K Davis (2010), ‘Developments in Utilities Prices’, RBA Bulletin, December, pp 9–17.
Utilities Price InflationElectricityElectricity
2010 2017-10
-5
0
5
10
15
%
2010 2017
Gas*
(seasonally adjusted)Quarterly
endedYear-
Water & sewerageWater & sewerage
2010 2017-10
-5
0
5
10
15
%
* Includes other household fuelsSources: ABS; RBA
Graph 5.8 Graph 5.9
Graph 5.10Long-term Inflation Expectations
1
2
3
4%
1
2
3
4%
Unions*
Consensus Economics**
20122007200219971992 20170
1
2
3
4%
0
1
2
3
4%
10-year indexed bondsInflation swaps***
* Average over the next five to ten years** Average over six to ten years in the future*** Five-to-ten-year forwardSources: Australian Council of Trade Unions; Bloomberg; Consensus
Economics; RBA; Workplace Research Centre; Yieldbroker
20132009200520011997 20170
2
4
6
%
0
2
4
6
%
Short-term Inflation ExpectationsOver the next year
MarketeconomistsUnions Inflation swaps
Consumers*
* SmoothedSources: Australian Council of Trade Unions; Bloomberg; Melbourne
Institute of Applied Economic and Social Research; RBA;Workplace Research Centre

S TAT E M E N T O N M O N E TA R Y P O L I C Y | M AY 2017 5 3
6. Economic Outlook
Graph 6.1
RBA forecast
20122006200019941988 2018-2
0
2
4
6
%
-2
0
2
4
6
%
Australia’s Trading Partner Growth*Year-average
* Aggregated using total export sharesSources: ABS; CEIC Data; RBA; Thomson Reuters
The International EconomyThe outlook for growth in Australia’s major trading partners is little changed since the previous Statement, following upward revisions to the forecast in late 2016 and early 2017. The improvement in global economic conditions last year has been maintained in early 2017, and major trading partner growth is forecast to be around its long-run average this year before easing slightly in 2018 (Graph 6.1). Global growth – which includes economies that do not have a significant trade relationship with Australia – is expected to pick up over the next couple of years to around its long-run average (Graph 6.2). Since late 2016, most forecasters have revised up their forecasts for global growth.
In China, growth in 2017 is forecast to be only a bit lower than last year as the authorities continue to support economic activity to achieve their annual GDP growth target. Growth in China
is then expected to continue to ease gradually because of longer-run factors, including the decline in the working-age population and lower productivity growth. The east Asian economies (other than China and Japan) are expected to grow at around potential over the forecast period, supported by accommodative monetary and fiscal policies and the improvement in the global economy since last year. GDP growth in the major advanced economies is likely to be above potential over the next couple of years, partly because monetary policies are expected to remain accommodative and US fiscal policy is expected to be expansionary. Potential growth rates in these economies are lower than their long-term average growth rates owing to lower growth in the working-age population, the capital stock and productivity.
Considerable uncertainty remains about the economic policies of the US administration,
Graph 6.2
IMF forecast
20122006200019941988 2018-2
0
2
4
6
%
-2
0
2
4
6
%
World GDP Growth*Year-average
* PPP-weighted; forecasts from April 2017Source: IMF

R E S E R V E B A N K O F AU S T R A L I A5 4
which recently announced a proposal for tax reform involving substantial cuts in personal and corporate taxes. The proposal faces significant hurdles in passing through Congress, and so the magnitude and timing of any policy changes is uncertain. Changes in fiscal policy are expected to increase growth in the United States at a time when there is limited spare capacity in the US labour market, thereby increasing inflationary pressures. This could have spillovers to higher growth and inflation in other economies, depending on how exchange rates respond. However, there is a risk that more restrictive and protectionist trade and immigration policies in the United States could harm global growth prospects.
The increase in the prices of oil and other commodities in 2016 contributed to a pick-up in global headline inflation; these effects will diminish unless commodity prices rise further. Measures of wage growth in some economies have picked up, following a period of subdued growth. In the major advanced economies, wage pressures are expected to continue to increase as spare capacity in labour and product markets declines further; in the United States and Japan, growth in unit labour costs is already above average. A number of major advanced economies look to be around full employment, although this is a source of uncertainty. If there is less spare capacity than assumed, inflation could rise more quickly than currently forecast, which could lead to tighter monetary policy in some advanced economies and a depreciation of the Australian dollar.
Australia’s terms of trade are estimated to have increased further in the March quarter, but are still expected to decline over the forecast period because of falls in commodity prices (Graph 6.3). The near-term forecast for the terms of trade has been revised slightly higher since the previous
Statement, largely because of the sharp increases in coking coal prices after Cyclone Debbie damaged key railway networks and shut down coal shipping ports in the Bowen Basin region in late March. The rail lines reopened at reduced capacity in late April. Thermal coal prices are also a little higher because of the effects of Cyclone Debbie and changes in Chinese government policies to further reduce overcapacity in the Chinese coal industry. The recent decline in the spot price of iron ore has been broadly in line with expectations. Further out, the forecast for the terms of trade is little changed from the previous Statement; the terms of trade are expected to decline, but to remain above the trough in early 2016.
Domestic ActivityThe domestic forecasts are conditioned on a number of technical assumptions. The cash rate is assumed to move broadly in line with market pricing. This assumption does not represent a commitment by the Reserve Bank Board to any particular path for policy. The exchange rate is assumed to remain at its current level over the forecast period (trade-weighted index (TWI) at 64 and A$ = US$0.74), which is slightly lower
Graph 6.3
2009199919891979 201950
75
100
125
index
50
75
100
125
index
Terms of Trade2014/15 average = 100, log scale
Forecast
Sources: ABS; RBA
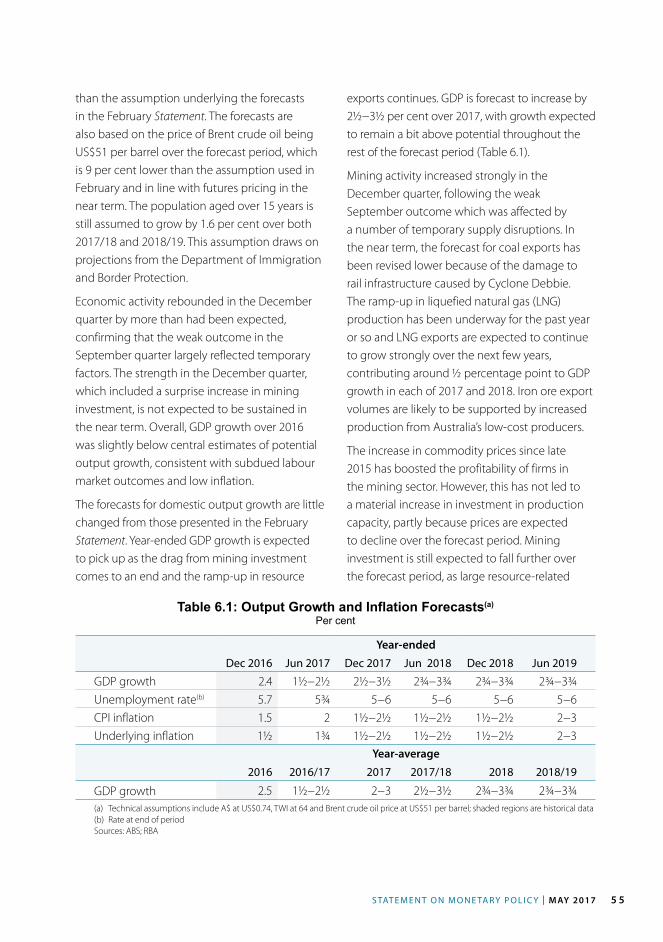
S TAT E M E N T O N M O N E TA R Y P O L I C Y | M AY 2017 5 5
than the assumption underlying the forecasts in the February Statement. The forecasts are also based on the price of Brent crude oil being US$51 per barrel over the forecast period, which is 9 per cent lower than the assumption used in February and in line with futures pricing in the near term. The population aged over 15 years is still assumed to grow by 1.6 per cent over both 2017/18 and 2018/19. This assumption draws on projections from the Department of Immigration and Border Protection.
Economic activity rebounded in the December quarter by more than had been expected, confirming that the weak outcome in the September quarter largely reflected temporary factors. The strength in the December quarter, which included a surprise increase in mining investment, is not expected to be sustained in the near term. Overall, GDP growth over 2016 was slightly below central estimates of potential output growth, consistent with subdued labour market outcomes and low inflation.
The forecasts for domestic output growth are little changed from those presented in the February Statement. Year-ended GDP growth is expected to pick up as the drag from mining investment comes to an end and the ramp-up in resource
Table 6.1: Output Growth and Inflation Forecasts(a)
Per cent
Year-ended
Dec 2016 Jun 2017 Dec 2017 Jun 2018 Dec 2018 Jun 2019
GDP growth 2.4 1½−2½ 2½−3½ 2¾−3¾ 2¾−3¾ 2¾−3¾Unemployment rate(b) 5.7 5¾ 5−6 5−6 5−6 5−6CPI inflation 1.5 2 1½−2½ 1½−2½ 1½−2½ 2−3Underlying inflation 1½ 1¾ 1½−2½ 1½−2½ 1½−2½ 2−3
Year-average
2016 2016/17 2017 2017/18 2018 2018/19
GDP growth 2.5 1½−2½ 2−3 2½−3½ 2¾−3¾ 2¾−3¾(a) Technical assumptions include A$ at US$0.74, TWI at 64 and Brent crude oil price at US$51 per barrel; shaded regions are historical data(b) Rate at end of periodSources: ABS; RBA
exports continues. GDP is forecast to increase by 2½−3½ per cent over 2017, with growth expected to remain a bit above potential throughout the rest of the forecast period (Table 6.1).
Mining activity increased strongly in the December quarter, following the weak September outcome which was affected by a number of temporary supply disruptions. In the near term, the forecast for coal exports has been revised lower because of the damage to rail infrastructure caused by Cyclone Debbie. The ramp-up in liquefied natural gas (LNG) production has been underway for the past year or so and LNG exports are expected to continue to grow strongly over the next few years, contributing around ½ percentage point to GDP growth in each of 2017 and 2018. Iron ore export volumes are likely to be supported by increased production from Australia’s low-cost producers.
The increase in commodity prices since late 2015 has boosted the profitability of firms in the mining sector. However, this has not led to a material increase in investment in production capacity, partly because prices are expected to decline over the forecast period. Mining investment is still expected to fall further over the forecast period, as large resource-related

R E S E R V E B A N K O F AU S T R A L I A5 6
projects are completed and few new projects are expected to commence. However, the drag on overall domestic activity from falling investment in the resources sector is expected to be limited, as most of the remaining decline is related to LNG projects, which are import intensive and use relatively little labour.
Growth in household spending in the December quarter picked up by more than had been expected. Indicators such as retail sales and consumer sentiment point to a moderation in household consumption growth in early 2017. For the remainder of the forecast period, household consumption is forecast to grow at a bit above its average since the financial crisis, as had been expected at the time of the February Statement. Household income is expected to grow at a similar rate to consumption, implying little change in the household saving ratio.
Dwelling investment is expected to continue to contribute to GDP growth over the next year or so, particularly given the large volume of new apartment construction in the pipeline, although the contribution to growth is likely to diminish over time. In the March quarter, growth in dwelling investment may have been affected by rain-related disruptions to construction in Sydney.
Non-mining business investment has risen modestly since mid 2015, supported by low interest rates and the earlier depreciation of the exchange rate. However, non-mining business investment as a share of GDP remains low relative to its history. The outlook over the next year or so is subdued, consistent with the Australian Bureau of Statistics (ABS) capital expenditure survey of firms’ investment intentions and the downward trend in non-residential building work yet to be done. Growth in non-mining business investment is expected to pick up later in the forecast period as the spillover effects from falling
mining investment dissipate and aggregate demand growth increases.
Employment growth has picked up a little since late last year, as had been expected, following below-average growth over much of 2016. Leading indicators of labour demand, such as job advertisements and vacancies, point to moderate employment growth over the next six months. Further out, employment growth is expected to be fairly steady at around its long-run average. Even though overall GDP growth is forecast to be above potential, the boost to GDP from higher LNG production is not expected to generate significant employment growth. This is because LNG production is very capital intensive and requires relatively few employees, a sizeable portion of LNG profits will flow to foreign investors and tax revenue will be constrained by deductions (such as depreciation).
Labour force participation has been a little stronger recently than expected and the unemployment rate is currently a little higher than was forecast at the time of the February Statement. From this higher starting point, the unemployment rate is expected to edge slightly lower over the forecast period. This suggests that spare capacity in the labour market will remain over the next few years. The participation rate is assumed to remain at around current levels over the forecast period.
Wage growth is expected to remain at around its current rate over the next year, which is consistent with information from the Bank’s liaison program and a survey of union wage expectations. Wage growth is then expected to pick up gradually over 2018 and 2019, although at a slightly slower pace than had been forecast in February. The level of real wages is forecast to increase, having been fairly flat over the past couple of years. Spare capacity in the labour market is expected to continue to weigh on
S TAT E M E N T O N M O N E TA R Y P O L I C Y | M AY 2017 5 7
wage growth over the next few years. However, some of the other factors that have been putting downward pressure on wage growth over recent years are expected to dissipate gradually. For example, the declines in wage growth in mining-exposed states and industries are likely to be less pronounced over the next few years as the drag on economic activity from falling mining investment and the earlier decline in the terms of trade fades. Higher headline inflation should also contribute to wage pressures.
InflationThe March quarter inflation outcome was consistent with expectations at the time of the February Statement. Measures of underlying inflation are expected to pick up a little further to be around 2 per cent in early 2018. Headline inflation was just above 2 per cent over the year to the March quarter; it was higher than underlying inflation because of increases in tobacco and fuel prices. Headline inflation is expected to be between 2 and 3 per cent throughout the forecast period, partly because of further tobacco excise increases and utilities price inflation. These forecasts are little changed from the previous Statement.
Wage growth is expected to pick up gradually over the forecast period and labour productivity growth is expected to remain around its current rate. This implies that there will be a modest pick-up in unit labour costs over the forecast period, which will tend to push up inflation, particularly for non-tradable goods and services. Prices of tradable items (excluding volatiles) have been flat or falling for most of the past five years, despite the boost from the depreciation of the exchange rate during that period. This is because heightened retail competition and low wage growth have had a disinflationary effect on prices in supermarkets and for clothing & footwear. There is some evidence that these competitive forces
may have started to spread to other retail items, such as furniture. Furthermore, the entry of new foreign retailers into the Australian market over the next few years could constrain retail price inflation.
There are a number of other forces affecting inflation. Large additions to housing supply, both over recent years and over the next year or so, are expected to increase vacancy rates and keep rent inflation low over the next few years; rents have a weight of around 7 per cent in the CPI. On the other hand, new dwelling cost inflation is not expected to ease significantly and the legislated tobacco excise increases are expected to add a bit more than ¼ percentage point to headline inflation in each of the next couple of years. Following a sizeable increase in electricity and gas prices in the March quarter, utilities inflation is expected to continue to pick up in the period ahead, which will have both direct and indirect effects on inflation.
Key UncertaintiesThe forecasts are based on a range of assumptions about the evolution of some variables, such as the exchange rate and the cash rate, and judgements about how developments in one part of the economy will affect others. One way of demonstrating the uncertainty surrounding the central forecasts is to present confidence intervals based on historical forecast errors (Graph 6.4; Graph 6.5; Graph 6.6). It is also worth considering the implications of different assumptions and judgements for the forecasts and the possibility of events occurring that are not part of the central forecast.
Momentum in the global economy
The improvement in global growth since late 2016 has been quite broad based geographically. However, it remains possible that the upswing could be derailed by geopolitical events.

R E S E R V E B A N K O F AU S T R A L I A5 8
Increased trade protectionism would also lower global growth prospects. There is still considerable uncertainty about trade policy in the United States and how authorities in other economies might respond to any changes to existing arrangements. On the other hand, there is some chance that the upswing could turn into a self-sustaining expansion that is stronger than expected. The pick-up in global economic conditions since last year was more pronounced than had been anticipated, and follows a sustained period of subdued growth in global trade and investment.
The Chinese economy and commodity prices
The outlook for the Chinese economy remains an important source of uncertainty for commodity prices and Australia’s exports. Conditions in the Chinese housing market have been stronger than expected, despite the sharp slowing in housing price growth in cities where tightening measures have been introduced. Continued efforts to lower price growth and reduce speculative activity in the housing market could dampen residential investment. If conditions in the Chinese housing market ease by more than expected, growth in demand for steel, and therefore iron ore and coking coal, could be lower than expected.
There is also uncertainty about how the authorities will respond to the continued rise in leverage in the Chinese economy, including in the large and somewhat opaque ‘shadow banking’ sector. The authorities face a difficult trade-off between supporting GDP growth to meet their short-term economic targets and preventing a further build-up of financial risks. While Chinese financial conditions overall have remained accommodative this year, conditions in money markets and the corporate bond market have tightened somewhat. Moreover, the lower target for growth in total social financing in 2017 could indicate an intention by the authorities
Graph 6.6
2015201120072003 20193
4
5
6
7
%
3
4
5
6
7
%
Unemployment Rate Forecast*Quarterly
90 per cent interval
70 per cent interval
* Confidence intervals reflect RBA forecast errors since 1993Sources: ABS; RBA
Graph 6.4
Graph 6.5
2017201520132011 20190
2
4
%
0
2
4
%
GDP Growth Forecast*Year-ended
90 per cent interval
70 per cent interval
* Confidence intervals reflect RBA forecast errors since 1993Sources: ABS; RBA
2017201520132011 20190
1
2
3
%
0
1
2
3
%
Trimmed Mean Inflation Forecast*Year-ended
70 per cent interval
90 per cent interval
* Confidence intervals reflect RBA forecast errors since 1993Sources: ABS; RBA

S TAT E M E N T O N M O N E TA R Y P O L I C Y | M AY 2017 5 9
to tighten monetary conditions modestly this year, and the authorities have also signalled that they will take a stricter regulatory approach to managing financial risks, both of which could weigh on GDP growth.
Spare capacity in the labour market
Spare capacity in the labour market over recent years has put downward pressure on wage growth and inflation. While the central forecast is for the unemployment rate to edge slightly lower over the forecast period, there is uncertainty about how much spare capacity there will be over the next few years. For example, the recent pick-up in national income from the higher terms of trade could flow through to stronger growth in economic activity and employment than assumed. The composition of GDP growth might also be associated with more employment growth than forecast. In both cases, it is likely that the unemployment rate would fall by more than expected currently.
The amount of spare capacity in the labour market can also be affected by firms adjusting the hours worked by their existing employees (rather than changing the number of employees). In 2016, firms reduced the average hours worked by their employees, which may have prevented an increase in the unemployment rate. Growth in part-time employment was relatively strong over 2016, and around one-quarter of all part-time workers indicate that they want to work additional hours. As a result, the underemployment rate has edged higher. It is likely that these underemployed workers have put some downward pressure on wage growth, given that they would like to work more hours, although it is uncertain how much influence they have on wage outcomes compared with the unemployed. It is possible that growth in firms’ demand for labour could be met by increasing the hours of these part-time workers,
which would reduce underemployment without necessarily reducing the unemployment rate.
Consumption and housing
Household consumption is influenced by households’ expectations about growth in their incomes and wealth, as well as any constraints that they might face in accessing finances. On the one hand, if the terms of trade fall later or by less than anticipated, this could lead to stronger growth in household income and wealth than currently expected (via dividends and superannuation, and possibly wages in some industries). This, in turn, could generate more spending than currently envisaged. The pick-up in global economic conditions since last year might also improve households’ expectations about future income growth. On the other hand, elevated levels of household debt mean that households are likely to be more sensitive to any deterioration in expected income growth. For example, if indebted households believe that their prospects for income growth have weakened, they could choose to pay down debt faster and consumption growth could be lower than forecast.
Housing prices have grown briskly in Sydney and Melbourne over the past year. In the short term, this could see more household spending and renovation activity than is currently anticipated, but a continuation of these trends would raise medium-term risks. The recent tightening in prudential standards and higher interest rates on some mortgage products are likely to weigh on credit growth, particularly for investors. Investor activity is currently strong in Sydney and Melbourne, but history shows that sentiment can turn quickly, especially if prices start to fall. A substantially weaker housing market could have broader implications, including slower growth in consumption and dwelling investment than expected. Consumer price inflation could also be

R E S E R V E B A N K O F AU S T R A L I A6 0
lower than forecast because of weaker growth in economic activity and lower housing cost inflation.
Inflation
As has been the case for some time, there is considerable uncertainty around the timing and extent to which domestic cost pressures will rise over the next few years. As wages are the largest component of business costs, the outlook for wage growth is particularly important for the inflation outlook. The recovery in wage growth could be stronger than anticipated if conditions in the labour market tighten by more than assumed, or if employees demand wage increases to compensate for the sustained period of low real wage growth. However, it could be the case that some of the factors currently weighing on wage growth, such as underemployment in the labour market or structural forces such as technological change, are more persistent or pervasive than assumed. The path of inflation will also depend on whether the heightened competitive pressures in the
retail sector continue to constrain inflation. On the other hand, the earlier increases in global commodity prices and increases in domestic utilities prices could flow through to domestic inflation (through higher business costs) by more than assumed.
Another factor affecting the outlook for CPI inflation is that the weight assigned to each expenditure class in the CPI will be updated in the December quarter 2017 CPI release. Measured CPI inflation is known to be upwardly biased because the weight assigned to each expenditure class is fixed for a number of years. This means that the CPI does not take into account changes in consumer behaviour in response to relative price changes (known as ‘substitution bias’). As a result, the forthcoming re-weighting is expected to reduce measured inflation, although it is hard to predict by how much because the effects of past re-weightings have varied significantly and are not necessarily a good guide to future episodes. The ABS plans to re-weight the CPI annually in future, which will reduce substitution bias on an ongoing basis. R