Statement of Use of System Charges - National Grid plc · The Statement of Use of System Charges...
51
Issue Revision 13 0 The Statement of Use of System Charges Effective from 1 April 2017 Based Upon: The Statement of the Connection Charging Methodology and The Statement of the Use of System Charging Methodology contained within Section 14 Parts I and II respectively of the Connection and Use of System Code This is a copy of the statement provided to Ofgem on 13 February 2017 for approval of form under licence condition C4.8.
Transcript of Statement of Use of System Charges - National Grid plc · The Statement of Use of System Charges...
Issue Revision
13 0
The Statement of Use of System Charges
Effective from 1 April 2017
Based Upon:
The Statement of the Connection Charging Methodology and
The Statement of the Use of System Charging Methodology
contained within
Section 14 Parts I and II respectively of the Connection and Use of System Code
This is a copy of the statement provided to Ofgem on 13 February 2017 for approval of form under licence condition C4.8.
The Statement of Use of System Charges (DRAFT) April 2017
2
Contents
INTRODUCTION 3 SCHEDULE 1 4
Basis of 2017/18 Transmission Network Use of System Charges 4 Schedule of Transmission Network Use of System Wider Zonal Generation Charges (£/kW) in 2017/18 6 Schedule of Annual Load Factors for 2017/18 7 Schedule of Transmission Network Use of System Local Substation Generation Charges (£/kW) in 2017/18 11 Schedule of Transmission Network Use of System Local Circuit Charges (£/kW) in 2017/18 13 Schedule of Transmission Network Use of System STTEC and LDTEC Charges in 2017/18 15 Schedule of Pre-Asset Transfer Related Embedded Transmission Use of System Charges in 2017/18 20 Schedule of Transmission Network Use of System Demand Charges (£/kW) and Energy Consumption Charges (p/kWh) for 2017/18 21 Zonal Maps Applicable for 2017/18 23
SCHEDULE 2 25 Detail of the External Incentive Scheme for the Balancing Services Use of System Charges for 2017/18 25 External Incentive Structure and Payments for 2017/18 25
Balancing Services Incentive Scheme (BSIS) 25 Forecast Incentive (FIIR) 26 SO TO mechanism (SOTOCt) 26 Black Start Allowed Revenue 26
SCHEDULE 3 27 Application Fees for Connection and Use of System Agreements 27
Reconciliation and Refunding of Application Fees for Connection and Use of System Agreements 27 Entry Application Fees for New Bilateral Agreements 28 Application Fees for New Bilateral Agreements and Modifications to existing Bilateral Agreements 29
SCHEDULE 4 39 Charge-Out Rates for Engineering Charges for Variable Price Applications 39
SCHEDULE 5 40 Non-Capital Components applicable for Maintenance and Transmission Running Costs in Connection Charges for 2017/18 40
Part A: Site Specific Maintenance Charges 40 Part B: Transmission Running Costs 40
Illustrative Connection Asset Charges 41 APPENDIX 1: ILLUSTRATIVE CONNECTION ASSET CHARGES 42
2017/18 First Year Connection Charges based on the RPI Method (6% rate of return) 42 Connection Examples 46
APPENDIX 2: EXAMPLES OF CONNECTION CHARGE CALCULATIONS 49

April 2017 The Statement of Use of System Charges (DRAFT)
3
Introduction This statement is published in accordance with the Transmission Licence of National Grid Electricity Transmission plc (National Grid). This document sets out the annual tariffs for Transmission Network Use of System charges and the parameters used to calculate these; details of the Balancing Services Incentive Scheme which forms part of the Balancing Services Use of System Charges; and fees charged by National Grid in relation to applications for connection, use of system and engineering works. Further information on the methods by which and principles upon which National Grid derives Use of System charges is set out in the Statement of the Use of System Charging Methodology which is included in Section 14 of the Connection and Use of System Code (CUSC) which is available on our website at: http://www2.nationalgrid.com/UK/Industry-information/Electricity-codes/CUSC/The-CUSC/ If you require further detail on any of the information contained within this document or have comments on how this document might be improved please contact our Charging Team, preferably by email at: [email protected] or at: National Grid House Warwick Technology Park Gallows Hill Warwick CV34 6DA Telephone 01926 654633
The Statement of Use of System Charges (DRAFT) April 2017
4
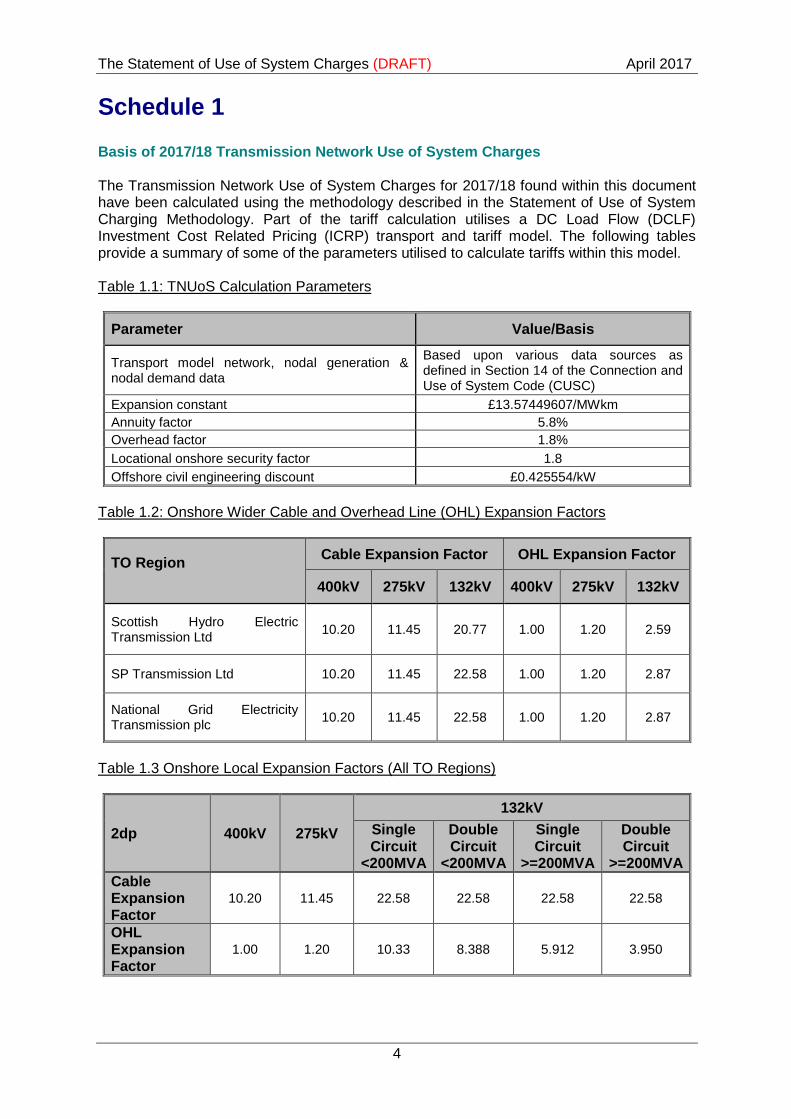
Schedule 1 Basis of 2017/18 Transmission Network Use of System Charges The Transmission Network Use of System Charges for 2017/18 found within this document have been calculated using the methodology described in the Statement of Use of System Charging Methodology. Part of the tariff calculation utilises a DC Load Flow (DCLF) Investment Cost Related Pricing (ICRP) transport and tariff model. The following tables provide a summary of some of the parameters utilised to calculate tariffs within this model. Table 1.1: TNUoS Calculation Parameters
Parameter Value/Basis
Transport model network, nodal generation & nodal demand data
Based upon various data sources as defined in Section 14 of the Connection and Use of System Code (CUSC)
Expansion constant £13.57449607/MWkm
Annuity factor 5.8%
Overhead factor 1.8%
Locational onshore security factor 1.8
Offshore civil engineering discount £0.425554/kW
Table 1.2: Onshore Wider Cable and Overhead Line (OHL) Expansion Factors
TO Region
Cable Expansion Factor OHL Expansion Factor
400kV 275kV 132kV 400kV 275kV 132kV
Scottish Hydro Electric Transmission Ltd
10.20 11.45 20.77 1.00 1.20 2.59
SP Transmission Ltd 10.20 11.45 22.58 1.00 1.20 2.87
National Grid Electricity Transmission plc
10.20 11.45 22.58 1.00 1.20 2.87
Table 1.3 Onshore Local Expansion Factors (All TO Regions)
2dp 400kV 275kV
132kV
Single Circuit
<200MVA
Double Circuit
<200MVA
Single Circuit
>=200MVA
Double Circuit
>=200MVA
Cable Expansion Factor
10.20 11.45 22.58 22.58 22.58 22.58
OHL Expansion Factor
1.00 1.20 10.33 8.388 5.912 3.950
April 2017 The Statement of Use of System Charges (DRAFT)
5
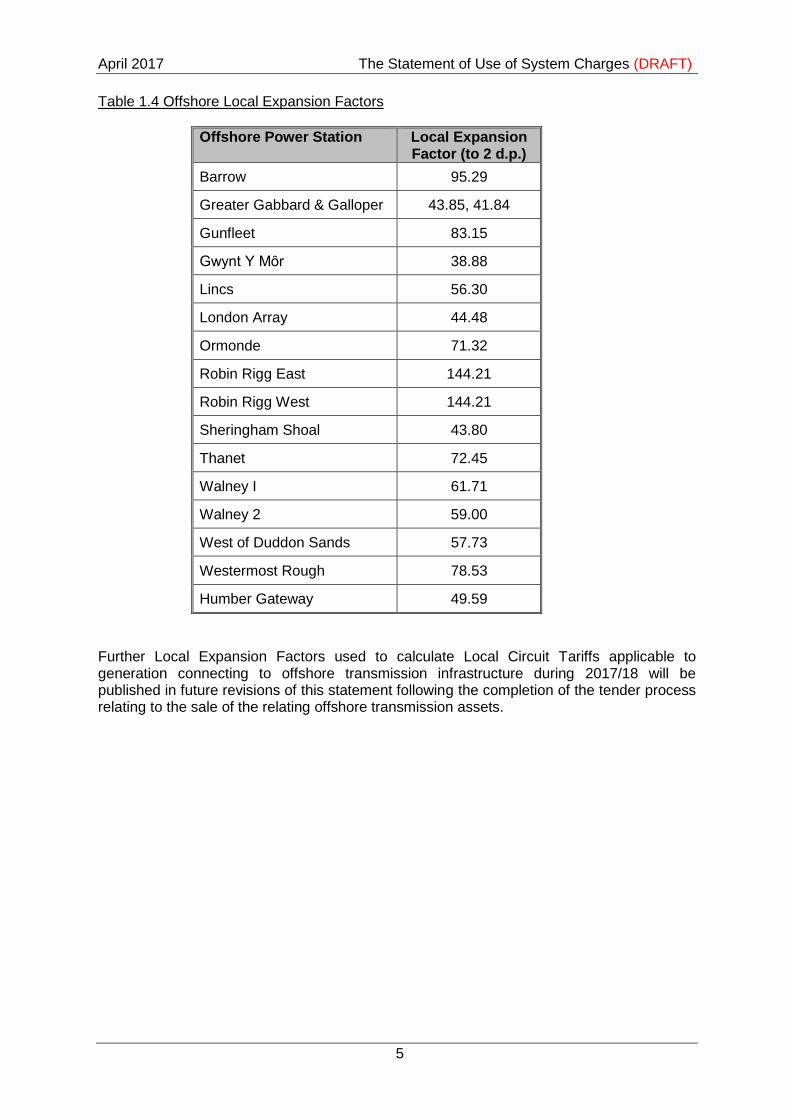
Table 1.4 Offshore Local Expansion Factors
Offshore Power Station Local Expansion Factor (to 2 d.p.)
Barrow 95.29
Greater Gabbard & Galloper 43.85, 41.84
Gunfleet 83.15
Gwynt Y Mȏr 38.88
Lincs 56.30
London Array 44.48
Ormonde 71.32
Robin Rigg East 144.21
Robin Rigg West 144.21
Sheringham Shoal 43.80
Thanet 72.45
Walney I 61.71
Walney 2 59.00
West of Duddon Sands 57.73
Westermost Rough 78.53
Humber Gateway 49.59
Further Local Expansion Factors used to calculate Local Circuit Tariffs applicable to generation connecting to offshore transmission infrastructure during 2017/18 will be published in future revisions of this statement following the completion of the tender process relating to the sale of the relating offshore transmission assets.
The Statement of Use of System Charges (DRAFT) April 2017
6
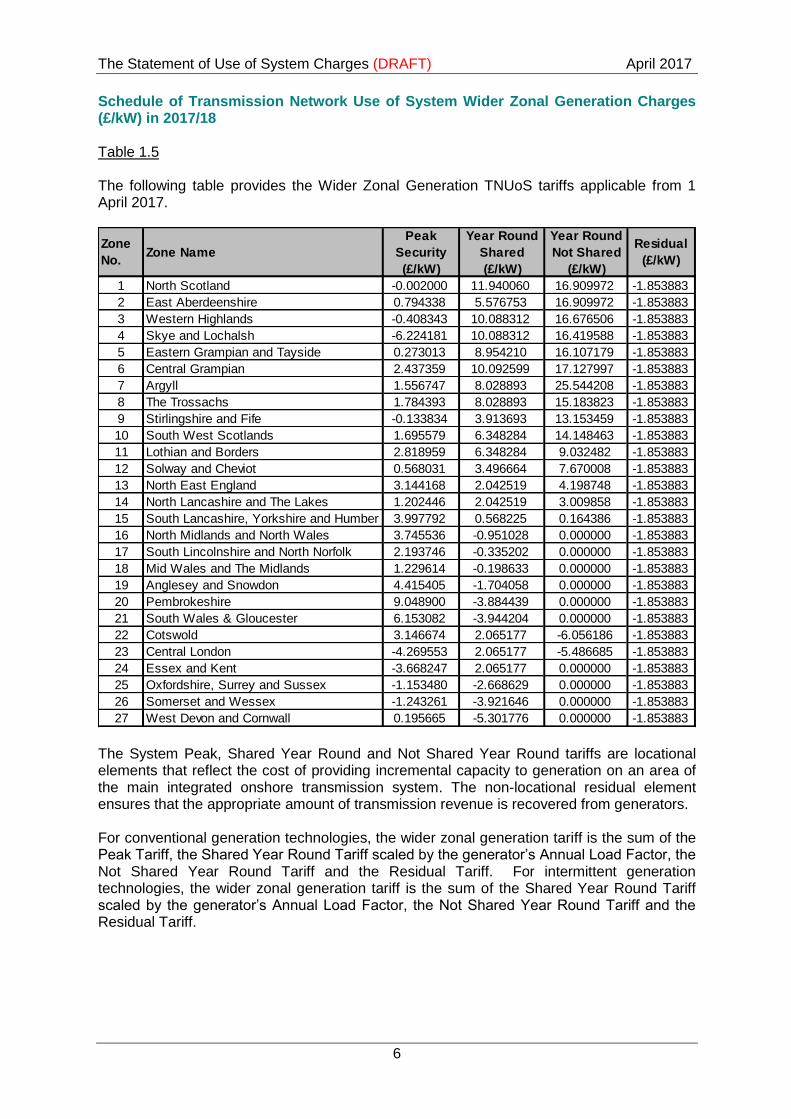
Schedule of Transmission Network Use of System Wider Zonal Generation Charges (£/kW) in 2017/18 Table 1.5 The following table provides the Wider Zonal Generation TNUoS tariffs applicable from 1 April 2017.
The System Peak, Shared Year Round and Not Shared Year Round tariffs are locational elements that reflect the cost of providing incremental capacity to generation on an area of the main integrated onshore transmission system. The non-locational residual element ensures that the appropriate amount of transmission revenue is recovered from generators. For conventional generation technologies, the wider zonal generation tariff is the sum of the Peak Tariff, the Shared Year Round Tariff scaled by the generator’s Annual Load Factor, the Not Shared Year Round Tariff and the Residual Tariff. For intermittent generation technologies, the wider zonal generation tariff is the sum of the Shared Year Round Tariff scaled by the generator’s Annual Load Factor, the Not Shared Year Round Tariff and the Residual Tariff.
1 North Scotland -0.002000 11.940060 16.909972 -1.853883
2 East Aberdeenshire 0.794338 5.576753 16.909972 -1.853883
3 Western Highlands -0.408343 10.088312 16.676506 -1.853883
4 Skye and Lochalsh -6.224181 10.088312 16.419588 -1.853883
5 Eastern Grampian and Tayside 0.273013 8.954210 16.107179 -1.853883
6 Central Grampian 2.437359 10.092599 17.127997 -1.853883
7 Argyll 1.556747 8.028893 25.544208 -1.853883
8 The Trossachs 1.784393 8.028893 15.183823 -1.853883
9 Stirlingshire and Fife -0.133834 3.913693 13.153459 -1.853883
10 South West Scotlands 1.695579 6.348284 14.148463 -1.853883
11 Lothian and Borders 2.818959 6.348284 9.032482 -1.853883
12 Solway and Cheviot 0.568031 3.496664 7.670008 -1.853883
13 North East England 3.144168 2.042519 4.198748 -1.853883
14 North Lancashire and The Lakes 1.202446 2.042519 3.009858 -1.853883
15 South Lancashire, Yorkshire and Humber 3.997792 0.568225 0.164386 -1.853883
16 North Midlands and North Wales 3.745536 -0.951028 0.000000 -1.853883
17 South Lincolnshire and North Norfolk 2.193746 -0.335202 0.000000 -1.853883
18 Mid Wales and The Midlands 1.229614 -0.198633 0.000000 -1.853883
19 Anglesey and Snowdon 4.415405 -1.704058 0.000000 -1.853883
20 Pembrokeshire 9.048900 -3.884439 0.000000 -1.853883
21 South Wales & Gloucester 6.153082 -3.944204 0.000000 -1.853883
22 Cotswold 3.146674 2.065177 -6.056186 -1.853883
23 Central London -4.269553 2.065177 -5.486685 -1.853883
24 Essex and Kent -3.668247 2.065177 0.000000 -1.853883
25 Oxfordshire, Surrey and Sussex -1.153480 -2.668629 0.000000 -1.853883
26 Somerset and Wessex -1.243261 -3.921646 0.000000 -1.853883
27 West Devon and Cornwall 0.195665 -5.301776 0.000000 -1.853883
Zone
No.Zone Name
Peak
Security
(£/kW)
Year Round
Shared
(£/kW)
Year Round
Not Shared
(£/kW)
Residual
(£/kW)

April 2017 The Statement of Use of System Charges (DRAFT)
7
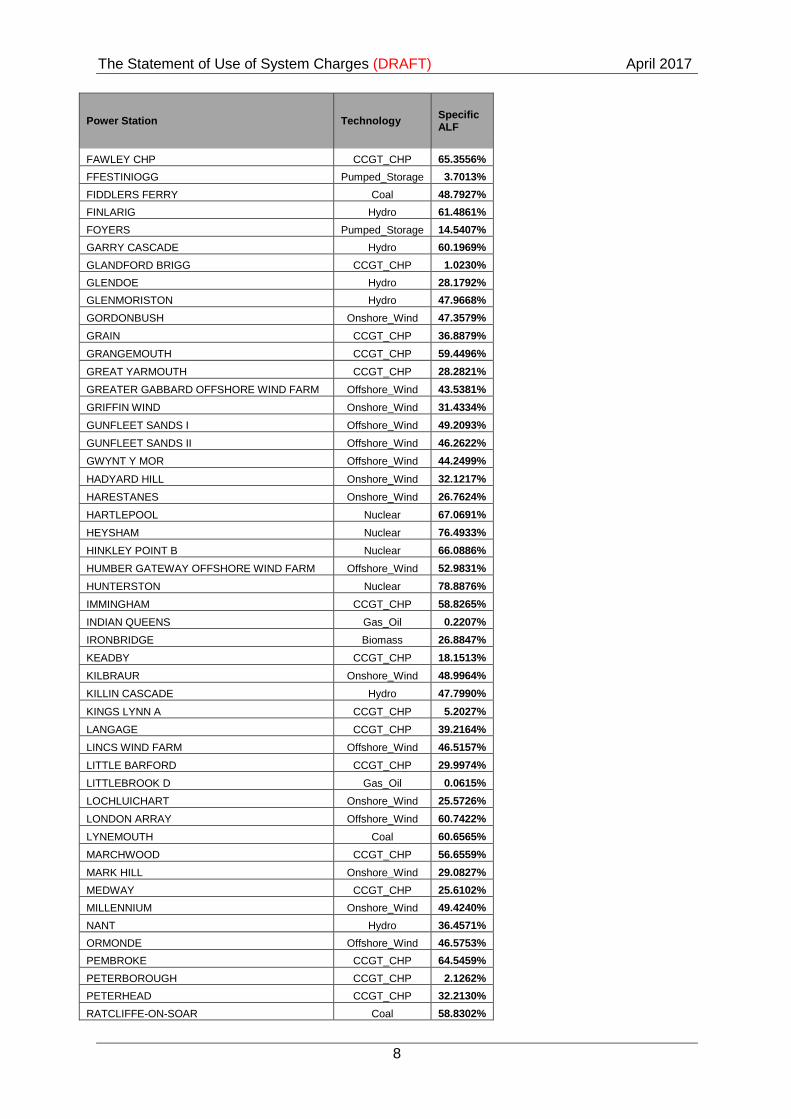
Schedule of Annual Load Factors for 2017/18 Annual Load Factors for specific generators are listed in Table 1.16. Generators commissioning or re-planting since April 2016 should use the generic Annual Load Factor for their technology in Table 1.17. Table 1.16
Power Station Technology Specific ALF
ABERTHAW Coal 59.6022%
ACHRUACH Onshore_Wind 36.4210%
AN SUIDHE WIND FARM Onshore_Wind 35.7576%
ARECLEOCH Onshore_Wind 33.8135%
BAGLAN BAY CCGT_CHP 31.5393%
BARKING CCGT_CHP 8.3575%
BARROW OFFSHORE WIND LTD Offshore_Wind 49.4368%
BARRY CCGT_CHP 1.3905%
BEAULY CASCADE Hydro 35.9315%
BLACK LAW Onshore_Wind 28.5521%
BLACKLAW EXTENSION Onshore_Wind 36.3601%
BRIMSDOWN CCGT_CHP 19.0289%
BURBO BANK Offshore_Wind 37.5881%
CARRAIG GHEAL Onshore_Wind 46.6097%
CARRINGTON CCGT_CHP 38.8663%
CLUNIE SCHEME Hydro 45.5152%
CLYDE (NORTH) Onshore_Wind 40.3200%
CLYDE (SOUTH) Onshore_Wind 33.6380%
CONNAHS QUAY CCGT_CHP 21.7185%
CONON CASCADE Hydro 56.2656%
CORBY CCGT_CHP 6.9366%
CORYTON CCGT_CHP 19.8664%
COTTAM Coal 59.2426%
COTTAM DEVELOPMENT CENTRE CCGT_CHP 25.1921%
COWES Gas_Oil 0.2554%
CRUACHAN Pumped_Storage 8.9550%
CRYSTAL RIG II Onshore_Wind 48.4464%
DAMHEAD CREEK CCGT_CHP 69.8469%
DEESIDE CCGT_CHP 18.1722%
DIDCOT B CCGT_CHP 38.5623%
DIDCOT GTS Gas_Oil 0.1715%
DINORWIG Pumped_Storage 15.0844%
DRAX Coal 81.2941%
DUNGENESS B Nuclear 58.5094%
DUNLAW EXTENSION Onshore_Wind 32.4265%
EDINBANE WIND Onshore_Wind 35.4393%
EGGBOROUGH Coal 53.1372%
ERROCHTY Hydro 26.2245%
FALLAGO Onshore_Wind 51.7981%
FARR WINDFARM TOMATIN Onshore_Wind 40.9876%
FASNAKYLE G1 & G3 Hydro 42.8388%
The Statement of Use of System Charges (DRAFT) April 2017
8
Power Station Technology Specific ALF
FAWLEY CHP CCGT_CHP 65.3556%
FFESTINIOGG Pumped_Storage 3.7013%
FIDDLERS FERRY Coal 48.7927%
FINLARIG Hydro 61.4861%
FOYERS Pumped_Storage 14.5407%
GARRY CASCADE Hydro 60.1969%
GLANDFORD BRIGG CCGT_CHP 1.0230%
GLENDOE Hydro 28.1792%
GLENMORISTON Hydro 47.9668%
GORDONBUSH Onshore_Wind 47.3579%
GRAIN CCGT_CHP 36.8879%
GRANGEMOUTH CCGT_CHP 59.4496%
GREAT YARMOUTH CCGT_CHP 28.2821%
GREATER GABBARD OFFSHORE WIND FARM Offshore_Wind 43.5381%
GRIFFIN WIND Onshore_Wind 31.4334%
GUNFLEET SANDS I Offshore_Wind 49.2093%
GUNFLEET SANDS II Offshore_Wind 46.2622%
GWYNT Y MOR Offshore_Wind 44.2499%
HADYARD HILL Onshore_Wind 32.1217%
HARESTANES Onshore_Wind 26.7624%
HARTLEPOOL Nuclear 67.0691%
HEYSHAM Nuclear 76.4933%
HINKLEY POINT B Nuclear 66.0886%
HUMBER GATEWAY OFFSHORE WIND FARM Offshore_Wind 52.9831%
HUNTERSTON Nuclear 78.8876%
IMMINGHAM CCGT_CHP 58.8265%
INDIAN QUEENS Gas_Oil 0.2207%
IRONBRIDGE Biomass 26.8847%
KEADBY CCGT_CHP 18.1513%
KILBRAUR Onshore_Wind 48.9964%
KILLIN CASCADE Hydro 47.7990%
KINGS LYNN A CCGT_CHP 5.2027%
LANGAGE CCGT_CHP 39.2164%
LINCS WIND FARM Offshore_Wind 46.5157%
LITTLE BARFORD CCGT_CHP 29.9974%
LITTLEBROOK D Gas_Oil 0.0615%
LOCHLUICHART Onshore_Wind 25.5726%
LONDON ARRAY Offshore_Wind 60.7422%
LYNEMOUTH Coal 60.6565%
MARCHWOOD CCGT_CHP 56.6559%
MARK HILL Onshore_Wind 29.0827%
MEDWAY CCGT_CHP 25.6102%
MILLENNIUM Onshore_Wind 49.4240%
NANT Hydro 36.4571%
ORMONDE Offshore_Wind 46.5753%
PEMBROKE CCGT_CHP 64.5459%
PETERBOROUGH CCGT_CHP 2.1262%
PETERHEAD CCGT_CHP 32.2130%
RATCLIFFE-ON-SOAR Coal 58.8302%
April 2017 The Statement of Use of System Charges (DRAFT)
9
Power Station Technology Specific ALF
ROBIN RIGG EAST Offshore_Wind 46.7127%
ROBIN RIGG WEST Offshore_Wind 48.6565%
ROCKSAVAGE CCGT_CHP 21.9044%
RYE HOUSE CCGT_CHP 8.6596%
SALTEND CCGT_CHP 72.8471%
SEABANK CCGT_CHP 23.7291%
SELLAFIELD CCGT_CHP 19.3496%
SEVERN POWER CCGT_CHP 28.2250%
SHERINGHAM SHOAL Offshore_Wind 49.7329%
SHOREHAM CCGT_CHP 26.6418%
SIZEWELL B Nuclear 88.0078%
SLOY G2 & G3 Hydro 14.4635%
SOUTH HUMBER BANK CCGT_CHP 32.1065%
SPALDING CCGT_CHP 40.6492%
STAYTHORPE CCGT_CHP 56.4953%
STRATHY NORTH & SOUTH Onshore_Wind 41.7502%
SUTTON BRIDGE CCGT_CHP 16.8559%
TAYLORS LANE Gas_Oil 0.1132%
THANET OFFSHORE WIND FARM Offshore_Wind 38.8172%
TODDLEBURN Onshore_Wind 35.6652%
TORNESS Nuclear 87.4352%
USKMOUTH Coal 36.5674%
WALNEY I Offshore_Wind 49.4697%
WALNEY II Offshore_Wind 51.9854%
WEST BURTON Coal 58.3329%
WEST BURTON B CCGT_CHP 45.4973%
WEST OF DUDDON SANDS OFFSHORE WIND FARM Offshore_Wind 42.6923%
WESTERMOST ROUGH Offshore_Wind 43.1621%
WHITELEE Onshore_Wind 31.1516%
WHITELEE EXTENSION Onshore_Wind 27.1848%
WILTON CCGT_CHP 11.1090%
WYLFA Nuclear 82.5139%
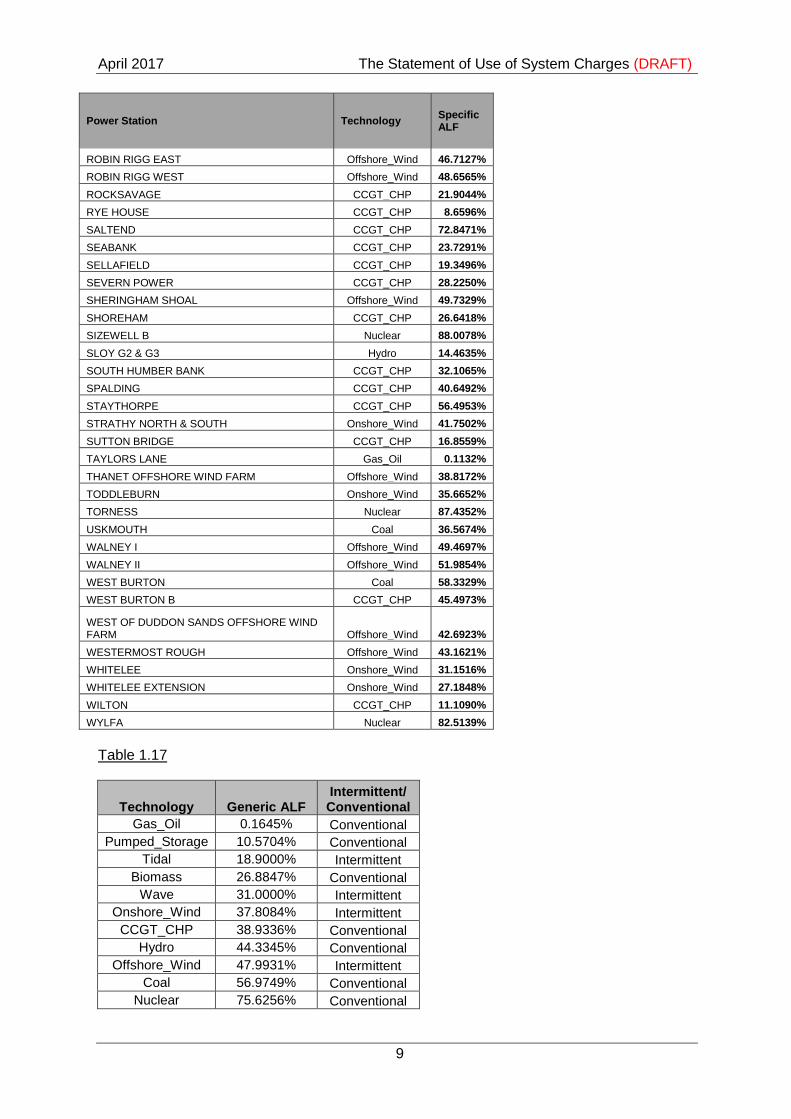
Table 1.17
Technology Generic ALF Intermittent/ Conventional
Gas_Oil 0.1645% Conventional
Pumped_Storage 10.5704% Conventional
Tidal 18.9000% Intermittent
Biomass 26.8847% Conventional
Wave 31.0000% Intermittent
Onshore_Wind 37.8084% Intermittent
CCGT_CHP 38.9336% Conventional
Hydro 44.3345% Conventional
Offshore_Wind 47.9931% Intermittent
Coal 56.9749% Conventional
Nuclear 75.6256% Conventional
The Statement of Use of System Charges (DRAFT) April 2017
10
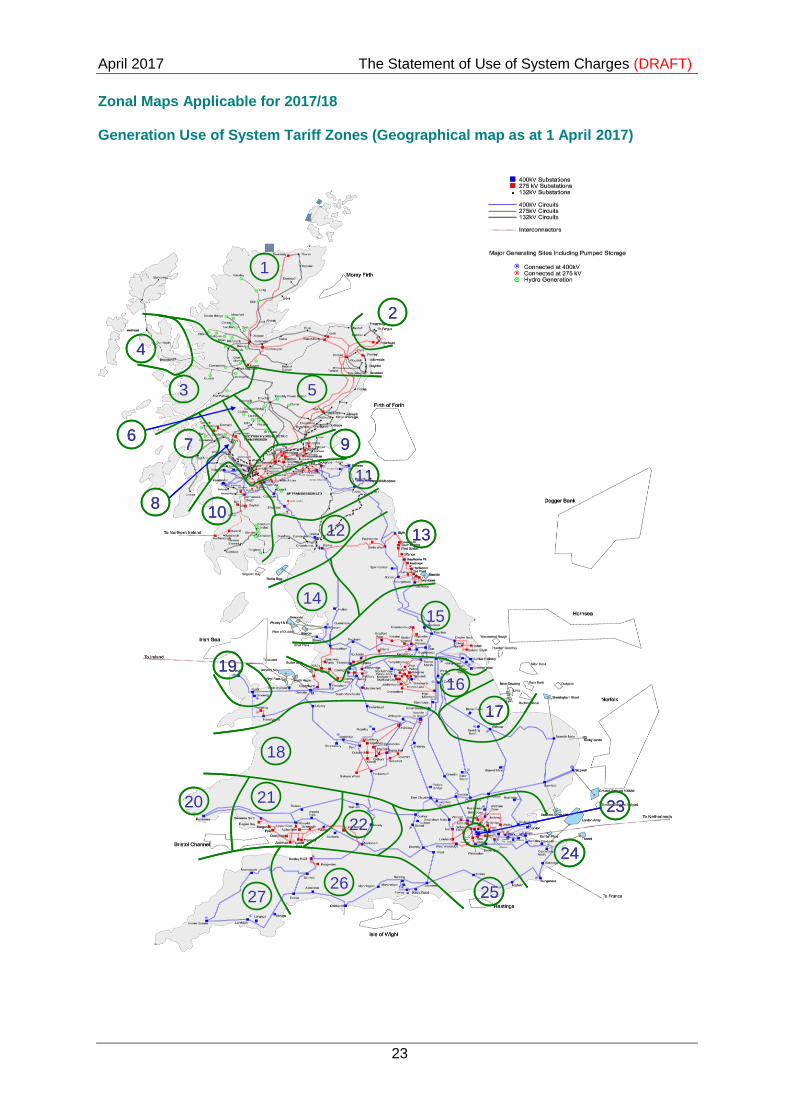
Wider Generation charges are levied by reference to the Transmission Licensee’s substation to which the party is connected or deemed connected. Transmission Licensee’s substations are assigned to a generation zone as shown on the zonal maps. If a party is unclear from looking at the geographical map which zone the relevant National Grid substation is assigned to, then those parties should refer to the electrical version of the map of Generation Use of System Tariff Zones as at 1 April 2017 for clarification. Confirmation of the zoning of a particular generator can be obtained by contacting National Grid’s Revenue Team. Small Generators’ Discount In accordance with Licence Condition C13 in National Grid’s Transmission Licence, small generators connected to the 132kV transmission system are eligible for a reduction in the listed Generation TNUoS tariffs. This discount has been calculated in accordance with direction from the Authority and equates to 25% of the combined generation and demand residual components of the TNUoS tariffs. For 2017/18, this figure has been calculated as £11.351718/kW.

April 2017 The Statement of Use of System Charges (DRAFT)
11
Schedule of Transmission Network Use of System Local Substation Generation Charges (£/kW) in 2017/18 Table 1.8 Onshore Local Substation Tariffs (£/kW) The following table provides the Local Substation Generation TNUoS tariffs applicable to all generation directly connected to the onshore GB Transmission Network from 1 April 2017, which has been updated from the examples listed in the Statement of Use of System Methodology.
Local Substation Tariff (£/kW)
Sum of TEC at connecting Substation
Connection Type 132kV 275kV 400kV
<1320 MW No redundancy 0.184663 0.105639 0.076115
<1320 MW Redundancy 0.406797 0.251688 0.183048
>=1320 MW No redundancy 0.331225 0.239543
>=1320 MW Redundancy 0.543787 0.396919
The above tariffs reflect the cost of the transmission substation equipment provided to facilitate generation connecting to an onshore substation. Table 1.9 Offshore Local Substation Tariffs (£/kW) The following table provides the Local Substation Generation TNUoS tariffs applicable to generation connecting to offshore transmission infrastructure from 1 April 2017:
Offshore Power Station Local Substation Tariff (£/kW)
Barrow 7.441339
Greater Gabbard 13.951635
Gunfleet 16.104666
Gwynt Y Mor 16.990859
Lincs 13.906629
London Array 9.466607
Ormonde 23.004623
Robin Rigg East -0.425554
Robin Rigg West -0.425554
Sheringham Shoal 22.226453
Thanet 16.926252
Walney 1 19.854080
Walney 2 19.709687
West of Duddon Sands 7.661147
Westermost Rough 16.131802
Humber Gateway 13.520839

The Statement of Use of System Charges (DRAFT) April 2017
12
Further local substation tariffs applicable to generation connecting to offshore transmission infrastructure during 2017/18 will be published in future revisions of this statement following the completion of the tender process relating to the sale of the relating offshore transmission assets.

April 2017 The Statement of Use of System Charges (DRAFT)
13
Schedule of Transmission Network Use of System Local Circuit Charges (£/kW) in 2017/18 Table 1.10 The following table provides the Local Circuit Generation TNUoS tariffs applicable to directly connected generation not connected to the main integrated onshore GB Transmission Network from 1 April 2017.
Substation Name (£/kW) Substation Name (£/kW) Substation Name (£/kW)
Achruach 3.939872 Dinorwig 2.206750 Kilmorack 0.181645
Aigas 0.601544 Dunlaw Extension 1.379173 Langage 0.604792
An Suidhe 2.819601 Brochlock 1.317382 Lochay 0.336577
Arecleoch 1.910276 Dumnaglass 1.707609 Luichart 0.527938
Baglan Bay 0.699507 Edinbane -6.291543 Mark Hill 0.805306
Beinneun Wind Farm 1.381894 Earlshaugh Wind Farm 3.464522 Margree 5.537474
Bhlaraidh Wind Farm 0.593841 Ewe Hill 1.263917 Marchwood 0.351279
Black Hill 0.793539 Farr Windfarm 2.065880 Millennium Wind 1.680242 BlackCraig Wind Farm 5.789906 Fallago 0.905483 Moffat 0.155042
Black Law 1.607155 Carraig Gheal 4.045828 Mossford 2.648705
BlackLaw Extension 3.408181 Ffestiniogg 0.232696 Nant 2.308346
Bodelwyddan 0.105826 Finlarig 0.294505 Necton 1.034410
Carrington -0.032882 Foyers 0.692563 Rhigos 0.093347
Clyde (North) 0.100867 Galawhistle 0.778413 Rocksavage 0.016271
Clyde (South) 0.116647 Glendoe 1.691813 Saltend 0.313585
Corriegarth 3.466566 Ulziside 8.931637 South Humber Bank 0.867492
Corriemoillie 1.530696 Gordonbush 0.376037 Spalding 0.255407
Coryton 0.047815 Griffin Wind -0.845619 Kilbraur 0.237471
Cruachan 1.676790 Hadyard Hill 2.545783 Stronelairg 1.332406
Crystal Rig 0.334929 Harestanes 2.304928 Strathy Wind 2.018352
Culligran 1.594105 Hartlepool 0.552782 Wester Dodds 0.647899
Deanie 2.618888 Hedon 0.166412 Whitelee 0.097613
Dersalloch 2.215514 Invergarry 1.305184 Whitelee Extension 0.271364
Didcot 0.476938 Kilgallioch 0.967994
The above tariffs reflect the cost of transmission circuits between the point of connection and the main interconnected transmission system.
The Statement of Use of System Charges (DRAFT) April 2017
14
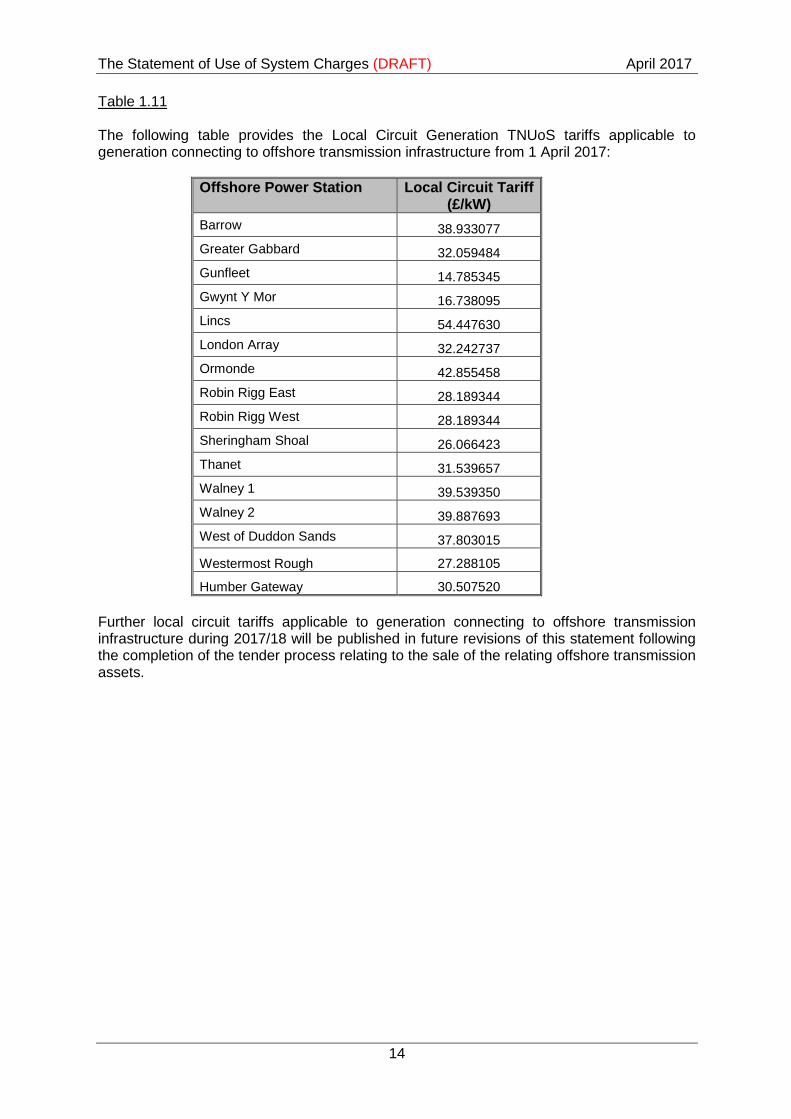
Table 1.11 The following table provides the Local Circuit Generation TNUoS tariffs applicable to generation connecting to offshore transmission infrastructure from 1 April 2017:
Offshore Power Station Local Circuit Tariff (£/kW)
Barrow 38.933077
Greater Gabbard 32.059484
Gunfleet 14.785345
Gwynt Y Mor 16.738095
Lincs 54.447630
London Array 32.242737
Ormonde 42.855458
Robin Rigg East 28.189344
Robin Rigg West 28.189344
Sheringham Shoal 26.066423
Thanet 31.539657
Walney 1 39.539350
Walney 2 39.887693
West of Duddon Sands 37.803015
Westermost Rough 27.288105
Humber Gateway 30.507520
Further local circuit tariffs applicable to generation connecting to offshore transmission infrastructure during 2017/18 will be published in future revisions of this statement following the completion of the tender process relating to the sale of the relating offshore transmission assets.
April 2017 The Statement of Use of System Charges (DRAFT)
15
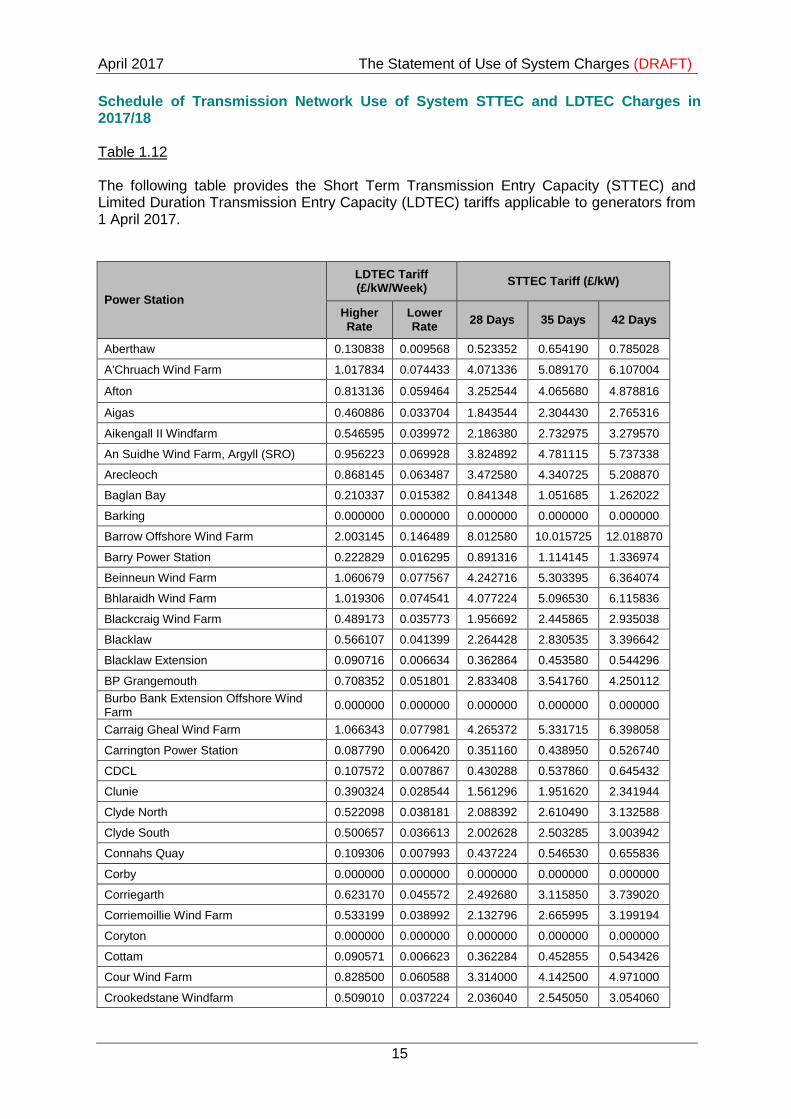
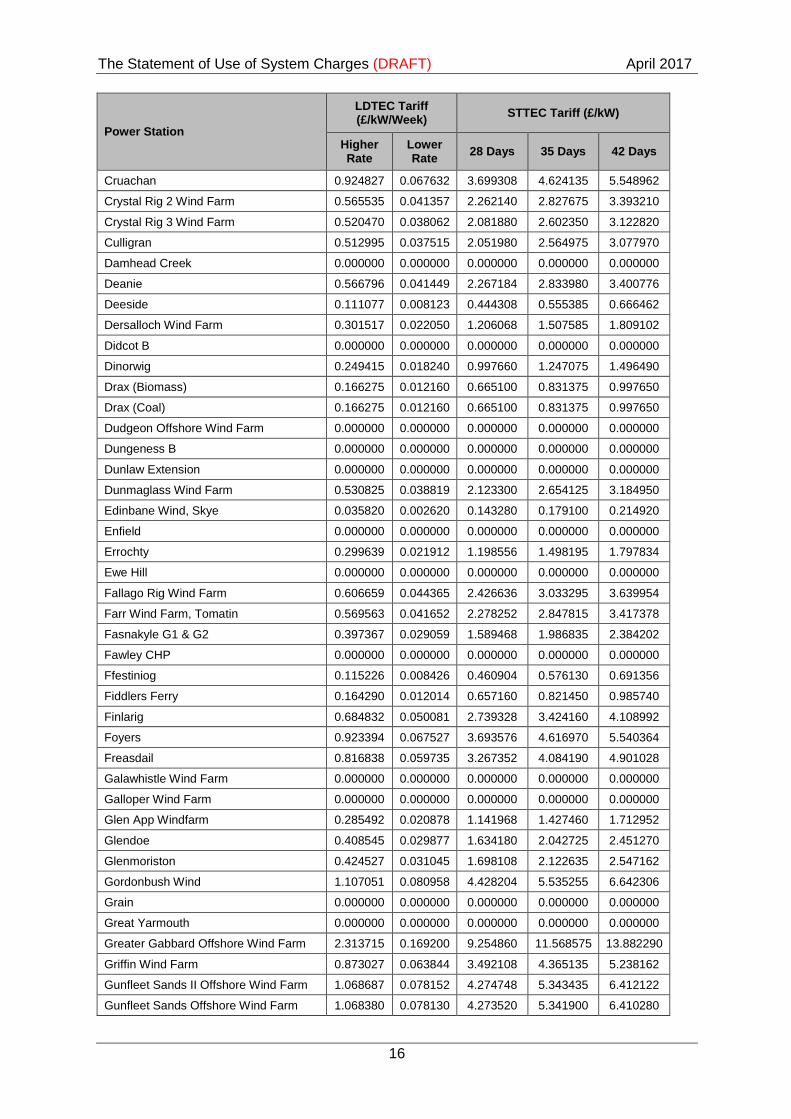
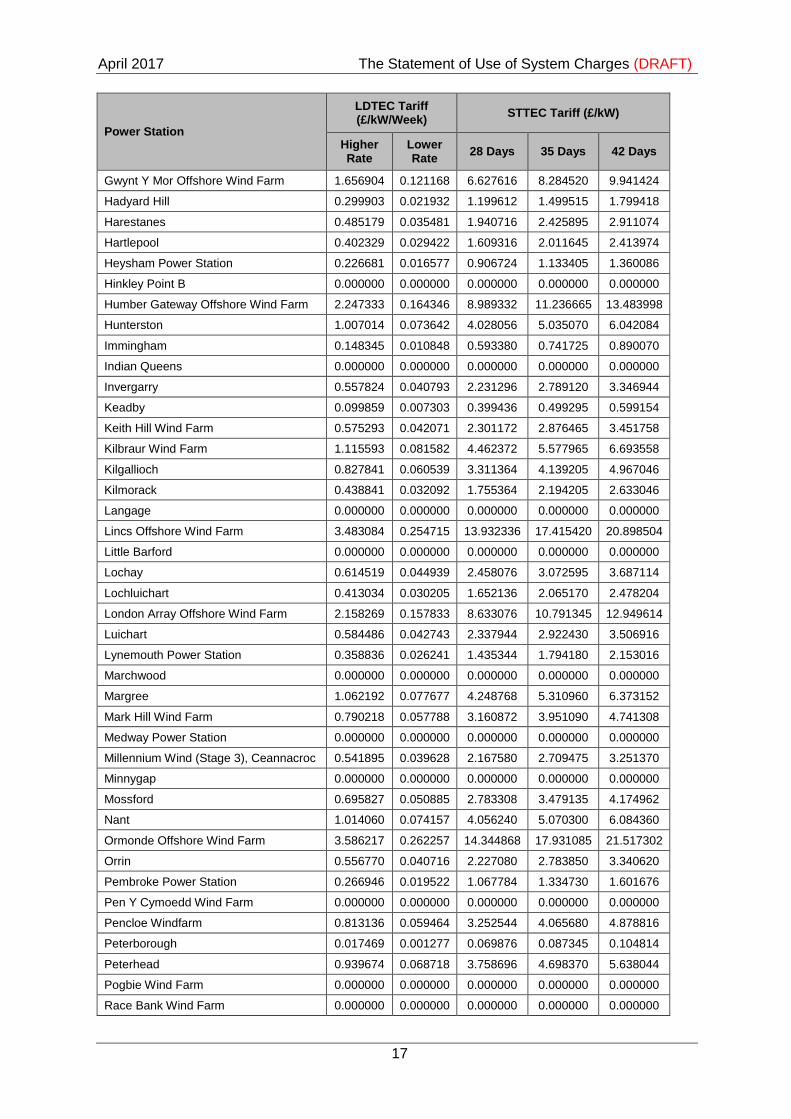
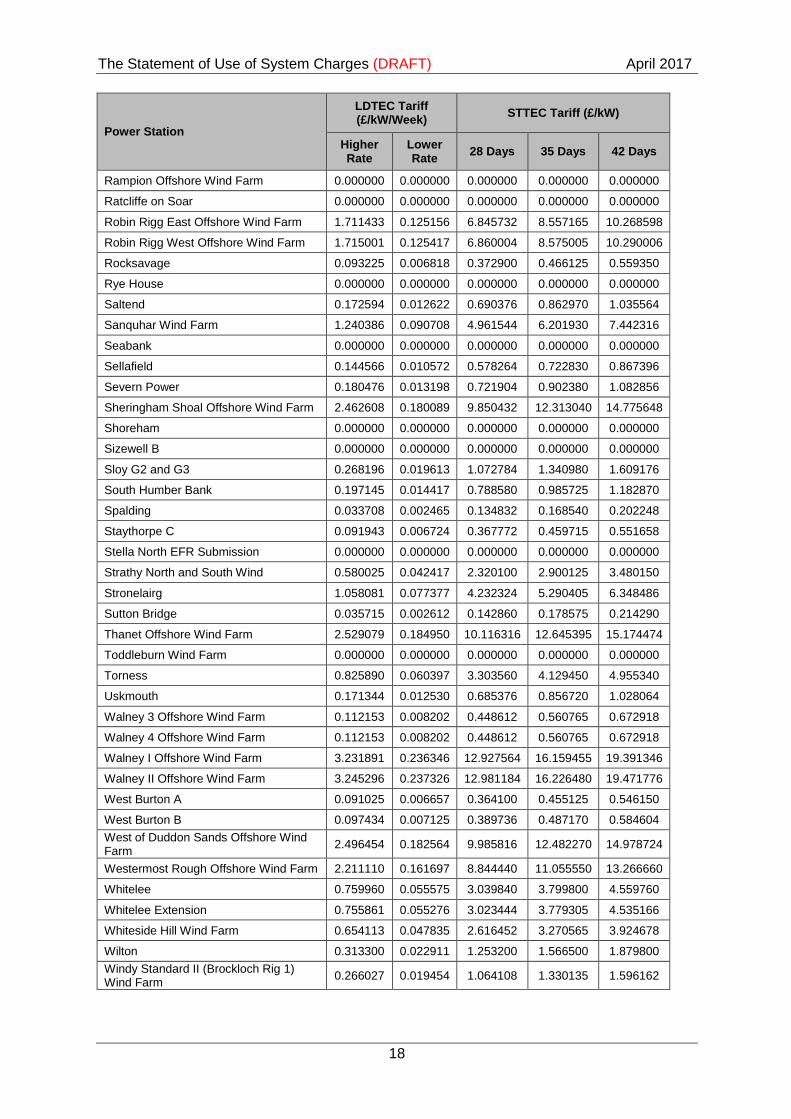
Schedule of Transmission Network Use of System STTEC and LDTEC Charges in 2017/18 Table 1.12 The following table provides the Short Term Transmission Entry Capacity (STTEC) and Limited Duration Transmission Entry Capacity (LDTEC) tariffs applicable to generators from 1 April 2017.
Power Station
LDTEC Tariff (£/kW/Week)
STTEC Tariff (£/kW)
Higher Rate
Lower Rate
28 Days 35 Days 42 Days
Aberthaw 0.130838 0.009568 0.523352 0.654190 0.785028
A'Chruach Wind Farm 1.017834 0.074433 4.071336 5.089170 6.107004
Afton 0.813136 0.059464 3.252544 4.065680 4.878816
Aigas 0.460886 0.033704 1.843544 2.304430 2.765316
Aikengall II Windfarm 0.546595 0.039972 2.186380 2.732975 3.279570
An Suidhe Wind Farm, Argyll (SRO) 0.956223 0.069928 3.824892 4.781115 5.737338
Arecleoch 0.868145 0.063487 3.472580 4.340725 5.208870
Baglan Bay 0.210337 0.015382 0.841348 1.051685 1.262022
Barking 0.000000 0.000000 0.000000 0.000000 0.000000
Barrow Offshore Wind Farm 2.003145 0.146489 8.012580 10.015725 12.018870
Barry Power Station 0.222829 0.016295 0.891316 1.114145 1.336974
Beinneun Wind Farm 1.060679 0.077567 4.242716 5.303395 6.364074
Bhlaraidh Wind Farm 1.019306 0.074541 4.077224 5.096530 6.115836
Blackcraig Wind Farm 0.489173 0.035773 1.956692 2.445865 2.935038
Blacklaw 0.566107 0.041399 2.264428 2.830535 3.396642
Blacklaw Extension 0.090716 0.006634 0.362864 0.453580 0.544296
BP Grangemouth 0.708352 0.051801 2.833408 3.541760 4.250112
Burbo Bank Extension Offshore Wind Farm
0.000000 0.000000 0.000000 0.000000 0.000000
Carraig Gheal Wind Farm 1.066343 0.077981 4.265372 5.331715 6.398058
Carrington Power Station 0.087790 0.006420 0.351160 0.438950 0.526740
CDCL 0.107572 0.007867 0.430288 0.537860 0.645432
Clunie 0.390324 0.028544 1.561296 1.951620 2.341944
Clyde North 0.522098 0.038181 2.088392 2.610490 3.132588
Clyde South 0.500657 0.036613 2.002628 2.503285 3.003942
Connahs Quay 0.109306 0.007993 0.437224 0.546530 0.655836
Corby 0.000000 0.000000 0.000000 0.000000 0.000000
Corriegarth 0.623170 0.045572 2.492680 3.115850 3.739020
Corriemoillie Wind Farm 0.533199 0.038992 2.132796 2.665995 3.199194
Coryton 0.000000 0.000000 0.000000 0.000000 0.000000
Cottam 0.090571 0.006623 0.362284 0.452855 0.543426
Cour Wind Farm 0.828500 0.060588 3.314000 4.142500 4.971000
Crookedstane Windfarm 0.509010 0.037224 2.036040 2.545050 3.054060
The Statement of Use of System Charges (DRAFT) April 2017
16
Power Station
LDTEC Tariff (£/kW/Week)
STTEC Tariff (£/kW)
Higher Rate
Lower Rate
28 Days 35 Days 42 Days
Cruachan 0.924827 0.067632 3.699308 4.624135 5.548962
Crystal Rig 2 Wind Farm 0.565535 0.041357 2.262140 2.827675 3.393210
Crystal Rig 3 Wind Farm 0.520470 0.038062 2.081880 2.602350 3.122820
Culligran 0.512995 0.037515 2.051980 2.564975 3.077970
Damhead Creek 0.000000 0.000000 0.000000 0.000000 0.000000
Deanie 0.566796 0.041449 2.267184 2.833980 3.400776
Deeside 0.111077 0.008123 0.444308 0.555385 0.666462
Dersalloch Wind Farm 0.301517 0.022050 1.206068 1.507585 1.809102
Didcot B 0.000000 0.000000 0.000000 0.000000 0.000000
Dinorwig 0.249415 0.018240 0.997660 1.247075 1.496490
Drax (Biomass) 0.166275 0.012160 0.665100 0.831375 0.997650
Drax (Coal) 0.166275 0.012160 0.665100 0.831375 0.997650
Dudgeon Offshore Wind Farm 0.000000 0.000000 0.000000 0.000000 0.000000
Dungeness B 0.000000 0.000000 0.000000 0.000000 0.000000
Dunlaw Extension 0.000000 0.000000 0.000000 0.000000 0.000000
Dunmaglass Wind Farm 0.530825 0.038819 2.123300 2.654125 3.184950
Edinbane Wind, Skye 0.035820 0.002620 0.143280 0.179100 0.214920
Enfield 0.000000 0.000000 0.000000 0.000000 0.000000
Errochty 0.299639 0.021912 1.198556 1.498195 1.797834
Ewe Hill 0.000000 0.000000 0.000000 0.000000 0.000000
Fallago Rig Wind Farm 0.606659 0.044365 2.426636 3.033295 3.639954
Farr Wind Farm, Tomatin 0.569563 0.041652 2.278252 2.847815 3.417378
Fasnakyle G1 & G2 0.397367 0.029059 1.589468 1.986835 2.384202
Fawley CHP 0.000000 0.000000 0.000000 0.000000 0.000000
Ffestiniog 0.115226 0.008426 0.460904 0.576130 0.691356
Fiddlers Ferry 0.164290 0.012014 0.657160 0.821450 0.985740
Finlarig 0.684832 0.050081 2.739328 3.424160 4.108992
Foyers 0.923394 0.067527 3.693576 4.616970 5.540364
Freasdail 0.816838 0.059735 3.267352 4.084190 4.901028
Galawhistle Wind Farm 0.000000 0.000000 0.000000 0.000000 0.000000
Galloper Wind Farm 0.000000 0.000000 0.000000 0.000000 0.000000
Glen App Windfarm 0.285492 0.020878 1.141968 1.427460 1.712952
Glendoe 0.408545 0.029877 1.634180 2.042725 2.451270
Glenmoriston 0.424527 0.031045 1.698108 2.122635 2.547162
Gordonbush Wind 1.107051 0.080958 4.428204 5.535255 6.642306
Grain 0.000000 0.000000 0.000000 0.000000 0.000000
Great Yarmouth 0.000000 0.000000 0.000000 0.000000 0.000000
Greater Gabbard Offshore Wind Farm 2.313715 0.169200 9.254860 11.568575 13.882290
Griffin Wind Farm 0.873027 0.063844 3.492108 4.365135 5.238162
Gunfleet Sands II Offshore Wind Farm 1.068687 0.078152 4.274748 5.343435 6.412122
Gunfleet Sands Offshore Wind Farm 1.068380 0.078130 4.273520 5.341900 6.410280
April 2017 The Statement of Use of System Charges (DRAFT)
17
Power Station
LDTEC Tariff (£/kW/Week)
STTEC Tariff (£/kW)
Higher Rate
Lower Rate
28 Days 35 Days 42 Days
Gwynt Y Mor Offshore Wind Farm 1.656904 0.121168 6.627616 8.284520 9.941424
Hadyard Hill 0.299903 0.021932 1.199612 1.499515 1.799418
Harestanes 0.485179 0.035481 1.940716 2.425895 2.911074
Hartlepool 0.402329 0.029422 1.609316 2.011645 2.413974
Heysham Power Station 0.226681 0.016577 0.906724 1.133405 1.360086
Hinkley Point B 0.000000 0.000000 0.000000 0.000000 0.000000
Humber Gateway Offshore Wind Farm 2.247333 0.164346 8.989332 11.236665 13.483998
Hunterston 1.007014 0.073642 4.028056 5.035070 6.042084
Immingham 0.148345 0.010848 0.593380 0.741725 0.890070
Indian Queens 0.000000 0.000000 0.000000 0.000000 0.000000
Invergarry 0.557824 0.040793 2.231296 2.789120 3.346944
Keadby 0.099859 0.007303 0.399436 0.499295 0.599154
Keith Hill Wind Farm 0.575293 0.042071 2.301172 2.876465 3.451758
Kilbraur Wind Farm 1.115593 0.081582 4.462372 5.577965 6.693558
Kilgallioch 0.827841 0.060539 3.311364 4.139205 4.967046
Kilmorack 0.438841 0.032092 1.755364 2.194205 2.633046
Langage 0.000000 0.000000 0.000000 0.000000 0.000000
Lincs Offshore Wind Farm 3.483084 0.254715 13.932336 17.415420 20.898504
Little Barford 0.000000 0.000000 0.000000 0.000000 0.000000
Lochay 0.614519 0.044939 2.458076 3.072595 3.687114
Lochluichart 0.413034 0.030205 1.652136 2.065170 2.478204
London Array Offshore Wind Farm 2.158269 0.157833 8.633076 10.791345 12.949614
Luichart 0.584486 0.042743 2.337944 2.922430 3.506916
Lynemouth Power Station 0.358836 0.026241 1.435344 1.794180 2.153016
Marchwood 0.000000 0.000000 0.000000 0.000000 0.000000
Margree 1.062192 0.077677 4.248768 5.310960 6.373152
Mark Hill Wind Farm 0.790218 0.057788 3.160872 3.951090 4.741308
Medway Power Station 0.000000 0.000000 0.000000 0.000000 0.000000
Millennium Wind (Stage 3), Ceannacroc 0.541895 0.039628 2.167580 2.709475 3.251370
Minnygap 0.000000 0.000000 0.000000 0.000000 0.000000
Mossford 0.695827 0.050885 2.783308 3.479135 4.174962
Nant 1.014060 0.074157 4.056240 5.070300 6.084360
Ormonde Offshore Wind Farm 3.586217 0.262257 14.344868 17.931085 21.517302
Orrin 0.556770 0.040716 2.227080 2.783850 3.340620
Pembroke Power Station 0.266946 0.019522 1.067784 1.334730 1.601676
Pen Y Cymoedd Wind Farm 0.000000 0.000000 0.000000 0.000000 0.000000
Pencloe Windfarm 0.813136 0.059464 3.252544 4.065680 4.878816
Peterborough 0.017469 0.001277 0.069876 0.087345 0.104814
Peterhead 0.939674 0.068718 3.758696 4.698370 5.638044
Pogbie Wind Farm 0.000000 0.000000 0.000000 0.000000 0.000000
Race Bank Wind Farm 0.000000 0.000000 0.000000 0.000000 0.000000
The Statement of Use of System Charges (DRAFT) April 2017
18
Power Station
LDTEC Tariff (£/kW/Week)
STTEC Tariff (£/kW)
Higher Rate
Lower Rate
28 Days 35 Days 42 Days
Rampion Offshore Wind Farm 0.000000 0.000000 0.000000 0.000000 0.000000
Ratcliffe on Soar 0.000000 0.000000 0.000000 0.000000 0.000000
Robin Rigg East Offshore Wind Farm 1.711433 0.125156 6.845732 8.557165 10.268598
Robin Rigg West Offshore Wind Farm 1.715001 0.125417 6.860004 8.575005 10.290006
Rocksavage 0.093225 0.006818 0.372900 0.466125 0.559350
Rye House 0.000000 0.000000 0.000000 0.000000 0.000000
Saltend 0.172594 0.012622 0.690376 0.862970 1.035564
Sanquhar Wind Farm 1.240386 0.090708 4.961544 6.201930 7.442316
Seabank 0.000000 0.000000 0.000000 0.000000 0.000000
Sellafield 0.144566 0.010572 0.578264 0.722830 0.867396
Severn Power 0.180476 0.013198 0.721904 0.902380 1.082856
Sheringham Shoal Offshore Wind Farm 2.462608 0.180089 9.850432 12.313040 14.775648
Shoreham 0.000000 0.000000 0.000000 0.000000 0.000000
Sizewell B 0.000000 0.000000 0.000000 0.000000 0.000000
Sloy G2 and G3 0.268196 0.019613 1.072784 1.340980 1.609176
South Humber Bank 0.197145 0.014417 0.788580 0.985725 1.182870
Spalding 0.033708 0.002465 0.134832 0.168540 0.202248
Staythorpe C 0.091943 0.006724 0.367772 0.459715 0.551658
Stella North EFR Submission 0.000000 0.000000 0.000000 0.000000 0.000000
Strathy North and South Wind 0.580025 0.042417 2.320100 2.900125 3.480150
Stronelairg 1.058081 0.077377 4.232324 5.290405 6.348486
Sutton Bridge 0.035715 0.002612 0.142860 0.178575 0.214290
Thanet Offshore Wind Farm 2.529079 0.184950 10.116316 12.645395 15.174474
Toddleburn Wind Farm 0.000000 0.000000 0.000000 0.000000 0.000000
Torness 0.825890 0.060397 3.303560 4.129450 4.955340
Uskmouth 0.171344 0.012530 0.685376 0.856720 1.028064
Walney 3 Offshore Wind Farm 0.112153 0.008202 0.448612 0.560765 0.672918
Walney 4 Offshore Wind Farm 0.112153 0.008202 0.448612 0.560765 0.672918
Walney I Offshore Wind Farm 3.231891 0.236346 12.927564 16.159455 19.391346
Walney II Offshore Wind Farm 3.245296 0.237326 12.981184 16.226480 19.471776
West Burton A 0.091025 0.006657 0.364100 0.455125 0.546150
West Burton B 0.097434 0.007125 0.389736 0.487170 0.584604
West of Duddon Sands Offshore Wind Farm
2.496454 0.182564 9.985816 12.482270 14.978724
Westermost Rough Offshore Wind Farm 2.211110 0.161697 8.844440 11.055550 13.266660
Whitelee 0.759960 0.055575 3.039840 3.799800 4.559760
Whitelee Extension 0.755861 0.055276 3.023444 3.779305 4.535166
Whiteside Hill Wind Farm 0.654113 0.047835 2.616452 3.270565 3.924678
Wilton 0.313300 0.022911 1.253200 1.566500 1.879800
Windy Standard II (Brockloch Rig 1) Wind Farm
0.266027 0.019454 1.064108 1.330135 1.596162
April 2017 The Statement of Use of System Charges (DRAFT)
19
The above tariffs apply to levels of STTEC or LDTEC access that is agreed during the charging year. STTEC can be arranged in 4, 5, or 6 week blocks, with the tariff for applicable duration applying. The LDTEC tariff is applied at two rates during the year. The higher LDTEC rate applies to the first 17 weeks of access within a charging year (whether consecutive or not), and the lower LDTEC rate applies to any subsequent access within the year. Further LDTEC and STTEC tariffs applicable to generation connecting to offshore transmission infrastructure during 2017/18 will be published in future revisions of this statement following the completion of the tender process relating to the sale of the relating offshore transmission assets.

The Statement of Use of System Charges (DRAFT) April 2017
20
Schedule of Pre-Asset Transfer Related Embedded Transmission Use of System Charges in 2017/18 Table 1.13 The following table provides the Pre-Asset Transfer Related Embedded Transmission Use of System (ETUoS) tariffs applicable to embedded transmission connected offshore generation from 1 April 2017. The relating charge is used to recover the element of the Offshore Transmission Operator’s Revenue that relates to distribution charges paid during in the development of the offshore transmission network.
Offshore Power Station Pre-Asset Transfer ETUoS
Tariff (£/kW)
Barrow 0.966762
Gunfleet 2.763466
Ormonde 0.341522
Robin Rigg East 8.737175
Robin Rigg West 8.737175
Sheringham Shoal 0.566607
Thanet 0.759271
Please note that in addition to the charges listed above, any enduring distribution charges made to the NETSO will be passed through to the relating generator in the form of an ETUoS charge. Further Pre-Asset Transfer Related ETUoS tariffs applicable to generation connecting to offshore transmission infrastructure during 2017/18 will be published in future revisions of this statement following the completion of the tender process relating to the sale of the relating offshore transmission assets.

April 2017 The Statement of Use of System Charges (DRAFT)
21
Schedule of Transmission Network Use of System Demand Charges (£/kW) and Energy Consumption Charges (p/kWh) for 2017/18 Table 1.14 The following table provides the Zonal Demand and Energy Consumption TNUoS tariffs applicable from 1 April 2017.
Demand Zone
Zone Area Demand Tariff
(£/kW) Energy Consumption
Tariff (p/kWh)
1 Northern Scotland 29.577679 6.215608
2 Southern Scotland 30.480981 4.262747
3 Northern 39.223189 5.943493
4 North West 45.245665 5.878185
5 Yorkshire 44.967107 5.978783
6 N Wales & Mersey 46.791119 6.607274
7 East Midlands 47.889103 6.248796
8 Midlands 49.457444 6.426317
9 Eastern 49.617070 7.095134
10 South Wales 45.551887 5.775370
11 South East 52.537577 7.475220
12 London 54.969649 5.487378
13 Southern 53.405080 7.047920
14 South Western 51.955583 7.464813
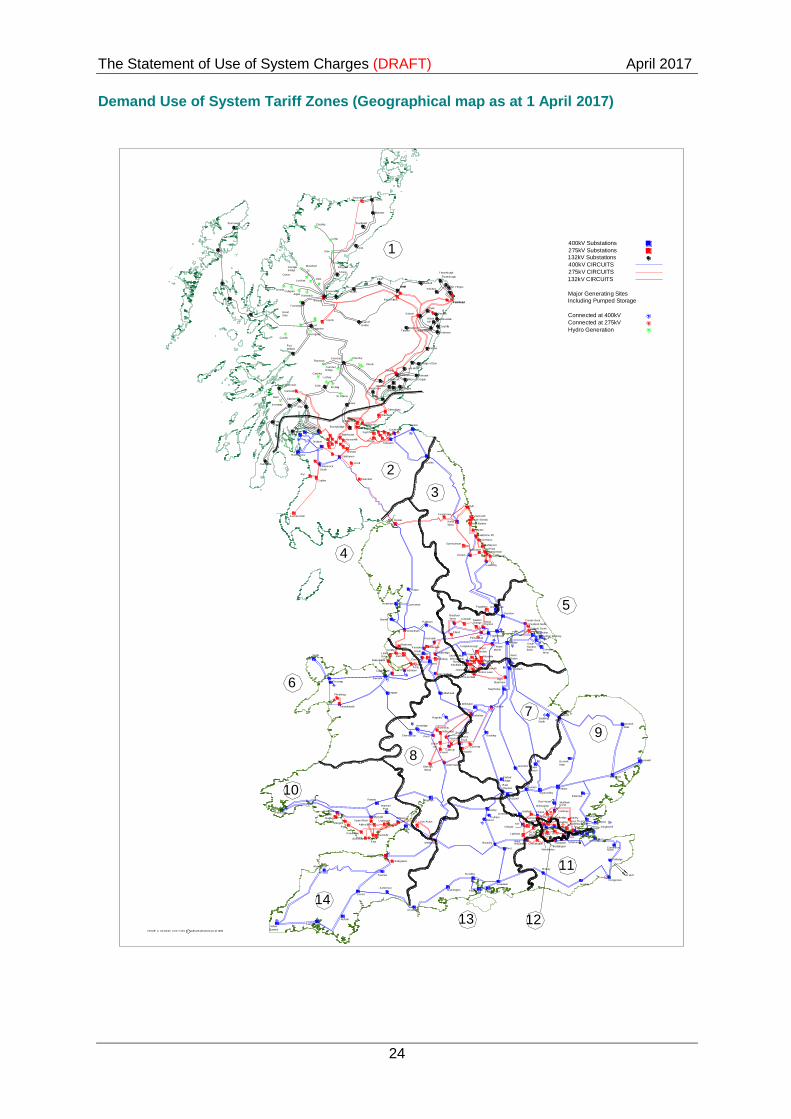
A demand User's zone will be determined by the GSP Group to which the User is deemed to be connected. The Demand Tariff is applied to Demand User’s average half-hourly metered demand over the three Triad periods, as described in the Statement of Use of Charging Methodology. Demand Tariffs are a combination of a locational element that reflects the cost of providing incremental capacity to demand on an area of the main integrated onshore transmission system, and a non-locational residual element which ensures that the appropriate amount of transmission revenue is recovered from demand Users. For 2017/18 the demand residual element to two decimal places is £47.26/kW. In the case of parties liable for both generation and demand charges, the demand tariff zone applicable in respect of that party’s demand will be that in which the Transmission Licensee’s substation to which the party is connected is geographically located. For example, if a power station were connected at a Transmission Licensee’s substation that is geographically located within demand zone 1, it would pay the zone 1 demand tariff.

The Statement of Use of System Charges (DRAFT) April 2017
22
The energy consumption tariff is based on the annual energy consumption during the period 16:00 hrs to 19:00 hrs (i.e. settlement periods 33 to 38 inclusive) over the relevant financial year. Small Generators Discount In accordance with Standard Licence Condition C13 governing the adjustments to use of system charges for the small generators discount, a unit amount of £0.552245/kW to the demand tariff and 0.0751737p/kWh to the energy consumption tariff has been included on a non-discriminatory and non-locational basis. Standard Licence Condition C13 requires the small generators discount mechanism to be revenue neutral over the period of its operation so that the net effect on revenue of the licence condition is zero. It will therefore be necessary to manage any under or over recovery associated with the small generators discount separately from the under/over recovery mechanism within National Grid’s main revenue restriction. National Grid calculates the unit amount added to the demand tariffs using a forecast of the total discount payable to eligible generators, and a forecast of the demand charging base. If either of these factors outturns differently from the original forecast then an under/over recovery would occur. The amount of any under/over recovery would be added to the revenue recovery used to derive the unit amount in subsequent years.
April 2017 The Statement of Use of System Charges (DRAFT)
23
Zonal Maps Applicable for 2017/18 Generation Use of System Tariff Zones (Geographical map as at 1 April 2017)
4
2
1
3
9
5
76
8
13
11
10
1415
12
19
18
16
17
24
25
22
2120
2627
23
4
2
1
3
9
5
76
8
13
11
10
1415
12
19
18
16
17
24
25
22
2120
2627
23
The Statement of Use of System Charges (DRAFT) April 2017
24
Demand Use of System Tariff Zones (Geographical map as at 1 April 2017)
Baglan
Bay
Leighton
Buzzard
Patford
Bridge
Northfleet EastS inglewell
Fourstones
Humber Refinery
Spald ing
North
West Thurrock
ISSUE A 04-03-05 41/177145 C Collins Bartholomew Ltd 1999
Dingwall
Dounreay
Newarthill
Easterhouse
Kincard ine
Wishaw
Strathaven
Kilmarnock
South
Ayr
Coylton
Saltend South
Hackney
Coryton
RatcliffeWillington
Drakelow
Shrewsbury
Cross
Weybridge
Cross
Wood
North
West
FrystonGrange
Ferry
Winco Bank
Norton Lees
Creyke Beck
Saltend North
Grimsby
West
Drax
Lackenby
Greystones
GrangetownSaltholme
Norton
Spennymoor
Tod Point
Hartlepool
Hart Moor
Hawthorne Pit
Offerton
West Boldon
South Shields
Tynemouth
Ste lla
West
Harker
Eccles
Blyth
Indian
Queens
Landulph
Abham
Exeter
Axminster
Chickerell
Mannington
Taunton
Alverdiscott
Hinkley Point
Bridgwater
Aberthaw
Cowbridge
Pyle
Margam
Swansea
North
Card iff
East
Tremorfa
Alpha Steel
UskmouthUpper Boat
Cilfynydd
Imperia l
Park
Rassau
Whitson
Seabank
Iron Acton
Walham
Melksham
Minety DidcotCulham
Cowley
Bramley
Fleet
Nursling
Fawley Botley Wood
Lovedean
Bolney
Ninfield
Dungeness
Sellindge
Canterbury
E de F
Kemsley
Grain
Kingsnorth
Rayle igh Main
Northfleet
L ittlebrook
Tilbury
Warley
Barking
Redbridge
W.HamCity Rd
Tottenham
Brimsdown
Waltham
Ealing
Mill HillWillesden
Watford
St Johns
Wimbledon
New Hurst
E lstree
Rye House
N.Hyde
Sundon
Laleham
Iver
Amersham Main
Wymondley
Pelham
Braintree
Burwell
Main
Bramford
Eaton
Socon
Grendon
East
Claydon
Enderby
Walpole
Norwich
Main
Coventry
Berkswell
Rugeley
Cellarhead
IronbridgeBushbury
Penn
Willenhall
Ocker
Hill
K itwellO ldbury
Bustleholm
NechellsHams
Hall
B ishops
Wood
Feckenham
Legacy
Trawsfynydd
Ffestin iog
Dinorwig
Pentir
Wylfa
Deeside
Capenhurst Frodsham
Fiddlers
Rainhill
K irkby
Lister
Drive
Birkenhead
Washway
Farm
Penwortham
Carrington
South
Manchester
Daines
Macclesfield
Bredbury
Sta lybridge
Rochdale
WhitegateKearsley
Elland
Stocksbridge
West
Melton
Aldwarke
Thurcroft
BrinsworthJordanthorpe
Chesterfield
Sheffie ld City
Neepsend
Pitsmoor
Templeborough Thorpe
Marsh
Keadby
West
Burton
Cottam
High
Marnham
Staythorpe
Stanah
Heysham
Padiham
Hutton
Bradford
West K irkstall Skelton
Poppleton
Thornton
Quernmore
Monk
EggboroughFerrybridge
Killingholme
South
Humber Bank
Sizewell
Pembroke
Osbaldwick
Rowdown
BeddingtonChessington
West
Inveraray
Auchencrosh
400kV Substations
275kV Substations
132kV Substations
400kV CIRCUITS
275kV CIRCUITS
132kV CIRCUITS
Major Generating Sites
Including Pumped Storage
Connected at 400kV
Connected at 275kV
Hydro Generation
11
12
Fasnakyle
Beauly
Deanie
Lairg
Shin
Nairn
Kintore
Blackhillock
Elg in
Keith
Peterhead
Persley
Fraserburgh
Invergarry
Quoich
CulligranAlgas
Kilmorack
Grudgie
Bridge
Mossford
OrrinLuichart
A lness
Brora
Cassley Dunbeath
Mybster
St. FergusStrichen
Macduff
Boat of
Garten
Redmoss
Willowdale
Clayhills
Dyce
Craig iebuckler
Wood
Hill
Tarland
Dalmally
K illin
Errochty
Tealing
Braco
GlenagnesDudhope
Milton of Cra ig ie
Dudhope
Lyndhurst
CharlstonBurghmuir
Arbroath
Fiddes
Bridge of Dun
Luna Head
St. Fillans
Fin larig
Lochay
Cashley
Rannoch
Tummel Bridge
Clunie
Kilchrennan
NantClachan
Port
Ann
Carradale
1
2
3
4
5
6
7
8
9
10
13
14
Windyhill
Dunoon
Inverkip
Devol
Moor
Hunterstone
Sloy
Fort
William
Bonnybridge
Neilson
Great
Glen
Conon
Fort
Augustus
Foyers
Inverness
Stornoway
Elvanfoot
Smeaton
Glenrothes
Westfie ld
Cume
Grangemouth
Longannet
L inmill
S ighthill
P itiochry
Torness
Cockenzie
Keith
Peterhead
Fraserburgh
Thurso
April 2017 The Statement of Use of System Charges (DRAFT)
25
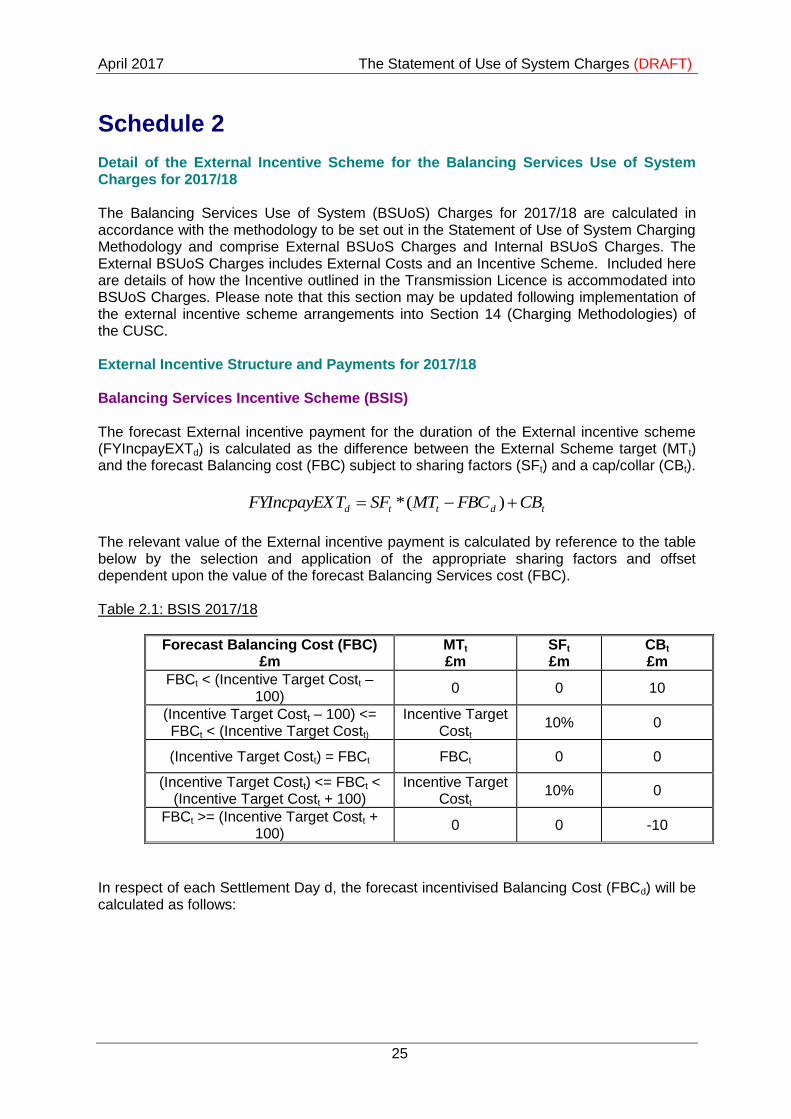
Schedule 2 Detail of the External Incentive Scheme for the Balancing Services Use of System Charges for 2017/18 The Balancing Services Use of System (BSUoS) Charges for 2017/18 are calculated in accordance with the methodology to be set out in the Statement of Use of System Charging Methodology and comprise External BSUoS Charges and Internal BSUoS Charges. The External BSUoS Charges includes External Costs and an Incentive Scheme. Included here are details of how the Incentive outlined in the Transmission Licence is accommodated into BSUoS Charges. Please note that this section may be updated following implementation of the external incentive scheme arrangements into Section 14 (Charging Methodologies) of the CUSC. External Incentive Structure and Payments for 2017/18 Balancing Services Incentive Scheme (BSIS) The forecast External incentive payment for the duration of the External incentive scheme (FYIncpayEXTd) is calculated as the difference between the External Scheme target (MTt) and the forecast Balancing cost (FBC) subject to sharing factors (SFt) and a cap/collar (CBt).
tdttd CBFBCMTSFTFYIncpayEX )(*
The relevant value of the External incentive payment is calculated by reference to the table below by the selection and application of the appropriate sharing factors and offset dependent upon the value of the forecast Balancing Services cost (FBC). Table 2.1: BSIS 2017/18
Forecast Balancing Cost (FBC) £m
MTt
£m SFt
£m CBt
£m
FBCt < (Incentive Target Costt – 100)
0 0 10
(Incentive Target Costt – 100) <= FBCt < (Incentive Target Costt)
Incentive Target Costt
10% 0
(Incentive Target Costt) = FBCt FBCt 0 0
(Incentive Target Costt) <= FBCt < (Incentive Target Costt + 100)
Incentive Target Costt
10% 0
FBCt >= (Incentive Target Costt + 100)
0 0 -10
In respect of each Settlement Day d, the forecast incentivised Balancing Cost (FBCd) will be calculated as follows:

The Statement of Use of System Charges (DRAFT) April 2017
26
NDS
PFT
IBC
FBCd
k
k
d
k
k
d *
1
1
Where: NDS: Number of days in Scheme
The Daily Incentivised Balancing Cost IBCd in respect of a Settlement Day is
calculated as follows:
dddjddj jdd RTOMBSCCABSCCVCSOBMIBC
Forecast Incentive (FIIR) The forecast incentive is an incentive scheme on the performance of National Grid with regards to its level of accuracy in forecasting the levels of wind generation and demand on the system in day ahead, two day ahead and week-ahead time-scales. This incentive is capped and collared at ±£4m in 2017-18.
SO TO mechanism (SOTOC)
The SO TO mechanism allows the SO to fund the Scottish TOs to deliver works differently if that would result in an overall reduction in system costs. It allows the SO to procure services from the Scottish TOs when the costs of procurement are less than the savings achieved. SO TO cost savings could result in an Incentive payment. The Authority will determine the level of payment based on the end of year report submitted by the SO. The payment level is set at sharing factor of 10% of savings demonstrated with a cap/collar of ±£1m. Black Start Allowed Revenue National Grid may recover an allowed revenue in respect of Black Start each year. However Ofgem can disallow up to 10% of the total Black Start costs in each year if they consider that those costs have not been incurred in accordance with a set of published methodologies.
April 2017 The Statement of Use of System Charges (DRAFT)
27
Schedule 3 Application Fees for Connection and Use of System Agreements Application fees are payable in respect of applications for new connection agreements, certain use of system agreements and for modifications to existing agreements based on reasonable costs incurred by National Grid including where appropriate, charges from the Transmission Owners (TO’s) in accordance with their charging statements. The application process and options available are set out in the Statement of the Use of System Charging Methodology which is included in Section 14 of the Connection and Use of System Code (CUSC). The application fee is dependent upon size, type and location of the applicant's scheme as shown on the map and tables on the next page. Users can opt for a variable price application and pay an advance of the Engineering Charges based on the fixed prices shown, which will be reconciled once the actual costs have been calculated using the charge out rates contained in Schedule 4. Alternatively, onshore Users can opt to pay a fixed price application fee in respect of New and Modified Bilateral Agreements. In some circumstances, where a given application is expected to involve significant costs over and above those normally expected (e.g. substantial system studies, special surveys, investigations, or where a Transmission Owner varies the application fee charged to National Grid from the standard fee published in their charging statements) to process an offer of terms, National Grid reserves the right to remove the option for a fixed price application fee. The map divides GB into three zones based on the Boundary of Influence map defined in Schedule 4 of the STC (SO-TO Code). Zone A maps onto the area NGC South, Zone B maps to NGC North and SPT South, and Zone C maps to SPT North, SHE T South and SHE T North. The application fees indicated will be reviewed on an annual basis and reflect any changes to the Boundaries of Influence. It should be noted that the zone to which a particular user is applying is determined by the location of the connection to the National Electricity Transmission System and not by the geographical location of the User’s plant and equipment. All application fees are subject to VAT and are capped at £400,000 + VAT. Reconciliation and Refunding of Application Fees for Connection and Use of System Agreements Application Fees will be reconciled and / or refunded In accordance with Section 14 of the Connection and Use of System Code (CUSC).
The Statement of Use of System Charges (DRAFT) April 2017
28
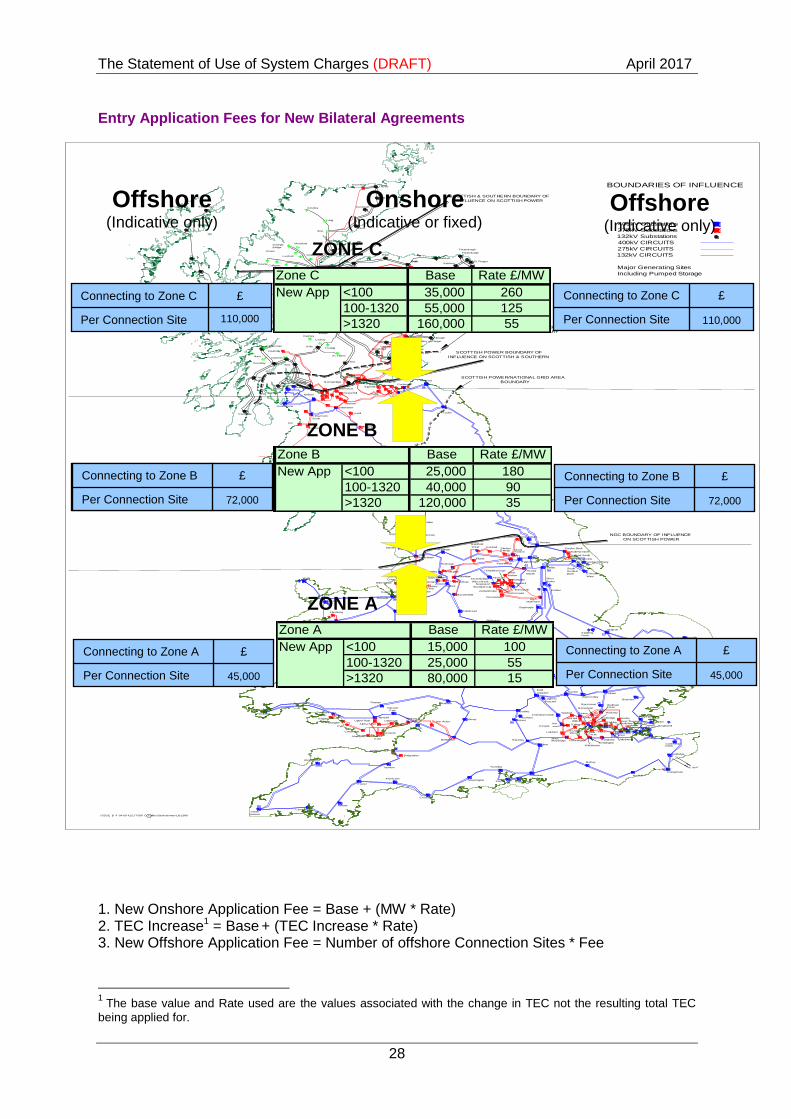
Entry Application Fees for New Bilateral Agreements 1. New Onshore Application Fee = Base + (MW * Rate) 2. TEC Increase1 = Base + (TEC Increase * Rate) 3. New Offshore Application Fee = Number of offshore Connection Sites * Fee
1
The base value and Rate used are the values associated with the change in TEC not the resulting total TEC
being applied for.
Sizewell
Pembroke
Osbaldwick
Rowdown
BeddingtonChessington
West
Landulph
Abham
Exeter
Axminster
Chickerell
Mannington
Taunton
Alverdiscott
Hinkley Point
Bridgwater
Aberthaw
Cowbridge
Pyle
Margam
Swansea
North
Card iff
East
Tremorfa
Alpha Steel
UskmouthUpper Boat
Cilfynydd
Imperia l
Park
Rassau
Whitson
Seabank
Iron Acton
Walham
Melksham
Minety Didcot
Culham
Cowley
Bramley
Fleet
Nursling
Fawley Botley Wood
Lovedean
Bolney
Ninfield
Dungeness
Sellindge
Canterbury
E de F
Kemsley
Grain
Kingsnorth
Rayle igh Main
Northfleet
L ittlebrook
Tilbury
Warley
Barking
Redbridge
W.HamCity Rd
Tottenham
Brimsdown
Waltham
Ealing
Mill Hill
Willesden
Watford
St Johns
Wimbledon
New Hurst
E lstree
Rye House
N.Hyde
Sundon
Laleham
Iver
Amersham Main
Wymondley
Pelham
Braintree
Burwell
Main
Bramford
Eaton
Socon
Grendon
East
Claydon
Enderby
Walpole
Norwich
Main
Coventry
Berkswell
Rugeley
Cellarhead
IronbridgeBushbury
Penn
Willenhall
Ocker
Hill
K itwellO ldbury
Bustleholm
NechellsHams
Hall
B ishops
Wood
Feckenham
Legacy
Trawsfynydd
Ffestin iog
Dinorwig
Pentir
Wylfa
Deeside
Capenhurst Frodsham
Fiddlers
Rainhill
K irkby
Lister
Drive
Birkenhead
Washway
Farm
Penwortham
Carrington
South
Manchester
Daines
Macclesfield
Bredbury
Sta lybridge
Rochdale
WhitegateKearsley
Elland
Stocksbridge
West
Melton
Aldwarke
Thurcroft
BrinsworthJordanthorpe
Chesterfield
Sheffie ld City
Neepsend
Pitsmoor
Templeborough Thorpe
Marsh
Keadby
West
Burton
Cottam
High
Marnham
Staythorpe
Stanah
Heysham
Padiham
Hutton
Bradford
West K irkstallSkelton
Poppleton
Thornton
Quernmore
Monk
EggboroughFerrybridge
Killingholme
South
Humber
Bank Grimsby
West
Drax
Lackenby
Greystones
GrangetownSaltholme
Norton
Spennymoor
Tod Point
Hartlepool
Hart Moor
Hawthorne Pit
Offerton
West Boldon
South Shields
Tynemouth
Ste lla
West
Harker
Eccles
Blyth
Indian
Queens
Coryton
RatcliffeWillington
Drakelow
Shrewsbury
Cross
Weybridge
Cross
Wood
North
West
FrystonGrange
Ferry
Winco Bank
Norton Lees
Creyke Beck
Saltend North
Saltend South
Hackney
Baglan
Bay
Leighton
Buzzard
Patford
Bridge
Northfleet EastS inglewell
Fourstones
Humber Refinery
Spald ing
North
West Thurrock
ISSUE B 4 -04-08 41/177089 C Collins Bartholomew Ltd 1999
Dingwall
Dounreay
Newarthill
Easterhouse
Kincard ine
Wishaw
Strathaven
Kilmarnock
South
Ayr
Coylton
Inveraray
Windyhill
Dunoon
Inverkip
Devol
Moor
Hunterstone
Sloy
Fort
William
Bonnybridge
Neilson
Great
Glen
Conon
Fort
Augustus
Foyers
Inverness
Stornoway
Elvanfoot
Smeaton
Glenrothes
Westfie ld
Cume
Grangemouth
Longannet
L inmill
S ighthill
P itiochry
Torness
Cockenzie
Keith
Peterhead
Fraserburgh
Thurso
400kV Substations
275kV Substations
132kV Substations
400kV CIRCUITS
275kV CIRCUITS
132kV CIRCUITS
Major Generating Sites
Including Pumped Storage
Connected at 400kV
Connected at 275kV
Hydro Generation
Fasnakyle
Beauly
Deanie
Lairg
Shin
Nairn
Kintore
Blackhillock
Elg in
Keith
Peterhead
Persley
Fraserburgh
Invergarry
Quoich
CulligranAlgas
Kilmorack
Grudgie
Bridge
Mossford
OrrinLuichart
A lness
Brora
Cassley Dunbeath
Mybster
St. FergusStrichen
Macduff
Boat of
Garten
Redmoss
Willowdale
Clayhills
Dyce
Craig iebuckler
Wood
Hill
Tarland
Dalmally
K illin
Errochty
Tealing
Braco
GlenagnesDudhope
Milton of Cra ig ie
Dudhope
Lyndhurst
CharlstonBurghmuir
Arbroath
Fiddes
Bridge of Dun
Luna Head
St. Fillans
Fin larig
Lochay
Cashley
Rannoch
Tummel
Bridge
Clunie
Kilchrennan
NantClachan
Port
Ann
Carradale
Auchencrosh
BOUNDARIES OF INFLUENCE
NGC BOUNDARY OF INFLUENCE
ON SCOTTISH POWER
SCOTTISH POWER BOUNDARY OF
INFLUENCE ON SCOTTISH & SOUTHERN
SCOTTISH POWER/NATIONAL GRID AREA
BOUNDARY
SCOTTISH & SOUTHERN BOUNDARY OF
INFLUENCE ON SCOTTISH POWER
SCOTTISH & SOUTHERN / SCOTTISH
POWER AREA BOUNDARY
Offshore (Indicative only)
Onshore (Indicative or fixed)
ZONE A
ZONE B
ZONE C
Zone A Base Rate £/MW
New App <100 15,000 100
100-1320 25,000 55
>1320 80,000 15
Zone B Base Rate £/MW
New App <100 25,000 180
100-1320 40,000 90
>1320 120,000 35
Zone C Base Rate £/MW
New App <100 35,000 260
100-1320 55,000 125
>1320 160,000 55
Offshore (Indicative only)
110,0000
Per Connection Site
£ Connecting to Zone C
110,000 Per Connection Site
£ Connecting to Zone C
72,000 Per Connection Site
£ Connecting to Zone B
72,000 Per Connection Site
£ Connecting to Zone B
45,000 Per Connection Site
£ Connecting to Zone A
45,000 Per Connection Site
£ Connecting to Zone A
Zone B Base Rate £/MW
New App <100 25,000 180
100-1320 40,000 90
>1320 120,000 3572,000 Per Connection Site
£ Connecting to Zone B
April 2017 The Statement of Use of System Charges (DRAFT)
29
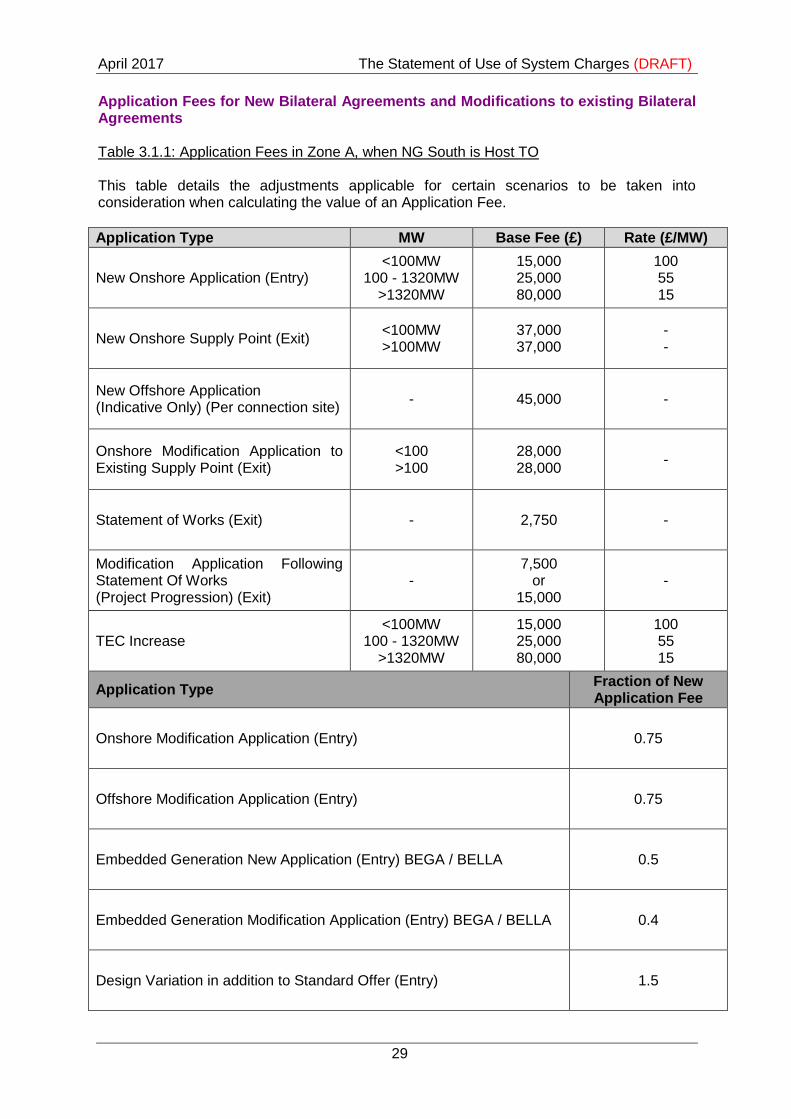
Application Fees for New Bilateral Agreements and Modifications to existing Bilateral Agreements Table 3.1.1: Application Fees in Zone A, when NG South is Host TO This table details the adjustments applicable for certain scenarios to be taken into consideration when calculating the value of an Application Fee.
Application Type MW Base Fee (£) Rate (£/MW)
New Onshore Application (Entry) <100MW
100 - 1320MW >1320MW
15,000 25,000 80,000
100 55 15
New Onshore Supply Point (Exit) <100MW >100MW
37,000 37,000
- -
New Offshore Application (Indicative Only) (Per connection site)
- 45,000 -
Onshore Modification Application to Existing Supply Point (Exit)
<100 >100
28,000 28,000
-
Statement of Works (Exit) - 2,750 -
Modification Application Following Statement Of Works (Project Progression) (Exit)
- 7,500
or 15,000
-
TEC Increase <100MW
100 - 1320MW >1320MW
15,000 25,000 80,000
100 55 15
Application Type Fraction of New Application Fee
Onshore Modification Application (Entry) 0.75
Offshore Modification Application (Entry) 0.75
Embedded Generation New Application (Entry) BEGA / BELLA 0.5
Embedded Generation Modification Application (Entry) BEGA / BELLA 0.4
Design Variation in addition to Standard Offer (Entry) 1.5
The Statement of Use of System Charges (DRAFT) April 2017
30
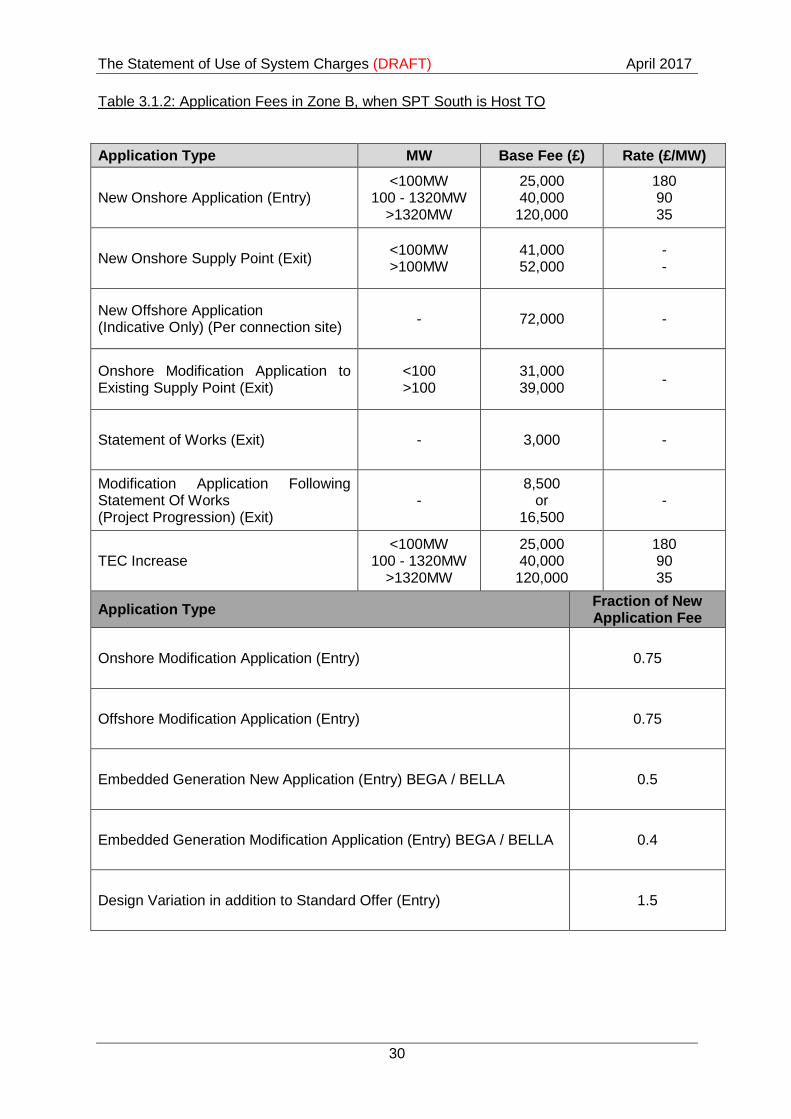
Table 3.1.2: Application Fees in Zone B, when SPT South is Host TO
Application Type MW Base Fee (£) Rate (£/MW)
New Onshore Application (Entry) <100MW
100 - 1320MW >1320MW
25,000 40,000
120,000
180 90 35
New Onshore Supply Point (Exit) <100MW >100MW
41,000 52,000
- -
New Offshore Application (Indicative Only) (Per connection site)
- 72,000 -
Onshore Modification Application to Existing Supply Point (Exit)
<100 >100
31,000 39,000
-
Statement of Works (Exit) - 3,000 -
Modification Application Following Statement Of Works (Project Progression) (Exit)
- 8,500
or 16,500
-
TEC Increase <100MW
100 - 1320MW >1320MW
25,000 40,000
120,000
180 90 35
Application Type Fraction of New Application Fee
Onshore Modification Application (Entry) 0.75
Offshore Modification Application (Entry) 0.75
Embedded Generation New Application (Entry) BEGA / BELLA 0.5
Embedded Generation Modification Application (Entry) BEGA / BELLA 0.4
Design Variation in addition to Standard Offer (Entry) 1.5

April 2017 The Statement of Use of System Charges (DRAFT)
31
Table 3.1.3: Application Fees in Zone B, when NG North is Host TO
Application Type MW Base Fee (£) Rate (£/MW)
New Onshore Application (Entry) <100MW
100 - 1320MW >1320MW
25,000 40,000
120,000
180 90 35
New Onshore Supply Point (Exit) <100MW >100MW
41,000 52,000
- -
New Offshore Application (Indicative Only) (Per connection site)
- 72,000 -
Onshore Modification Application to Existing Supply Point (Exit)
<100 >100
31,000 39,000
-
Statement of Works (Exit) - 3,000 -
Modification Application Following Statement Of Works (Project Progression) (Exit)
- 8,500
or 16,500
-
TEC Increase <100MW
100 - 1320MW >1320MW
25,000 40,000
120,000
180 90 35
Application Type Fraction of New Application Fee
Onshore Modification Application (Entry) 0.75
Offshore Modification Application (Entry) 0.75
Embedded Generation New Application (Entry) BEGA / BELLA 0.5
Embedded Generation Modification Application (Entry) BEGA / BELLA 0.4
Design Variation in addition to Standard Offer (Entry) 1.5
The Statement of Use of System Charges (DRAFT) April 2017
32
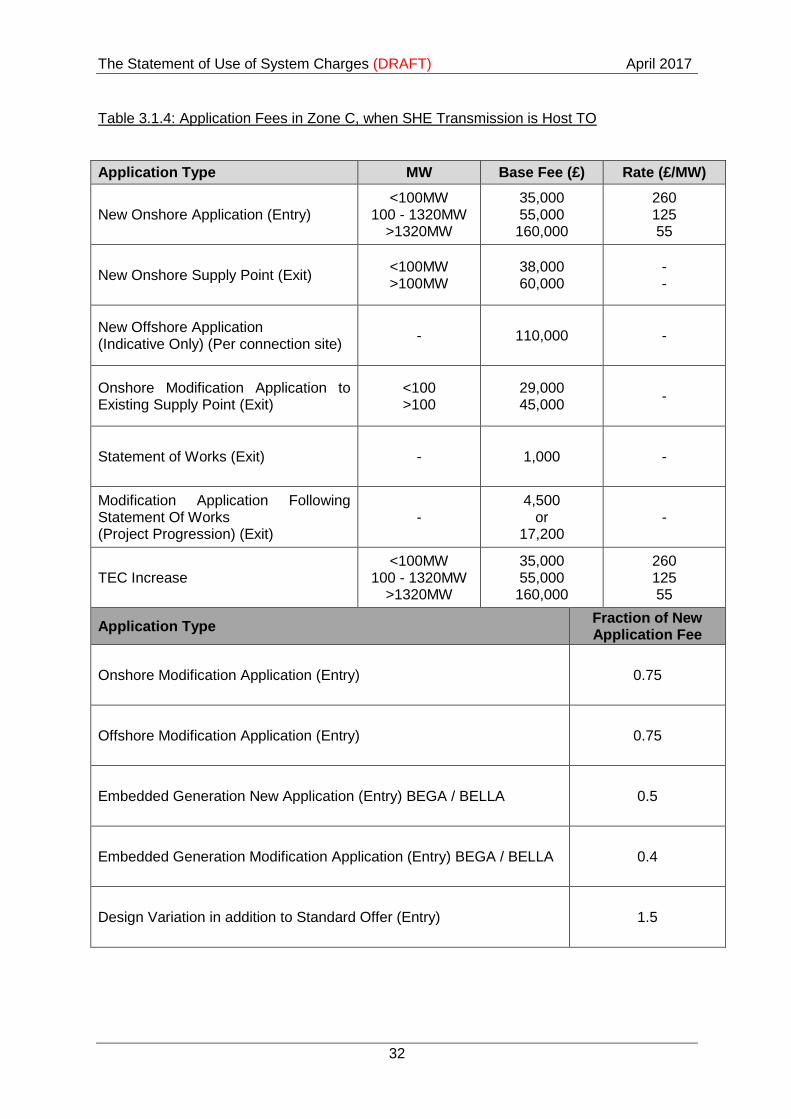
Table 3.1.4: Application Fees in Zone C, when SHE Transmission is Host TO
Application Type MW Base Fee (£) Rate (£/MW)
New Onshore Application (Entry) <100MW
100 - 1320MW >1320MW
35,000 55,000
160,000
260 125 55
New Onshore Supply Point (Exit) <100MW >100MW
38,000 60,000
- -
New Offshore Application (Indicative Only) (Per connection site)
- 110,000 -
Onshore Modification Application to Existing Supply Point (Exit)
<100 >100
29,000 45,000
-
Statement of Works (Exit) - 1,000 -
Modification Application Following Statement Of Works (Project Progression) (Exit)
- 4,500
or 17,200
-
TEC Increase <100MW
100 - 1320MW >1320MW
35,000 55,000
160,000
260 125 55
Application Type Fraction of New Application Fee
Onshore Modification Application (Entry) 0.75
Offshore Modification Application (Entry) 0.75
Embedded Generation New Application (Entry) BEGA / BELLA 0.5
Embedded Generation Modification Application (Entry) BEGA / BELLA 0.4
Design Variation in addition to Standard Offer (Entry) 1.5
April 2017 The Statement of Use of System Charges (DRAFT)
33
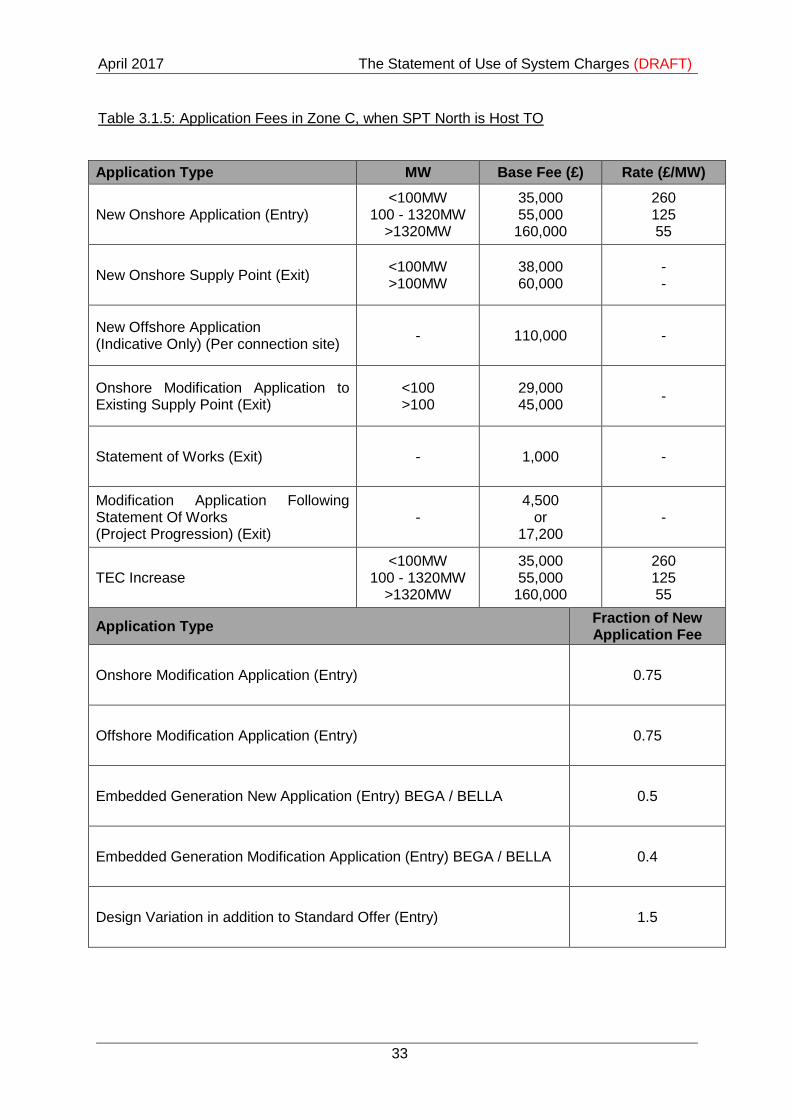
Table 3.1.5: Application Fees in Zone C, when SPT North is Host TO
Application Type MW Base Fee (£) Rate (£/MW)
New Onshore Application (Entry) <100MW
100 - 1320MW >1320MW
35,000 55,000
160,000
260 125 55
New Onshore Supply Point (Exit) <100MW >100MW
38,000 60,000
- -
New Offshore Application (Indicative Only) (Per connection site)
- 110,000 -
Onshore Modification Application to Existing Supply Point (Exit)
<100 >100
29,000 45,000
-
Statement of Works (Exit) - 1,000 -
Modification Application Following Statement Of Works (Project Progression) (Exit)
- 4,500
or 17,200
-
TEC Increase <100MW
100 - 1320MW >1320MW
35,000 55,000
160,000
260 125 55
Application Type Fraction of New Application Fee
Onshore Modification Application (Entry) 0.75
Offshore Modification Application (Entry) 0.75
Embedded Generation New Application (Entry) BEGA / BELLA 0.5
Embedded Generation Modification Application (Entry) BEGA / BELLA 0.4
Design Variation in addition to Standard Offer (Entry) 1.5
The Statement of Use of System Charges (DRAFT) April 2017
34
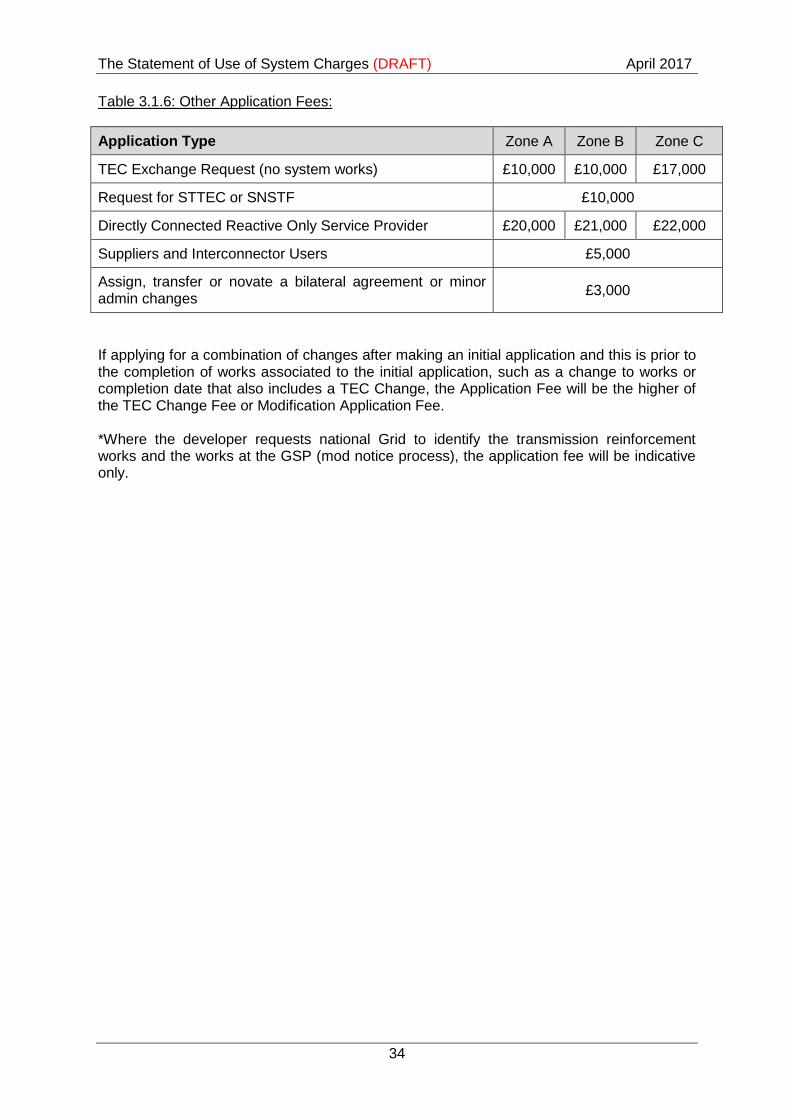
Table 3.1.6: Other Application Fees:
Application Type Zone A Zone B Zone C
TEC Exchange Request (no system works) £10,000 £10,000 £17,000
Request for STTEC or SNSTF £10,000
Directly Connected Reactive Only Service Provider £20,000 £21,000 £22,000
Suppliers and Interconnector Users £5,000
Assign, transfer or novate a bilateral agreement or minor admin changes
£3,000
If applying for a combination of changes after making an initial application and this is prior to the completion of works associated to the initial application, such as a change to works or completion date that also includes a TEC Change, the Application Fee will be the higher of the TEC Change Fee or Modification Application Fee. *Where the developer requests national Grid to identify the transmission reinforcement works and the works at the GSP (mod notice process), the application fee will be indicative only.
April 2017 The Statement of Use of System Charges (DRAFT)
35
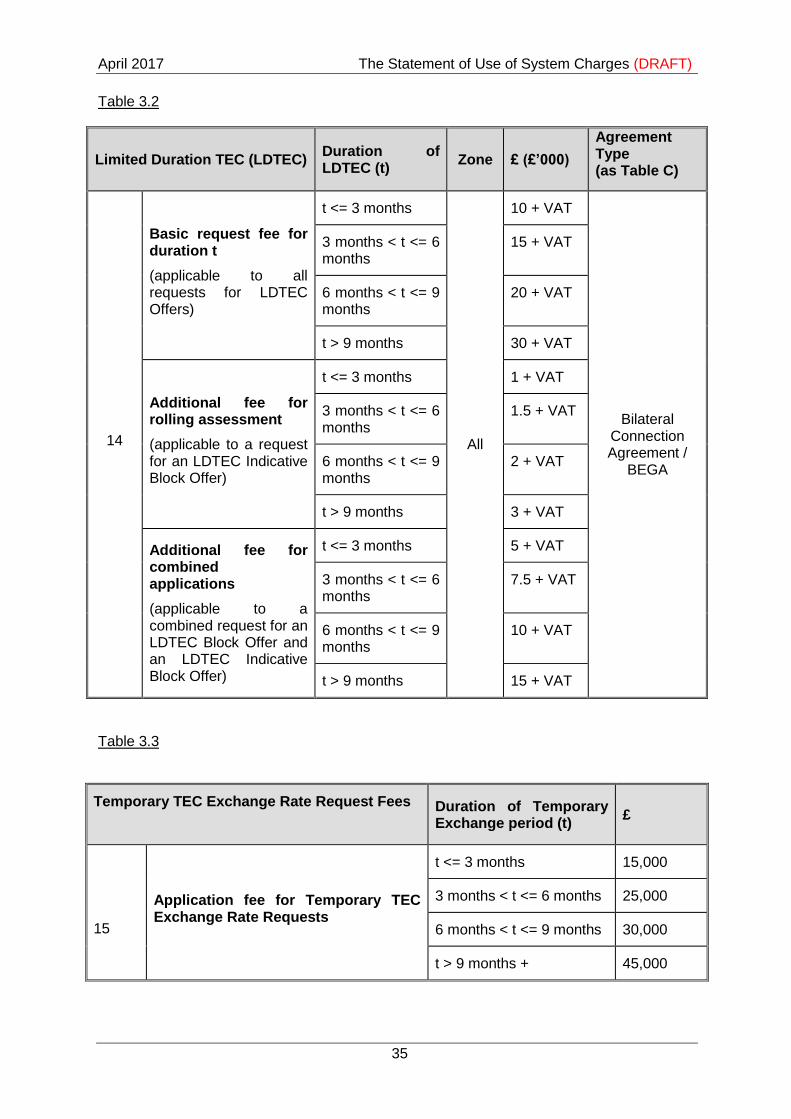
Table 3.2
Limited Duration TEC (LDTEC) Duration of LDTEC (t)
Zone £ (£’000)
Agreement Type (as Table C)
14
Basic request fee for duration t
(applicable to all requests for LDTEC Offers)
t <= 3 months
All
10 + VAT
Bilateral Connection Agreement /
BEGA
3 months < t <= 6 months
15 + VAT
6 months < t <= 9 months
20 + VAT
t > 9 months 30 + VAT
Additional fee for rolling assessment
(applicable to a request for an LDTEC Indicative Block Offer)
t <= 3 months 1 + VAT
3 months < t <= 6 months
1.5 + VAT
6 months < t <= 9 months
2 + VAT
t > 9 months 3 + VAT
Additional fee for combined applications
(applicable to a combined request for an LDTEC Block Offer and an LDTEC Indicative Block Offer)
t <= 3 months 5 + VAT
3 months < t <= 6 months
7.5 + VAT
6 months < t <= 9 months
10 + VAT
t > 9 months 15 + VAT
Table 3.3
Temporary TEC Exchange Rate Request Fees Duration of Temporary Exchange period (t)
£
15
Application fee for Temporary TEC Exchange Rate Requests
t <= 3 months 15,000
3 months < t <= 6 months 25,000
6 months < t <= 9 months 30,000
t > 9 months + 45,000
The Statement of Use of System Charges (DRAFT) April 2017
36
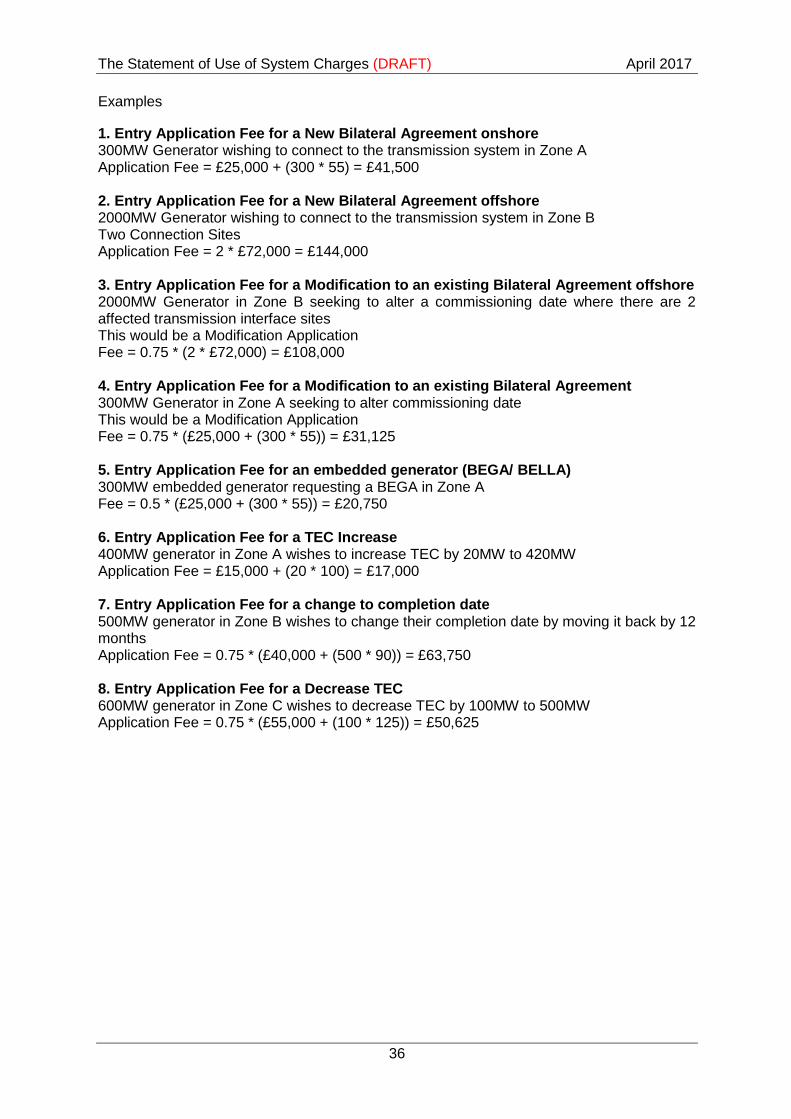
Examples
1. Entry Application Fee for a New Bilateral Agreement onshore 300MW Generator wishing to connect to the transmission system in Zone A Application Fee = £25,000 + (300 * 55) = £41,500 2. Entry Application Fee for a New Bilateral Agreement offshore 2000MW Generator wishing to connect to the transmission system in Zone B Two Connection Sites Application Fee = 2 * £72,000 = £144,000 3. Entry Application Fee for a Modification to an existing Bilateral Agreement offshore 2000MW Generator in Zone B seeking to alter a commissioning date where there are 2 affected transmission interface sites This would be a Modification Application Fee = 0.75 * (2 * £72,000) = £108,000 4. Entry Application Fee for a Modification to an existing Bilateral Agreement 300MW Generator in Zone A seeking to alter commissioning date This would be a Modification Application Fee = 0.75 * (£25,000 + (300 * 55)) = £31,125 5. Entry Application Fee for an embedded generator (BEGA/ BELLA) 300MW embedded generator requesting a BEGA in Zone A Fee = 0.5 * (£25,000 + (300 * 55)) = £20,750 6. Entry Application Fee for a TEC Increase 400MW generator in Zone A wishes to increase TEC by 20MW to 420MW Application Fee = £15,000 + (20 * 100) = £17,000 7. Entry Application Fee for a change to completion date 500MW generator in Zone B wishes to change their completion date by moving it back by 12 months Application Fee = 0.75 * (£40,000 + (500 * 90)) = £63,750 8. Entry Application Fee for a Decrease TEC 600MW generator in Zone C wishes to decrease TEC by 100MW to 500MW Application Fee = 0.75 * (£55,000 + (100 * 125)) = £50,625
April 2017 The Statement of Use of System Charges (DRAFT)
37
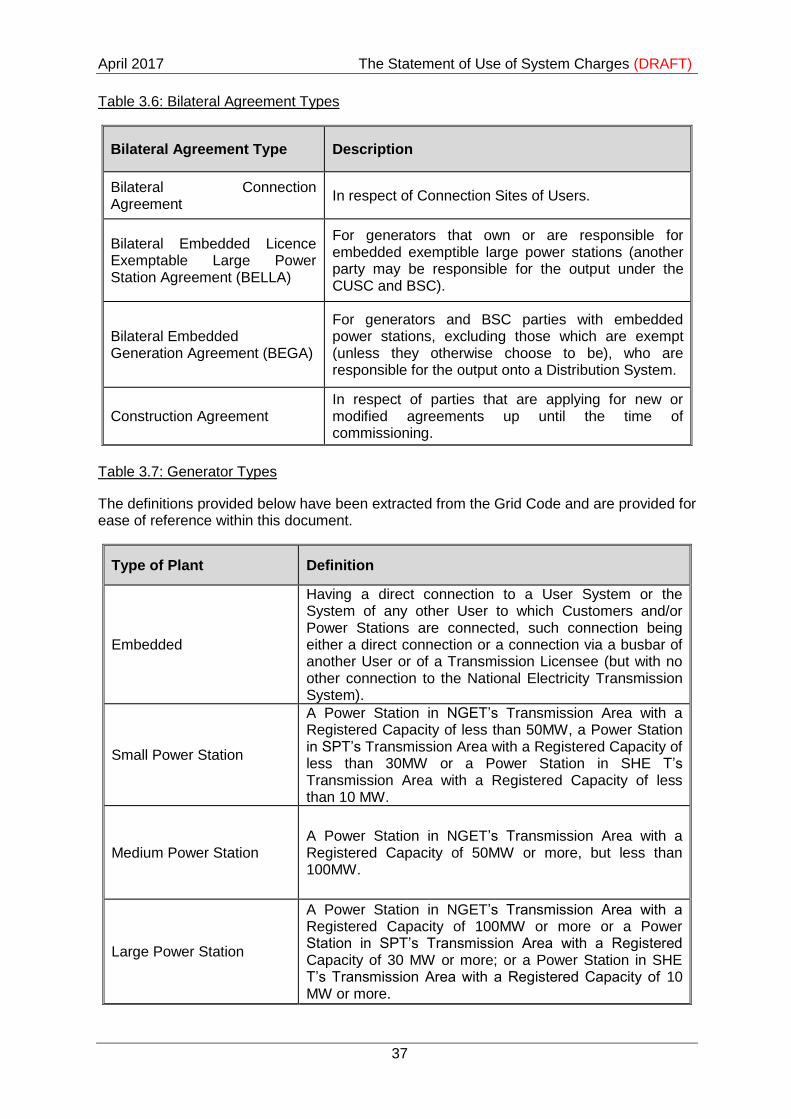
Table 3.6: Bilateral Agreement Types
Bilateral Agreement Type Description
Bilateral Connection Agreement
In respect of Connection Sites of Users.
Bilateral Embedded Licence Exemptable Large Power Station Agreement (BELLA)
For generators that own or are responsible for embedded exemptible large power stations (another party may be responsible for the output under the CUSC and BSC).
Bilateral Embedded Generation Agreement (BEGA)
For generators and BSC parties with embedded power stations, excluding those which are exempt (unless they otherwise choose to be), who are responsible for the output onto a Distribution System.
Construction Agreement In respect of parties that are applying for new or modified agreements up until the time of commissioning.
Table 3.7: Generator Types
The definitions provided below have been extracted from the Grid Code and are provided for ease of reference within this document.
Type of Plant Definition
Embedded
Having a direct connection to a User System or the System of any other User to which Customers and/or Power Stations are connected, such connection being either a direct connection or a connection via a busbar of another User or of a Transmission Licensee (but with no other connection to the National Electricity Transmission System).
Small Power Station
A Power Station in NGET’s Transmission Area with a Registered Capacity of less than 50MW, a Power Station in SPT’s Transmission Area with a Registered Capacity of less than 30MW or a Power Station in SHE T’s Transmission Area with a Registered Capacity of less than 10 MW.
Medium Power Station A Power Station in NGET’s Transmission Area with a Registered Capacity of 50MW or more, but less than 100MW.
Large Power Station
A Power Station in NGET’s Transmission Area with a Registered Capacity of 100MW or more or a Power Station in SPT’s Transmission Area with a Registered Capacity of 30 MW or more; or a Power Station in SHE T’s Transmission Area with a Registered Capacity of 10 MW or more.
The Statement of Use of System Charges (DRAFT) April 2017
38
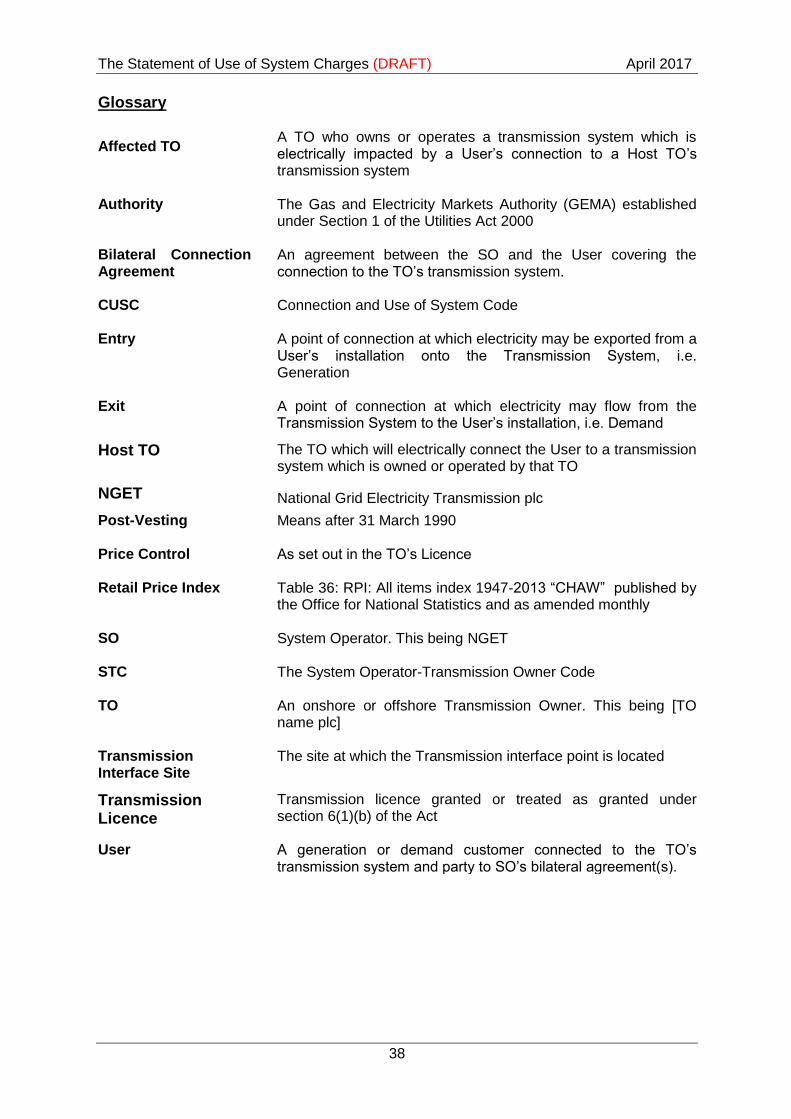
Glossary
Affected TO A TO who owns or operates a transmission system which is electrically impacted by a User’s connection to a Host TO’s transmission system
Authority The Gas and Electricity Markets Authority (GEMA) established under Section 1 of the Utilities Act 2000
Bilateral Connection Agreement
An agreement between the SO and the User covering the connection to the TO’s transmission system.
CUSC Connection and Use of System Code
Entry A point of connection at which electricity may be exported from a User’s installation onto the Transmission System, i.e. Generation
Exit A point of connection at which electricity may flow from the Transmission System to the User’s installation, i.e. Demand
i) Host TO The TO which will electrically connect the User to a transmission system which is owned or operated by that TO
ii) NGET National Grid Electricity Transmission plc
Post-Vesting Means after 31 March 1990
Price Control As set out in the TO’s Licence
Retail Price Index Table 36: RPI: All items index 1947-2013 “CHAW” published by the Office for National Statistics and as amended monthly
SO
System Operator. This being NGET
STC The System Operator-Transmission Owner Code
TO An onshore or offshore Transmission Owner. This being [TO name plc]
Transmission Interface Site
The site at which the Transmission interface point is located
iii) Transmission Licence
Transmission licence granted or treated as granted under section 6(1)(b) of the Act
User A generation or demand customer connected to the TO’s transmission system and party to SO’s bilateral agreement(s).
April 2017 The Statement of Use of System Charges (DRAFT)
39
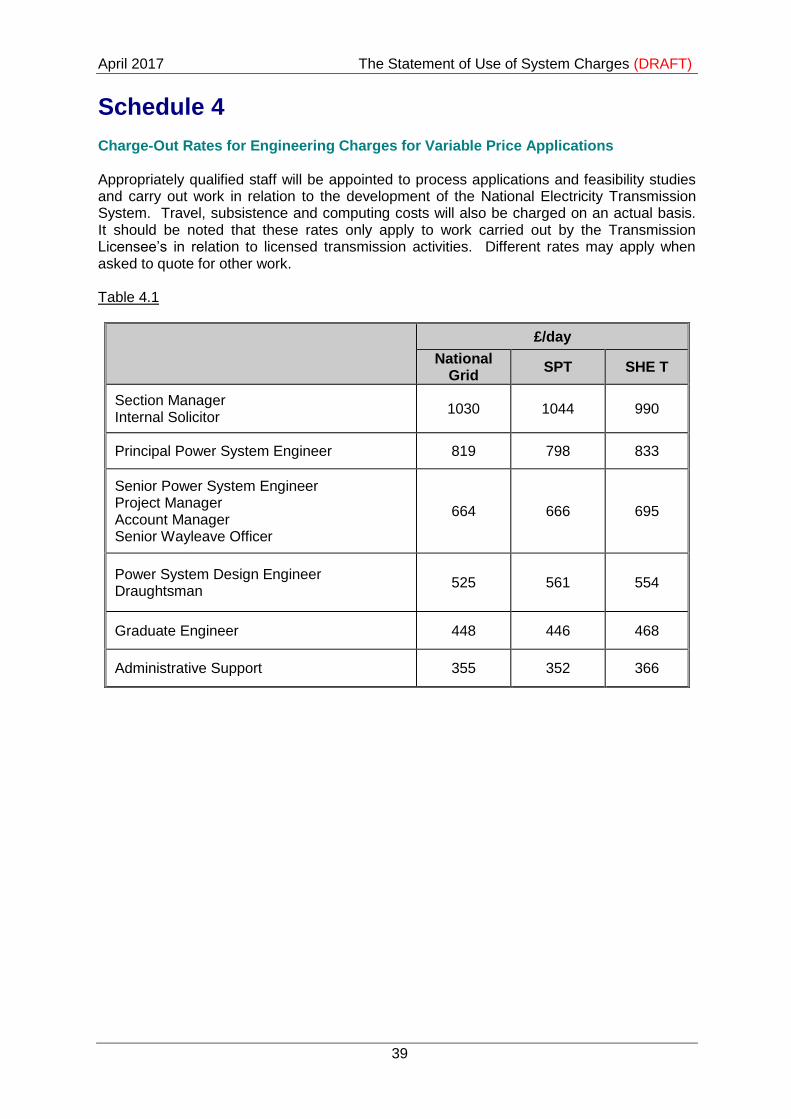
Schedule 4 Charge-Out Rates for Engineering Charges for Variable Price Applications Appropriately qualified staff will be appointed to process applications and feasibility studies and carry out work in relation to the development of the National Electricity Transmission System. Travel, subsistence and computing costs will also be charged on an actual basis. It should be noted that these rates only apply to work carried out by the Transmission Licensee’s in relation to licensed transmission activities. Different rates may apply when asked to quote for other work. Table 4.1
£/day
National Grid
SPT SHE T
Section Manager Internal Solicitor
1030 1044 990
Principal Power System Engineer 819 798 833
Senior Power System Engineer Project Manager Account Manager Senior Wayleave Officer
664 666 695
Power System Design Engineer Draughtsman
525 561 554
Graduate Engineer 448 446 468
Administrative Support 355 352 366

The Statement of Use of System Charges (DRAFT) April 2017
40
Schedule 5 Non-Capital Components applicable for Maintenance and Transmission Running Costs in Connection Charges for 2017/18 The non-capital component of the connection charge is divided into two parts, as set out below. Part A: Site Specific Maintenance Charges Site-specific maintenance charges will be calculated each year based on the forecast total site specific maintenance for GB divided by the total GAV of the transmission licensees GB connection assets, to arrive at a percentage of total GAV. For 2017/18 this will be 0.45%. Part B: Transmission Running Costs The Transmission Running Cost (TRC) factor is calculated at the beginning of each price control to reflect the appropriate amount of other Transmission Running Costs (rates, operation, indirect overheads) incurred by the transmission licensees that should be attributed to connection assets. The TRC factor is calculated by taking a proportion of the forecast Transmission Running Costs for the transmission licensees (based on operational expenditure figures from the latest price control) that corresponds with the proportion of the transmission licensees’ total connection assets as a function of their total business GAV. This cost factor is therefore expressed as a percentage of an asset's GAV and will be fixed for the entirety of the price control period. For 2013/14 to 2020/21 this will be 1.47%. To illustrate the calculation, the following example uses the average operating expenditure from the published price control and the connection assets of each transmission licensee expressed as a percentage of their total system GAV to arrive at a GB TRC of 1.47%:
Example: Connection assets as a percentage of total system GAV for each TO:
Scottish Power Transmission Ltd 18.6%
Scottish Hydro Transmission Ltd 7.5%
National Grid 16.3%
Published current price control average annual operating expenditure (£m):
Scottish Power Transmission Ltd 43.4
Scottish Hydro Transmission Ltd 33.1
National Grid 317.9
Total GB Connection GAV = £3.38bn GB TRC Factor = (18.6% x £43.4m + 7.5% x £33.1m + 16.3% x £317.1m) / £3.38bn GB TRC Factor = 1.84% Net GB TRC Factor = Gross GB TRC Factor – Site Specific Maintenance Factor* Net GB TRC Factor = 1.84% - 0.37% = 1.47%

April 2017 The Statement of Use of System Charges (DRAFT)
41
* Note – the Site Specific Maintenance Factor used to calculate the TRC Factor is that which applies for the first year of the price control period or in this example, is the 2013/14 Site Specific Maintenance Factor of 0.37%.
Illustrative Connection Asset Charges An indication of First Year Connection Asset Charges for new connection assets using estimates of Gross Asset Values are outlined in Appendix 1. Additional examples of connection charge calculations are included in Appendix 2 of this Statement to provide some general illustrations of how connection charge calculations are applied.
The Statement of Use of System Charges (DRAFT) April 2017
42
Appendix 1: Illustrative Connection Asset Charges 2017/18 First Year Connection Charges based on the RPI Method (6% rate of return) The following table provides an indication of typical charges for new connection assets. Before using the table, it is important to read through the notes below as they explain the assumptions used in calculating the figures. Calculation of Gross Asset Value (GAV) The GAV figures in the following table were calculated using the following assumptions:
Each asset is new
The GAV includes estimated costs of construction, engineering and Liquidated Damages premiums.
The GAV does not include Interest During Construction but does include a 5% risk factor to compensate for this.
For details of the Calculation of the Gross Asset Value, see Chapter 2 of The Statement of the Connection Charging Methodology (Section 14 Part I of the Connection and Use of System Code). Calculation of first year connection charge The first year connection charges in the following table were calculated using the following assumptions:
The assets are new
The assets are depreciated over 40 years
The rate of return is assumed to be 6% for RPI indexation
The connection charges include maintenance costs at the 2017/18 rate of 0.45% of the GAV
The connection charges include Transmission Running Costs at the 2017/18 rate of 1.47% of the GAV
For details of the Basic Annual Connection Charge Formula, see Chapter 2 of The Statement of the Connection Charging Methodology (Section 14 Part I of the Connection and Use of System Code). Please note that the actual charges will depend on the specific assets at a site. Charges applicable to specific works will be detailed in the User’s Bilateral Connection Agreement. Agreement specific GAVs and NAVs for each User will be made available on request. Notes on Assets Common Inclusions The estimates include Design, Project management, Site setup, equipment transportation to site, installation, commissioning Common exclusions VAT, Inflation, costs associated with planning, site complexities such as ecology, environmental, archeology, contamination, land purchase and management, Site access including road crossings,rivers,etc.,
April 2017 The Statement of Use of System Charges (DRAFT)
43
Notes and Assumptions Transformers
Plant: The above SGT cost estimates have been developed based on standard NG
specifications and ordered in bulk quantities (part of bulk procurement framework).
However SGT equipment cost depends heavily on the site specific specification &
requirements, number of units ordered, metal prices index, forex and various other
conditions driven by the market.
Civil: Based on nominal base sizes, good ground condition, no piling, no
contamination, shallow/ deep bund, Firewall (generic brick wall) on one side with
standard height of 8m.
Exclusions
Plant: Bay protection, control and SCADA system, below ground earthing, auxilliary
supplies such as AC/DC system (all considered under part of the Bay Cost
estimate).
Civil: Trenching/Ducting and pilling, Noise enclosure, access works, oil containment
drainage.
Single/Double Busbar bay Assumptions
Plant:The bay cost estimate is based on from NG standard bay drawing 41/177344.
Indicative prices provided for bay protection, control, cabling, auxiliary systems,
earthing are based on various assumptions(i.e. location of equipment, type of
equipment, trench layout, ratings, etc.,) and can vary based on site specific
conditions and requirements. Air insulated switchgear (AIS) technology is used in
costing and it can vary if Gas insulated switchgear (GIS) technology is used.
Civil: Nominal base sizes, dimensions of concrete footings, good ground condition.
Exclusions
Civil: Trenching / Ducting and piling
Cable Assumptions - All based on 1 circuit of 1 cable per phase, 100m straight, flat and unimpeded route within substation environment.
Standard AIS Cl3 terminations on steel AIS supports, c/w SVL’s, anti-touch shrouds,
corona rings, arc horns and solar protection as required.
XLPE Lead/Ali sheathed cable supply, Install, commission with High Voltage AC &
Sheath Testing
Earth Continuity Cable (ECC) & Link Boxes supply, Install & Connection included
DTS c/w terminations into Fibre Optic Terminal boxes on AIS support - on 400 &
275kV only
PD Monitoring/Testing on 400 & 275kV only
Full Design Verification & Assurance to NG Standards and Specifications
Cable Installed in new precast concrete troughs, flat formation, secured in CBS, with
cleats to prevent movement under fault conditions, 5T/11T loading standard concrete
lids, Connection & Modifications to earth mat
P&C Duct (1 x 90mm) Included (Max 100m excluding cable(s))
Excavation Waste disposal, Site Establishment / prelims, security & Access costs
Included

The Statement of Use of System Charges (DRAFT) April 2017
44
Standalone project(s) with its own design/project team
Water Management (if required)
Costs do not allow for any small quantity/MOQ surcharge that may be levied by
cable supplier
Exclusions
Civils: Piling
Plant: Oil works, pilot cabling (within substation scope)
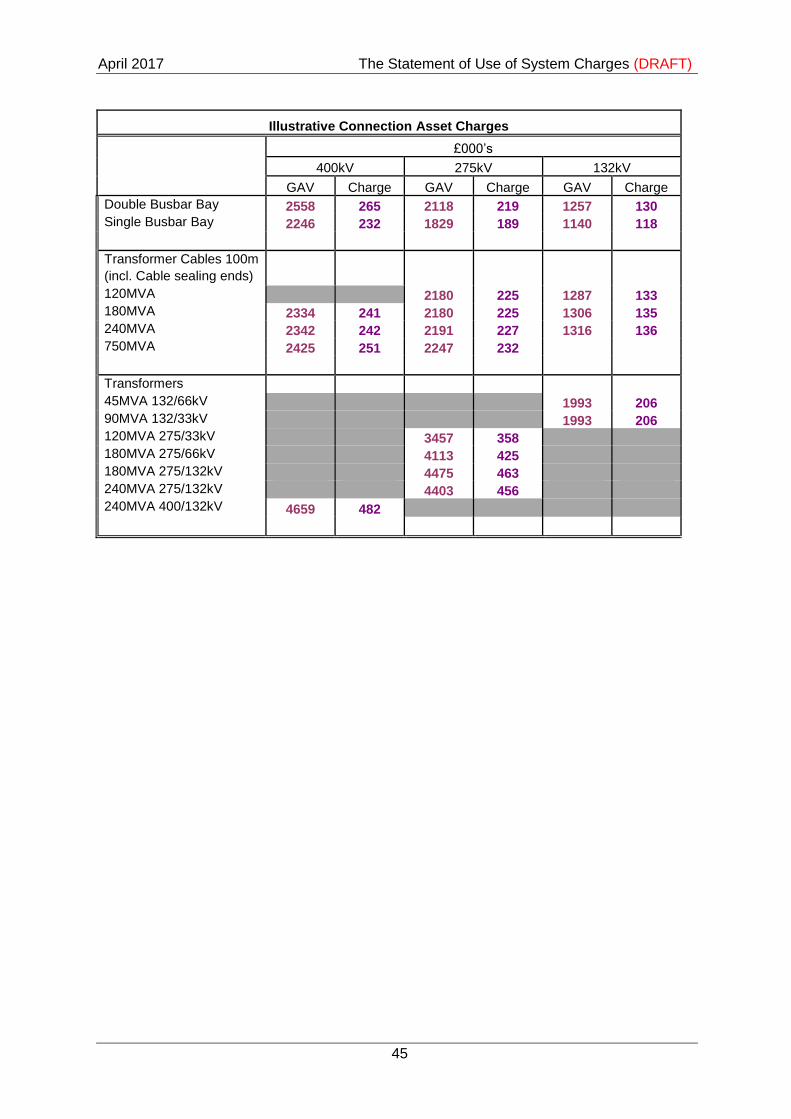
April 2017 The Statement of Use of System Charges (DRAFT)
45
Illustrative Connection Asset Charges
£000’s
400kV 275kV 132kV
GAV Charge GAV Charge GAV Charge
Double Busbar Bay 2558 265 2118 219 1257 130 Single Busbar Bay 2246 232 1829 189 1140 118
Transformer Cables 100m
(incl. Cable sealing ends)
120MVA 2180 225 1287 133 180MVA 2334 241 2180 225 1306 135 240MVA 2342 242 2191 227 1316 136 750MVA 2425 251 2247 232
Transformers 45MVA 132/66kV 1993 206 90MVA 132/33kV 1993 206 120MVA 275/33kV 3457 358 180MVA 275/66kV 4113 425 180MVA 275/132kV 4475 463 240MVA 275/132kV 4403 456 240MVA 400/132kV 4659 482
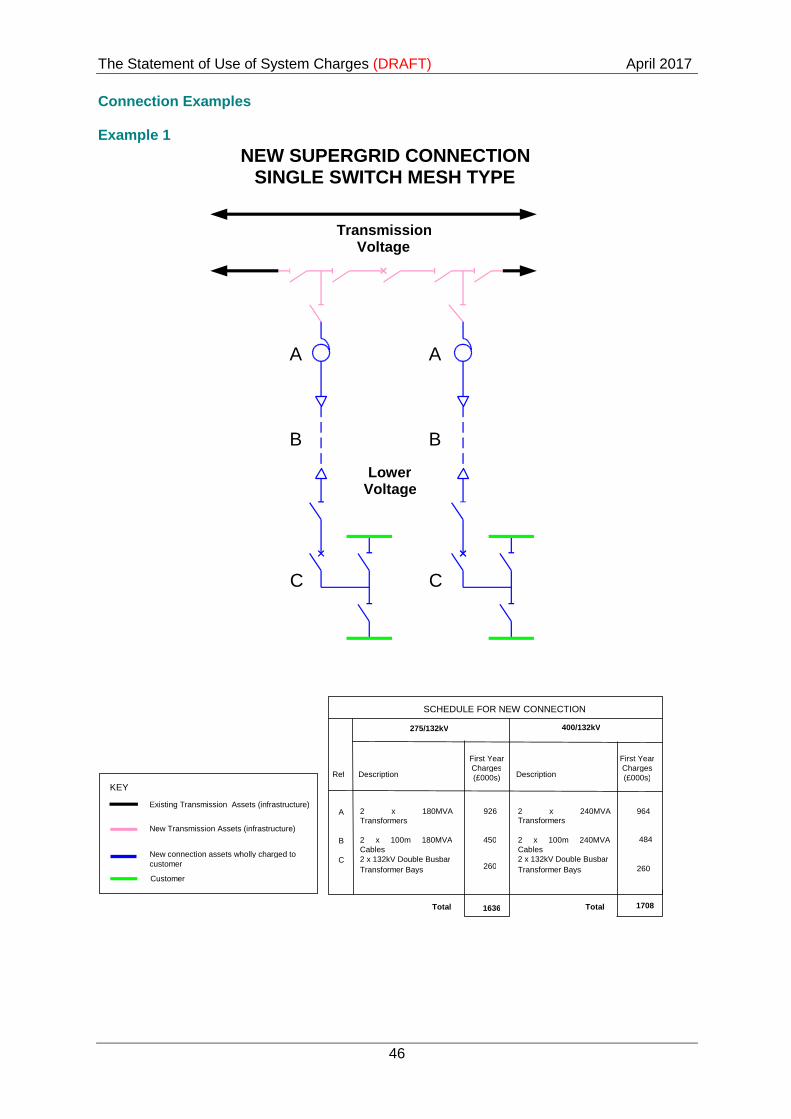
The Statement of Use of System Charges (DRAFT) April 2017
46
Connection Examples Example 1
NEW SUPERGRID CONNECTION
SINGLE SWITCH MESH TYPE
A
B
C
A
B
C
Lower Voltage
Transmission Voltage
SCHEDULE FOR NEW CONNECTION
Ref
A
B
C
2 x 180MVA
Transformers
2 x 100m 180MVA
Cables 2 x 132kV Double Busbar Transformer Bays
Description
926
450
260
1636 Total
KEY:
Existing Transmission Assets (infrastructure)
New connection assets wholly charged to customer Customer Assets
New Transmission Assets (infrastructure)
275/132kV 400/132kV
Description First Year Charges (£000s)
First Year Charges (£000s)
2 x 240MVA Transformers
2 x 100m 240MVA
Cables 2 x 132kV Double Busbar Transformer Bays
964
484
260
1708 Total
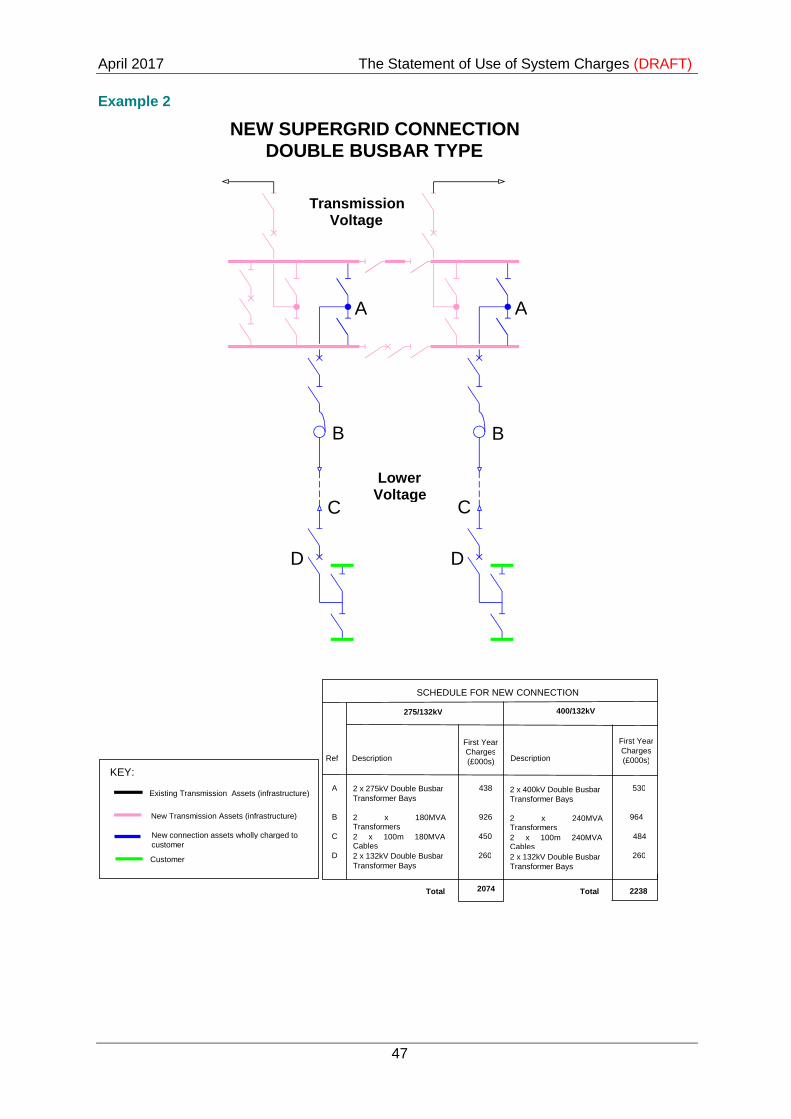
April 2017 The Statement of Use of System Charges (DRAFT)
47
Example 2
NEW SUPERGRID CONNECTION
DOUBLE BUSBAR TYPE
A
B
C
A
B
C
D D
Transmission Voltage
Lower Voltage
KEY:
Customer Assets
SCHEDULE FOR NEW CONNECTION
Ref
A
B
C
D
2 x 275kV Double Busbar Transformer Bays
2 x 180MVA Transformers 2 x 100m 180MVA Cables 2 x 132kV Double Busbar Transformer Bays
Description
2074 Total
275/132kV 400/132kV
Description First Year Charges (£000s)
2238 Total
Existing Transmission Assets (infrastructure)
New Transmission Assets (infrastructure)
New connection assets wholly charged to customer
438
926
450
260
2 x 400kV Double Busbar Transformer Bays
2 x 240MVA Transformers 2 x 100m 240MVA Cables 2 x 132kV Double Busbar Transformer Bays
530
964
484
260
First Year Charges (£000s)

The Statement of Use of System Charges (DRAFT) April 2017
48
Example 3
EXTENSION OF SINGLE SWITCH MESH
TO FOUR SWITCH MESH
(extension to single user site)
A A
Transmission Voltage
B B
C C
D D
Lower Voltage
KEY:
New connection assets wholly charged to customer
Customer Assets
Existing connection assets wholly charged to another user
New Transmission Assets (infrastructure) Existing Transmission Assets (infrastructure)
SCHEDULE FOR NEW CONNECTION
Ref
A
B
C
D
2 x 100m 180MVA Cables
2 x 180MVA Transformers 2 x 100m 180MVA Cables 2 x 132kV Double Busbar Transformer Bays
Description
2086 Total
275/132kV 400/132kV
Description First Year Charges (£000s)
2192 Total
450
926
450
260
2 x 100m 240MVA Cables
2 x 240MVA Transformers 2 x 100m 240MVA Cables 2 x 132kV Double Busbar Transformer Bays
484
964
484
260
First Year Charges (£000s)
Other Users Assets
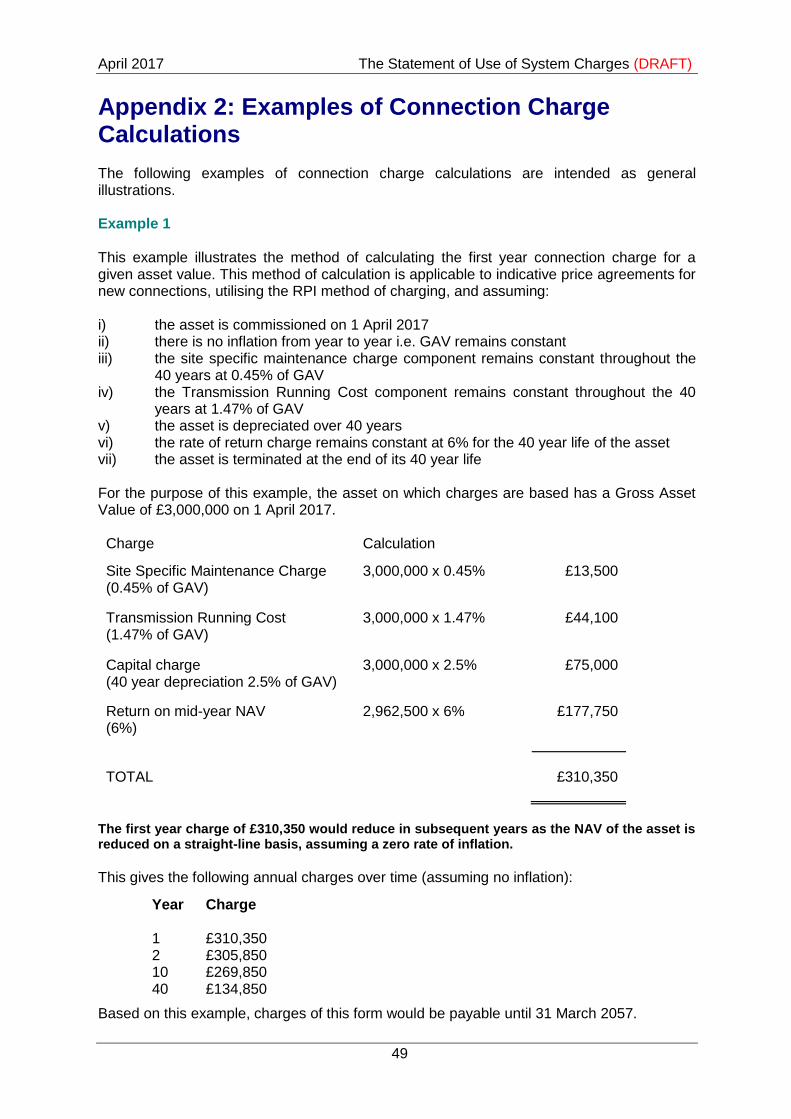
April 2017 The Statement of Use of System Charges (DRAFT)
49
Appendix 2: Examples of Connection Charge Calculations The following examples of connection charge calculations are intended as general illustrations. Example 1 This example illustrates the method of calculating the first year connection charge for a given asset value. This method of calculation is applicable to indicative price agreements for new connections, utilising the RPI method of charging, and assuming: i) the asset is commissioned on 1 April 2017 ii) there is no inflation from year to year i.e. GAV remains constant iii) the site specific maintenance charge component remains constant throughout the
40 years at 0.45% of GAV iv) the Transmission Running Cost component remains constant throughout the 40
years at 1.47% of GAV v) the asset is depreciated over 40 years vi) the rate of return charge remains constant at 6% for the 40 year life of the asset vii) the asset is terminated at the end of its 40 year life For the purpose of this example, the asset on which charges are based has a Gross Asset Value of £3,000,000 on 1 April 2017. Charge Calculation
Site Specific Maintenance Charge (0.45% of GAV)
3,000,000 x 0.45% £13,500
Transmission Running Cost (1.47% of GAV)
3,000,000 x 1.47% £44,100
Capital charge (40 year depreciation 2.5% of GAV)
3,000,000 x 2.5% £75,000
Return on mid-year NAV (6%)
2,962,500 x 6% £177,750
TOTAL £310,350
The first year charge of £310,350 would reduce in subsequent years as the NAV of the asset is reduced on a straight-line basis, assuming a zero rate of inflation.
This gives the following annual charges over time (assuming no inflation):
Year Charge
1 £310,350 2 £305,850 10 £269,850 40 £134,850
Based on this example, charges of this form would be payable until 31 March 2057.
The Statement of Use of System Charges (DRAFT) April 2017
50
Example 2 The previous example assumes that the asset is commissioned on 1 April 2017. If it is assumed that the asset is commissioned on 1 July 2017, the first year charge would equal 9/12th of the first year annual connection charge i.e. £232,762.50 This gives the following annual charges over time:
Year Charge
1 £232,762.50 (connection charge for period July 2017 to March 2018) 2 £305,850 10 £269,850 40 £134,850
Example 3 In the case of a firm price agreement, there will be two elements in the connection charge, a finance component and a running cost component. These encompass the four elements set out in the examples above. Using exactly the same assumptions as those in example 1 above, the total annual connection charges will be the same as those presented. These charges will not change as a result of the adoption of a different charging methodology by National Grid, providing that the connection boundary does not change. Example 4 If a User has chosen a 20-year depreciation period for their Post Vesting connection assets and subsequently remains connected at the site beyond the twentieth year their charges are calculated as follows. For years 21-40 they will pay a connection charge based on the following formula: Annual Connection Chargen = SSFn (RPIGAVn)+ TCn (GAVn) The NAV will be zero and the asset will be fully depreciated so there will be no rate of return or depreciation element to the charge.
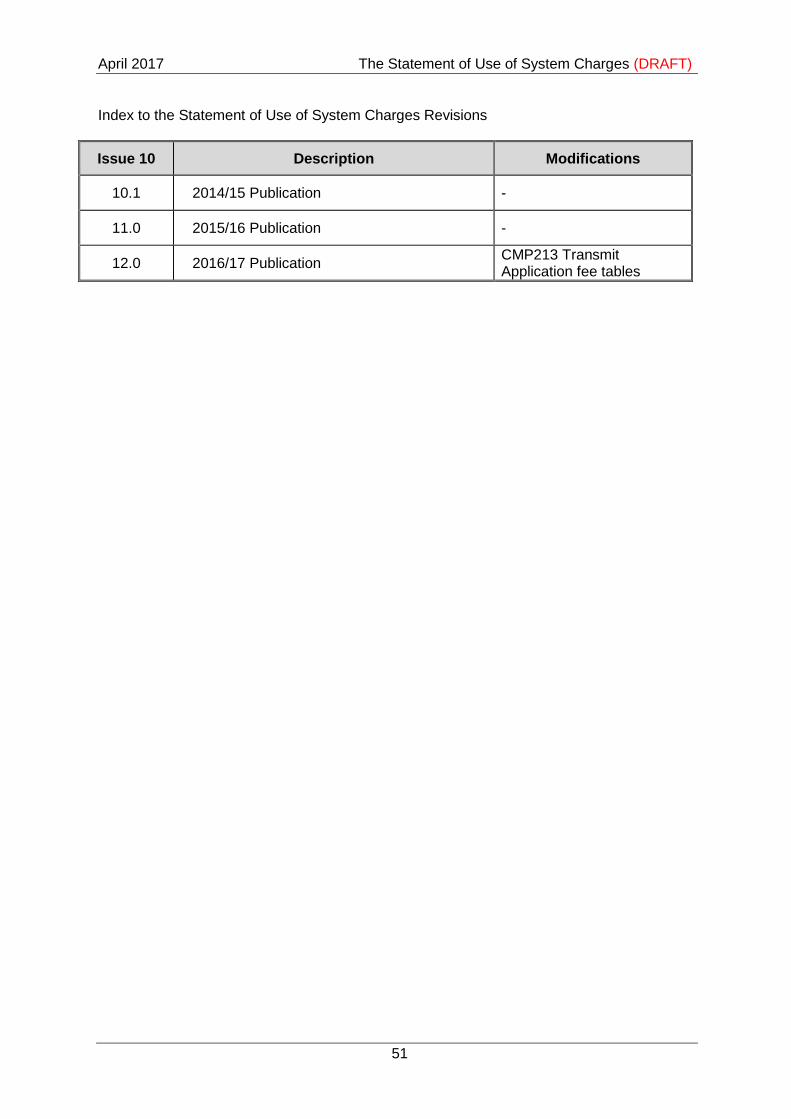
April 2017 The Statement of Use of System Charges (DRAFT)
51
Index to the Statement of Use of System Charges Revisions
Issue 10 Description Modifications
10.1 2014/15 Publication -
11.0 2015/16 Publication -
12.0 2016/17 Publication CMP213 Transmit Application fee tables


![STATEMENT OF CHARGES AND NOTICE OF HEARING...2020/10/20 · 11. Section 2405(a) authorizes the Superintendent to bring a statement of charges and initiate a hearing “[w]henever](https://static.fdocuments.us/doc/165x107/608b65650086183f356cd089/statement-of-charges-and-notice-of-hearing-20201020-11-section-2405a.jpg)