STATE WATER RESOURCES CONTROL BOARD DIVISION OF WATER QUALITY … · Initial Study – Monterey Bay...
78
Initial Study – Monterey Bay Aquarium Ocean Plan Exception Page 1 of 78 STATE WATER RESOURCES CONTROL BOARD DIVISION OF WATER QUALITY P.O. BOX 100 SACRAMENTO, CA 95812-0100 INITIAL STUDY 1. Background Project Title: Exception to the California Ocean Plan for the Monterey Bay Aquarium Discharge into the Pacific Grove Area of Special Biological Significance Applicant: Monterey Bay Aquarium 886 Cannery Row Monterey, CA 93940 Applicant’s Contact Persons: Roger Phillips, Applied Research Manager (831) 648-4974, [email protected] Charles Aslanian, Vice President of Facilities Operations (831) 648-7957, [email protected] Note: This document was originally prepared and signed on January 18, 2011. Based on Comments received this Initial Study has been revised on July 18, 2011. All revisions are shown in red font. No changes were made to the environmental checklist, the mandatory findings of significance, and the determination. 2. Introduction The State Water Resources Control Board (State Water Board), under Resolution No. 74-28, designated certain Areas of Special Biological Significance (ASBS) in the adoption of water quality control plans for the control of wastes discharged to ocean waters. To date, thirty-four coastal and offshore island sites have been designated ASBS. Among the ASBS designated was the Pacific Grove ASBS. Since 1983, the California Ocean Plan (Ocean Plan) has prohibited waste discharges to ASBS (State Water Board 1983). Similar to previous versions of the Ocean Plan, the 2001 Ocean Plan (State Water Board 2001) states: “Waste shall not be discharged to areas designated as being of special biological significance. Discharges shall be located a sufficient distance from such designated areas to assure maintenance of natural water quality conditions in these areas.” The Pacific Grove ASBS was designated for the following reasons: (1) it has a diversity of habitat and biological assemblages; (2) it has dense beds of giant kelp Macrocystis
-
Upload
phungthuan -
Category
Documents
-
view
218 -
download
2
Transcript of STATE WATER RESOURCES CONTROL BOARD DIVISION OF WATER QUALITY … · Initial Study – Monterey Bay...

Initial Study – Monterey Bay Aquarium Ocean Plan Exception Page 1 of 78
STATE WATER RESOURCES CONTROL BOARD DIVISION OF WATER QUALITY P.O. BOX 100 SACRAMENTO, CA 95812-0100 INITIAL STUDY 1. Background Project Title: Exception to the California Ocean Plan for the Monterey Bay Aquarium Discharge into the Pacific Grove Area of Special Biological Significance Applicant: Monterey Bay Aquarium
886 Cannery Row Monterey, CA 93940
Applicant’s Contact Persons: Roger Phillips, Applied Research Manager (831) 648-4974, [email protected]
Charles Aslanian, Vice President of Facilities Operations
(831) 648-7957, [email protected] Note: This document was originally prepared and signed on January 18, 2011. Based on Comments received this Initial Study has been revised on July 18, 2011. All revisions are shown in red font. No changes were made to the environmental checklist, the mandatory findings of significance, and the determination.
2. Introduction The State Water Resources Control Board (State Water Board), under Resolution No. 74-28, designated certain Areas of Special Biological Significance (ASBS) in the adoption of water quality control plans for the control of wastes discharged to ocean waters. To date, thirty-four coastal and offshore island sites have been designated ASBS. Among the ASBS designated was the Pacific Grove ASBS. Since 1983, the California Ocean Plan (Ocean Plan) has prohibited waste discharges to ASBS (State Water Board 1983). Similar to previous versions of the Ocean Plan, the 2001 Ocean Plan (State Water Board 2001) states: “Waste shall not be discharged to areas designated as being of special biological significance. Discharges shall be located a sufficient distance from such designated areas to assure maintenance of natural water quality conditions in these areas.” The Pacific Grove ASBS was designated for the following reasons: (1) it has a diversity of habitat and biological assemblages; (2) it has dense beds of giant kelp Macrocystis

Initial Study – Monterey Bay Aquarium Ocean Plan Exception July 2011
Page 2 of 78
pyrifera; (3) surf grass dominates large areas; (4) endangered sea otters forage in this area (State Water Board 1979). Assembly Bill 2800 (Chapter 385, Statutes of 2000), the Marine Managed Areas Improvement Act, was approved by the Governor on September 8, 2000. This law added sections to the Public Resources Code (PRC) that are relevant to ASBS (PRC§36602(d)(6)). The Marine Managed Areas Improvement Act defines six categories of marine managed areas (MMAs). These six categories are marine reserves, marine parks, marine conservation areas, marine recreation management areas, marine cultural preservation areas, and state water quality protected areas (SWQPAs). Section 36700 (f) of the PRC defines a State Water Quality Protection Area (SWQPA) as “a nonterrestrial marine or estuarine area designated to protect marine species or biological communities from an undesirable alteration in natural water quality, including, but not limited to, areas of special biological significance that have been designated by the State Water Board through its water quality control planning process.” Section 36710 (f) of the PRC stated: “In a state water quality protection area, point source waste and thermal discharges shall be prohibited or limited by special conditions. Nonpoint source pollution shall be controlled to the extent practicable. No other use is restricted.” The classification of ASBS as SWQPAs went into effect on January 1, 2003 (without Board action) pursuant to Section 36750 of the PRC. Senate Bill 512 (Chapter 854, Statutes of 2004) amended the MMAs portion of the PRC, effective January 1, 2005, to clarify that ASBS are a subset of SWQPAs and require special protection as determined by the State Water Board pursuant to the California Ocean Plan and the California Thermal Plan. Specifically, SB 512 amended the PRC section 36700 (f) definition of state water quality protection area to add the following: ''‘Areas of special biological significance’ are a subset of state water quality protection areas, and require special protection as determined by the State Water Board pursuant to the California Ocean Plan adopted and reviewed pursuant to Article 4 (commencing with Section 13160) of Chapter 3 of Division 7 of the Water Code and pursuant to the Water Quality Control Plan for Control of Temperature in the Coastal and Interstate Waters and Enclosed Bays and Estuaries of California (California Thermal Plan) adopted by the State Board." Section 36710(f) of the PRC was also amended as follows: "In a State Water Quality Protection Area, waste discharges shall be prohibited or limited by the imposition of special conditions in accordance with the Porter-Cologne Water Quality Control Act (Division 7 (commencing with Section 13000) of the Water Code) and implementing regulations, including, but not limited to, the California Ocean Plan adopted and reviewed pursuant to Article 4 (commencing with Section 13160) of Chapter 3 of Division 7 of the Water Code and the Water Quality Control Plan for Control of Temperature in the Coastal and Interstate Waters and Enclosed Bays and Estuaries of California (California Thermal Plan) adopted by the state board. No other use is restricted." This language replaced the prior wording stating that point sources into ASBS must be prohibited or limited by special conditions, and that nonpoint sources must be controlled

Initial Study – Monterey Bay Aquarium Ocean Plan Exception July 2011
Page 3 of 78
to the extent practicable. In other words, the absolute discharge prohibition in the Ocean Plan stands, unless of course an exception is granted. The terms and conditions in the mitigated negative declaration and in this initial study are special protections recommended by staff for the Pacific Grove ASBS, and constitute the special conditions referred to in Section 36710(f) of the PRC. Section III (I)(1) of the 2001 Ocean Plan states: “The State Board may, in compliance with the California Environmental Quality Act, subsequent to a public hearing, and with the concurrence of the U.S. Environmental Protection Agency, grant exceptions where the Board determines: a. The exception will not compromise protection of ocean waters for beneficial uses, and, b. The public interest will be served.” On October 18, 2004, the State Water Resources Control Board (State Water Board) notified Monterey Bay Aquarium to cease storm water and nonpoint source waste discharges into an ASBS or to request an exception under the Ocean Plan. On December 2, 2004 the Monterey Bay Aquarium responded with a request for an exception to the California Ocean. Subsequently, the State Water Board provided general instructions for exception applications. On February 15th, 2006 the State Water Board sent a letter to the Monterey Bay Aquarium providing specific instructions and deadlines for submission of their application. The State Water Board then received an application for an individual exception to the Ocean Plan prohibition against waste discharges to ASBS from the Monterey Bay Aquarium dated August 31st, 2006. The information in this Initial Study relies on the information provided in MBAs 2006 application. Since that time, MBA has made great strides in reducing and in some cases eliminating waste discharges to and adjacent to the Pacific Grove ASBS. MBA has also greatly enhanced and redesigned their aquaria seawater and disinfection system since the 2006 application originally submitted to the State Water Board. This new and updated information is provided as an Addendum at the end of this document. 3. Project Description The Monterey Bay Aquarium seeks an exception from the Ocean Plan’s prohibition on discharges into ASBS. The exception with conditions, if approved, would allow their continued waste seawater effluent and storm water discharge into and adjacent to the Pacific Grove ASBS. This would provide additional protections for beneficial uses that are not currently provided.
4. Environmental Setting 4.1.1 Pacific Grove ASBS General Overview The Pacific Grove ASBS is oriented in a northwest-southeast direction, adjacent to the town of Pacific Grove in Monterey County. The official boundary description as stated

Initial Study – Monterey Bay Aquarium Ocean Plan Exception July 2011
Page 4 of 78
in the State Water Resources Control Board publication Areas of Special Biological Significance (1976) is as follows: Ocean areas within the following boundaries as they existed April 1, 1963: Beginning at the point of intersection of the southeasterly corporate limit line of the City of Pacific Grove produced, and the line of mean high tide of the Bay of Monterey; thence northwesterly along said line of mean high tide to the intersection with the westerly corporate limit line of said City (Asilomar Avenue produced); then north 19° 22’ east along said westerly corporate limit line produced, to the point in the Bay of Monterey where the depth of water in said bay is sixty (60) feet measured from the level of mean low tide; thence southeasterly along the line in said bay which line is at a constant depth of sixty (60) feet measured from the level of mean low tide, to the intersection with the southeasterly corporate limit line of said city produced; thence south 58° 58’ west along said southeasterly corporate limit line produced, to the point of beginning (State Water Board 1979). 4.1.2 ASBS Setting The location of the ASBS at the outer, southernmost extreme of Monterey Bay results in oceanographic and biological features that resemble those of the open ocean. The ASBS is relatively close to the Monterey Submarine Canyon and may be affected by canyon as well as coastal upwelling. The oceanographic seasons in the ASBS, particularly in the western portion, generally correspond with those offshore. Currents in the ASBS are weak, highly variable, and largely influenced by the wind. There is some evidence of a clockwise gyre, or predominantly onshore water movement, during the Upwelling Period. Because the ASBS is in close proximity to upwelling activity, is shallow, and adjacent to no major drainages, the following conditions exist: (1) surface temperatures are low; (2) thermoclines are unstable and poorly developed; (3) salinity is high and does not fluctuate radically; (4) dissolved oxygen is relatively low; and (5) nutrient levels vary spatially and temporally . The narrowness of the intertidal zone in the eastern portion of the ASBS appears to limit species diversity and abundance; both of the latter features increase to the west as the intertidal zone widens. The seawall adjacent to the ASBS is important in mitigating cliff erosion and channeling and controlling access to the intertidal zone (State Water Board 1979). 4.1.3 ASBS Physical Description The Pacific Grove ASBS consists of two adjacent, separately designated, marine reserves. The eastern portion of the ASBS includes Hopkins Marine Life Refuge. The western portion encompasses Pacific Grove Marine Gardens Fish Refuge. The term “marine gardens” refers to the extensive kelp beds in this area. The coastline becomes more exposed to coastal waters as it proceeds from east to west along the ASBS. Pt. Pinos, only 0.3 miles (0.5 km) west of the ASBS, marks the southern end of Monterey Bay. This long, low-relief granite point continues sub-tidally as a shallow rocky reef, which is an extreme navigational hazard. Both the point and the reef offer considerable
Initial Study – Monterey Bay Aquarium Ocean Plan Exception July 2011
Page 5 of 78
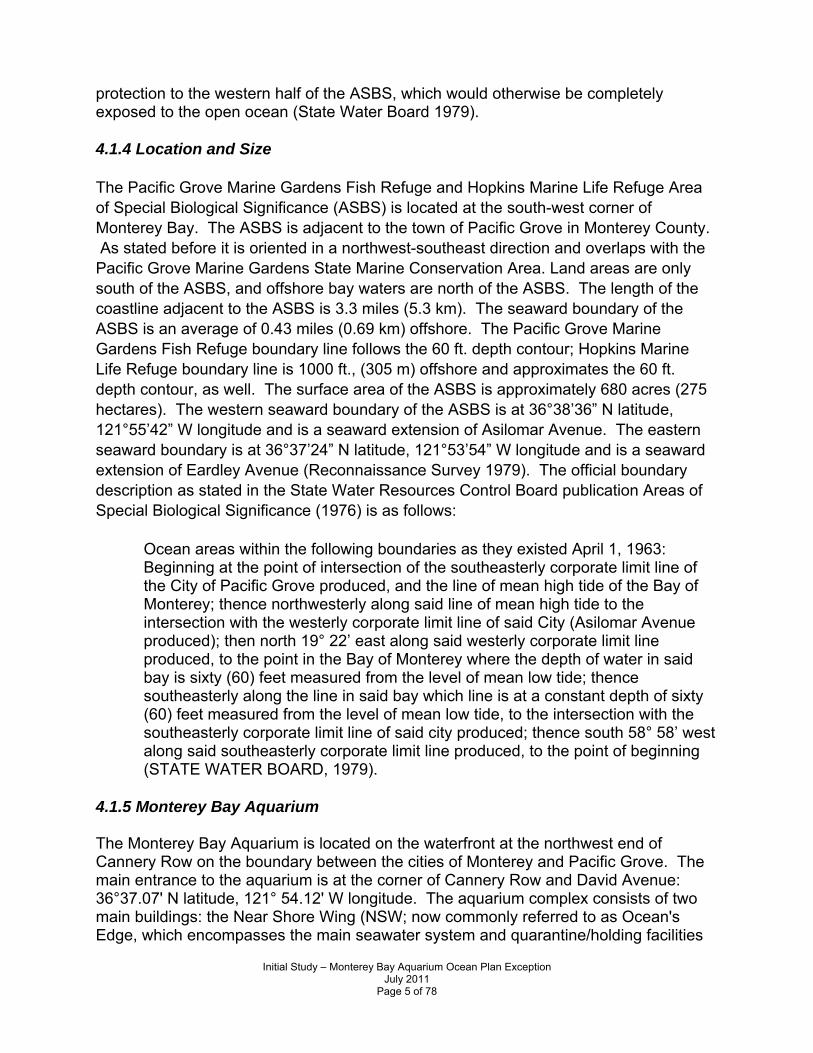
protection to the western half of the ASBS, which would otherwise be completely exposed to the open ocean (State Water Board 1979). 4.1.4 Location and Size The Pacific Grove Marine Gardens Fish Refuge and Hopkins Marine Life Refuge Area of Special Biological Significance (ASBS) is located at the south-west corner of Monterey Bay. The ASBS is adjacent to the town of Pacific Grove in Monterey County. As stated before it is oriented in a northwest-southeast direction and overlaps with the Pacific Grove Marine Gardens State Marine Conservation Area. Land areas are only south of the ASBS, and offshore bay waters are north of the ASBS. The length of the coastline adjacent to the ASBS is 3.3 miles (5.3 km). The seaward boundary of the ASBS is an average of 0.43 miles (0.69 km) offshore. The Pacific Grove Marine Gardens Fish Refuge boundary line follows the 60 ft. depth contour; Hopkins Marine Life Refuge boundary line is 1000 ft., (305 m) offshore and approximates the 60 ft. depth contour, as well. The surface area of the ASBS is approximately 680 acres (275 hectares). The western seaward boundary of the ASBS is at 36°38’36” N latitude, 121°55’42” W longitude and is a seaward extension of Asilomar Avenue. The eastern seaward boundary is at 36°37’24” N latitude, 121°53’54” W longitude and is a seaward extension of Eardley Avenue (Reconnaissance Survey 1979). The official boundary description as stated in the State Water Resources Control Board publication Areas of Special Biological Significance (1976) is as follows:
Ocean areas within the following boundaries as they existed April 1, 1963: Beginning at the point of intersection of the southeasterly corporate limit line of the City of Pacific Grove produced, and the line of mean high tide of the Bay of Monterey; thence northwesterly along said line of mean high tide to the intersection with the westerly corporate limit line of said City (Asilomar Avenue produced); then north 19° 22’ east along said westerly corporate limit line produced, to the point in the Bay of Monterey where the depth of water in said bay is sixty (60) feet measured from the level of mean low tide; thence southeasterly along the line in said bay which line is at a constant depth of sixty (60) feet measured from the level of mean low tide, to the intersection with the southeasterly corporate limit line of said city produced; thence south 58° 58’ west along said southeasterly corporate limit line produced, to the point of beginning (STATE WATER BOARD, 1979).
4.1.5 Monterey Bay Aquarium The Monterey Bay Aquarium is located on the waterfront at the northwest end of Cannery Row on the boundary between the cities of Monterey and Pacific Grove. The main entrance to the aquarium is at the corner of Cannery Row and David Avenue: 36°37.07' N latitude, 121° 54.12' W longitude. The aquarium complex consists of two main buildings: the Near Shore Wing (NSW; now commonly referred to as Ocean's Edge, which encompasses the main seawater system and quarantine/holding facilities

Initial Study – Monterey Bay Aquarium Ocean Plan Exception July 2011
Page 6 of 78
and, the Outer Bay Wing (OBW). The southeastern boundary of ASBS # 19, Hopkins Marine Life Refuge, is an extension of the boundary between the cities of [New] Monterey and Pacific Grove. As such, the southeastern boundary of ASBS # 19 runs through the NSW of the aquarium complex and out to the 60 foot depth contour. (MBA Exception App. 1-1) 4.2 Climate The ASBS has a Mediterranean climate. Upwelling activity encourages a high incidence of fog, which in turn moderates air temperature (State Water Board 1979). The ASBS lies within the latitudinal range dominated by the Pacific high pressure cell, a clockwise-moving gyre with its center at about 40°N latitude. The proximity of this high pressure cell to the California coast is responsible for large-scale weather patterns within the ASBS. Rainfall is moderate within the ASBS and highly seasonal. The persistence of the Pacific High almost totally excludes rainfall during the summer. The rainy season begins whenever the Pacific High is dislodged; this can occur as early as September, or as late as January. The length of the rainy season is also highly variable, such that March and April can experience the heaviest rains, or no rain at all. Wind direction varies seasonally with the location of the Pacific High pressure cell. When this cell is centered over the North Pacific, generally between April and September, the coast catches the eastern edge of the gyre, and prevailing winds are from the northwest. In Monterey, prevailing winds are from the north or northwest over 58% of the time in the spring and summer. The strongest northwest winds usually occur in March and April. During the winter, the Pacific High is frequently dislodged by low pressure systems, in which atmospheric rotation is counter clockwise. Thus, winds accompanying such storm fronts will be from the south, southwest or southeast, depending upon the direction of the storm’s approach. Northerly winds occur as the storm front passes eastward, and represent the western side of the counterclockwise moving gyre. Prevailing winds are still from the northwest, north-northwest or north more than 47% of the time, but are generally weaker than in spring and summer. Air temperatures in the ASBS are moderate and show little diurnal or seasonal variation. The average annual maximum temperature is 71.1 ºF (21.7°C); the average annual minimum temperature is 48.6°F (9.2°C). The proximity of both the bay and the ocean serves to moderate fluctuations in nearby land temperatures. The afternoon sea breeze keeps maximum temperatures down, whereas the evening fog traps heat radiated off the land and prevents early morning temperatures from dropping further. Fog is a characteristic feature of Pacific Grove weather, particularly in the late spring and summer. During this period, a low-lying fog bank generally persists in the area with only short afternoon breaks. Fog is most prevalent in July, August, and September. Fog is a highly localized phenomenon. Its occurrence is related to that of upwelling, which creates a maximum range between air temperatures over land and water. Fog formation is least common during the fall, when warmer oceanic water invades nearshore areas (State Water Board 1979).
Initial Study – Monterey Bay Aquarium Ocean Plan Exception July 2011
Page 7 of 78
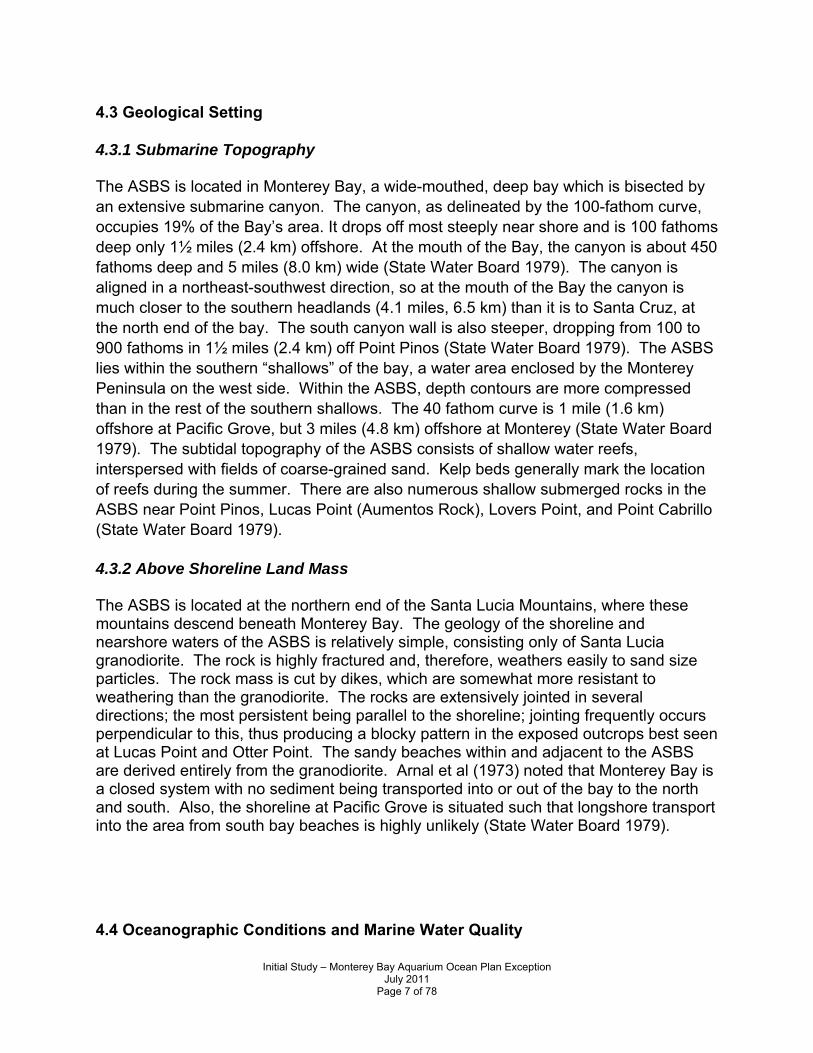
4.3 Geological Setting 4.3.1 Submarine Topography The ASBS is located in Monterey Bay, a wide-mouthed, deep bay which is bisected by an extensive submarine canyon. The canyon, as delineated by the 100-fathom curve, occupies 19% of the Bay’s area. It drops off most steeply near shore and is 100 fathoms deep only 1½ miles (2.4 km) offshore. At the mouth of the Bay, the canyon is about 450 fathoms deep and 5 miles (8.0 km) wide (State Water Board 1979). The canyon is aligned in a northeast-southwest direction, so at the mouth of the Bay the canyon is much closer to the southern headlands (4.1 miles, 6.5 km) than it is to Santa Cruz, at the north end of the bay. The south canyon wall is also steeper, dropping from 100 to 900 fathoms in 1½ miles (2.4 km) off Point Pinos (State Water Board 1979). The ASBS lies within the southern “shallows” of the bay, a water area enclosed by the Monterey Peninsula on the west side. Within the ASBS, depth contours are more compressed than in the rest of the southern shallows. The 40 fathom curve is 1 mile (1.6 km) offshore at Pacific Grove, but 3 miles (4.8 km) offshore at Monterey (State Water Board 1979). The subtidal topography of the ASBS consists of shallow water reefs, interspersed with fields of coarse-grained sand. Kelp beds generally mark the location of reefs during the summer. There are also numerous shallow submerged rocks in the ASBS near Point Pinos, Lucas Point (Aumentos Rock), Lovers Point, and Point Cabrillo (State Water Board 1979). 4.3.2 Above Shoreline Land Mass The ASBS is located at the northern end of the Santa Lucia Mountains, where these mountains descend beneath Monterey Bay. The geology of the shoreline and nearshore waters of the ASBS is relatively simple, consisting only of Santa Lucia granodiorite. The rock is highly fractured and, therefore, weathers easily to sand size particles. The rock mass is cut by dikes, which are somewhat more resistant to weathering than the granodiorite. The rocks are extensively jointed in several directions; the most persistent being parallel to the shoreline; jointing frequently occurs perpendicular to this, thus producing a blocky pattern in the exposed outcrops best seen at Lucas Point and Otter Point. The sandy beaches within and adjacent to the ASBS are derived entirely from the granodiorite. Arnal et al (1973) noted that Monterey Bay is a closed system with no sediment being transported into or out of the bay to the north and south. Also, the shoreline at Pacific Grove is situated such that longshore transport into the area from south bay beaches is highly unlikely (State Water Board 1979). 4.4 Oceanographic Conditions and Marine Water Quality
Initial Study – Monterey Bay Aquarium Ocean Plan Exception July 2011
Page 8 of 78
4.4.1 Currents Winds, bottom topography, tidal cycles, and the proximity of the open coast influence currents within the ASBS. Current patterns are also influenced by prevailing offshore currents including the California Current and the Davidson Current. As the California Current travels south along the coast, surface waters are driven offshore. This causes upwelling of deeper waters along the coast (State Water Board 1979). Currents within the ASBS are weak and variable. Because this is a nearshore area, winds, bottom topography and the tidal cycle exert considerable influence on the speed and direction of currents at any particular time. However, the ASBS is also located in close proximity to the open coast, and current patterns are also influenced by prevailing offshore currents. The southward flowing California Current predominates in offshore surface waters between about February and October. This current is the eastern leg of the massive, clockwise-moving North Pacific Gyre; consequently, it brings waters of more northern origin to the central California coast. The influence of the California Current on circulation patterns in the bay depends largely on its speed, which varies seasonally. When it first appears in surface waters, in February, the California Current has an average speed of about .04 knots. Current speed increases rapidly to 0.21 knots in March, and reaches a maximum of 0.28 knots in July. Subsequently, the speed decreases to about 0.07 knots in September and October. The seasonal presence of the California Current corresponds with that of the Pacific high pressure cell, which is responsible for prevailing northwest winds. As the California Current travels south along the coast, surface waters are driven to the right, or offshore, by the combination of northwest winds and the Coriolis force. Upwelling of deeper waters occurs along the coast, causing this oceanographic season to be termed the upwelling period. The closest area of coastal upwelling is 6 to 12 miles (10 to 19 km) south of Monterey Bay. Northwest winds and the California Current both weaken in the early fall, allowing offshore, oceanic water to invade nearshore regions. Both the onset and duration of this oceanographic season, the Oceanic Period, are highly variable; it generally occurs between September and October. The Davidson Period, from about November to February, is characterized by the surfacing of the Davidson Current, a massive, northward flowing counter-current. Throughout most of the year, the Davidson Current flows beneath the California Current, at depths greater than 655 ft. (200 m). It gradually rises to shallower depths in the fall and reverses current direction intermittently even in surface waters during the winter. This current carries equatorial Pacific water of higher salinity and temperature than generally exists at this latitude and has an important moderating effect on winter ocean temperatures. As with the California Current, the influence of the Davidson Current on Monterey Bay circulation patterns depends somewhat on its speed. Current speed increases from about 0.04 knots in November to a maximum of 0.14 knots in December and January, and current direction shifts from the south to the southeast. The onset of the Davidson Period corresponds with the advance of atmospheric low pressure cells, and often begins abruptly with the year's first winter storm. The northward flowing current is deflected onshore by the Coriolis force, and downwelling results. Particularly during

Initial Study – Monterey Bay Aquarium Ocean Plan Exception July 2011
Page 9 of 78
storms, downwelling is evidenced by large nearshore swells and causes vertical mixing to depths of up to 163 to 330 ft. (50 to 100 m). Upwelled waters enter Monterey Bay near Pt. Pinos, following the contours of the submarine canyon, and exit near Santa Cruz to the north. As the canyon is oriented in a southwest-northeast direction, the entrance of upwelled water imparts a general counter-clockwise current pattern in the Bay. However, a portion of the entering water sometimes splits off at Pt. Pinos and forms a clockwise eddy near the ASBS. Oceanic waters generally reach the ASBS during a portion of the oceanic period, as the ASBS is located at the outer edge of the bay. The blue, warmer oceanic water is easily distinguished from the bay's typical cold, greener water. Currents are probably weaker and more variable than during the Upwelling Period. Nearshore currents off Cannery Row tended to be directed offshore, such that drift bottles were recovered often near Santa Cruz. When water movement was onshore, recoveries were made at a more westerly position than during the Upwelling Period. This could be attributed to a lessening of northwest winds and/or disappearance of a clockwise gyre in the south bay. The Davidson Current is more sluggish than the California Current, and thus its effect on bay circulation is more easily counteracted by prevailing winds. Blaskovich (1973) in (SWCRB 1979) estimated that the Davidson Current determined surface circulation patterns in the bay only when wind speeds were less than one meter per second (about 2.2 miles per hour) (State Water Board 1979). 4.4.2 Water Quality and Temperature The seawater of the area can be characterized as a coastal water mass in a transitional area. The coastal water is influenced by the subarctic Pacific and Eastern North Pacific Central water masses, which are carried into the area by the southward flowing California current. Salinities in the area are generally constant and range from 33o/oo to 34o/oo throughout the year. Periods of maximum temperature generally occur during the months of August and September. Periods of minimum temperature occur during March, April or May, depending upon the occurrence of localized upwelling. Upwelling in the area results from strong northwest or northeast winds, which displace coastal surface water offshore and drive deeper, nutrient-rich water to the surface. The Davidson Current, a northward-flowing, warm, low-salinity current, is usually evident off this area during the fall months of October and November (State Water Board 1979). 5. Marine Biological Resources of the ASBS 5.1 Benthic Biota 5.1.1 Point Pinos Survey (2002) Tenera performed “A Comparative Intertidal Study and User Survey, Point Pinos, California” (July 2003), which was submitted as part of the City of Pacific Grove’s exception application. The purpose of the Point Pinos Survey was to investigate the effects of visitor use on the Point Pinos rocky shoreline located on the Monterey

Initial Study – Monterey Bay Aquarium Ocean Plan Exception July 2011
Page 10 of 78
Peninsula, and just outside the western boundary of the Pacific Grove ASBS, and was not designed to survey the biological community at outfall locations, or the effects of discharges on the ASBS. In this report, site descriptions were compared to Point Pinos, which receives high levels of visitor use because of its scenic values and easy accessibility from roads, adjoining parking lots, and trails. One of the main attractions of Point Pinos is the rich, diverse marine life along the rocky shore. Tide pools are common in the area, and small sandy beaches also occur along the upper shore. Five sites surveyed in the State Water Board 1979 Reconnaissance Survey Report (State Water Board 1979) were revisited in July 2002. One of the five sites was located at Point Pinos and the other four sites were situated along the shoreline between Point Pinos and Hopkins Marine Station. A species list was developed for each site by walking the area and noting all species encountered. All identifications were made in the field. In contrast, it was not clear in the original study if samples had been collected for laboratory identification. The tide level was slightly above MLLW (above the surf grass zone) during the 2002 survey. Two biologists worked separately in the search effort at each site and created a combined species list for each site. The combined search effort at each site was between 1-2 hours. The Point Pinos report found it difficult to use the data from the State Water Board 1979 Reconnaissance Report (field survey in 1977) and current data to make direct comparisons over time, as the species list appeared to be affected by differences in the intensity of search effort, time spent at each site, tidal levels during the surveys, and detail to adequately characterize the sampling sites. It was found that the most common species were still present in all areas in both surveys, but there was uncertainty concerning the continued or past occurrences of less common species. Without the same sampling effort in both surveys, there was no assurance in whether a species was not present or simply overlooked. The total number of algal and invertebrate species found at the Point Pinos site was similar between the 1977 and 2002 surveys. In contrast, more species were found at each of the four other sites in the 2002 survey compared to the 1977 survey, but all of the sites also had species that were unique to one or the other survey. The appendices in the 1979 State Water Board Report contain other species lists. Tenera found that those lists could not be used for comparison with the current survey. The list of intertidal invertebrates for several areas in the State Water Board Report is based on the cumulative listings from 27 literature and museum references dating in the 1940s-1960s. The species were tabulated for large general areas (Point Pinos, Monterey Peninsula, Pacific Grove, Hopkins Marine Station). Because the collecting locations were not specified, the data were of limited use in comparing changes in faunal composition over time. Also, the number of species found in each area probably reflects the number of times each area was sampled. Tenera found, however, that

Initial Study – Monterey Bay Aquarium Ocean Plan Exception July 2011
Page 11 of 78
Point Pinos was a popular study area between the 1940s and 1960s, as the species list for Point Pinos is the longest. Tenera concludes that, from their observations, overall diversity has not changed at the Point Pinos site since the survey in 1977. Tenera found one conclusive difference, however, between the 1977 and 2002 surveys. This was a lack of sea palms (Postelsia palmaeformis) in the present survey, although they were not able to conclude whether its absence was due to visitor impacts or other causes. Although not listed as a species of special concern or of rare, endangered, or threatened status by DFG or the U.S. Fish and Wildlife Service, California Code of Regulations prohibit cutting or disturbing this species. Regardless, this species is illegally collected for consumption. 5.1.2 Monterey Bay Aquarium Research Institute Survey (2004, 2008) A paper by J. P. Barry (Monterey Bay Aquarium Research Institute), C. H. Baxter (Monterey Bay Aquarium Research Institute and Hopkins Marine Station), R. D. Sagarin (Hopkins Marine Station), and S. E. Gilman (Hopkins Marine Station) was reviewed. Of 45 invertebrate species studied at the Hopkins Marine Station in the Pacific Grove ASBS, the abundances of 8 southern species increased and the abundances of 5 northern species decreased. Annual mean shoreline ocean temperatures at Pacific Grove have increased by 0.75° C over the past 60 years. This paper’s conclusion was that changes in the invertebrate fauna in the rocky intertidal community between the period 1931 to 1933 and the period 1993 to 1994 indicate that species' ranges shifted northward, consistent with predictions of change associated with climate change (i.e., warming). However, State Water Board staff also reviewed other work by Schiel et al (2004), which found (for the area at Diablo Canyon) that changes in community structure were common and there was little support for the hypothesis of predictable directional changes in northern and southern species based on biogeographic models (i.e., there was no obvious connection to global warming). The State Water Board staff asked Dr. Raimondi (2008) to evaluate Barry et al to determine if the data provided had any potential for use in the question of the effects of runoff on marine life. According to Dr. Raimondi, this paper did not provide any insight relevant to an assessment of runoff into ASBS. 5.1.3 Biological Reconnaissance Survey (1977) A biological reconnaissance survey was conducted in 1977 and the report for that survey was published by the State Water Board in 1979. That report enumerated 87 species of algae and plants, 521 species of invertebrates and 17 species of fish that inhabit the ASBS. The subtidal zone contains a high level of species diversity including both vertebrates and invertebrates. Giant kelp dominated in the subtidal area along with dense areas of surf grass, creating jungle-like areas. The kelp bed was most extensive at Pt. Pinos where there is more rocky substrate.

Initial Study – Monterey Bay Aquarium Ocean Plan Exception July 2011
Page 12 of 78
The intertidal substrate of the ASBS consists of granite boulders and outcrops, interspersed with small, sandy coves. Species diversity and abundance is generally limited. Sea lettuce, split whip, rockweed, ad corallines are examples of the algal species found within the ASBS; while the aggregating anemone and the solitary anemone, barnacles, crabs, red abalone, brown and black turban snails, and various sponges are examples of the diverse fauna found at the ASBS. Filamentous red algae were common on all rocks, mixed with worm tubes and loose sand grains (State Water Board 1979). 5.1.4 PISCO Survey (2003, 2006) The Partnership for Interdisciplinary Studies of Coastal Oceans (PISCO) is a consortium of four west coast universities that focuses on regional-scale, multidisciplinary research related to coastal rocky reefs. The CBS is a large-scale research project designed to measure diversity and abundance of algae and invertebrates in rocky intertidal communities on the West Coast of temperate North America. This study combines extraordinary precision at the local scale across an expansive spatial scale to create an unprecedented data set for investigating intertidal community structure patterns. In January 2003 and December 2006 PISCO conducted a Coastal Biodiversity Survey (CBS) in the ASBS at Hopkins Marine Station. The CBS consists of taking a 30 meter section of the rocky intertidal bench and creating transects every three meters, resulting in 11 transect line areas. At least 100 uniformly spaced sample points were then collected from each transect. Special attention was given to mobile invertebrates to ensure they were not over counted. The results of those surveys are listed in Appendix B. 5.2 Threatened, Endangered and Other Wildlife
5.2.1 Marine Reptiles
Marine sea turtles occur in California waters. Four species of federally protected sea turtles may be along the California coast: green (Chelonia mydas FE), leatherback (Dermochelys coriacea FE), loggerhead (Caretta caretta FE), and olive ridley sea turtles (Lepidochelys olivacea FE). These marine turtles are circum-global in distribution but breeding colonies have not been observed in California (Coastal Conservancy 2005).
5.2.2 Marine Birds

Initial Study – Monterey Bay Aquarium Ocean Plan Exception July 2011
Page 13 of 78
Birds comprise the most conspicuous group of animals occurring along the California coast; that many individuals are easily visible from land during all seasons and tidal conditions. Most marine bird populations are seasonal; heaviest use occurs during spring and fall migrations, and in winter. During the summer, most of the species are nesting elsewhere (State Water Board 1979). Birds are important predators of many of the fish and invertebrates inhabiting the coast. In the rocky intertidal zone, several species of shorebirds (especially black turnstones, surfbirds, rock sandpipers, black oystercatchers, willets, and whimbrels) prey on water lice, salt water fleas, and other small crustaceans. Bristle worms, a variety of small mollusks, and occasionally representatives of other invertebrate taxa are also preyed upon. Gulls feed on crab, seastars, Pisaster ochraceus, and sea urchins. On the sandy beach, sanderlings and marbled godwits probe for water lice, Excirolana, salt water fleas, Orchestoidea and Paraphoxus, the sandcrab, Emerita analoga, and adult and larval insects. Seabirds that capture food near the water surface (pelicans, phlaropes, terns, and gulls) or dive beneath the surface (loons, grebes, cormorants, sea ducks, and alcids) forage on zooplankton, squid and fish, as well as mollusks and crustaceans taken from the seafloor (State Water Board 1979). Of the 100+ other species occurring somewhat regularly along the California coast, the great majority nest outside of California, with many species migrating annually to the Arctic to breed. Small numbers of some of these species, often immature birds, remain here throughout the summer (State Water Board 1979). The California least tern (Sterna antillarum) and elegant tern (Thalasseus elegans) forage and nest along the California coast. Along the northern and central coast, several species nest close to the intertidal zone, and are present as year-round residents. The black oystercatcher nests on rocks just above the reach of the waves. A smaller shorebird, the snowy plover, is a nests on the upper areas of beaches. Among seabirds, pelagic cormorants nest in scattered colonies along sea cliffs. This species builds nests on rock shelves along the cliff faces above the surf. Brandt’s cormorant, a larger species which typically selects flat areas on islands for colony sites, is also present in large numbers along the northern and central coast. Gulls and black oystercatcher also nest along the coast (State Water Board1979).
5.2.3 Marine Mammals
All marine mammals are protected under federal law (Marine Mammal Protection Act). Members of this group are predominantly carnivorous and represent the upper end of the marine food chain in the coastal waters. The three orders of marine mammals found along the California coast are the seals and sea lions (Pinnipedia), the sea otters (Fissipedia) and the dolphins, porpoises, and whales (Cetacea); the seals and sea lions are the most easily observed and abundant (State Water Board 1979). The 1979 State

Initial Study – Monterey Bay Aquarium Ocean Plan Exception July 2011
Page 14 of 78
Water Board Reconnaisance report documents the following species specifically occurring within the ASBS: Enhydra lutris nereis (Southern Sea Otter), Zalophus californianus (California Sea Lion), Phoca vitulina richardsii (Pacific Harbor Seal), Phocoena phocoena (Harbor Porpoise), Grampus griseus (Risso’s Dolphin), and Eschrichtius robustus (Gray Whale). 5.3 Fisheries, Marine Protected Areas and Prohibitions on the Take of Marine Life As mentioned above the western portion of the ASBS includes part of the Pacific Grove Marine Gardens State Marine Conservation Area and the eastern portion of the ASBS is approximately co-located with the Lovers Point State Marine Reserve. In the Pacific Grove Marine Gardens State Marine Conservation Area only the recreational take of finfish is allowed, and the commercial take of giant kelp (Macrocystis pyrifera) and bull kelp (Nereocystis luetkeana) by hand is allowed under certain limiting conditions. Absolutely no take of marine life is allowed in the Lovers Point State Marine Reserve. 5.4 Watershed and Land Use Characterizations State Water Board staff analyzed watersheds adjacent to ASBS for impermeability (impervious surfaces) based on land use data (Calwater 2.2). Impervious surface greater than 50% was found in watersheds draining to the Pacific Grove ASBS. The exact percentage was 64.52%. Specific watershed land uses and conditions adjacent to ASBS are as follows:
Flows originating from this Monterey County watershed arise primarily from urban runoff. The Hopkins Maine Laboratory and the adjacent Monterey Bay Aquarium have several point sources of laboratory and aquarium waste seawater that discharge into the ASBS.
The only somewhat natural drainage into the Pacific Grove ASBS is from Greenwood Creek, which runs through Greenwood Park. Upstream from the park, the creek again becomes part of the storm drain system. All other freshwater discharges to the ASBS are from storm drains (State Water Board 1979). Within the jurisdiction of the City of Pacific Grove, this area of watershed adjacent to the ASBS comprise of a total of approximately 940 acres (3.80 km2), predominately residential. The downtown retail sector comprises 30 acres (121,405 m2). The Pacific Grove Golf Links contribution is approximately 43 acres (174,014 m2) in size. Parks, open space, and a recreational trail system border the entire length of the ASBS.
6. Scientific Study Uses

Initial Study – Monterey Bay Aquarium Ocean Plan Exception July 2011
Page 15 of 78
The Monterey Bay Aquarium Foundation is a 501(C)(3) non-profit organization governed by an appointed board of directors. Its mission is to inspire conservation of the oceans. The near shore habitats represented contain marine algae, fish and invertebrates that are dependent upon natural seawater for recruitment and a steady supply of nutrients that can only be found in natural seawater. The one-million-gallon Outer Bay exhibit is home to the largest community of open-ocean animals to be found in any aquarium. The Outer Bay also features the largest permanent collection of jellyfish species in the United States. Numerous live exhibits and MBA’s live animal research programs all depend upon the seawater system (MBA Exception App. 11-1). 6.1 Research 6.1.1 Stanford University Hopkins Marine Station Tuna Research and Conservation Center The aquarium works in partnership with Stanford University scientists to conduct research related to the conservation of pelagic fishes, especially Atlantic and Pacific blue fin tunas and white sharks. The major threats to these species are inadequate fisheries regulations and marine resource policies, and lack of basic ecological knowledge that can inform better resource management policies. Through collaboration with scientists at Stanford University's Hopkins Marine Station, the aquarium conducts research on the basic biology and ecology of tunas, sharks and other open-ocean fishes that contributes directly to improved resource management policies. (MBA Exception App. 11-1) 6.1.2 Sea Otter Research and Conservation The aquarium plays a central role in efforts to prevent the southern sea otter from going extinct. The population growth of the southern sea otter is sluggish and uncertain for reasons that are not understood. Several potential causes have been identified including water-born pathogens, suppressed immune systems, contaminants, inadequate food supply, and attacks by sharks and humans. The aquarium's sea otter rehabilitation program provides critically needed information on the overall health and condition of sea otters. The aquarium's veterinary and animal care staff, in collaboration with veterinarians and scientists from academic, state and federal agencies, also develop improved medical treatment techniques and protocols. The information obtained by the aquarium and its collaborators will directly inform improved marine conservation policies needed to protect the southern sea otter and the near-shore marine ecosystem that it depends on. (MBA Exception App. 11-2) 6.2 Education The MBA exhibits attract nearly two million visitors a year from around the world and display marine life in naturalistic settings. Living exhibits also help educate visitors about marine conservation issues and the importance of protecting the ocean for current and future generations. Each year 80,000 students visit the aquarium with their classes, free of charge, to learn about the ocean and the animals that live there. Fifteen
Initial Study – Monterey Bay Aquarium Ocean Plan Exception July 2011
Page 16 of 78
thousand of those students also participate in classroom programs that provide them close-up encounters with marine animals. Field trip experiences like these provide a context for much of the science content they need to learn. Each year, over 500 teachers participate in professional development programs here. The training that they receive through the programs helps them to provide quality science instruction for all their students. Two hundred and fifty middle and high school students participate in ongoing teen programs that provide them with in-depth exposure to Monterey Bay animals and habitats (MBA Exception App. 11-1). 6.3 Conservation Action The aquarium has long been actively involved in marine protection, reflecting its mission to inspire conservation of the oceans. In 2004, the aquarium created the Center for the Future of the Oceans (CFFO) to consolidate and expand its involvement in ocean conservation. The Center's mission is to inspire action for conservation of the oceans. Current goals for the Center are to support implementation of the California Marine Life Protection Act (MLPA) and other efforts to create a new network of marine protected areas, including fully protected marine reserves, in California and offshore waters; work with partner organizations and the state of California to promote enactment of ocean policy reform at the national level; raise conservation awareness among seafood consumers through the Seafood Watch program and shift the purchasing policies of large volume seafood buyers to transform the seafood market so that commercial incentives favor sustainable fisheries and fish farming; advocate for policies to conserve and restore key threatened marine wildlife and ecosystems of the California coast and the Pacific Ocean, especially the southern sea otter and pelagic species such as sharks, tunas, and sea turtles. In pursuing these goals, the CFFO will work to achieve lasting marine conservation outcomes by empowering individuals and influencing policy, focusing on initiatives where the aquarium can make a unique and valued contribution (MBA Exception App. 11-2). 6.4 Outreach In partnership with Monterey County Free Libraries, the aquarium provides "Passcards" to all libraries in Monterey County and Watsonville so that library patrons in these mostly rural, low-income communities can bring their families and visit the aquarium for free. About 9,000 Passcards are checked-out annually and the program was expanded in 2007 to include libraries in Santa Cruz County. The aquarium provides free admission to over 6,000 low-income clients of non-profit human services agencies from throughout California through its Free to Learn program. In partnership with Pajaro Valley High School, Watsonville Wetlands Watch, city of Watsonville public works, Elkhorn Slough, city of Watsonville Neighbor Services and Pajaro Valley Unified School District the aquarium developed the Mar y Campo program. Through this partnership, the aquarium continues to develop programs to build a community that embraces and demonstrates support for ocean, coastal, and watershed conservation through integrated programs that reach a broad sector of the Watsonville/Pajaro community (MBA Exception App. 11-3).

Initial Study – Monterey Bay Aquarium Ocean Plan Exception July 2011
Page 17 of 78
7. Infrastructure 7.1 Seawater System 7.1.1 The Daily Intake and Discharge Volume of Seawater of the System Natural seawater at ambient temperature is pumped continuously into the aquarium facility at approximately 1,400 gallons per minute (GPM). The seawater system runs continuously, 24 hours per day, 365 days a year. Monterey Bay Aquarium (MBA) supplies filtered seawater to Hopkins Marine Station (Stanford University) at a rate of up to 160 GPM (typically 120 GPM). Seawater supplied to Hopkins does not return to MBA; it is discharged at the Hopkins facility. MBA Seawater is also trucked offsite to the Animal Research and Care Center (ARCC) in Marina and returned to the Aquarium for treatment and discharge. The volume of seawater transferred to and from the ARCC averages about 3,500 gallons per day (GPD). The typical daily discharge volume of seawater from the MBA seawater system is 2,003,640 GPD and includes four ocean outfalls. Two ocean outfalls listed in the 2006 MBA Exception Application (#s 28 & 40) that were seawater discharges comingled in storm drains were eliminated in October 2007 (MBA Exception App. 2-1). 7.1.2 Exotic Species, Parasites, and Pathogens The MBA seawater system is an "open" system. Seawater is pumped from the bay continuously, and discharged back to the bay continuously. At night when the aquarium is closed, unfiltered seawater is often pumped to certain exhibits in the Near Shore Wing. Based on the General NPDES Permit for Discharges from Aquaculture and Aquariums (NPDES Permit No. CAG993003, Order No. R3-2002-0076) and direction from State Water Resources Control Board and Regional Water Quality Control Board staff, MBA has been working with California Department of Fish and Game (CDF&G) staff concerning potential release of parasites, pathogens, and non-regional species (MBA Exception App. 6-1). MBA was originally designed as an open seawater system and the exhibit galleries were designed for the display and holding of regional species from Central California. Over the years MBA has expanded their exhibit space to include temporary or rotating exhibit galleries and one permanent tropical gallery. The live exhibits in the rotating galleries frequently display non-regional or exotic species. MBA restricts displays of exotic organisms to the exotic galleries and has designated specific areas for holding and culture of exotic species (MBA Exception App. 6-4). As of December 2010 MBA has five exotic species treatment systems (ESTS) all of which are based on fine particle filtration followed by ultraviolet light sterilization.
The five exotic species treatment systems are as follows:

Initial Study – Monterey Bay Aquarium Ocean Plan Exception July 2011
Page 18 of 78
1. Near Shore Wing. 11 micron drum filter screens followed by ultraviolet sterilization.
2. MBA Quarantine. 50 & 5 micron bag filters in series followed by ultraviolet sterilization.
3. Marina Animal Research and Care Center. 50 & 5 micron bag filters in series followed by ultraviolet sterilization.
4. Outer Bay Wing “Cold” System (Rotating Exhibits System 1). 50 & 5 micron bag filters in series followed by ultraviolet sterilization.
5. Outer Bay Wing. 11 micron drum filter screens followed by ultraviolet sterilization. To be commissioned in April 2011.
Examples of each type of exotic species treatment system are described in more detail below. 7.1.3 Near Shore Wing Drum Screen Filtration and Ultraviolet Light Treatment System: The Near Shore Wing (NSW) contains the Splash Zone Exhibit and several holding areas that are designated as locations where exotic species can be held or displayed. All overflow return lines from these tanks or areas are routed to an "exotics" reservoir. Overflow seawater collected in this reservoir is treated then discharged back to the bay. This exotics system is designed to accommodate variable seawater flows up to ~600 GPM; average flow since start-up has been ~140 GPM. Seawater to be treated is pumped from the exotics reservoir through 11 micron drum filters located inside a collection reservoir (Figure 7-1). The filtered seawater is then pumped through ultraviolet light sterilizers and discharged to our main seawater system outfall pipe (NSW Tidal Basin Discharge, SEA-1) downstream from the Overflow Storage Tank. The ultraviolet sterilizers are designed to provide a minimum of 182,000 µWs/cm2 at maximum flow (300 GPM). The filtered, ultraviolet treated discharge mixes with approximately 850 GPM of untreated seawater being discharged from our flow-through systems. The NSW ESTS incorporates redundant equipment to eliminate downtime due to equipment failure or maintenance (two sets of two pumps, two drum filters and two ultraviolet sterilizers). The system is fully integrated into our Control Room computer system (PLC) - including reservoir levels, pump and ultraviolet sterilizer control, automatic switch over of redundant equipment in the event of a failure, and alarming (Figure 7-1).

Initial Study – Monterey Bay Aquarium Ocean Plan Exception July 2011
Page 19 of 78
Figure 7-1. Near Shore Wing Exotic Species Treatment System
A new Exotic Species Treatment System is under construction in the Outer Bay Wing that is essentially identical to the NSW system just described. This system will be placed in operation in April 2011 (see Sections 7.1.12 and Figure 7-6). 7.1.4 Outer Bay Wing Bag Filtration and Ultraviolet Light Treatment System: The first floor of the Outer Bay Wing (OBW) includes two temporary exhibit galleries and there are two re-circulating life support systems (LSS) to support these galleries. MBA personnel refer to these LSS’s as the Warm and Cold systems. Currently the Warm system contains freshwater in support of freshwater displays and all discharge is directed to domestic sewer. The Cold system contains seawater and receives a small flow of filtered seawater make-up. Seawater is discharged from the Cold system either via overflow from the system reservoir or as filter backflush. The treatment approach for the OBW Cold system was to intercept the return piping coming back from the exhibits to the LSS reservoir and re-route this piping to a treatment reservoir (Figure 7-2). Seawater in the treatment reservoir is pumped through a series of two bag filters (50 micron followed by 5 micron), passes through an ultraviolet sterilizer, and then flows back to the system reservoir (Figure 7-2). The UV units are sized for a minimum exposure of 100,000 µWs/cm2. The filter units are Hayward Polyline double-length plastic filter housings and Hayward Sentinel polypropylene (7" x 32") ring filter bags. Since seawater from exhibits containing exotics is treated before it flows into the system reservoir, this avoids contaminating the system

Initial Study – Monterey Bay Aquarium Ocean Plan Exception July 2011
Page 20 of 78
reservoir, the sand filters, the head tank and supply piping, and, therefore, also avoids cross-contamination of other exhibits on the system. Since seawater in the system reservoir has been treated, this also avoids the task of having to treat sand filter backflush. MBA uses exotic species treatment systems of this basic design (5 micron filtration followed by UV sterilization) to locally treat discharge from Quarantine holding tanks and the Marina Animal Research and Care Facility.
Figure 7-2. Outer Bay Wing "Cold System" Exotic Species Treatment System
7.1.5 Maintenance and Monitoring of Exotic Treatment Systems: All exotic species treatment systems are incorporated into the Control Room computer system (PLC) and can be accessed by several computers located throughout the facility as well as remotely by Systems Operators. Each system is maintained regularly and incorporates various alarms which appear on all Control Room computers and also on Systems Operator's pagers. Systems Operators know within several minutes if any of these treatment systems is not functioning within prescribed limits. All critical exotic species treatment systems are designed with redundant equipment so the system can maintain operation in the event of an equipment failure. The ultraviolet lamps in all systems are replaced annually as part of the preventative maintenance program. Treatment system reservoirs will overflow to the city sewer system in the event of a major system failure (e.g., failure of emergency power).
MBA uses heterotrophic plate counts (HPC) of bacteria cultured on Marine Agar (Difco) to examine treatment system efficiency. Monitoring is performed on a quarterly basis. Typically the systems are 99.5+% efficient at reducing viable bacteria able to grow on Marine Agar (MBA Exception App. 6-5 – 6-9).

Initial Study – Monterey Bay Aquarium Ocean Plan Exception July 2011
Page 21 of 78
7.1.6 Chemicals Added to the Facility Seawater System and Marine Life Food Certain chemicals used to prevent disease or to treat animals for external parasites are applied directly to the water; always in a holding or isolation tank situation. All of these chemical treatments are performed as "static" treatments, meaning that there is no flowing water for the duration of the treatment; the tank is isolated. Seawater or freshwater laden with these treatment chemicals is discharged to domestic sewer under agreement with the Monterey Regional Water Pollution Control Agency (MRWPCA). MBA does not use a constant dose of chemicals, at any concentration, in any of the flow-through seawater exhibits or systems. The repeated static treatments of longest duration last no more than 14 days and include antibiotics for bacteria. The 2010 annual total amount used and treatment dose is listed for each chemical in Table 7-1. This table and those listed in the MBA Exception Application (Table 7.1 & 7.2) are the annual reports of treatment for chemicals discharged to sewer as required by MRWPCA under the MBA Industrial Wastewater Discharge Permit. Table 7-1. Chemicals Used for Treatment of Aquatic Animals (2010)
Common or Trade Name(s)
Active Ingredient(s) CAS #Amount
UsedDose (ppm)
Yearly Total - Treated Water Discharged to
Sewer (gallons)
Chloroquine Chloroquine bis(phosphate) 200-055-2 12.47g 10 329
Formalin 37% Solution of Formaldehyde 50-00-0 1582.4mL 0.25 1,671
Furacin/ Nitrofurazone
2-[(5-Nitro-2-furanyl) methylene-hydrazinecarboxamide]
59-87-0 2961.2g 20 39,113
M S-222/ Finquel
Tricaine Methanesulfonate 886-86-2 1658.5g 75 22,113
Praziquantel Praziquantel 55268-74-1 20.3g 20 268
33.3% Trimethoprim 738-70-5
6.7% Sulfadiazine 68-35-91056.5g 20 13,952Tucoprim
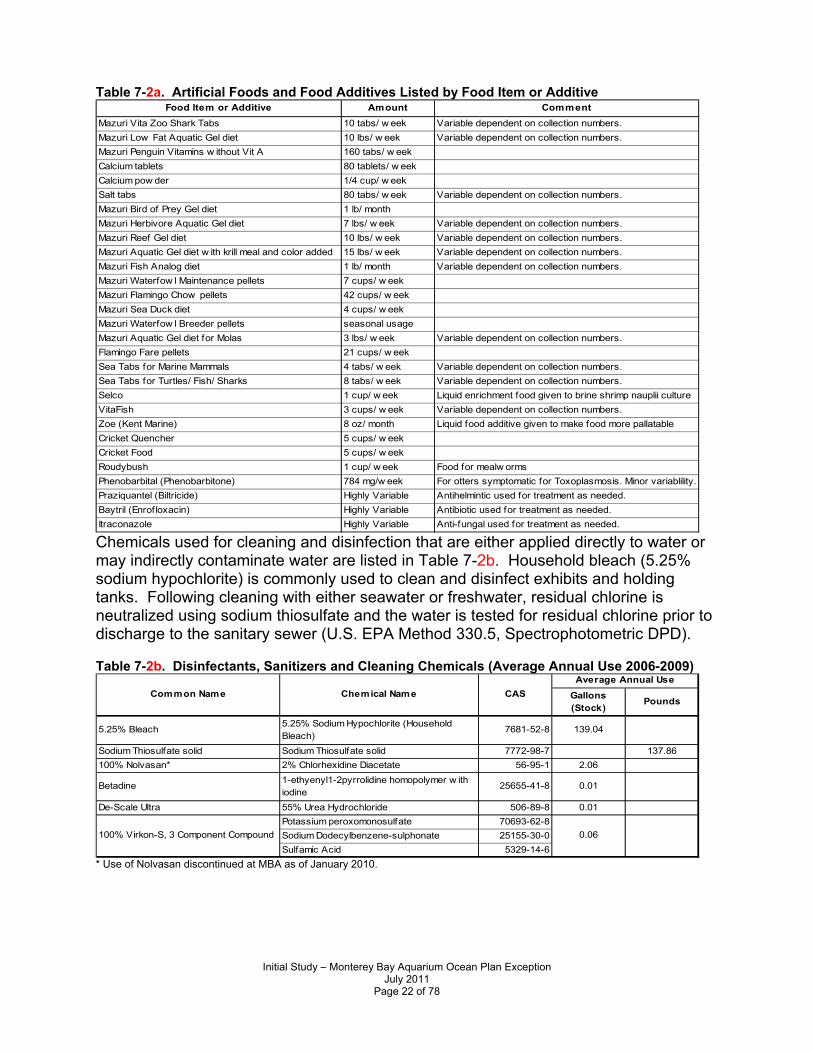
A variety of artificial foods are used to feed animals in the collection. Nutrient solutions and vitamins are used to enhance the nutritional value of foods prepared for some specimens. Certain drugs are also added to food to treat specific conditions in a limited number of species. Food additives from all of these categories are listed in Table 7-2a.
Initial Study – Monterey Bay Aquarium Ocean Plan Exception July 2011
Page 22 of 78
Table 7-2a. Artificial Foods and Food Additives Listed by Food Item or Additive Food Item or Additive Amount Comment
Mazuri Vita Zoo Shark Tabs 10 tabs/ w eek Variable dependent on collection numbers.
Mazuri Low Fat Aquatic Gel diet 10 lbs/ w eek Variable dependent on collection numbers.
Mazuri Penguin Vitamins w ithout Vit A 160 tabs/ w eek
Calcium tablets 80 tablets/ w eek
Calcium pow der 1/4 cup/ w eek
Salt tabs 80 tabs/ w eek Variable dependent on collection numbers.
Mazuri Bird of Prey Gel diet 1 lb/ month
Mazuri Herbivore Aquatic Gel diet 7 lbs/ w eek Variable dependent on collection numbers.
Mazuri Reef Gel diet 10 lbs/ w eek Variable dependent on collection numbers.
Mazuri Aquatic Gel diet w ith krill meal and color added 15 lbs/ w eek Variable dependent on collection numbers.
Mazuri Fish Analog diet 1 lb/ month Variable dependent on collection numbers.
Mazuri Waterfow l Maintenance pellets 7 cups/ w eek
Mazuri Flamingo Chow pellets 42 cups/ w eek
Mazuri Sea Duck diet 4 cups/ w eek
Mazuri Waterfow l Breeder pellets seasonal usage
Mazuri Aquatic Gel diet for Molas 3 lbs/ w eek Variable dependent on collection numbers.
Flamingo Fare pellets 21 cups/ w eek
Sea Tabs for Marine Mammals 4 tabs/ w eek Variable dependent on collection numbers.
Sea Tabs for Turtles/ Fish/ Sharks 8 tabs/ w eek Variable dependent on collection numbers.
Selco 1 cup/ w eek Liquid enrichment food given to brine shrimp nauplii culture
VitaFish 3 cups/ w eek Variable dependent on collection numbers.
Zoe (Kent Marine) 8 oz/ month Liquid food additive given to make food more pallatable
Cricket Quencher 5 cups/ w eek
Cricket Food 5 cups/ w eek
Roudybush 1 cup/ w eek Food for mealw orms
Phenobarbital (Phenobarbitone) 784 mg/w eek For otters symptomatic for Toxoplasmosis. Minor variablility.
Praziquantel (Biltricide) Highly Variable Antihelmintic used for treatment as needed.
Baytril (Enrofloxacin) Highly Variable Antibiotic used for treatment as needed.
Itraconazole Highly Variable Anti-fungal used for treatment as needed. Chemicals used for cleaning and disinfection that are either applied directly to water or may indirectly contaminate water are listed in Table 7-2b. Household bleach (5.25% sodium hypochlorite) is commonly used to clean and disinfect exhibits and holding tanks. Following cleaning with either seawater or freshwater, residual chlorine is neutralized using sodium thiosulfate and the water is tested for residual chlorine prior to discharge to the sanitary sewer (U.S. EPA Method 330.5, Spectrophotometric DPD). Table 7-2b. Disinfectants, Sanitizers and Cleaning Chemicals (Average Annual Use 2006-2009)
Gallons (Stock)
Pounds
5.25% Bleach5.25% Sodium Hypochlorite (Household Bleach)
7681-52-8 139.04
Sodium Thiosulfate solid Sodium Thiosulfate solid 7772-98-7 137.86
100% Nolvasan* 2% Chlorhexidine Diacetate 56-95-1 2.06
Betadine1-ethyenyl1-2pyrrolidine homopolymer w ith iodine
25655-41-8 0.01
De-Scale Ultra 55% Urea Hydrochloride 506-89-8 0.01
Potassium peroxomonosulfate 70693-62-8
Sodium Dodecylbenzene-sulphonate 25155-30-0
Sulfamic Acid 5329-14-6
Common Name Chemical Name CAS
Average Annual Use
100% Virkon-S, 3 Component Compound 0.06
* Use of Nolvasan discontinued at MBA as of January 2010.

Initial Study – Monterey Bay Aquarium Ocean Plan Exception July 2011
Page 23 of 78
7.1.7 Discharge to Bay MBA is working very hard to eliminate ocean discharge of seawater that has been chlorinated (household bleach) and neutralized using sodium thioslfate by supplying adequate freshwater and sewer discharge connections to problem locations. MBA has eliminated this practice in the OBW Jellies galleries by providing adequate freshwater supplies so the discharge can be directed to sewer. MBA also eliminated this practice from SORAC holding tanks and facilities on the 3rd floor of NSW. Only two holding tanks remain where discharge to sanitary sewer is not available and disinfected seawater is discharged to an ocean outfall; the SORAC Hopkins Tanks. If seawater is used for disinfection in the SORAC Hopkins Tanks it is discharged to an ocean outfall (SEA-2) following neutralization and testing for residual chlorine. Virkon is a 3-component commercial sanitizing solution that is used to disinfect shoes (when entering and leaving animal isolation areas) and animal handling equipment (e.g., hand nets; see Table 7-3). When used for disinfecting equipment the sanitizing solution is discharged to domestic sewer either in floor or sink drains indoors, or the equipment is washed at one of several wash stations in the Corporation Yard that are equipped with sewer drains. Dilute solutions of sanitizer are also used to disinfect surfaces in bird and sea otter exhibits and holding areas. Surfaces disinfected with Virkon sanitizer are sloped to sanitary sewer drains, minimizing the chance of discharge into the exhibit water or seawater system. 7.1.8 Desalination System MBA has an on-site reverse osmosis (RO) desalination system that produces 20 GPM of freshwater from seawater. Desal brine water is discharged to the outflow of the MBA seawater system Overflow Storage Tank at a rate of 44 GPM where it mixes with at least 800 GPM of seawater and flows to the NSW Tidal Basin Discharge (SEA-1). The MBA desalination system is controlled by the water level in the product water reservoir and runs intermittently based on visitor attendance and water demand (most of this water is used to flush toilets). A solution of sodium metabisulfite is used to preserve the desalination system RO membranes when they are not in use. The sodium metabisulfite strips oxygen from the water minimizing biological activity in the RO membranes when they are sitting idle. Near the end of operation, when the product water reservoir has reached the full mark and just before the desalination system shuts down, sodium metabisulfite is added to the source seawater, and therefore the RO membranes. During the final minutes prior to system shutdown, a small amount of sodium metabisulfite may be discharged from the RO membranes with the brine water (see Figure 7-5). For the first five minutes following desalination system startup, RO membrane brine water (and sodium metabitsulfite) is discharged to the city sewer system. This is accomplished automatically using the Control Room computer system and motor-actuated valves. Five minutes after desalination system startup the valves switch and brine water is routed back to the outflow of the seawater system Overflow Storage Tank

Initial Study – Monterey Bay Aquarium Ocean Plan Exception July 2011
Page 24 of 78
(MBA Exception App. 7-2). Historical water quality data for desalination system brine water show that salinity ranges from 54-55 ppt; conductivity ranges from 60,000 to 75,000 μS/cm. 7.1.9 General Description of Seawater System, Intake, and Discharge Locations Natural seawater at ambient temperature is pumped continuously into the aquarium facility at a rate of approximately 1,400 GPM. The seawater intake is located at a depth of 50-55 feet approximately 1,000 feet offshore of the Near Shore Wing. Sand-filtered or unfiltered (raw) ambient seawater can be supplied to almost every exhibit or holding tank in the Near Shore Wing (NSW). Fresh filtered seawater is also supplied to all of the main life support systems and many exhibits and holding tanks in the Outer Bay Wing (OBW). Basic flow diagrams for MBA's seawater or life support systems are shown in Figure 7-5 (Near Shore Wing) and Figure 7-6 (Outer Bay Wing). The aquarium has a single intake for seawater, but there are many sub-flows within the facility and four seawater outfalls that discharge into Monterey Bay. Due to the complexity of the aquarium's seawater system all system sub-flows are not shown in Figures 7-5 and 7-6. The locations of MBA's seawater system outfalls are shown in Figures 7-3 and 7-4. The Aquarium's seawater systems remain in continuous operation 24 hours per day, 365 days a year (MBA Exception App. 8-1).
Figure 7-3. Monterey Bay Aquarium Seawater System Ocean Discharge Locations

Initial Study – Monterey Bay Aquarium Ocean Plan Exception July 2011
Page 25 of 78
Figure 7-4. MBA Seawater System Ocean Discharge Locations.
7.1.10 Near Shore Wing: The main seawater "intake" for the aquarium is in the Near Shore Wing. Seawater drawn into the Pump House sump is pumped through two sand filters located in the NSW basement (Sand Filters 1 & 2, Figure 7-5). Seawater leaving these filters flows to the Kelp Forest Exhibit plenum from which it either flows into the Kelp Forest Exhibit or is pumped into our Secondary Seawater System. The Secondary Seawater System supplies filtered seawater to all exhibit galleries and holding facilities in the NSW and all seawater systems in the Outer Bay Wing (Figures 7-5 & 7-6). Raw or unfiltered seawater is also pumped from the intake sump and distributed via separate piping to exhibit galleries and holding facilities in the Near Shore Wing and to the Outer Bay Wing (Figure 7-5). A portion of the seawater flowing through the Kelp Forest Exhibit overflows into the Monterey Bay Exhibit (MBT). Seawater from the MBT is also re-circulated through sand filters in the NSW basement (Sand Filters 3-6, Figure 7-5). Sand Filters 4, 5 and 6 re-circulate seawater from the Overflow Storage Tank (OFST) back to the MBT. Sand Filter 3 typically re-circulates seawater from the OFST back to the Kelp Forest Exhibit. Most of the exhibits in the NSW contain regional species. Filtered seawater flows through these exhibits and then flows by gravity back to the OFST (or Return Box) in the NSW basement. Seawater in the OFST is either re-circulated back through the system, or it flows out to the bay through the NSW Tidal Basin Discharge (SEA- 1; Figures 7-3, 7-4 & 7-5). Four Recycle Sand Filters located in the NSW basement draw

Initial Study – Monterey Bay Aquarium Ocean Plan Exception July 2011
Page 26 of 78
seawater from the OFST and route it back into the Kelp Forest Exhibit plenum and Secondary Seawater System (Figure 7-5).
Figure 7-5. Near Shore Wing Seawater System

Initial Study – Monterey Bay Aquarium Ocean Plan Exception July 2011
Page 27 of 78
Figure 7-6. Outer Bay Wing Seawater System

Initial Study – Monterey Bay Aquarium Ocean Plan Exception July 2011
Page 28 of 78
Filter backflush from all sand filters in the NSW basement flows to a single point of discharge located just outside of the Tidal Basin, the NSW Filter Backflush Discharge (SEA- 2; Figures 7-3, 7-4 & 7-5). Seawater overflow from the Sea Otter Exhibit is discharged through a separate intertidal outfall adjacent to the exhibit, the Sea Otter Exhibit Overflow Discharge (SEA-3; Figures 7-3, 7-4 & 7-5). This seawater discharge is commingled in a local storm drain that collects storm runoff from a small section of roof and ocean-side deck adjacent the Tidal Basin (see MBA Exception App. Section 9, Figure 9.1 # 16). Seawater in the Sea Otter Exhibit is re-circulated through sand filters and a large ultraviolet sterilizer. Filter Backflush from the Sea Otter Exhibit sand filters is directed through an ultraviolet sterilizer and discharged to the NSW Filter Backflush Discharge (SEA-2; Figures 7-3, 7-4 & 7-5). All other exhibits of regional (native) species in the Near Shore Wing are flow-through exhibits. Seawater leaving these exhibits flows back to the Overflow Storage Tank (OFST) from which it is either recycled back to the Kelp Forest Exhibit plenum and Secondary Seawater System or is discharged to the NSW Tidal Basin Discharge (SEA-1; Figure 7-5). The MBA Desalination System is supplied natural seawater from piping on the Primary Seawater System (Figure 7-5). Desalination System brine is discharged to the outflow of the OFST where it mixes with at least 800 GPM of seawater being discharged to the NSW Tidal Basin Discharge (SEA-1; Figures 7-3, 7-4 & 7-5). The exhibit gallery on the second floor of the NSW (Splash Zone) contains a mixture of regional and non-native (exotic) species. All seawater returning from displays in this gallery and associated holding areas is routed to an Exotic Species Treatment System (ESTS) before it is discharged to the bay. Seawater returning to the ESTS collects in an isolated reservoir in the NSW basement. Seawater is pumped from this reservoir through drum filters, collected in another reservoir, pumped through ultraviolet sterilizers, and then mixed with the OFST discharge flowing to the NSW Tidal Basin (SEA-1, Figure 7-5). Maximum instantaneous discharge flow from this system is 600 GPM and it mixes with approximately 760 GPM of untreated seawater in the NSW Tidal Basin Discharge pipe (Table 7-3). A detailed description of this exotic species treatment system can be found in Section 7.1.3. Three Sea Otter Research and Conservation (SORAC) holding/isolation tanks located on the third floor (roof) of the NSW discharge seawater through a dedicated ultraviolet sterilizer to the NSW Tidal Basin Discharge (SEA-1; Figure 7-5). Historically these SORAC tanks discharged to two outfalls (#28 and #40) that comingled with storm drains. MBA has removed both of these discharges from storm drains and rerouted them through ultraviolet sterilization to the OFST. This project was completed in October 2007 (see MBA Exception App. 8-1 – 8-6 and Section13). 7.1.11 Hopkins Marine Station: MBA provides Hopkins Marine Station with a constant supply of filtered seawater for their teaching aquariums and research laboratories (Figure 7-5). The seawater flow supplied to Hopkins is dependent upon their demand and varies from about 70 GPM to 160 GPM. Seawater sent to Hopkins is discharged at Hopkins and is, therefore, described in the Hopkins Marine Station ocean discharge exception application. The

Initial Study – Monterey Bay Aquarium Ocean Plan Exception July 2011
Page 29 of 78
Tuna Research and Conservation Center (TRCC) located at Hopkins Marine Station is used jointly by MBA and Hopkins researchers. The TRCC seawater system is separate from the Hopkins Marine Station System described above. Three large holding tanks at the TRCC have separate recirculated seawater systems. Seawater supplied to each of these systems is discharged to the MBA exotic species treatment system (ESTS) in the NSW basement and is ultimately discharged to the NSW Tidal Basin Discharge (SEA-1) following treatment. Filter backflush from the sand filters associated with each of these systems used to be directed to a storm drain discharge located on the beach adjacent the TRCC. In July 2007 filter backflush from the TRCC sand filters was rerouted back to MBA where it is treated via MBA's NSW ESTS prior to discharge to the NSW Tidal Basin Discharge (SEA-1; MBA Exception App. 8-7 and Section 13). 7.1.12 Outer Bay Wing: There are five primarily recirculated seawater systems in the Outer Bay Wing (Figure 7-6):
1. Outer Bay Exhibit System (exhibit on 1st & 2nd floor of OBW) 2. Schooling Fishes System (exhibits on 2nd floor of OBW) 3. Rotating Exhibits System 1 (exhibits on 1st floor of OBW) 4. Rotating Exhibits System 2 (exhibits on 1st floor of OBW) 5. Jellies Exhibits System (exhibits on 2nd floor of OBW)
Seawater supplied to these systems from the Near Shore Wing is discharged through an intertidal outfall under the Outer Bay Wing (OBW Intertidal Discharge, SEA-4; Figures 7-3, 7-4 & 7-6). Ocean discharge from these five systems includes seawater overflow from each system reservoir and backflush from sand filters incorporated into each system (Figure 7-6) The rotating exhibit galleries on the first floor of OBW frequently contain a mixture of regional and non-native (exotic) species. All seawater overflow from exhibits or holding tanks containing non-native species is routed to an exotic species treatment system and then to the respective system reservoir (Figure 7-6). Exotic species treatment systems on the OBW rotating exhibit systems currently incorporate fine (5 micron) filtration followed by ultraviolet sterilization. The concept behind these treatment systems is to sterilize seawater returning from exhibits containing non-native species before it reaches the system reservoir. This prevents non-native species from colonizing the system reservoir and life support system components, including the sand filters. Therefore, seawater discharged from the system reservoirs and sand filters does not contain exotic species. A detailed description of exotic species treatment systems can be found in Sections 7.1.3 & 7.1.4. A new exotic species treatment system is currently under construction in the Outer Bay Wing basement which is scheduled for completion in April 2011. When complete, this ESTS will treat all seawater and filter backflush discharged from four of the five seawater systems in OBW; all systems except the Schooling Fishes System. All seawater overflow and filter backflush from the Outer Bay Exhibit System, Rotating Exhibits Systems 1 & 2, and the Jellies Exhibits System will be routed through exotics

Initial Study – Monterey Bay Aquarium Ocean Plan Exception July 2011
Page 30 of 78
treatment prior to discharge at the OBW Intertidal Discharge (SEA-4; Figure 7-6). The treatment system will be essentially identical the Near Shore Wing Drum Screen Filtration and Ultraviolet Light Treatment System described above in Section 7.1.3. In addition to treatment for exotic species, the new system will have the ability to pass a portion of the treated seawater through two chilled heat exchangers to regulate discharge temperature if required. The new OBW ESTS is shown in the Outer Bay Wing flow diagram (Figure 7-6). SEAWATER DISCHARGE LOCATIONS 7.1.13 Near Shore Wing (NSW) Tidal Basin Discharge (SEA-1): The main outfall from the NSW primary seawater system discharges into the Tidal Basin on the ocean side of the aquarium (SEA-1, Figures 7-3 & 7-4). This discharge pipe extends just beyond the seawall at the base of the deck. The end of this pipe is constantly submerged due to the water level in the Tidal Basin. Seawater discharge flows into the Tidal Basin and then over the rock perimeter of the Tidal Basin into the ocean. All seawater discharged from the Overflow Storage Tank (OFST) in the NSW basement flows to the NSW Tidal Basin Outfall (SEA-1). Typical outflow from the OFST is 500 GPM with an average daily flow of 720,000 GPD (Table 7-3). Brine water from the MBA desalination plant is discharged to the outflow of the OFST where it mixes with the primary seawater outflow and is discharged to the NSW Tidal Basin (SEA-1). The desalination plant runs intermittently based on demand for product water. When in full operation, the plant produces 44 GPM of brine water. The average daily discharge of desalination brine is approximately 15,840 GPD (Table 7-3). Table 7-3. NSW Tidal Basin Discharge (SEA-1)
Source Max. Inst. Flow
(GPM) Avg. Daily Flow
(GPD) Duration Treatment
Discharge Location
Overflow Storage Tank
500 720,000 Continuous, year-round
None SEA-1
Desalination 44 15,840 Intermittent, year-round
None SEA-1
HVAC 350 357,000 Intermittent, year-round
None SEA-1
Exotic species treatment
300 201,600 Continuous, year-round
11 micron filtration & UV sterilization
SEA-1
Total 1,294,440 Heat exchangers on the MBA heating, ventilation, air conditioning (HVAC) system are designed to utilize seawater as non-contact cooling water. Seawater is supplied to these heat exchangers at a maximum total flow rate of 350 GPM for a maximum duration of approximately 17 hours per day. Average daily discharge of HVAC cooling seawater is 357,000 GPD (Table 7-3). This effluent is mixed with the primary seawater outflow and is discharged to the NSW Tidal Basin Discharge (SEA-1). Seawater routed through the NSW Exotic Species Treatment System is also discharged through the NSW Tidal Basin Discharge (SEA-1). Approximately 140 GPM of treated seawater from the ESTS mixes with outflow from the Overflow Storage Tank in the outfall pipe about 150 feet upstream from the point of discharge. The NSW ESTS discharges seawater rate of 201,600 GPD (Table 7-3). Average daily flow through the NSW Tidal Basin

Initial Study – Monterey Bay Aquarium Ocean Plan Exception July 2011
Page 31 of 78
Discharge is approximately 1,294,440 GPD (Table 7-3) with an average flow rate of about 900 GPM. 7.1.14 Near Shore Wing Filter Backflush Discharge (SEA-2): Filter backflush seawater from all primary and Recycle system sand filters in the NSW flows to the NSW Filter Backflush Discharge located just outside of the Tidal Basin (SEA-2, Figures 7-3 & 7-4). NSW filter backflush piping is concealed by artificial rockwork and discharges into a surge channel located between the Tidal Basin and our Pump House Sump. Incoming seawater drawn from Monterey Bay is pumped through two pressure sand filters (Filters 1 & 2) rated at 900 GPM each before it is distributed to the various exhibits and galleries. Water quality in Monterey Bay varies considerably due to upwelling, seasonal storms and other factors. Consequently these two filters can "load-up" faster than any other MBA filters and frequently need backflushing more than once each day. Maximum instantaneous flow during backflush is 1,350 GPM and a standard backflush cycle is of 5-minute duration. Average daily backflush flow from these two filters is approximately 81,000 GPD, based on 6 filter backflushes per day for each filter. Occasionally, these filters will backwash 15 times in a day. Four identical 900 GPM filters (Filters 3-6) process seawater recirculated through the two major exhibits in the NSW, the Kelp Forest Exhibit and Monterey Bay Exhibit (Figure 7-5). Maximum instantaneous backflush flow from each of these filters is also 1,350 GPM. These filters are generally backflushed once a day for 5 minutes, but occasionally backflushing occurs as frequently as every 18 hours. Average daily backflush flow from these 4 filters is approximately 27,000 GPD. There are four 250 GPM sand filters on the NSW Recycle Seawater System (Figure 7-5). Each filter is typically backflushed once a day for 5 minutes at a maximum flow of 375 GPM. Occasionally backflushing occurs as frequently as every 18 hours. Average daily backflush flow from these 4 filters is approximately 7,500 GPD. The Sea Otter Exhibit system has two 250 GPM filters, each of which is backflushed once a day for 5 minutes. Maximum instantaneous backflush flow is 375 GPM and maximum daily backflush flow from these two filters is approximately 3,750 GPD. Sea Otter Exhibit backflush seawater is routed through an ultraviolet sterilizer located in the NSW basement and then flows to the NSW Filter Backflush Discharge (SEA-2, Figure 7-5). The pumps and flow valves for all of the main NSW sand filters (Sand Filters 1-6 & Recycle Filters 1-4) and the Sea Otter Exhibit filters are interfaced to the MBA Control Room computer system. Filter backflushing is typically initiated automatically based upon pressure differential across the filter, filter flow rate, or time elapsed since the last backflush. The Control Room computer system will only allow one filter to cycle into backflush mode at any given time. Thus the maximum discharge flow at the NSW Filter Backflush Discharge (SEA-2) is determined by the backflush flow rate of the largest filter discharging to this location; Filters 1-6 which backflush at 1,350 GPM. On an average day all of these filters combined discharge a total volume of approximately 161,300 gallons to the NSW Filter Backflush Discharge (SEA-2, Table 7-4)

Initial Study – Monterey Bay Aquarium Ocean Plan Exception Page 32 of 78
Table 7-4. NSW Filter Backflush Discharge (SEA-2)
Source Max. Inst. Flow
(GPM) Avg. Daily Flow
(GPD) Duration Treatment
Discharge Location
NSW Filter Backflush
1,350 161,300 Continuous, year-round
None SEA-2
Bat Ray System 150 1,500 Continuous, year-round
None SEA-2
Quarantine Q-7 210 43,200 Intermittent, year-round
UV sterilization SEA-2
SORAC Hopkins Tank
30 43,200 Intermittent, year-round
UV sterilization SEA-2
Total 249,200
The NSW Bat Ray Exhibit is a primarily re-circulated system with two 100 GPM sand filters. Each of these-filters is backflushed once a day for 5 minutes and backflush seawater flows to the NSW Filter Backflush Discharge (SEA-2). Maximum instantaneous flow during backflush is 150 GPM and average daily backflush flow from these two filters is approximately 1,500 GPD (Table 7-4). A Sea Otter holding tank in the MBA Quarantine Area (Tank Q-7) is equipped with a recirculating seawater system including a pressure sand filter and an ultraviolet sterilizer. All seawater effluent from this holding tank (filter backflush and overflow seawater) is routed through an ultraviolet sterilizer in the NSW basement and then to the NSW Filter Backflush Discharge (SEA-2). The sand filter on this system is backflushed daily when the tank is in use. Maximum instantaneous backflush flow is 210 GPM for 5 minutes, with a maximum daily backflush flow of approximately 1,050 GPD. Seawater is supplied to Tank Q-7 at a rate of about 30 GPM and typically overflows to drain at this same rate; overflow discharge is approximately 43,200 GPD (Table 7-4). Note: Overflow from most other Quarantine tanks (except Q-7) is routed to the NSW OFST where it may either be cycled back through the seawater system or flow out to the NSW Tidal Basin Discharge (SEA-1). However, four other holding tanks in Quarantine have the option of routing discharge through local bag filters and UV in the NSW basement. When operated in exotics “mode”, discharge from these 4 tanks is routed to the NSW Filter Backflush Discharge (SEA-2). Two Sea Otter Research and Conservation (SORAC) Program holding tanks are located adjacent to the aquarium on Hopkins Marine Station property. Seawater supplied to these holding tanks returns to the MBA NSW basement where it is routed through ultraviolet sterilizers and then to the NSW Filter Backflush Discharge (SEA-2). Maximum daily flow from the Hopkins SORAC tanks is approximately 43,200 GPD (Table 7-4). Note that this discharge is tank overflow seawater, not filter backflush. Average flow through the Near Shore Wing Filter Backflush Discharge (SEA-2) is approximately 249,200 GPD or 170 GPM (Table 7-4).
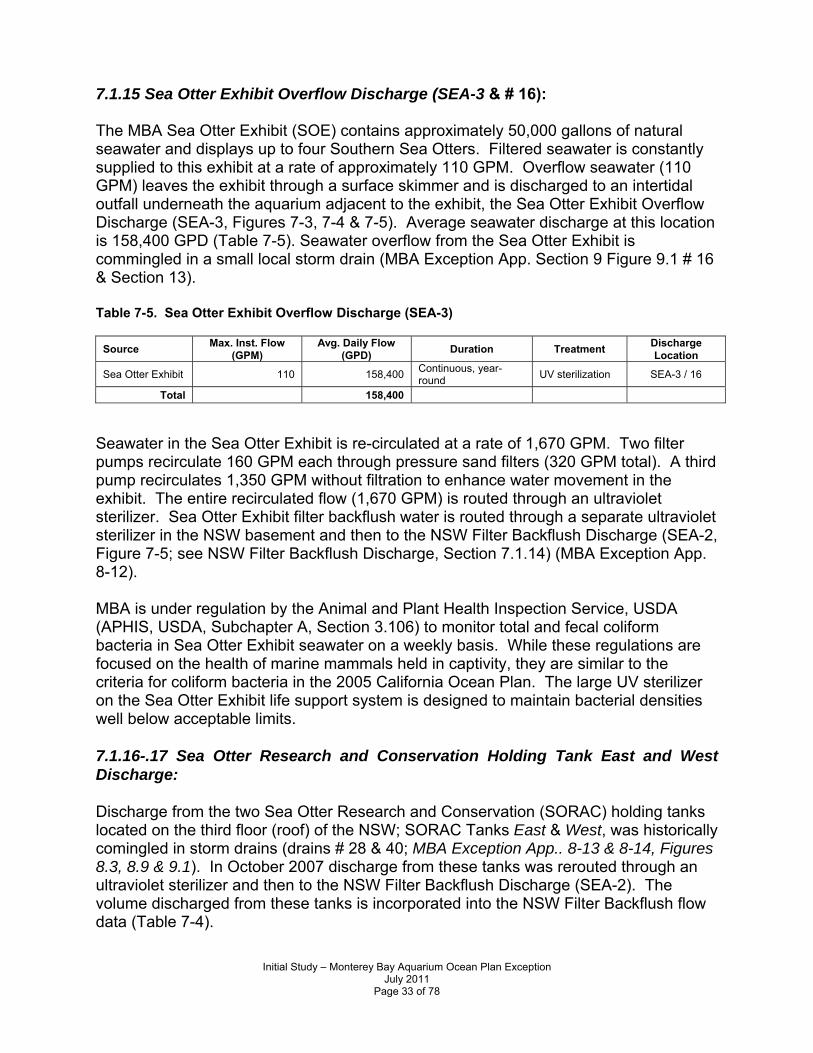
Initial Study – Monterey Bay Aquarium Ocean Plan Exception July 2011
Page 33 of 78
7.1.15 Sea Otter Exhibit Overflow Discharge (SEA-3 & # 16): The MBA Sea Otter Exhibit (SOE) contains approximately 50,000 gallons of natural seawater and displays up to four Southern Sea Otters. Filtered seawater is constantly supplied to this exhibit at a rate of approximately 110 GPM. Overflow seawater (110 GPM) leaves the exhibit through a surface skimmer and is discharged to an intertidal outfall underneath the aquarium adjacent to the exhibit, the Sea Otter Exhibit Overflow Discharge (SEA-3, Figures 7-3, 7-4 & 7-5). Average seawater discharge at this location is 158,400 GPD (Table 7-5). Seawater overflow from the Sea Otter Exhibit is commingled in a small local storm drain (MBA Exception App. Section 9 Figure 9.1 # 16 & Section 13). Table 7-5. Sea Otter Exhibit Overflow Discharge (SEA-3)
Source Max. Inst. Flow
(GPM) Avg. Daily Flow
(GPD) Duration Treatment
Discharge Location
Sea Otter Exhibit 110 158,400 Continuous, year-round
UV sterilization SEA-3 / 16
Total 158,400
Seawater in the Sea Otter Exhibit is re-circulated at a rate of 1,670 GPM. Two filter pumps recirculate 160 GPM each through pressure sand filters (320 GPM total). A third pump recirculates 1,350 GPM without filtration to enhance water movement in the exhibit. The entire recirculated flow (1,670 GPM) is routed through an ultraviolet sterilizer. Sea Otter Exhibit filter backflush water is routed through a separate ultraviolet sterilizer in the NSW basement and then to the NSW Filter Backflush Discharge (SEA-2, Figure 7-5; see NSW Filter Backflush Discharge, Section 7.1.14) (MBA Exception App. 8-12). MBA is under regulation by the Animal and Plant Health Inspection Service, USDA (APHIS, USDA, Subchapter A, Section 3.106) to monitor total and fecal coliform bacteria in Sea Otter Exhibit seawater on a weekly basis. While these regulations are focused on the health of marine mammals held in captivity, they are similar to the criteria for coliform bacteria in the 2005 California Ocean Plan. The large UV sterilizer on the Sea Otter Exhibit life support system is designed to maintain bacterial densities well below acceptable limits. 7.1.16-.17 Sea Otter Research and Conservation Holding Tank East and West Discharge: Discharge from the two Sea Otter Research and Conservation (SORAC) holding tanks located on the third floor (roof) of the NSW; SORAC Tanks East & West, was historically comingled in storm drains (drains # 28 & 40; MBA Exception App.. 8-13 & 8-14, Figures 8.3, 8.9 & 9.1). In October 2007 discharge from these tanks was rerouted through an ultraviolet sterilizer and then to the NSW Filter Backflush Discharge (SEA-2). The volume discharged from these tanks is incorporated into the NSW Filter Backflush flow data (Table 7-4).

Initial Study – Monterey Bay Aquarium Ocean Plan Exception July 2011
Page 34 of 78
7.1.18 Outer Bay Wing Intertidal Discharge (SEA-4): The life support systems in the Outer Bay Wing are all recirculated systems with limited make-up seawater flows. All of these systems include sand filters and all these filters backflush to an intertidal discharge under the Outer Bay Wing; the OBW Intertidal Discharge (SEA-4, Figures 7-3, 7-4 & 7-6). Filtered seawater supplied to these systems overflows from each system reservoir to the same Outer Bay Wing Intertidal Discharge (SEA-4, Figure 7-6). All of the life support systems in the Outer Bay wing have integral system reservoirs. When a system sand filter is backflushed, the water level in the respective reservoir drops. The make-up flow of seawater slowly brings the reservoir water level back up to the overflow skimmer. Therefore, the maximum discharge flow from any of the Outer Bay Wing systems occurs during filter backflush, but the average daily discharge flow is due to the make-up seawater flow rate. The Outer Bay System has six large filters, each of which is rated for 1,250 GPM of filtration flow. These filters are backflushed two days each week for 5 minutes each. Maximum instantaneous backflush flow is 1,750 GPM and maximum daily flow from two of these filters is approximately 17,500 GPD. Seawater is supplied to the Outer Bay System at a rate of about 60 GPM. The average daily discharge from the Outer Bay System is 86,400 GPD (Table 7-6). Six days each week 17,500 GPD of this daily average is filter backflush seawater. Table 7-6. OBW Intertidal Discharge (SEA-4)
Source Max. Inst. Flow
(GPM) Avg. Daily Flow
(GPD) Duration Treatment
Discharge Location
Outer Bay System 1,950 86,400 Continuous, year-round
None SEA-4
Jellies System 225 14,400 Continuous, year-round
None SEA-4
Rotating Exhibits System 1
375 14,400 Continuous, year-round
None+ SEA-4
Rotating Exhibits System 2
375 14,400 Continuous, year-round
None+ SEA-4
Schooling Fishes 50 72,000 Continuous, year-round
None SEA-4
Total 201,600
The OBW Jellies System includes two 150 GPM sand filters. These filters are only backflushed once a week for 5 minutes each. Maximum instantaneous flow during backflush is 225 GPM and maximum daily backflush flow from one of these filters is approximately 1,125 GPD. Filtered seawater is supplied to the Jellies System at a rate of 10 GPM and the average daily discharge from this system is approximately 14,400 GPD (Table 7-6). The Outer Bay Wing also includes two identical life support systems that are used to support rotating or temporary exhibits on the first floor. Each of these Rotating Exhibits Systems has two 250 GPM sand filters (4 filters total). These filters may be backflushed two or three times a week for 5 minutes each. Maximum instantaneous flow during backflush is 375 GPM. If two of these filters are backflushed on the same day, the maximum daily backflush flow is approximately 3,750 GPD. Filtered seawater is

Initial Study – Monterey Bay Aquarium Ocean Plan Exception July 2011
Page 35 of 78
typically supplied to each of the Rotating Exhibit Systems at a rate of 10 GPM. Average daily discharge from each of these systems is 14,400 GPD (Table 7-6). Rotating Exhibits System 2 is currently operating with fresh water. When fresh water is used in these Rotating Exhibit Systems all water overflow and filter backflush discharge is directed to sanitary sewer. Currently the discharge of seawater from OBW is slightly (14,400 GPD) lower than shown in Table 7-6. However, MBA will eventually put seawater back into Rotating Exhibits System 2; likely in late 2011 or early 2012. A new Schooling Fishes System was installed in the Outer Bay Wing basement and placed into operation in February 2010. Schooling Fishes is a recirculating system with the same basic design as the other 4 systems in OBW. The Schooling Fishes System includes three 200-250 GPM sand filters. These filters are backflushed twice a week for 5 minutes each. Maximum instantaneous flow during backflush is 350 GPM and maximum daily backflush flow from one of these filters is approximately 1,750 GPD. Filtered seawater is supplied to the Schooling Fishes System at a rate of 50 GPM and the average daily discharge from this system is approximately 72,000 GPD (Table 7-6). The total average daily flow from the Outer Bay Wing Intertidal Discharge (SEA-4) is approximately 201,600 GPD or 140 GPM (Table 7-6). Starting in April 2011, seawater discharge from all of the Outer Bay Wing systems, except Schooling Fishes, will be directed through exotic species treatment prior to discharge (see Section 7.1.3). 7.1.19 Summary by Discharge Location In summary, there are four ocean discharge locations at MBA where seawater system overflows, filter backflush seawater, or other seawater effluents are discharged to Monterey Bay. The main seawater system outfall in the NSW Tidal Basin (SEA-1) discharges the bulk of NSW exhibit overflows. The average daily flow of untreated and filtered/UV-sterilized seawater at this discharge location is approximately 921,600 GPD. In addition, 357,000 GPD of non-contact cooling seawater and 15,840 GPD of desalination brine water are mixed with the main seawater outfall and discharged into the NSW Tidal Basin (Tables 7-3 & 7-7). The NSW Filter Backflush Discharge (SEA-2) is located in the intertidal adjacent to the Tidal Basin. All pressure sand filters on systems in the NSW discharge backflush seawater to this location. Filter backflush from the SOE filters is passed through an ultraviolet sterilizer prior to discharge. Total filter backflush seawater flow to this discharge averages 161,300 GPD (Table 7-4). Five Sea Otter holding tanks also discharge overflow water to this location; Quarantine Tank Q-7, the SORAC Hopkins Tanks, and two SORAC holding tanks on the third floor of NSW. Seawater over flow from all Sea Otter tanks is UV-treated prior to discharge. The average daily flow at the NSW Filter Backflush Discharge is 249,200 GPD (Tables 7-4 & 7-7).

Initial Study – Monterey Bay Aquarium Ocean Plan Exception July 2011
Page 36 of 78
Sea Otter Exhibit overflow is discharged to a separate intertidal outfall adjacent to the exhibit (SEA-3). Average daily flow at this location is approximately 158,400 GPD (Tables 7-5 & 7-7). Overflow and filter backflush seawater from all OBW systems is discharged to a single location under the Outer Bay Wing; the OBW Intertidal Discharge (SEA-4). Average total daily discharge to this location is 201,600 GPD (Tables 7-6 & 7-7). The total, aquarium-wide, average daily flow listed in Table 7-7 (2,003,640 GPD; 1,392 GPM) is slightly lower than Influent seawater flow (2,016,000 GPD; 1,400 GPM). This discrepancy is due to the intermittent use of certain tanks or systems and the need to list an average daily flow. Table 7-7. Summary of MBA Incoming Seawater Flow and Discharge Flows by Location
Source Max. Inst. Flow
(GPM) Avg. Daily Flow
(GPD) Duration Treatment
Discharge Location
NSW Tidal Basin 897 1,294,440 Continuous, year-round
Varies with source SEA-1
NSW Backflush 173 249,200 Continuous, year-round
Varies with source SEA-2
Sea Otter Exhibit 110 158,400 Continuous, year-round
UV sterilization SEA-3 / 16
Outer Bay System 1,950 201,600 Continuous, year-round
Varies with source SEA-4
Sum of discharges 2,003,640
Total Influent 2,016,000
7.2 Displays and Husbandry 7.2.1 The Amount of Aquatic Animals Harvested or Produced in the Aquarium per Year The Monterey Bay Aquarium facility is primarily dedicated to displays of live marine plants and animals. MBA is not an aquatic animal production facility; at least not in the sense of a commercial aquaculture facility. However, MBA cultures a variety of aquatic plants and animals for use as display organisms or for use as food for display organisms (MBA Exception App. 3-1). Approximately 10,434 pounds of food are fed to the animal collection at Monterey Bay Aquarium each month (Table 7-8). This level of food utilization is fairly constant throughout the year and includes all animals under their care (display animals, rescued sea otters, injured birds, etc.). This total also includes food fed to research and display animals held at the Animal Research and Care Center (ARCC) in Marina, and at the Tuna Research and Conservation Center (TRCC) at Hopkins Marine Station (since seawater from both locations is returned to the MBA for treatment and discharge) (MBA Exception App. 4-1).

Initial Study – Monterey Bay Aquarium Ocean Plan Exception July 2011
Page 37 of 78
Table 7-8. Food Items Fed to Aquarium Animals (2010)
Food Item Origin Farmed or Wild DistributorUsage (lb per
month)
Shrimp Mexico farmed Race Street Foods 700
Night Smelt Oregon Wild Race Street Foods 300
Surf Clam (Spisula solidissima) East Coast Wild Atlantic Pacific 900
Silversides Chesapeake Bay Wild Atlantic Pacific 150
Blue Mussels (Mytilus edulis), live Prince Edward Island farmed Race Street Foods 200
Manila Clams ( Tapes philippinarum) live Washington State farmed Race Street Foods 350
Squid (Loligo opalescence) California wild Race Street Foods 1,000
Salmon (King and Coho) Alaska, Oregon, CA, California wild Ocean Fresh Seafoods 450
Krill (pacifica) North East Pacific wild Krill Cananda 1,800
Krill (superba) Antarctic wild Krill Cananda 700
Capelin (male) Newfoundland, Canada Wild McRoberts Sales 2,000
Rock Crabs (Cancer sp. ) Live Santa Cruz Wild Chris Eatinger 700
Crickets, live Visalia, CA farmed Basset's Cricket Ranch 400
Fly Larvae, live Tucson, AZ farmed Arbico Environmentals 5
Meal Worms, live Compton, CA farmed Basset's Cricket Ranch 12
Tubiflex worms, live Fresno, CA farmed Aquatic Foods 30
Wax Worms, live Hamilton, OH farmed Grubco 12
Sardines California wild Monterery Fish Company 500
Anchovies California wild Bionic Bait 100
Oysters, live Canada farmed Ocean Fresh Seafoods 20
Mysids, live Florida wild Aquatic Indicators 20
Hikari Frozen Brine shrimp USA farmed Bayou Aquatics and Retile Supplies 10
Hikari Frozen Mysis shrimp USA farmed Bayou Aquatics and Retile Supplies 10
Hikari Frozen Bloodworms USA farmed Bayou Aquatics and Retile Supplies 5
Trout Idaho farmed Bionic Bait 5
Frozen Mysis Canada farmed Piscine Aquatics 40
Cyclop-eeze Arctic farmed Jehmco 15 8.0 Natural Water Quality As part of the Scripps Institute of Oceanography (SIO) exception, State Water Board directed staff to create an ASBS Natural Water Quality Committee (NWQC) to define natural water quality in the San Diego-Scripps ASBS in La Jolla. The NWQC had a three-year mission to advise State Water Board staff regarding impacts of SIO’s discharges into an adjoining ASBS. While the committee focused on SIO and other relevant data in the vicinity of SIO, they also recognized the importance of their work in the context of the greater ASBS, Ocean Plan, and stormwater issues. In September 2010 a final report from the NWQC was presented to the State Water Board, which included a definition of Natural Water Quality. The definition states that natural water quality is “That water quality (based on selected physical chemical and biological characteristics) that is required to sustain marine ecosystems, and which is without apparent human influence, i.e., an absence of significant amounts of: a) man-made constituents (e.g., DDT), b) other chemical (e.g., trace metals), physical (temperature/thermal pollution, sediment burial) and biological (e.g., bacteria) constituents at levels that have been elevated due to man’s activities above those resulting from the naturally occurring processes that affect the area in question, and c) non-indigenous biota (e.g., invasive algal bloom species) that have been introduced either deliberately or accidentally by man.” The definition also states that: “it is not practical to identify a unique seawater composition as exhibiting natural water quality. Nevertheless, the committee believes that it is practical to define an operational natural water quality for an ASBS, and that such a definition must satisfy the following criteria:

Initial Study – Monterey Bay Aquarium Ocean Plan Exception July 2011
Page 38 of 78
it should be possible to define a reference area or areas for each ASBS that currently approximate natural water quality and that are expected to exhibit the likely natural variability that would be found in that ASBS,
any detectable human influence on the water quality must not hinder the ability of marine life to respond to natural cycles and processes.”
The NWQC’s complete definition of Natural Water Quality and their other findings may be found in the Summation of Findings, Natural Water Quality Committee 2006-2009, in Appendix C.

Initial Study – Monterey Bay Aquarium Ocean Plan Exception July 2011
Page 39 of 78
II. Environmental Impacts The environmental factors checked below could be potentially affected by this project. See the checklist on the following pages for more details. Aesthetics Agriculture and Forestry Resources Air Quality
Biological Resources Cultural Resources Geology/Soils
Greenhouse Gas Emissions
Hazards & Hazardous Materials Hydrology/Water Quality
Land Use/Planning Mineral Resources Noise
Population/Housing Public Services Recreation
Transportation/Traffic Utilities/Service Systems Mandatory Findings of Significance
1. AESTHETICS. Would the project:
Issues (and Supporting Information Sources):
Potentially Significant
Impact
Less Than Significant
With Mitigation
Incorporated
Less Than Significant
Impact
No Impact
a) Have a substantial adverse effect on a scenic vista?
b) Substantially damage scenic resources, including, but not limited to, trees, rock outcroppings, and historic buildings within a state scenic highway?
c) Substantially degrade the existing visual character or quality of the site and its surroundings?
d) Create a new source of substantial light or glare that would adversely affect day or nighttime views in the area?
2. AGRICULTURAL AND FOREST RESOURCES. In determining whether impacts to agricultural
resources are significant environmental impacts, lead agencies may refer to the California Agricultural Land Evaluation and Site Assessment Model (1997) prepared by the California Department of conservation as an optional model to use in assessing impacts on agriculture and farmland. In determining whether impacts to forest resources, including timberland, are significant environmental effects, lead agencies may refer to information compiled by the California Department of Forestry and Fire Protection regarding the state’s inventory of forest land, including the Forest and Range Assessment Project and the Forest Legacy Assessment project; and forest carbon measurement methodology provided in Forest Protocols adopted by the California Air Resources Board. Would the project:
Issues (and Supporting Information Sources):
Potentially Significant
Impact
Less Than Significant
With Mitigation
Incorporated
Less Than Significant
Impact
No Impact
a) Convert Prime Farmland, Unique Farmland, or Farmland of Statewide Importance (Farmland), as shown on the maps prepared pursuant to the Farmland Mapping & Monitoring Program of the California Resources Agency, to non-agricultural uses?
b) Conflict with existing zoning for agricultural use, or a Williamson Act contract?

Initial Study – Monterey Bay Aquarium Ocean Plan Exception July 2011
Page 40 of 78
c) Conflict with existing zoning for, or cause rezoning of, forest land (as defined in Public Resources Code section 12220(g)) or timberland (as defined by Public Resources Code section 4526)?
d) Result in the loss of forest land or conversion of forest land to non-forest use?
e) Involve other changes in the existing environment which, due
to their location or nature, could result in conversion of Farmland, to non-agricultural use or conversion of forest land to non-forest use?
3. AIR QUALITY. Where available, the significance criteria established by the applicable air quality
management or air pollution control district may be relied upon to make the following determinations. Would the project:
Issues (and Supporting Information Sources):
Potentially Significant
Impact
Less Than Significant
With Mitigation
Incorporated
Less Than Significant
Impact
No Impact
a) Conflict with or obstruct implementation of the applicable air quality plan?
b) Violate any air quality standard or contribute substantially to an existing or projected air quality violation?
c) Expose sensitive receptors to substantial pollutant concentrations?
d) Result in a cumulatively considerable net increase of any criteria pollutant for which the project region is non-attainment under an applicable federal or state ambient air quality standard (including releasing emissions that exceed quantitative thresholds for ozone precursors)?
e) Create objectionable odors affecting a substantial number of people?
4. BIOLOGICAL RESOURCES. Would the project:
Issues (and Supporting Information Sources):
Potentially Significant
Impact
Less Than Significant
With Mitigation
Incorporated
Less Than Significant
Impact
No
Impact
a) Have a substantial adverse effect, either directly or through habitat modifications, on any species identified as a candidate, sensitive, or special status species in local or regional plans, policies, or regulations, or by the DFG or USFWS?
b) Have a substantial adverse effect on any riparian habitat or other sensitive natural community identified in local or regional plans, policies, regulations or by the DFG or USFWS?
c) Have a substantial adverse effect on federally-protected wetlands as defined by Section 404 of the federal Clean Water Act (including, but not limited to, marsh, vernal pool, coastal, etc.) through direct removal, filling, hydrological interruption or other means?

Initial Study – Monterey Bay Aquarium Ocean Plan Exception July 2011
Page 41 of 78
d) Interfere substantially with the movement of any native resident or migratory fish or wildlife species or with established native resident or migratory corridors, or impede the use of native wildlife nursery sites?
e) Conflict with any local policies or ordinances protecting biological resources, such as a tree preservation policy or ordinance?
f) Conflict with the provisions of an adopted Habitat Conservation Plan, Natural Community Conservation Plan, or other approved local, regional, or state habitat conservation plan?
Biological Resources Impacts A biological reconnaissance survey was conducted in 1977 and the report for that survey was published by the State Water Board in 1979. That report enumerated 87 species of algae and plants, 521 species of invertebrates and 17 species of fish that inhabit the ASBS. However, while somewhat comprehensive that survey was only qualitative in nature. Five sites surveyed in the State Water Board 1979 Reconnaissance Survey Report were revisited by Tenera in July 2002 while conducting field work for the Point Pinos Report. One of the five sites was located at Point Pinos and the other four sites were situated along the shoreline between Point Pinos and Hopkins Marine Station. A species list was developed for each site by walking the area and noting all species encountered. All identifications were made in the field. In contrast, it was not clear in the original study if samples had been collected for laboratory identification. The tide level was slightly above MLLW (above the surf grass zone) during the 2002 survey. Two biologists worked separately in the search effort at each site and created a combined species list for each site. The combined search effort at each site was between 1-2 hours. Tenera found it difficult to use the data from the State Water Board 1979 Reconnaissance Report (field survey in 1977) and current data to make direct comparisons over time, as the species list appeared to be affected by differences in the intensity of search effort, time spent at each site, tidal levels during the surveys, and detail to adequately characterize the sampling sites. It was found that the most common species were still present in all areas in both surveys, but there was uncertainty concerning the continued or past occurrences of less common species. Without the same sampling effort in both surveys, there was no assurance in whether a species was not present or simply overlooked. According to Tenera the total number of algal and invertebrate species found at the Point Pinos site was similar between the 1977 and 2002 surveys. In contrast, more species were found at each of the four other sites in the 2002 survey compared to the

Initial Study – Monterey Bay Aquarium Ocean Plan Exception July 2011
Page 42 of 78
1977 survey, but all of the sites also had species that were unique to one or the other survey. The appendices in the 1979 State Water Board Report contain other species lists. Tenera found that those lists could not be used for comparison with the current survey. The list of intertidal invertebrates for several areas in the 1979 State Water Board Report is based on the cumulative listings from 27 literature and museum references dating in the 1940s-1960s. The species were tabulated for large general areas (Point Pinos, Monterey Peninsula, Pacific Grove, Hopkins Marine Station). Because the collecting locations were not specified, the data were of limited use in comparing changes in faunal composition over time. Also, the number of species found in each area probably reflects the number of times each area was sampled. Tenera found, however, that Point Pinos was a popular study area between the 1940s and 1960s, as the species list for Point Pinos is the longest. Tenera concludes that, from their observations, overall diversity has not changed at the Point Pinos site since the survey in 1977. Tenera found one conclusive difference, however, between the 1977 and 2002 surveys. This was a lack of sea palms (Postelsia palmaeformis) in the present survey, although they were not able to conclude whether its absence was due to visitor impacts or other causes. Although not listed as a species of special concern or of rare, endangered, or threatened status by DFG or the U.S. Fish and Wildlife Service, California Code of Regulations prohibit cutting or disturbing this species. Regardless, this species is illegally collected for consumption. One very important limitation of the Tenera 2002 study was that it was designed to assess visitor use and not designed to assess quantitative differences between biological communities at discharge locations as compared to undisturbed reference conditions. The applicant (MBA) provided two manuscripts for background of biological assessments within the ASBS. Barry et al 1995 and Sagarin et al 1999 documented changes in abundance of macroinvertebrates between surveys from 1931-1933 and 1993-1996 at Hopkins Marine Station. These works indicated that there had been a shift of species abundances at the site over 60 years consistent with the idea of global warming. Five of seven northern species declined and ten of eleven southern species increased between the two study periods. At a study site further south, Schiel et al 2004 found that changes in community structure were common but that there was no obvious link to global warming. The State Water Board staff asked Dr. Raimondi (2008) to evaluate Barry et al to determine if the data provided had any potential for use in the question of the effects of runoff on marine life. According to Dr. Raimondi, this paper did not provide any insight relevant to an assessment of discharges into ASBS. The applicant (MBA) also provided summaries of intertidal and subtidal biological community survey data from study sites located within and adjacent to the ASBS as an Addendum to their application. The intertidal survey report was authored by Dr. Peter

Initial Study – Monterey Bay Aquarium Ocean Plan Exception July 2011
Page 43 of 78
Raimondi and compiled from data provided by the Multi-Agency Rocky Intertidal Network (MARINe). This report included information from intertidal surveys conducted at various sites in Central California with focus on a site at Hopkins Marine Station. The intertidal survey report covers fall 1999 through spring 2006. Overall, it was found that the Hopkins Marine ASBS site had high species richness (103 species, at the high end of the range of 75-107 for the central coast region) including three species of interest (Black Abalone, Owl Limpets and Surfgrass). No invasive species were found and species composition and size of species of special interest (Black Abalone, Lottia and seastars) with high recruitment levels of Black Abalone, specifically, were indicative of an area protected from human exploitation. There was considerable variability at the site which is also reflected in other central coast locations and was “not indicative of any local anthropogenic forcing” but rather reflective of normal and background levels of variance. Cluster analysis grouped Hopkins Marine Station with other central coast sites, “suggesting no degradation at the site”. The subtidal survey data was provided by the Partnership for Interdisciplinary Studies of Coastal Oceans (PISCO) and summarized by aquarium staff. Data was included for subtidal surveys conducted off MacAbee Beach (located 135 meters southeast of the ASBS) and Hopkins Marine Station (at a site approximately 250 meters away from the main aquarium ocean discharge location). The subtidal report included information from MacAbee Beach and Hopkins Marine Station from 1999 through 2006. The data included results from fish transects, swath sampling for algae and invertebrates and uniform point cover for algae and invertebrate coverage. Fish abundances for both locations were similar but Hopkins showed higher species diversity and abundance was higher for sport fishing target species (Striped Surfperch, Lingcod and Black and Yellow Rockfish). Hopkins is a more wave exposed location and that is reflected in the kelp community present at the site, especially the abundance of coralline algae. Differences in invertebrate diversity and abundance between the two sites was more difficult to interpret based on substrate, dietary and community structure dynamics but there was “no compelling reason to believe that the observed differences in the distribution of these invertebrates are due to anthropogenic impacts”. Limitations of existing data and recommendations for further work Based on a review of the above information, functional biological communities are found in the ASBS even in the presence of anthropogenic influences. There is adequate evidence to allow an exception to the Ocean Plan for Monterey Bay Aquarium discharges, as long as they are properly controlled. The adoption of these Special Protections will only reduce pollution and improve habitat, thereby allowing for improved and sustained protection for marine aquatic life. Additional biological monitoring must be performed in order to insure protection of marine aquatic life. A well-planned approach to biological investigations is required to

Initial Study – Monterey Bay Aquarium Ocean Plan Exception July 2011
Page 44 of 78
adequately address the question of waste discharge impacts. Toward this end State Water Board staff is supportive of a regional approach to monitoring, with statewide comparability, including biological monitoring. Further staff conclusions regarding future biological monitoring are as follows: For best results future biological monitoring in this ASBS should be linked to a
rigorous regional approach, with statewide consistency. The reference sites should be selected with the advice of a team of experts.
There would be much more power to assess community differences and impacts, or
if any differences are due to natural variability, if there are adequate replication and more reference sites.
Community composition should be compared between discharge and reference sites
using statistically robust techniques such as multivariate cluster analysis. Ideally, the results of this rigorous and comprehensive sampling effort will yield an
index of community health in relation to waste discharges, and possibly the identification of less comprehensive cost-effective biological indicators for future use.
5. CULTURAL RESOURCES. Would the project:
Issues (and Supporting Information Sources):
Potentially Significant
Impact
Less Than Significant
With Mitigation
Incorporated
Less Than Significant
Impact
No Impact
a) Cause a substantial adverse change in the significance of a historical resource as defined in §15064.5?
b) Cause a substantial adverse change in the significance of an archaeological resource as defined in §15064.5?
c) Directly or indirectly destroy a unique paleontological resource or site or unique geologic feature?
d) Disturb any human remains, including those interred outside of formal cemeteries?

Initial Study – Monterey Bay Aquarium Ocean Plan Exception July 2011
Page 45 of 78
6. GEOLOGY and SOILS. Would the project:
Issues (and Supporting Information Sources):
Potentially Significant
Impact
Less Than Significant
With Mitigation
Incorporated
Less Than Significant
Impact
No
Impact
a) Expose people or structures to potential substantial adverse effects, including the risk of loss, injury, or death involving:
i) Rupture of a known earthquake fault, as delineated in the most recent Alquist-Priolo Earthquake Fault Zoning Map issued by the State Geologist for the area or based on other substantial evidence of a known fault? Refer to Division of Mines & Geology Special Publication 42.
ii) Strong seismic ground shaking?
iii) Seismic-related ground failure, including liquefaction?
iv) Landslides?
b) Result in substantial soil erosion or the loss of topsoil?
c) Be located on a geologic unit or soil that is unstable, or that would become unstable as a result of the project, and potentially result in on- or off-site landslide, lateral spreading, subsidence, liquefaction, or collapse?
d) Be located on expansive soils, as defined in Table 18-1-B of the Uniform Building Code (1994), creating substantial risks to life or property?
e) Have soils incapable of adequately supporting the use of septic tanks or alternate wastewater disposal systems where sewers are not available for the disposal of wastewater?
7. GREENHOUSE GAS EMISSIONS -- Would the project:
Issues (and Supporting Information Sources):
Potentially Significant
Impact
Less Than Significant With Mitigation Incorporated
Less Than Significant
Impact
No Impact
a) Generate greenhouse gas emissions, either directly or indirectly, that may have a significant impact on the environment?
b) Conflict with any applicable plan, policy or regulation of an agency adopted for the purpose of reducing the emissions of greenhouse gases?
8. HAZARDS and HAZARDOUS MATERIALS. Would the project:
Issues (and Supporting Information Sources):
Potentially Significant
Impact
Less Than Significant
With Mitigation
Incorporated
Less Than Significant
Impact
No
Impact
a) Create a significant hazard to the public or the environment through the routine transport, use, or disposal of hazardous materials?
b) Create a significant hazard to the public or the environment through reasonably foreseeable upset and accident conditions involving the release of hazardous materials into the environment?

Initial Study – Monterey Bay Aquarium Ocean Plan Exception July 2011
Page 46 of 78
c) Emit hazardous emissions or handle hazardous or acutely hazardous materials, substances, or waste within ¼ mile of an existing or proposed school?
d) Be located on a site which is included on a list of hazardous materials sites compiled pursuant to Government Code §65962.5 and, as a result, would it create a significant hazard to the public or to the environment?
e) For a project located within an airport land use plan or, where such a plan has not been adopted, within two miles of a public airport or a public use airport, would the project result in a safety hazard for people residing or working in the project area?
f) For a project within the vicinity of a private airstrip, would the project result in a safety hazard for people residing or working in the project area?
g) Impair implementation of or physically interfere with an adopted emergency response plan or emergency evacuation plan?
h) Expose people or structures to a significant risk of loss, injury, or death involving wildland fires, including where wildlands are adjacent to urbanized areas or where residences are intermixed with wildlands?
9. HYDROLOGY and WATER QUALITY. Would the project:
Issues (and Supporting Information Sources):
Potentially Significant
Impact
Less Than Significant
With Mitigation
Incorporated
Less Than Significant
Impact
No
Impact
a) Violate any water quality standards or waste discharge requirements?
b) Substantially deplete groundwater supplies or interfere substantially with groundwater recharge such that there would be a net deficit in aquifer volume or a lowering of the local groundwater table level (e.g., the production rate of pre-existing nearby wells would drop to a level which would not support existing land uses or planned uses for which permits have been granted)?
c) Substantially alter the existing drainage pattern of the site or area, including through the alteration of the course of a stream or river, in a manner which would result in substantial erosion or siltation on- or off-site?
d) Substantially alter the existing drainage pattern of the site or area, including through the alteration of the course of a stream or river, or substantially increase the rate or amount of surface runoff in a manner which would result in flooding on- or off-site?
e) Create or contribute runoff water which would exceed the capacity of existing or planned stormwater drainage systems or provide substantial additional sources of polluted runoff?
f) Otherwise substantially degrade water quality?

Initial Study – Monterey Bay Aquarium Ocean Plan Exception July 2011
Page 47 of 78
g) Place housing within a 100-year flood hazard area as mapped on a federal Flood Hazard Boundary or Flood Insurance Rate Map or other flood hazard delineation map?
h) Place within a 100-year flood hazard area structures which would impede or redirect flood flows?
i) Expose people or structures to a significant risk of loss, injury, or death involving flooding, including flooding as a result of the failure of a levee or dam?
j) Inundation by seiche, tsunami, or mudflow? Hydrology and Water Quality Impacts California Ocean Plan Chemical Objectives The California Ocean Plan prohibits waste discharges to ASBS and requires that discharges should be a sufficient distance away from the ASBS so as not to alter natural water quality in the ASBS. Since 2003 the State Board adopted exceptions have required that natural water quality be met as a condition to discharges into ASBS. Considerable work has been funded by the State Water Board to address the question of what constitutes natural water quality. A committee of scientists (the Natural Water Quality Committee) has been convened to assist in answering this question, and three studies have been performed on water quality in ASBS: 1) a pilot study on reference sites in northern, central and southern California; 2) a statewide probabilistic survey of ASBS water quality near discharges and away from discharges (background water quality); and 3) a targeted survey of water quality at discharges and at reference sites in southern California. The California Ocean Plan also provides numeric objectives for the protection of marine aquatic life based on a conservative estimate of chronic toxicity. Listed in Table II.1. are certain California Ocean Plan numeric objectives. Table II.1. California Ocean Plan Table B Chemical Objectives, Marine Aquatic Life
Constituent Inst. Max. Daily Max. 6 Mo. Median
Arsenic 80 μg/L 32 μg/L 8 μg/L
Cadmium 10 μg/L 4 μg/L 1 μg/L
Chromium 20 μg/L 8 μg/L 2 μg/L
Copper 30 μg/L 12 μg/L 3 μg/L
Lead 20 μg/L 8 μg/L 2 μg/L
Mercury 0.4 μg/L 0.16 μg/L 0.04 μg/L
Nickel 50 μg/L 20 μg/L 5 μg/L
Selenium 150 μg/L 60 μg/L 15 μg/L
Silver 7 μg/L 2.8 μg/L 0.7 μg/L
Zinc 200 μg/L 80 μg/L 20 μg/L
NH3N 6,000 μg/L 2400 μg/L 600 μg/L
Initial Study – Monterey Bay Aquarium Ocean Plan Exception July 2011
Page 48 of 78
Natural Water Quality As part of the Scripps Institute of Oceanography (SIO) exception, State Water Board directed staff to create an ASBS Natural Water Quality Committee (NWQC) to define natural water quality in the San Diego-Scripps ASBS in La Jolla. The NWQC had a three-year mission to advise State Water Board staff regarding impacts of SIO’s discharges into an adjoining ASBS. While the committee focused on SIO and other relevant data in the vicinity of SIO, they also recognized the importance of their work in the context of the greater ASBS, Ocean Plan, and stormwater issues. In September 2010 a final report from the NWQC was presented to the State Water Board, which included a definition of Natural Water Quality. The definition states that natural water quality is “That water quality (based on selected physical chemical and biological characteristics) that is required to sustain marine ecosystems, and which is without apparent human influence, i.e., an absence of significant amounts of: a) man-made constituents (e.g., DDT), b) other chemical (e.g., trace metals), physical (temperature/thermal pollution, sediment burial) and biological (e.g., bacteria) constituents at levels that have been elevated due to man’s activities above those resulting from the naturally occurring processes that affect the area in question, and c) non-indigenous biota (e.g., invasive algal bloom species) that have been introduced either deliberately or accidentally by man.” The definition also states that: “it is not practical to identify a unique seawater composition as exhibiting natural water quality. Nevertheless, the committee believes that it is practical to define an operational natural water quality for an ASBS, and that such a definition must satisfy the following criteria:
it should be possible to define a reference area or areas for each ASBS that currently approximate natural water quality and that are expected to exhibit the likely natural variability that would be found in that ASBS;
any detectable human influence on the water quality must not hinder the ability of
marine life to respond to natural cycles and processes The NWQC’s complete definition of Natural Water Quality and their other findings may be found in the Summation of Findings, Natural Water Quality Committee 2006-2009, in Appendix C. Reference Site Pilot Study In the 2007-2008 winter seasons, a pilot study was performed on potential reference sites. Table II.2. provides average results and data ranges for all potential reference site samples:
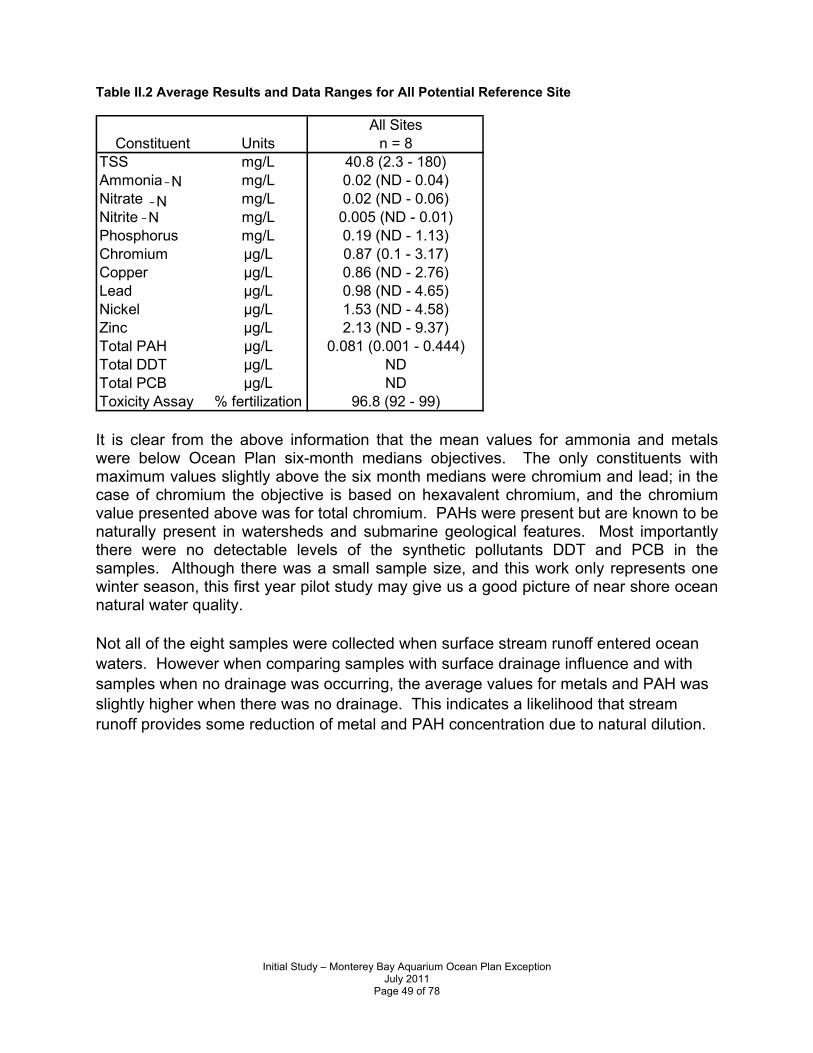
Initial Study – Monterey Bay Aquarium Ocean Plan Exception July 2011
Page 49 of 78
Table II.2 Average Results and Data Ranges for All Potential Reference Site
It is clear from the above information that the mean values for ammonia and metals were below Ocean Plan six-month medians objectives. The only constituents with maximum values slightly above the six month medians were chromium and lead; in the case of chromium the objective is based on hexavalent chromium, and the chromium value presented above was for total chromium. PAHs were present but are known to be naturally present in watersheds and submarine geological features. Most importantly there were no detectable levels of the synthetic pollutants DDT and PCB in the samples. Although there was a small sample size, and this work only represents one winter season, this first year pilot study may give us a good picture of near shore ocean natural water quality. Not all of the eight samples were collected when surface stream runoff entered ocean waters. However when comparing samples with surface drainage influence and with samples when no drainage was occurring, the average values for metals and PAH was slightly higher when there was no drainage. This indicates a likelihood that stream runoff provides some reduction of metal and PAH concentration due to natural dilution.
All SitesConstituent Units n = 8
TSS mg/L 40.8 (2.3 - 180)Ammonia mg/L 0.02 (ND - 0.04)Nitrate mg/L 0.02 (ND - 0.06)Nitrite mg/L 0.005 (ND - 0.01)Phosphorus mg/L 0.19 (ND - 1.13)Chromium µg/L 0.87 (0.1 - 3.17)Copper µg/L 0.86 (ND - 2.76)Lead µg/L 0.98 (ND - 4.65)Nickel µg/L 1.53 (ND - 4.58)Zinc µg/L 2.13 (ND - 9.37)Total PAH µg/L 0.081 (0.001 - 0.444)Total DDT µg/L NDTotal PCB µg/L NDToxicity Assay % fertilization 96.8 (92 - 99)
-N -N
-N

Initial Study – Monterey Bay Aquarium Ocean Plan Exception July 2011
Page 50 of 78
Table II.3 Regional Comparison of Potential Reference Station North Coast Central Coast South Coast Constituent Units n = 1 n = 2 n = 2
TSS mg/L 12.3 5.35 (2.3 - 8.4) 34.5 (21.7 - 47.2) Ammonia-N mg/L 0.03 0.02 (ND - 0.04) 0.015 (ND - 0.03) Nitrate-N mg/L 0.06 0.01 0.005 (ND - 0.01) Nitrite-N mg/L 0.01 ND 0.005 (ND - 0.01) Phosphorus mg/L ND ND 0.016 (ND - 0.032) Chromium µg/L 1.12 0.11 (0.1 - 0.12) 0.76 (0.6 - 0.92) Copper µg/L 1.07 0.31 (ND - 0.62) 0.91 (0.28 - 1.54) Lead µg/L 0.15 0.20 (ND - 0.39) 1.11 (0.51 - 1.71) Nickel µg/L 1.56 0.66 (ND - 1.31) 1.88 (0.53 - 3.23) Zinc µg/L ND 0.77 (0.1 - 1.45) 2.56 (2.44 - 2.69) Total PAH µg/L 0.003 0.003 (0.001 - 0.004) 0.018 (0.012 - 0.024) Total DDT µg/L ND ND ND Total PCB µg/L ND ND ND Toxicity Assay
% fertilization 98 96.5 (96 - 97) 95.5 (92 - 99)
One concern voiced by stakeholders is that there may be differences in natural water quality in different regions of the state. Table II.3 represents a regional comparison of the potential reference station results. Two samples were collected in reference areas on the Central Coast. Statewide Probabilistic Study The State Water Board funded a statewide monitoring program during the winter of 2008-09 to assess water quality in ASBS near and far from direct discharges. Over 100 chemical constituents and toxicity were measured from 62 sites using a probabilistic study design; roughly half of sites were sampled in the ocean directly in front of a direct discharge into an ASBS and the other half were located in the ocean greater than 500 meters from a direct discharge. Sample sites greater than 500 meters from direct discharges may be influenced by other watershed drainages either into or outside of the ASBS, and therefore may represent background but not necessarily natural conditions. Samples at each site were collected less than 24 hour before rainfall and again less than 24 hour after rainfall. Ocean receiving water sites were sampled at most mainland ASBS in California. The statewide survey illustrated generally good chemical water quality at the Pacific Grove ASBS. Table II.4 reports the results of the 2009 ASBS Water Quality Survey for the Pacific Grove ASBS sample location. Samples were collected prior to a storm event and after the beginning of a storm event at one location in the Pacific Grove ASBS near discharges (station D035); however there was no “non-discharge” site (>500 meters from a discharge) in the Pacific Grove ASBS. Station D035 is about 1300m away from Hopkins Marine Station and MBA.

Initial Study – Monterey Bay Aquarium Ocean Plan Exception July 2011
Page 51 of 78
In non-storm conditions (pre-storm), water quality for almost all the constituents analyzed is within the Ocean Plan standards. Synthetic anthropogenic chemicals such as DDTs or PCBs were not detected. The only constituent that slightly exceeded the Ocean Plan objective (0.0088 μg/L) was total PAH (0.013 μg/L). Therefore overall pre-storm water quality in the Pacific Grove ASBS is very good. Post rain receiving water near discharges in Pacific Grove ASBS exhibited evidence of minor storm runoff impacts. Concentrations of nutrients and certain metals show increases from the pre-rain sample. While most constituents did not exceed standards, three constituents (total copper, total zinc, and PAHs) exceeded the lowest applicable objectives (six month median for metals and 30 day average for PAHs) at the Pacific Grove ASBS. The post-rain total copper concentration of 3.5 μg/L slightly exceeds the Ocean Plan six month median water quality objective of 3.0 μg/L but was also greater than the statewide pilot study mean and maximum reference concentrations (Table II.2.). The total zinc concentration of 21.2 μg/L slightly exceeds the Ocean Plan six month median water quality objective of 20 μg/L but was also greater than the statewide pilot study mean and maximum reference concentrations (Table II.2). Both dissolved copper and zinc were similar to the total copper and zinc concentrations, and just slightly below the Ocean Plan six month median objectives. For total PAH the post-rain sample (0.014 μg/L), virtually the same as the pre-rain sample, slightly exceeded Ocean Plan objective of 0.0088 μg/L; nevertheless this was within the range of PAH concentrations (0.001-0.444 μg/L) found at reference sites statewide during the 2007-08 pilot study (Table II.2).

Initial Study – Monterey Bay Aquarium Ocean Plan Exception July 2011
Page 52 of 78
Table II.4. Statewide ASBS Water Quality Survey, Results for Pacific Grove ASBS Randomly Selected Sample Station. Constituent Discharge Pre Storm Event Discharge Post Storm Event Units Ammonia-N 0 (ND) 0.03 mg/L Nitrate + Nitrite-N 0.07 0.46/ mg/L TP-Total 0.033 0.079/ mg/L TN 0 (ND) 0 mg/L TSS 2.3 5.20 mg/L DOC 0 (ND) 1.90 mg/L Arsenic-Dissolved 1.33 1.90 μg/L Arsenic-Total 1.47 2.33 μg/L Cadmium-Dissolved 0.03 0.034 μg/L Cadmium-Total 0.036 0.054 μg/L Chromium-Dissolved 0.161 0.332 μg/L Chromium-Total 0.195 0.592 μg/L Copper-Dissolved 0.33 2.72 μg/L Copper-Total 0.48 3.54 μg/L Iron-Dissolved 0 (ND) 24.5 μg/L Iron-Total 35.1 128.4 μg/L Lead-Dissolved 0.064 0.245 μg/L Lead-Total 0.274 0.958 μg/L Nickel-Dissolved 0.193 0.74 μg/L Nickel-Total 0.267 0.859 μg/L Silver-Dissolved 0 (ND) 0 μg/L Silver-Total 0 (ND) 0 μg/L Zinc-Dissolved 0 (ND) 19.85 μg/L Zinc-Total 0 (ND) 21.24 μg/L Total PAHs 0.0113 0.014 μg/L
See Appendix C for complete 2009 ASBS Water Quality Survey. Applicant Water Quality Testing Results As part of their monitoring requirement for the exception application, samples were collected for the Monterey Bay Aquarium storm water, waste seawater effluent, and ocean receiving water. General Considerations for Toxicity Testing Toxicity tests evaluate the biological response of organisms to the effluent and measure the acceptability of waters for supporting a healthy marine biota. Acute aquatic toxicity tests result in an endpoint referred to as a “lethal concentration 50” (LC50). The LC50 is the concentration that produces mortality in 50% of the test organisms. A high LC50 value indicates low acute toxicity and a low LC50 indicates high toxicity. “Toxicity Units Acute” (TUa) are inverses of the LC50s and are calculated by dividing 100 by the LC50 resulting from a 96-hour toxicity test. High TUa values indicate high toxicity. The Ocean Plan daily maximum objective is 0.3 TUa for acute toxicity in the receiving water after initial dilution. However, according to the Ocean Plan this criterion may be applied to discharges with permitted dilution values of >100:1 at the edge of the mixing zone.

Initial Study – Monterey Bay Aquarium Ocean Plan Exception July 2011
Page 53 of 78
Since dilution values were not applied to the storm water or receiving water samples collected by applicants, the actual acute toxicity LC50 results are more appropriate for scientific comparisons in this document. Chronic toxicity measures the acceptability of waters for supporting a healthy marine biota to evaluate biological response. Chronic toxicity (TUc) results were calculated using the equation TUc=100/NOEC. The Ocean Plan requires chronic toxicity to be expressed as TUc=100/NOEL. Regarding chronic toxicity, the “No Observed Effect Level” (NOEL) is the highest concentration of effluent or receiving water that causes no observable adverse effects on the test organisms in a critical life stage bioassay. NOELs of 100 percent indicate that there was no observed toxicity; NOELs less than 100 percent indicate increasing toxicity with decreasing percent concentration. Use of pass/fail tests consisting of a single effluent concentration and a control is not recommended. Receiving (ambient) water toxicity tests commonly employ two treatments, a control and the undiluted receiving water. A negative result from an acute toxicity test does not preclude the presence of chronic toxicity. In addition, because of the potential temporal variability in the toxicity of effluents, a negative test result with a particular sample does not preclude the possibility that samples collected at some other time might exhibit acute (or chronic) toxicity. Monterey Bay Aquarium effluent and receiving water toxicity tests were performed using a single effluent concentration and a control. Since a dilution series protocol was not performed in either the acute or chronic bioassays and test organisms exposed to 100% concentration only, results where an observable response was noted (Table II.6.) may not adequately reflect accurate organism response to toxicity endpoints. Seawater Effluent - Water Quality Toxicity Analysis - Chronic and Acute Tests As part of their monitoring requirement for the exception application, evaluations of toxicity were performed on Monterey Bay Aquarium seawater effluent, and ocean receiving water. On February 27, 2006, MBA staff collected grab samples of MBA effluent and receiving water. The seawater effluent sample was a flow-weighted composite from the aquarium’s four seawater outfalls (SEA-1 through SEA-4). Chronic toxicity tests included germination and growth of giant kelp Macrocystis pyrifera; and survival and growth of mysid shrimp Americamysis bahia and larval fish Menidia beryllina. One acute toxicity test was performed using the mysid shrimp Americamysis bahia. Initial water quality characteristics of the MBA effluent and receiving water are listed below in Table II.5. Table II.5. Initial water quality characteristics of the MBA Seawater effluent and receiving water samples upon receipt of chilled samples by Pacific EcoRisk.
Sample Type Temp (˚C) pH D.O (mg/L) Salinity (ppt) Total Ammonia (mg/L N) Effluent 12.3 7.93 9.9 34.1 <1.0 Receiving Water 12.1 7.99 9.0 33.1 <1.0
Data source: Monterey Bay Aquarium exception application April 17, 2006. Notes: Seawater effluent and receiving water are grab samples collected on February 27, 2006. Where no data is available (---) is used. Chronic toxicity testing with kelp (Macrocystis pyrifera) resulted in no significant reductions in kelp germination or growth in the Monterey Bay Aquarium waste seawater

Initial Study – Monterey Bay Aquarium Ocean Plan Exception July 2011
Page 54 of 78
effluent or the receiving water. The germination and growth no observed effects concentrations (NOECs) were 100% effluent which resulted in 1.0 TUc for both endpoints. Chronic toxicity test data as performed and analyzed by the testing laboratory (Pacific EcoRisk) show there were no significant reductions in kelp (Macrocystis pyrifera) germination or growth in the Monterey Bay Aquarium seawater effluent relative to the receiving water. The NOEC of 100% effluent resulted in 1.0 TUc where TUc=100/NOEC for both test endpoints. Chronic toxicity of the Monterey Bay Aquarium seawater effluent (A flow-weighted composite from SEA-1 thru SEA-4) to shrimp (Americamysis bahia) show no significant reductions in survival in the effluent relative to the receiving water. The survival NOEC of 100% effluent resulted in 1.0 TUc where TUc was calculated at 100/NOEC. Due to technician error, the shrimp dry weights for the receiving water could not be determined. As a result, the shrimp growth data for the effluent treatment were evaluated by comparison with the Lab Water Control treatment. There were no significant reductions in shrimp growth in the effluent relative to the Lab Water Control. The growth NOEC of 100% effluent resulted in 1.0 TUc where TUc=100/NOEC. There were no significant reductions in fish survival or growth in the chronic toxicity seawater effluent test relative to the receiving water. The NOEC of 100% effluent resulted in 1.0 TUc where TUc=100/NOEC for both test endpoints. Acute toxicity of Monterey Bay Aquarium seawater effluent showed no significant reductions in shrimp (Americamysis bahia) survival in the effluent relative to the receiving water. Since all the shrimp survived a LC50 could not be assessed and the survivability calculation (California Ocean Plan Appendix I) was used for acute toxicity as described in ** footnote below. The TUa was 0 for the seawater effluent; equivalent to 100% survival. Table II.6. may not adequately reflect accurate organism response to toxicity endpoints because no dilutions of effluent were assessed and a 50% lethal concentration was not obtained at 100% concentration of effluent.

Initial Study – Monterey Bay Aquarium Ocean Plan Exception July 2011
Page 55 of 78
Table II.6. MBA Aquaria Seawater Effluent and Ocean Receiving Water Toxicity Analysis Waterbody Description
Site Description
Toxicity Test Type
Shrimp Kelp
Fish
Effluent Flow-weighted composite of 4
discharges (SEA-1 through SEA-4)
Chronic 1.0 TUc (97.5% mean survival)**
1.0 TUc (0.24 growth)
No toxicity
1.0 TUc (83.6% mean germination)*
1.0 TUc (14.5µm growth)*
No toxicity
1.0 TUc (85% mean survival)*
1.0 TUc (0.57 mg growth)*
No toxicity
Receiving water
Southern boundary of the PG ASBS
just offshore of the MBA boat davit
Chronic 1.0 TUc (95% mean survival)*
(growth n/a)
No toxicity
1.0 TUc (80.4% mean germination)*
1.0 TUc (15.1µm growth)*
No toxicity
1.0 TUc (85% mean survival)*
1.0 TUc (0.57 mg growth)*
No toxicity
Effluent Flow-weighted composite of 4
discharges (SEA-1 through SEA-4)
Acute 0 TUa (100% mean survival)**
No toxicity
--- ---
Receiving water
Southern boundary of the PG ASBS
just offshore of the MBA boat davit
Acute 0 TUa ( 97.5 mean% survival)**
No toxicity
--- ---
Data source: Monterey Bay Aquarium exception application August 28, 2006. Notes: Seawater effluent and receiving water are grab samples collected on February 27, 2006. Where no data is available (---) is used. Waste Seawater Chemical and Physical Constituents Samples were collected for Monterey Bay Aquarium waste seawater effluent (February 27, 2006) and ocean receiving water (March 6, 2006). Monitoring data for constituents in seawater effluent and receiving water is represented in Tables II.7. through Table II.9. Seawater system discharge samples were composite samples, and ocean receiving water samples were grab samples. Table II.7. MBA Aquaria Seawater Effluent and Ocean Receiving Water Analysis Conventional Pollutants, 2006.
Chemical (unit)
Ocean Plan 6- month median
MBA Composited Seawater Discharge
MBA Ocean Receiving Water
MBA Ocean Reference Water
Sample Date 2/27/06 3/6/06 2/27/06 3/6/06 2/27/06 3/6/06
Ammonia – N (μg/L)
600.0 50 --- 10.0 60.0 ND ---
Nitrate-N (μg/L) 200 --- ND ND ND ---
Turbidity (NTU) 225.0* 0.8 --- 0.35 0.95 0.20 ---
Settleable Solids (mL/L)
3.0* ND --- ND ND ND ---
BOD5 (mg/L) ND --- ND ND ND ---
Temperature (˚F)
56.1-68.4 --- 56.3 53.6 55.6 ---
pH 6.0-9.0 7.77-7.97 --- 7.97 7.92 8.05 ---
Salinity (o/oo) --- --- 34.5 34 ---
Suspended solids shown as TSS. (---) indicates constituent or sample site not tested. ND indicates constituent sampled but non-detected. (*) indicates maximum at any time. Seawater system discharge samples were composited prior to analysis.

Initial Study – Monterey Bay Aquarium Ocean Plan Exception July 2011
Page 56 of 78
Table II.8. MBA Aquaria Seawater Effluent and Ocean Receiving Water Analysis Metals 2006
Chemical μg/L
Ocean Plan 6- month median
MBA Composited Seawater Discharge
MBA Ocean Receiving Water
MBA Ocean Reference
Water
Sample Date 2/27/06 3/6/06 2/27/06 3/6/06 2/27/06 3/6/06
Arsenic 8.0 1.37 1.16 1.23 1.23 ---
Cadmium 1.0 0.026 0.019 0.033 0.026 ---
Chromium 2.0 --- --- --- ---
Chromium - hexavalent
2.0 ND ND ND ND ---
Copper 3.0 0.97 0.535 0.27 0.17 ---
Lead 2.0 0.109 0.067 0.26 0.005 ---
Mercury 0.04 0.02 0.012 ND 0.01 ---
Nickel 5.0 0.354 0.216 0.15 0.143 ---
Selenium 15.0 0.021 0.056 0.05 0.02 ---
Silver 0.7 ND ND 0.06 ND ---
Zinc 20.0 2.65 2.65 1.91 1.86 ---
(---) Indicates constituent or sample site not tested. ND indicates constituent sampled but non-detected. Seawater system discharge samples were composited prior to analysis. Table II.9. MBA Aquaria Seawater Effluent and Ocean Receiving Water Analysis Pesticides, Chlorine, Radioactivity 2006
Chemical μg/L
Ocean Plan 6- month median
MBA Composited Seawater Discharge
MBA Ocean Receiving Water
MBA Ocean Reference Water
Sample Date 2/27/06 3/6/06 2/27/06 3/6/06 2/27/06 3/6/06
Cyanide 1.0 ND --- ND --- ND ---
Chlorine Residual
2.0 10 --- 10 ND 10 ---
Bromoform * ND --- ND ND ND ---
Bromomethane * ND --- ND ND ND ---
Chloromethane * ND --- ND ND ND ---
Total Halomethanes
130.00* ND --- ND ND ND ---
Endosulfan 0.009 ND --- ND ND ND ---
Endrin 0.002 ND --- ND ND ND ---
Radioactivity (Gross Alpha)
** 2.11+/- 2.17 pCi/L
--- 1.41+/-2.01 pCi/L
1.40+/-2.11 pCi/L
0.000+/-1.79pCi/L
---
Radioactivity (Gross Beta)
** 195+/-53.0pCi/L
--- 175+/-52.7pCi/L
109+/167 pCi/L
154+/-50.7pCi/L
---
(---) Inidicates constituent or sample site not tested. ND indicates constituent sampled but non-detected. Seawater system discharge samples were composited prior to analysis. *Ocean Plan 30-day average- total halomethanes are the sum of bromoform, bromomethane (methyl bromide) and chloromethane (methyl chloride). * *As measured.

Initial Study – Monterey Bay Aquarium Ocean Plan Exception July 2011
Page 57 of 78
Seawater System Discharges Conventional Constituents 2006 Table II.10. MBA Aquaria Seawater Effluent Analysis Discharge Monitoring locations March and June 2006
Constituents
Ocean Plan 30-Day Avg
Influent Seawater
Influent Seawater
SEA-2 SEA-1 SEA-4 SEA-3
Mar Jun Mar Jun Mar Jun Mar Jun Mar Jun Mar Jun Turbidit
y (NTU)
75.0 0.70 0.50 0.60 --- 12 12 0.45 0.2 1.0 0.75 0.10 0.15
Settleable
Solids (mL/L)
1.0 --- --- --- --- 0.3 0.2 ND ND ND ND ND ND
TSS (mg/L)
60.0 8.60 4.90 3.90 3.50 57.0 53.0 4.10 4.30 9.20
10.40 2.8 6.70
DO (mg/L)
--- --- --- --- 8.5 --- 8.3 8.3 7.3 7.2 8.2 7.8
Temperature (˚F)
56.8 53.4 56.8 54.0 55.8 54.0 55.8 54.7 65.8
65.5 58.6 58.3
pH 6.0-9.0
7.81 7.89 7.88 7.91 7.84
7.87
Suspended solids are abbreviated as TSS. Dissolved oxygen abbreviated as DO. (---) is shown were constituent or sample site was not tested. ND is used where constituent was not detected in the sample SEA-2 is the NSW filter backflush discharge; SEA-1 is the NSW tidal basin discharge; SEA-4 is the OBW intertidal discharge; SEA-3 & 16 is the sea otter exhibit overflow discharge. It is clear that certain ASBS waste seawater discharges generally contain some concentrations of waste. However, in terms of the water quality objectives, the waste seawater was below standards for constituents. The constituents were also, below or within all levels of the Ocean Plan objectives, except for the constituent Chlorine Residual. For Chlorine Residual, the Ocean Plan objective is 2.0 μg/L, and at the 3 sites tested, the constituent level was 10.0 μg/L as presented in Table II.9. Storm Water Toxicity Results Storm water samples were collected for toxicity analysis on March 6, 2006. Samples for toxicity samples were collected at two locations representing MBAQ storm runoff, the Near Shore Wing (NSW storm water) and the Corporation Yard (Corporation storm water), and one ocean receiving water location. Storm water samples were tested at the 100% concentration only. Storm water effluent and receiving water were grab samples. Chronic toxicity tests were run on kelp, mysids, and fish, and an acute toxicity test was run on mysids. For kelp (Macrocystis pyrifera) chronic toxicity tests, kelp germination in the NSW storm water was statistically less than in the MBAQ receiving water (this difference, driven by the unusually low inter-replicate variability, was almost certainly not toxicologically/ecologically significant). The germiniation NOECs were <100% storm water, resulting in >1.0 TUc. There were significant reductions in mean germ tube length in the NSW storm water and in the Corporation storm water relative to the ocean

Initial Study – Monterey Bay Aquarium Ocean Plan Exception July 2011
Page 58 of 78
receiving water. However, it is important to note that the artificial sea salt that was being used to adjust the salinity of the storm water samples to the required test salinity may have introduced some artifactual toxicity to the media; there were no significant reductions in germ tube growth in the storm water samples relative to the Artificial Sea Salt control; There were no significant reductions in kelp germination and growth in the Corporation storm water; the germination was 100% storm water, resulting n 1.0 TUc for both storm water samples. For mysids (Americamysis bahia) chronic toxicity tests, there were no significant reductions in mysid survival or growth in the NSW storm water or in the Corporation storm water relative to the MBAQ receiving water. The survival NOECs were 100% storm water, resulting in 1.0 TUC for both storm water samples. For fish (Menidia beryllina) chronic toxicity tests, there were no significant reductions in fish survival or growth in the NSW storm water or in the Corporation storm water relative to the MBAQ receiving water. The survival NOECs were 100% storm water, resulting in 1.0 TUc for both storm water samples. For mysids (Americamysis bahia) acute toxicity tests, there was a significant reduction in mysid survival in the NSW storm water (45% survival in 100% runoff) relative to the control (97.5% survival). The NOECs were <100% storm water, resulting in >1.0 TUa. There were no reductions in mysid survival in the NSW receiving water, Corporation Yard storm water, and the Corporation Yard receiving water relative to control; the NOECs were 100% storm water resulting in 1.0 TUa.

Initial Study – Monterey Bay Aquarium Ocean Plan Exception July 2011
Page 59 of 78
Table II.11. MBA Stormwater Runoff and Receiving Water Toxicity Analysis
Waterbody Description
Site Description
Toxicity Test Type
Shrimp Kelp
Fish
NSW Stormwater
Near Shore Wing Chronic 1.0 TUc( 95% survival)*
1.0 Tuc (0.18mg mean biomass)*
>1.0 Tuc (92.8 mean% germination)* 1.0 Tuc (mean growth
11.6µm) *
1.0 Tuc (97.5 mean% survival)*
1.0 Tuc (0.65 mg mean biomass)*
NSW Receiving water
Near Shore Wing Chronic 1.0 Tuc (92.5 mean% survival)*
1.0 Tuc (0.20 mg mean biomass)*
>1.0 Tuc (96.8 mean% germination) *
1.0 Tuc (mean growth
17.9µm) *
1.0 Tuc( 95% survival)*
1.0 Tuc (0.72mg mean biomass)*
Corporation Stormwater
Corporation Yard Chronic 1.0 Tuc( 100% survival)*
1.0 Tuc (0.18mg mean biomass)*
1.0 Tuc (96.4 mean% germination) *
>1.0 Tuc (mean growth 12.6µm) *
1.0 Tuc (100 mean% survival)*
1.0 Tuc (0.79 mg mean biomass)*
Corporation Receiving water
Corporation Yard Chronic 1.0 Tuc (92.5 mean% survival)*
1.0 Tuc (0.20 mg mean biomass)*
1.0 Tuc (96.8 mean% germination) *
>1.0 Tuc (mean growth 17.9µm) *
1.0 Tuc ( 95% survival)*
1.0 Tuc (0.72mg mean biomass)*
NSW Stormwater
Near Shore Wing Acute >1.0 TUa(45% mean survival) **
--- ---
NSW Receiving water
Near Shore Wing Acute >1.0 TUa(97.5% mean survival) **
--- ---
Corporation Stormwater
Corporation Yard Acute 1.0 TUa(97.5% mean survival) **
--- ---
Corporation Receiving water
Corporation Yard Acute 1.0 TUa(97.5% mean survival) **
--- ---
Where no data is available (---) is used Dilution series protocol not performed in either the acute or chronic bioassays and test organisms exposed to 100% concentration only. Thus, these results may not adequately reflect accurate organism response to toxicity endpoints. Storm Water Chemical Constituents Samples were collected for MBAQ storm water runoff and analyzed for metals in storm water. Results provided in the MBAQ exception application are provided in Table II.12.

Initial Study – Monterey Bay Aquarium Ocean Plan Exception July 2011
Page 60 of 78
Table II.12. MBA Stormwater Runoff and Ocean Receiving Water Metals Analysis 2006
Chemical μg/L
Ocean Plan 6- month median (Instantaneous
Maximum)
Corporation Yard Storm Water
MBA Ocean Receiving Water
MBA Ocean Reference
Water
NSW Roof Drain
Sample Date 2/27/06 3/6/06 2/27/06 3/6/06 2/27/06 3/6/06 3/6/06 Arsenic 8.0 (80) 12.6 4.19 1.16 1.23 1.23 --- 1.43 Cadmium 1.0 (10) ND ND 0.019 0.033 0.026 --- 0.76 Chromium (III) 1.97 0.81 0.39 0.37 0.36 --- 0.18 Chromium - hexavalent
2.0 (20) 5.5 ND ND ND ND --- ---
Copper 3.0 (30) 59.7 33.3 0.535 0.27 0.17 --- 29.7 Lead 2.0 (20) 2.63 4.62 0.067 0.26 0.005 --- 1.32 Mercury 0.04 (0.4) 0.02 ND 0.012 ND 0.01 --- ND Nickel 5.0 (50) 5.50 1.68 0.216 0.15 0.143 --- 0.64 Selenium 15.0 (150) 1.0 ND 0.056 0.05 0.02 --- 3.5
Silver 0.7 (7) ND ND ND 0.06 ND --- ND Zinc 20.0 (200) 209.5 149.5 2.65 1.91 1.86 --- 67.5
(---) Indicates constituent or sample site not tested. ND indicates constituent sampled but non-detected. Data source: Monterey Bay Aquarium exception application August 28, 2006. Storm water effluent and receiving water are grab samples collected on March 6, 2006. Again, it is clear that certain ASBS discharges generally contain some concentrations of waste. In addition, storm water runoff appears to be more of a concern than the waste seawater discharges. It appears that three of the samples had concentrations of ocean plan metals above the six-month median objective for the protection of marine aquatic life. The MBAQ Corporation Yard storm water runoff exceeded the ocean plan six-month objectives for the metals arsenic, hexavalent chromium, copper, lead, nickel, and zinc. The Near Shore Wing (NSW) roof drain significantly exceeded the ocean plan six-month objectives for both cooper and zinc.

Initial Study – Monterey Bay Aquarium Ocean Plan Exception July 2011
Page 61 of 78
Table II.13. MBA Stormwater Runoff and Ocean Receiving Water Analysis PAHs,TCDDs 2006
Chemical μg/L
Ocean Plan 30-
day Average*
Corp Yard Storm Drain
MBA Ocean Receiving Water
MBA Ocean Reference
Water
NSW Roof Drain
Sample Date 2/27/06 3/6/06 2/27/06 3/6/06 2/27/06 3/6/06 3/6/06 Acenaphthylene * ND ND ND ND ND --- ND Anthracene * ND 0.0024 ND ND ND --- ND 1.2-benzanthracene * ND 0.0061 ND ND ND --- ND 3,4-benzofluoranthene * ND 0.0060 ND ND ND --- ND Benzo[k]fluoranthene * ND 0.0059 ND ND ND --- ND 1.12-benzoperylene * ND 0.0065 ND ND ND --- ND Benzo[a]pyrene * ND 0.0056 ND ND ND --- ND Chrysene * 0.010 0.0098 ND ND ND --- ND Dibenzo[ah]anthracene * ND ND ND ND ND --- ND Fluorene * ND ND ND ND ND --- ND Indeno[1,2,3-cd]pyrene * ND ND ND ND ND --- ND Phenanthrene * 0.018 0.0102 ND ND ND --- 0.0024 Pyrene * 0.019 0.0137 ND ND ND --- 0.0017 Total PAHs 0.0088 0.0473 0.0662 ND ND ND --- 0.0041 1,2,3,4,6,7,8-HpCDD ** 6.07x10⁻⁶
*** 2.16x10
-5 9.20x10
-5*** 1.91x10
-6 ND --- ND
OCDD ** 3.33x10-
5*** 1.45x10
-4 6.81x10
-5 1.61x10
-5*** ND --- 2.83x10
-
5***
1,2,3,4,6,7,8,9-HpCDF ** ND 5.19x10-
6***
5.07x10⁻⁶***
ND ND --- 1.28x10-
6***
OCDF ** --- 9.47x10⁻⁶***
--- 2.85x10⁻⁶
ND --- 2.01x10-
6***
1,2,3,4,6,7,8 HxCDF ** --- 7.26x10⁻⁷***
--- ND ND --- ND
1,2,3,4,6,7,8 HxCDD ** --- 3.44x10⁻⁶***
--- ND ND --- ND
Total TCDDs 3.9x10⁻⁹ 9.40x10⁻⁸ 8.39x10⁻⁷
2.11x10⁻⁷
3.81x10⁻⁸
ND --- 4.31x10⁻⁸
(---) Indicates constituent or sample site not tested. ND indicates constituent sampled but non-detected. Data source: Monterey Bay Aquarium exception application August 28, 2006. Stormwater and receiving water samples were collected on February 27, 2006 and March 6, 2006. Stormwater samples were tested at the 100% concentration only. Where no data is available (---) is used. *Polynuclear aromatic hydrocarbons (PAHs) shall mean the sum of acenaphthylene, anthracene, 1.2-benzanthracene, 3,4-benzofluoranthene, benzo[k]fluoranthene, 1.12-benzoperylene, bezno[a]pyrene, chrysene, debenzo[ah]anthracene, fluorene, indeno[1,2,3-cd]pyrene, phenanthrene and pyrene (California Ocean Plan 2005). **TCDD Equivalents shall mean the sum of the concentrations of chlorinated dibenzodioxins (2,3,7,8-CDDs) and chlorinated debenzofurans (2,3,7,8-CDFs) multiplied by their respective toxicity factors (Ocean Plan 2005). ***TCDD amount detected was below the calibration limit of the analytical instrument. Water samples were taken and analyzed for the corporation yard storm drain on 2/27/06 and 3/6/06. The Total PAHs were 0.0473 μg/L and 0.0662 μg/L respectively, which exceed the Ocean Plan objective of 0.0088 μg/L. TCDD concentrations were 9.40 x 10⁻⁸ and 8.39 x 10⁻⁷ μg/L, which exceed the Ocean Plan objective of 3.9 x 10⁻⁹ μg/L. Water samples were taken and analyzed for ocean receiving water on 3/6/06 for total PAHs, and none were detected. Total TCDDs concentrations for ocean receiving water were also tested on 2/27/06 and 3/6/06 resulting in 2.11 x 10⁻⁷ μg/L and 3.81 x 10⁻⁸ μg/L respectively, which exceed the ocean objective 3.9 x 10⁻⁹ μg/L. Water samples at a reference site were taken on 2/27/06 and analyzed for total PAHs and total TCDDs, both of which were not detected. Runoff from the NSW roof drain were sampled on

Initial Study – Monterey Bay Aquarium Ocean Plan Exception July 2011
Page 62 of 78
3/6/06 and analyzed for total PAHs and TCDDs. The PAHs concentration was 0.0041 μg/L, which is complies with the ocean plan objective of 0.0088 μg/L. The Total TCDD concentration was 4.31 x 10⁻⁸ μg/L, which exceeds the ocean objective of 3.9 x 10⁻⁹
μg/L. Mussel Watch Bioaccumulation Statewide mussel watch monitoring is an important tool in assessing bioaccumulation and water quality. Information from the National Ocean and Atmospheric Administration (NOAA) National Status and Trends (NS&T), and by the State Water Board Mussel Watch Program (SMWP) are provided below to assess spatial distributions and temporal trends in chemical contamination in or near certain ASBS. The SMWP was initiated in 1977 by the State Water Board to provide a uniform statewide approach to the detection and evaluation of toxic substances in California coastal waters, bays, harbors, and estuaries. The SMWP conducted a monitoring program using transplanted bivalve (Mytilus californianus) for trace elements and organic contaminants. The tissue samples were analyzed for the presence of trace elements and legacy pesticides. The Pacific Grove sample location is at Lovers Point, approximately 1 mile from the MBA ocean discharge. There is a major stormwater outfall at Lovers Point and several other stormwater discharges into the ASBS between MBA and this location. An Elevated Data Level (EDL) is defined for the purposes of the SMWP as that concentration of a toxic substance in mussels or clams that equals or exceeds a specified percentile (such as 85 or 95 percent) of all measurements of the toxic substance in the same species and exposure condition (resident or transplant). The available data for trace elements and organic constituents from 2001 to 2005 were reviewed and compared to the EDL 85 and EDL 95. Most trace elements were present at low concentration in the ASBS, and none of the elements exceeded the EDL 85 or EDL 95 in transplanted mussels in the ASBS during 2001-2005 sampling periods. However certain synthetic chlorinated hydrocarbon compounds were elevated. Pesticide compounds including cis-chlordane, trans-chlordane, total chlordane, heptachlor epoxide, and dieldrine exceeded the EDL 85 in the Pacific Grove ASBS. The Pacific Grove ASBS also shows exceedances of the EDL 95 for DDD, DDE, and PCB 1254. To characterize the spatial distributions and trends in contaminant levels in the coastal ocean, NOAA NS&T Program was formed in 1986. The NOAA NS&T Mussel Watch Program measures the presence of concentrations of a broad suite of trace metals and organic chemicals in resident bivalves. The NS&T Mussel Watch Program is national in scale and the sampling sites are representative of a large area. The NOAA NS&T Program analyzes bivalve tissue samples from the mussels M. edulis and M. californianus for trace metals, synthetic organic constituents, and histopathology. The NOAA NS&T sampling is conducted every two years. The Pacific Grove ASBS has been sampled since 1986.

Initial Study – Monterey Bay Aquarium Ocean Plan Exception July 2011
Page 63 of 78
Between 1986 and 2010, 18 constituents (Total Butyltins, Total Chlordanes, Total DDTs, Total Dieldrins, Total PAHs, Total PCBs, Zinc, Selenium, Tin, Ag, Al, As, Cd, Cr, Cu, Hg, Ni and Pb) were analyzed in Pacific Grove Lovers Point. Of these, two had very limited data (n=6) over only a short period (1986-1993) and were not graphed. Graphs for the other 16 constituents are provided in Appendix D with linear regression trend lines and R2 values provided. Most trace metals are either staying the same or showing decreases in mussel tissues. Arsenic concentrations show a significant decrease at the Pacific Grove ASBS. However, cadmium concentrations are increasing at the Pacific Grove ASBS (Figure II.1). Figure II.1. Mussel Watch Trends for Arsenic and Cadmium
Trend of Arsenic Concentration at Pacific Grove Lovers Point
y = -0.2422x + 497.38 R 2 = 0.3623
0
5
10
15
20
25
1980 1985 1990 1995 2000 2005 2010
Year
Concentration (ug/g dryweight)
Arsenic
Trend of Cadmium Concentration at Pacific Grove Lovers Point
y = 0.2667x - 525.66
R 2 = 0.2688
0 2 4 6 8
10 12 14
1980 1985 1990 1995 2000 2005 2010
Year
Concentration (ug/g dryweight)
Cadmium

Initial Study – Monterey Bay Aquarium Ocean Plan Exception July 2011
Page 64 of 78
Staff Summary of Water Quality Waste seawater does contain waste at very low levels. However, most waste seawater meets Ocean Plan objectives. The only exceptions noted were copper in one seawater sample (N=3) and Residual Chlorine which the analytical Lab recognized as “problematic” due to interferences by bromine. None of the seawater samples exhibited toxicity effects. The stormwater also contains waste and certain analyses exceeded Ocean Plan standards. Receiving water quality is generally good and supportive of marine life. During storms there appears to be an increase in certain storm water constituents (copper, lead and zinc) in the receiving water, but all metal constituents meet the standards. Given the status of the receiving waters there is ample evidence to support an Ocean Plan exception for waste seawater and storm water discharges, but only if such discharges are properly controlled to maintain natural water quality in ASBS. The adoption of Special Protections will improve conditions by reducing wastes in discharges, with the goal of protecting natural water quality in ASBS. In addition, discharges and receiving water must be adequately monitored to insure compliance with the Special Protections, based on the range of natural water quality conditions at approved reference stations. The following mitigating conditions will be required for the exception in relation to waste seawater:
Seawater System
The discharge must comply with all other applicable provisions, including water quality standards, of the Ocean Plan. Natural water quality conditions in the receiving water must not be altered as a result of the discharge(s) and marine communities must be protected from pollution. Natural Ocean Water Quality will be determined by a comparison to the range of constituent concentrations in reference areas agreed upon via the regional monitoring program{s) or in the absence of a central coast regional monitoring program by the State Water Board in consultation with the Regional Water Board.
MBAQ will not discharge chemical additives, including antibiotics, in the seawater discharge system effluent. In addition and at a minimum, MBAQ, for its seawater effluent, must comply with effluent limits implementing Table B water quality objectives as required in Section III.C. of the Ocean Plan. MBAQ must pursue and implement a program for prevention of Biological Pollutants (non-native invasive species) in consultation with the California Department of Fish and Game Marine Resources Division.

Initial Study – Monterey Bay Aquarium Ocean Plan Exception July 2011
Page 65 of 78
Butyltin Study A butyltin study must be performed during the first year of the permit cycle for water, sediment and marine life in the Monterey Boat Yard vicinity. The marine life bioaccumulation study may use crabs or mussels as the target species. Collaboration between HMS, Monterey Bay Aquarium and the City of Pacific Grove is encouraged as a collaborative approach for these studies. Waste Seawater Effluent Monitoring Flows for the seawater discharge system discharging near the ASBS must be measured monthly and reported quarterly to the Regional Water Board. During the first year of each permit cycle, quarterly effluent samples must be collected from the waste seawater discharge. These samples must be analyzed for Ocean Plan Table A constituents (except oil and grease), Ammonia N, Biochemical Oxygen Demand, salinity, and temperature. Total residual chlorine (TRC) should also be monitored and meet Table B effluent limits. Once annually, one of the effluent samples collected from the waste seawater discharge must be analyzed additionally for Ocean Plan Table B constituents (for marine life, except acute toxicity). Based on the results from the first year the Regional Water Board staff will determine the Table B constituents to be tested annually during the remainder of the permit cycle, except that ammonia nitrogen and chronic toxicity for at least one consistent invertebrate or algal species must be tested at least annually for the waste seawater effluent.
Receiving Water Monitoring At least once per a permit cycle the receiving water adjacent to the seawater discharge system and storm water discharges must be sampled 24 hours prior to a storm event. Post storm receiving water adjacent to the seawater discharge system and storm water discharges must also be monitored at every time the effluent is sampled and analyzed for the same constituents as annual waste seawater samples and storm water samples. The sample location for the receiving water will be in the surf zone immediately adjacent to the outfall location where effluent is sampled. Optionally, specifically for storm runoff receiving water samples, samples may be composited. For receiving water monitoring, alternatively, this requirement may be met by participation in a regional monitoring program approved by State Water Board staff. Reference Site Monitoring Reference samples must also be monitored at the same time as the effluent samples and analyzed for the same constituents as annual waste seawater samples and

Initial Study – Monterey Bay Aquarium Ocean Plan Exception July 2011
Page 66 of 78
storm water samples. Reference samples must be collected in the ocean at a station determined via a regional monitoring program, or, in the absence of such program, by State Water Board staff. Samples at the reference station during wet weather may be collected immediately following a storm event, but in no case more than 24 hours after, if sampling conditions are unsafe during the storm. Wet weather reference samples must be collected at the point where runoff from a reference watershed enters the ocean in the surf zone. Alternatively this requirement may be met by participation in a regional monitoring program approved by State Water Board staff.
The following mitigating conditions will be required for the exception in relation to non-storm runoff and storm water management plans:
Dry Weather Flows
MBAQ must continue to prevent all discharges of non-storm water facility runoff (i.e.,
any discharge of facility runoff that reaches the ocean that is not composed entirely of storm water), except those associated with the operation and maintenance of the seawater system, and emergency fire fighting.
MBAQ must specifically address the prohibition of non-storm water runoff and the reduction of pollutants in storm water discharges draining to the ASBS in a Storm Water Management Plan/Program (SWMP). The SWMP must describe the measures by which non-storm water discharges have been eliminated, how these measures will be maintained over time, and how these measures are monitored and documented.
Storm Water Runoff
The SWMP must also address storm water discharges, and how pollutants have been and will be reduced in storm water runoff into the ASBS through the implementation of BMPs. The SWMP must describe the BMPs currently employed and BMPs planned (including those for construction activities), with an implementation schedule. Discharges must be free of trash, petroleum products and pesticides. The BMPs and implementation schedule must be designed to ensure natural water quality conditions in the receiving water due to either a reduction in flows from impervious surfaces or reduction in pollutants (with Table B Instantaneous Maximum objectives measured in the effluent as target levels), or some combination thereof. The implementation schedule must be developed to ensure that the BMPs are implemented within one year of the approval date of the SWMP by the Regional Water Board.

Initial Study – Monterey Bay Aquarium Ocean Plan Exception July 2011
Page 67 of 78
The SWMP must include a map of surface drainage of storm water runoff, including areas of sheet runoff, and any structural Best Management Practices employed The map must also show the storm water conveyances in relation to other facility features such as the laboratory seawater system and discharges, service areas, sewage treatment, and waste and hazardous materials storage areas. The SWMP must also include a procedure for updating the map and plan when other changes are made to the facilities.
If the results of receiving water monitoring indicate that the storm water runoff is causing or contributing to an alteration of natural water quality in the ASBS, as measured at the reference station(s), MBA is required to submit a report to the Regional Water Board within 30 days of receiving the results. Those constituents in storm water that alter natural water quality or Ocean Plan receiving water objectives must be identified in that report. The report must describe BMPs that are currently being implemented, BMPs that are planned for in the SWMP, and additional BMPs that may be added to the SWMP. The report shall include a new or modified implementation schedule. The Regional Water Board staff may require modifications to the report. Within 30 days following approval of the report by the Regional Water Board staff, MBA must revise its SWMP to incorporate any new or modified BMPs that have been and will be implemented, the implementation schedule, and any additional monitoring required. As long as MBA has complied with the procedures described above and is implementing the revised SWMP, then MBA does not have to repeat the same procedure for continuing or recurring exceedances of the same constituent. Storm Water Runoff Monitoring Flows for storm water runoff (by storm event) must be measured (or estimated) monthly and reported annually to the Regional Water Board. The Hovden Way storm water outfall is a large storm drain carrying co-mingled flows with the City of Monterey and must be monitored. Monitoring of this storm drain in collaboration with the City of Monterey is encouraged, alternatively, MBA may elect to sample their storm water effluent at the confluence prior to co-mingling with the City of Monterey. Once annually, during wet weather (storm event), the storm water runoff effluent must be sampled and analyzed from each storm drain for all Ocean Plan Table A constituents, and indicator bacteria. Sampling small storm drains on a rotating basis or composite basis may be used, and must include all drains throughout MBA even if outside ASBS boundary due to their proximity. Once every permit cycle, during wet weather (storm event) on a rotating basis among discharge points, the storm water runoff effluent must be sampled and analyzed additionally for Table B constituents (for marine aquatic life except acute toxicity), PAHs, pyrethroids, and OP Pesticides.

Initial Study – Monterey Bay Aquarium Ocean Plan Exception July 2011
Page 68 of 78
The Regional Water Board may, at its discretion, after receiving and analyzing the required water quality monitoring data, choose to reduce and/or eliminate certain monitoring requirements for constituents that routinely are found in concentrations below Ocean Plan objectives. Receiving Water Monitoring At least once per a permit cycle the receiving water adjacent to the seawater discharge system and storm water discharges must be sampled 24 hours prior to a storm event. The receiving water adjacent to the seawater discharge system and storm water discharges must also be monitored during or immediately after a storm (wet weather). Receiving water samples must be collected when annual waste seawater effluent and storm water effluent is sampled, and analyzed for the same constituents as the waste seawater samples and storm water samples. Wet weather samples in the receiving water may be collected immediately following a storm event, but in no case more than 24 hours after, if sampling conditions are unsafe during the storm. The sample location for the receiving water will be in the surf zone immediately adjacent to the outfall location where effluent is sampled. Optionally, specifically for storm runoff receiving water samples, samples may be composited. For receiving water monitoring, alternatively, this requirement may be met by participation in a regional monitoring program approved by State Water Board staff. Reference Site Monitoring Reference samples must also be monitored at the same time as the effluent samples and analyzed for the same constituents as annual waste seawater samples and storm water samples. Reference samples must be collected in the ocean at a station determined via a regional monitoring program, or, in the absence of such program, by State Water Board staff. Samples at the reference station during wet weather may be collected immediately following a storm event, but in no case more than 24 hours after, if sampling conditions are unsafe during the storm. Wet weather reference samples must be collected at the point where runoff from a reference watershed enters the ocean in the surf zone. Alternatively this requirement may be met by participation in a regional monitoring program approved by State Water Board staff.
The following mitigating conditions will be required for the exception in relation to waterfront and construction:
Waterfront Management Plan
MBAQ must prepare a waterfront and marine operations non-point source management plan containing appropriate management practices to address non-

Initial Study – Monterey Bay Aquarium Ocean Plan Exception July 2011
Page 69 of 78
point source pollutant discharges. Appropriate management measures will include those described in the State’s Non-point Source Program Implementation Plan for marinas and recreational boating, as applicable. The Regional Water Board, in consultation with the State Water Board's Division of Water Quality, will review the plan. The Regional Water Board shall appropriately regulate non-point source discharges in accordance with the State Water Board's Policy for Implementation and Enforcement of the Non-point Source Pollution Control Program. The plan must be implemented within six months of its approval.
Construction Activity Potentially Affecting the ASBS MBAQ will notify the Regional Water Board within 180 days prior to any construction activity that could result in any discharge or habitat modification in the ASBS. Furthermore MBAQ must receive approval and appropriate conditions from the Regional Water Board prior to performing any significant modification, re-building or renovation of the facilities within the ASBS, per the requirements of Section III.E.2 of the Ocean Plan.
The following mitigating conditions will be required for the exception in relation to water quality in general:
Rocky Intertidal Marine Life Survey
At least once every permit cycle (every five years), a quantitative survey of rocky intertidal marine life must be performed near the discharge and at a reference site. The Regional Water Board staff, in consultation with the State Water Board’s Division of Water Quality staff, must approve the survey design. The results of the survey must be completed and submitted to the Regional Water Board at least six months prior to permit expiration. Alternatively this requirement may be met by participation in a regional monitoring program approved by the State Water Board staff. Bioaccumulation Study
Once during the upcoming permit cycle, a bioaccumulation study using California mussels (Mytilus californianus) must be conducted to determine the concentrations of metals near the discharge and at a reference site. The Regional Water Board staff, in consultation with the State Water Board’s Division of Water Quality staff, is to approve the study design. The results of the survey must be completed and submitted to the Regional Water Board at least six months prior to the permit expiration. Based on the study results, the Regional Water Board staff, in consultation with the Division of Water Quality staff, may adjust the study design in subsequent permits, or add additional test organisms. Alternatively this requirement may be met by participation in a regional monitoring program approved by the State Water Board staff.

Initial Study – Monterey Bay Aquarium Ocean Plan Exception July 2011
Page 70 of 78
Sediment Study Once annually, the subtidal sediment near the discharge and at a reference site must be sampled and analyzed for Ocean Plan Table B constituents. For sediment toxicity testing, only an acute toxicity test using the amphipod Eohaustorius estuarius must be performed. Based on the first year sample results the Regional Water Board staff will determine specific constituents to be tested during the remainder of each permit cycle, except that acute toxicity for sediment must be tested annually. The Regional Board may subsequently alter this requirement once beneficial uses are shown to be protected. If initial results show no impact, than sediment toxicity study may be changed to once per permit cycle. Alternatively this requirement may be met by participation in a regional monitoring program approved by the State Water Board staff.
Metals Analysis
For metals analysis, storm water effluent, reference samples, and receiving water samples must be analyzed by the approved analytical method with the lowest minimum detection limits (currently Inductively Coupled Plasma/ Mass Spectrometry) described in the Ocean Plan.
If monitoring information indicates that natural ocean water quality is not maintained, but there is sufficient evidence that a discharge is not contributing to the alteration of natural water quality, then Regional Water Board staff may make that determination. In this case, sufficient information must include runoff and seawater system effluent sample data that has equal or lower concentrations for the range of constituents at the applicable reference area(s).
Biological Pollutants (Invasive Species) Any marine organism not indigenous to Monterey Bay that may possibly be introduced through the laboratory or aquarium discharges is considered a biological pollutant. Currently available information (California Department of Fish and Game (DFG) 2005) indicates that there are no invasive species that would be associated with a possible introduction from the MBAQ discharges. Still, the potential for such introductions of potentially invasive species or pathogenic organisms does exist, and such accidental introductions could alter the marine community in an undesirable way. Examples of marine invasive species potentially found in Monterey Bay include, but may not be limited to: Caulerpa taxifolia, a Mediterranean Sea green algae; Terebrasabella heterouncinata, a South African parasitic polychaete worm which parasitizes marine mollusks such as abalone; Potamocorbula amurenis, an Asian clam that is a highly efficient filter feeder; and Carcinus maenas, the European Green crab, a voracious predator on native invertebrates (CDFG 2005). Sargassum muticans, an invasive brown algae, is found in Morro Bay and San Francisco Bay and is ubiquitous throughout

Initial Study – Monterey Bay Aquarium Ocean Plan Exception July 2011
Page 71 of 78
the Southern California Bight. Another exotic brown algae (Undaria pinnatifida) has been found in Monterey Harbor. Invasive species in the marine environment generally ‘arrive’ to a location by one of these methods: 1) they are discharged as part of the ballast water from a docked or passing ship; 2) they are inadvertently released; 3) they come in as a ‘stowaway’ on another species; or 4) they are deliberately released (CDFG 2001). The pathways that are most applicable to MBA are inadvertent releases or “stowaways” on another species. If during the biological surveys required by the exception, any of the above species or any other invasives that are not listed above are detected, MBA must notify the State Water Board and the California Department of Fish and Game (Marine Division) immediately. The following mitigating condition will be required for the exception as they relate to biological pollutants:
MBAQ must pursue and implement a program for prevention of Biological Pollutants (non-native invasive species) in consultation with the California Department of Fish and Game Marine Resources Division.
Waterfront and Marine Nonpoint Source Pollution The following mitigating conditions will be required for the exception in relation to nonpoint source pollution from the waterfront and marine operations:
Waterfront Management Plan
MBAQ must prepare a waterfront and marine operations non-point source management plan containing appropriate management practices to address non-point source pollutant discharges. Appropriate management measures will include those described in the State’s Non-point Source Program Implementation Plan for marinas and recreational boating, as applicable. The Regional Water Board, in consultation with the State Water Board's Division of Water Quality, will review the plan. The Regional Water Board shall appropriately regulate non-point source discharges in accordance with the State Water Board's Policy for Implementation and Enforcement of the Non-point Source Pollution Control Program. The plan must be implemented within six months of its approval.
10. LAND USE AND PLANNING. Would the project:
Issues (and Supporting Information Sources):
Potentially Significant
Impact
Less Than Significant
With Mitigation
Incorporated
Less Than Significant
Impact
No
Impact
a) Physically divide an established community?

Initial Study – Monterey Bay Aquarium Ocean Plan Exception July 2011
Page 72 of 78
b) Conflict with any applicable land use plan, policy, or regulation of an agency with jurisdiction over the project (including, but not limited to, the general plan, specific plan, local coastal program, or zoning ordinance) adopted for the purpose of avoiding or mitigating an environmental effect?
c) Conflict with any applicable habitat conservation plan or natural community conservation plan?
11. MINERAL RESOURCES. Would the project:
Issues (and Supporting Information Sources):
Potentially Significant
Impact
Less Than Significant
With Mitigation
Incorporated
Less Than Significant
Impact
No
Impact
a) Result in the loss of availability of a known mineral resource that would be of future value to the region and the residents of the State?
b) Result in the loss of availability of a locally-important mineral resource recovery site delineated on a local general plan, specific plan, or other land use plan?
12. NOISE. Would the project result in:
Issues (and Supporting Information Sources):
Potentially Significant
Impact
Less Than Significant
With Mitigation
Incorporated
Less Than Significant
Impact
No
Impact
a) Exposure of persons to, or generation of, noise levels in excess of standards established in the local general plan or noise ordinance, or applicable standards of other agencies?
b) Exposure of persons to, or generation of, excessive groundborne vibration or groundborne noise levels?
c) A substantial permanent increase in ambient noise levels in the project vicinity above levels existing without the project?
d) A substantial temporary or periodic increase in ambient noise levels in the project vicinity above levels existing without the project?
e) For a project located within an airport land use plan or, where such a plan has not been adopted, within two miles of a public airport or public use airport, would the project expose people residing in or working in the project area to excessive noise levels?
f) For a project within the vicinity of a private airstrip, would the project expose people residing in or working in the project area to excessive noise levels?
POPULATION AND HOUSING. Would the project:
Issues (and Supporting Information Sources):
Potentially Significant
Impact
Less Than Significant
With Mitigation
Incorporated
Less Than Significant
Impact
No
Impact

Initial Study – Monterey Bay Aquarium Ocean Plan Exception July 2011
Page 73 of 78
a) Induce substantial population growth in an area either directly (e.g., by proposing new homes and businesses) or indirectly (e.g., through extension of roads or other infrastructure)?
b) Displace substantial numbers of existing housing, necessitating the construction of replacement housing elsewhere?
c) Displace substantial numbers of people, necessitating the construction of replacement housing elsewhere?
13. PUBLIC SERVICES. Would the project result in substantial adverse physical impacts associated with
the provision of new or physically altered governmental facilities, the construction of which could cause significant environmental impacts, in order to maintain acceptable service rations, response times or other performance objectives for any of the public services:
Issues (and Supporting Information Sources):
Potentially Significant
Impact
Less Than Significant
With Mitigation
Incorporated
Less Than Significant
Impact
No
Impact
a) Fire protection?
b) Police protection?
c) Schools?
d) Parks?
e) Other public facilities? 14. RECREATION. Would the project:
Issues (and Supporting Information Sources):
Potentially Significant
Impact
Less Than Significant
With Mitigation
Incorporated
Less Than Significant
Impact
No
Impact
a) Increase the use of existing neighborhood and regional parks or other recreational facilities such that substantial physical deterioration of the facility would occur or be accelerated?
b) Include recreational facilities or require the construction or expansion of recreational facilities that might have an adverse physical effect on the environment?

Initial Study – Monterey Bay Aquarium Ocean Plan Exception July 2011
Page 74 of 78
15. TRANSPORTATION / TRAFFIC. Would the project:
Issues (and Supporting Information Sources):
Potentially Significant
Impact
Less Than Significant
With Mitigation
Incorporated
Less Than Significant
Impact
No
Impact
a) Exceed the capacity of the existing circulation system, based on an applicable measure of effectiveness (as designated in a general plan policy, ordinance, etc.), taking into account all relevant components of the circulation system, including but not limited to intersections, streets, highways and freeways, pedestrian and bicycle paths, and mass transit?
b) Conflict with an applicable congestion management program, including, but not limited to level of service standards and travel demand measures, or other standards established by the county congestion management agency for designated roads or highways?
c) Result in a change in air traffic patterns, including either an increase in traffic levels or a change in location that results in substantial safety risks?
d) Substantially increase hazards due to a design feature (e.g., sharp curves or dangerous intersections) or incompatible uses (e.g., farm equipment)?
e) Result in inadequate emergency access?
f) Conflict with adopted policies, plans, or programs supporting alternative transportation (e.g., bus turnouts, bicycle racks)?
16. UTILITIES AND SERVICE SYSTEMS. Would the project:
Issues (and Supporting Information Sources):
Potentially Significant
Impact
Less Than Significant
With Mitigation
Incorporated
Less Than Significant
Impact
No
Impact
a) Exceed wastewater treatment requirements of the applicable Regional Water Quality Control Board?
b) Require or result in the construction of new water or wastewater treatment facilities or expansion of existing facilities, the construction of which could cause significant environmental impacts?
c) Require or result in the construction of new storm water drainage facilities or expansion of existing facilities, the construction of which could cause significant environmental impacts?
d) Have sufficient water supplies available to serve the project from existing entitlements and resources, or are new or expanded entitlements needed?
e) Result in a determination by the wastewater treatment provider that serves or may serve the project that it has adequate capacity to serve the project’s projected demand in addition to the provider’s existing commitments?
f) Be served by a landfill with sufficient permitted capacity to accommodate the project’s solid waste disposal needs?

Initial Study – Monterey Bay Aquarium Ocean Plan Exception July 2011
Page 75 of 78
g) Comply with federal, state, and local statutes and regulations related to solid waste?
17. MANDATORY FINDINGS OF SIGNIFICANCE.
Issues (and Supporting Information Sources):
Potentially Significant
Impact
Less Than Significant
With Mitigation
Incorporated
Less Than Significant
Impact
No
Impact
a) Does the project have the potential to degrade the quality of the environment, substantially reduce the habitat of a fish or wildlife species, cause a fish or wildlife population to drop below self-sustaining levels, threaten to eliminate a plant or animal community, reduce the number or restrict the range of a rare or endangered plant or animal or eliminate important examples of the major periods of California history or prehistory?
b) Does the project have impacts that are individually limited, but cumulatively considerable? ("Cumulatively considerable" means that the incremental effects of a project are considerable when viewed in connection with the effects of past projects, the effects of other current projects, and the effects of probable future projects)
c) Does the project have environmental effects that will cause substantial adverse effects on human beings, either directly or indirectly?

MANDATORY FINDINGS OF SIGNIFICANCE Under the less stringent and somewhat inadequate controls currently in force, MBA discharges waste into the ocean adjacent to an ASBS and is in violation of the ASBS discharge prohibition. This project, granting an exception with special mitigating conditions (i.e. special protections), will allow the continued discharge of waste seawater and storm water runoff, and therefore has the potential to degrade water quality. However, under these special protections, the quality of the discharge will improve from current conditions, with an important reduction in the potential to degrade water quality. If all of the special protections designed to limit the discharge are met, as described in this Initial Study, the MBA discharge will not compromise the protection of ocean waters of the ASBS for beneficial uses, and the public interest will be served. Granting the conditional exception, likewise, will not violate federal antidegradation requirements because water quality will not be lowered, but rather will be improved. Further, allowance of the exception will not violate the State Water Board’s antidegradation policy (STATE WATER BOARD 1968) since water quality conditions will improve; the discharge will not unreasonably affect present and anticipated beneficial uses; the discharge will not result in water quality lower than that prescribed in the Ocean Plan; and, the people of California benefit from the research and education provided by MBA while beneficial uses will still be protected. DETERMINATION Based on this initial evaluation, we find that although the proposed project could have a significant effect on the environment, there will not be a significant effect in this case because mitigation measures have been incorporated into the project. A MITIGATED NEGATIVE DECLARATION will be prepared. This document was originally prepared and signed on January 18, 2011. Based on Comments received this Initial Study has been revised on July 18, 2011. No changes were made to the environmental checklist, the mandatory findings of significance, and the determination.


References Barry, I.P., C.H. Baxter, R.D. Sagarin and S.E. Gilman. Climate-Related, Long-Term Faunal Changes in
a California Rocky Intertidal Community. Science 267: 672-675. 1995. California Department of Fish and Game (DFG). 2001. California’s Living Marine Resources: A Status
Report. California Department of Fish and Game (DFG). 2005. California Natural Diversity Data Base, California State Water Resources Control Board. California Marine Waters Areas of Special Biological
Significance Reconnaissance Survey Report: Pacific Grove Marine Garden Fish Refuge and Hopkins Marine Life Refuge Monterey County, Report No. 79-11. 1979
California State Water Resources Control Board. State Mussel Watch Program.
www.waterboards.ca.gov/programs/smw. 2000. California State Water Resources Control Board. Resolution 2000-18: California Ocean Plan-water
quality control plan for ocean waters of California. 2001. California State Water Resources Control Board. Resolution No. 68-16. Statement of Policy with Respect
to Maintaining high Quality of Waters in California. 1968. California State Water Resources Control Board. Resolution No. 74-28: Designating Areas of Special
Biological Significance and authorizing notification of the Regional Water Quality Control Boards and the Environmental Protection Agency. 1974.
California State Water Resources Control Board. Resolution No.83-87: Water Quality Control Plan for
Ocean Waters of California. 1983. Hopkins Marine Station Exception Application 2006. Hopkins Marine Station Exception Application Supplement April 8, 2008 NOAA National Marine Fisheries Service Office of Protected Resources 2005. Phillips, Roger. Monterey Bay Aquarium Exception Application. August 29, 2006. Public Resource Code. Assembly Bill 2800: Chapter 385, Statutes of 2000. The Marine Managed Areas
Improvement Act. Effective September 8, 2000. Public Resource Code. Senate Bill 512: Chapter 854, Statutes of 2004. Amendment of The Marine
Managed Areas Improvement Act. Effective January 1, 2005. Public Resource Code. Senate Bill 512: Section 36710(f). Effective January 1, 2005. Raimondi, P. Evaluation of ASBS Assessments in Rocky Intertidal Communities for the State Water
Board. March 6, 2009 Schiel et al. “Ten Years of Induced Ocean Warming Causes Comprehensive Changes in Marine Benthic
Communities” Ecology, 85(7), 2004, pp. 1833–1839 Southern California Coastal Water Research Project. Final Report: Discharges into State Water Quality
Protection Areas. 2003. Tenera. A Comparative Intertidal Study and User Survey, Point Pinos, California. July 2000